Article

Phenology and Population Differentiation in Reproductive Plasticity in Feathertop Rhodes Grass (Chloris virgata Sw.)

1
Southern Cropping System Unit, NSW Department of Primary Industries, Wagga Wagga Agricultural Research Institute, Pine Gully Road, Wagga Wagga, NSW 2650, Australia
2
Weed Research Unit, NSW Department of Primary Industries, Wagga Wagga Agricultural Research Institute, Pine Gully Road, Wagga Wagga, NSW 2650, Australia
*
Author to whom correspondence should be addressed.
Agronomy 2022, 12(3), 736; https://doi.org/10.3390/agronomy12030736
Submission received: 11 February 2022 / Revised: 11 March 2022 / Accepted: 16 March 2022 / Published: 18 March 2022
(This article belongs to the Special Issue Pests, Pesticides and Food Safety in a Changing Climate)

Abstract

:
An understanding of phenology and reproductive plasticity of a weed species can provide valuable information to manage it precisely. This study evaluated the phenotypic plasticity of feathertop Rhodes grass (Chloris virgata Sw.) where cohorts of four different populations (two from cropping and two from roadside situations) were initiated in early spring (4 September), late spring (4 November), mid-summer (4 January), and early autumn (4 March) in southern New South Wales (NSW), Australia. The team grew individual plants in the absence of competition under natural conditions. Life-history and fitness-related traits of both phenology and morphology were measured, and dry biomass of vegetative and reproductive parts were determined at physiological maturity. Among the four sowing times, the late-spring sowing treatment took the longest time from emergence to the first seed head emergence (70–110 days), while it had the shortest seed maturity period (8–16 days). Length of reproductive and total life period of the four populations differed across the four sowing-time treatments. The plants that emerged in mid-summer had the longest reproductive period (30 days) whereas the early-autumn emerging plants died before the reproductive stage because of the cold temperatures during winter. The mid-summer cohort required slightly longer time (63–85 days) to achieve seed head formation and less time (19–24 days) for seed maturity than those plants that emerged in early or late spring. All the reproductive features were varied by sowing times and population. The number of seed heads (12–15 per plant) and spikelets (12–13 per seed head), as well as the seed head biomass, re-productive biomass allocation pattern, and seed production, generally increased in the mid-summer-emerged cohort. Seed production in the mid-summer (9942 seeds/plant) cohort was 10% and 70% higher than the late spring (8000 seeds/plant) and early spring (3240 seeds/plant) cohorts, respectively. The ratio of reproductive biomass to vegetative biomass increased in the mid-summer sowing times in all populations, and this species displayed true plasticity in reproductive allocation. Additionally, the four populations of feathertop Rhodes grass differed significantly in phenological, vegetative, and reproductive traits, depending on the sowing time. The reproductive fitness of the four populations varied, with the two roadside populations (FELT 04/20 and STURT/16–17) appearing to be better adapted than the two cropping populations (PARK 01/20 and GLEN 03/18). The results from our study could help construct a basic framework for a variety of weed-management tactics to achieve successful control.

1. Introduction

Plant phenology is the periodic observation of recurring phenomena of plant growth and recording the time of their occurrence [1]. This phenomenon of a plant is mediated by the interaction of internal factors with external environmental elements such as temperature, daylength, or drought [2]. Weed phenological features include the timing of emergence, growth, and sexual reproduction and can be used to predict the distribution of a weed species under varying environmental conditions [3,4]. Phenological studies of a weed species may be employed for tracking the gradual impact of climate change on biodiversity and its effect on the key phenological events in the lifecycle [5]. These phenological events are important for the survival and success of a weed species [6,7]. Therefore, a biologically meaningful description of phenological events is fundamental for better understanding of the temporal dynamics of a weed species [8,9]. This would contribute to the well-informed recommendation of suitable timing for effective control [8,9]. Properly timed control with suitable tactics would achieve maximum control efficacy, reducing both the cost of managing weeds and the risks of new infestations into other areas. Plant plasticity is the variation in the phenotypic expression of a genotype and enhances the capacity of plants to survive and reproduce under stressful conditions [10]. It is considered an adaptive mechanism that allows plants to optimise responses to environmental heterogenicity [10,11]. Furthermore, plants’ capacity to generate alternative phenotypes based on shifts in the environmental conditions can buffer the effects of natural selection [12]. The plastic response of weeds to environmental changes have become one of the most important aspects for evolutionary biology research on weeds, which was enhanced by climate change concerns [13]. Unfortunately, relatively little is known about the nature of plasticity of weeds and their associated traits that contribute directly to fitness and adaptability.
Early studies of weed phenology and phenotypic plasticity were limited to simple descriptions of morphological characteristics such as plant size and branch number [10,14]. Comparative information is needed to clarify the relations of ecological scope to patterns of fitness plasticity, particularly for annual weed species that are often the most troublesome in agricultural production systems. Annual weed species can frequently germinate early in the growing season and continue to germinate throughout the season, enabling them to maximise seed production and fitness across a broad range of environmental conditions [15]. However, weed cohorts that germinate at different times are also faced with variable biotic and abiotic conditions. Therefore, the timing of phenological events and biomass allocation to different plant components affect the overall success in a particular environment [16]. This response could be different among weed populations because of genetic variation among populations and variable selection pressures imposed by agricultural practices. Moreover, weed phenological studies from a single sowing time is useful to summarise key features and changes in phenology, but they inevitably miss potentially important information about the shape of the overall period [17]. A more thorough assessment should aim to model the entire phenological time distribution [17]. Therefore, evaluation of the phenotypic response of diverse weed populations to different environmental heterogenicity is important to assess both adaptive (present interaction with new environment) and adapted (natural selection from past generation) responses.
Feathertop Rhodes grass (Chloris virgata Sw.) is an annual warm-season grass that is widely distributed globally [18]. Generally, this species grows throughout tropical, subtropical, and warm temperate regions, extending well into temperate regions in areas where hot summers are typical [18]. In Australia, feathertop Rhodes grass has been a major weed in summer and winter grain crops in the subtropical region for many years and was ranked in the top 10 weed species [19,20,21]. In southern New South Wales (NSW), Australia, feathertop Rhodes grass mainly dominates roadsides, fence lines, and wasteland areas. Now this small-seeded species has become an issue in the cropping country of southern NSW. Given the large area of feathertop Rhodes grass’ expansion to diverse soil and climatic conditions (Figure 1), it is not surprising that feathertop Rhodes grass is very plastic. The plasticity of feathertop Rhodes grass results in the formation of a population adapted to local climatic conditions. This adaption of feathertop Rhodes grass populations to local conditions warrants attention because it is likely one of the mechanisms supporting the invasive spread of this species from northern NSW to southern NSW.
The research questions of this research were:
  • Is there any impact of different emergence dates on the growth and development timing of phenological, morphological and reproductive traits of feathertop Rhodes grass?
  • Does timing and duration of each phenological events vary among populations of feathertop Rhodes grass?

2. Materials and Methods

2.1. Environmental (Emergence Timing) and Populations Treatment

There were four sowing times: early spring (4 September 2020), late spring (4 November 2021), mid-summer (4 January 2021), and early autumn (4 March 2021). Four feathertop Rhodes grass populations from diverse geographical areas were selected to cover the phenotypic variability of this species (Table 1). Seeds of the two northern populations were collected from southern Queensland (QLD) and the two southern populations were collected from southern NSW.

2.2. Experiment Set Up and Measurements

Each sowing operation involved 400 seeds, where sowing trays (32 cm × 40 cm) were prefilled with a commercial potting mix under natural condition in a net house at the Wagga Wagga Agricultural Institute (WWAI), NSW. The emergence time was recorded before seedlings were manually transplanted at the 4–5-leaf stage into a plastic pot (18 cm in diameter) pre-filled with the potting mix. Two separate experiments were conducted. A single seedling was transplanted to a plastic pot for the first experiment and two seedlings were transplanted to a separate pot for the second experiment.
The first experiment was set up for measurements of phenological events. For each sowing time, each population was maintained one seedling/pot to measure the date of (1) emergence, (2) booting stage (when a seed head swells in the flag leaf sheath but has not yet emerged), (3) first seed head emergence, (4) first mature seed observed in each of the first five emerged seed heads from each plant, and (5) plant senescence. This data was used to calculate (1) emergence period (number of days between sowing and emergence), (2) vegetative period (number of days between emergence and booting stage), (3) seed maturity period (number of days between seed head emergence and the first mature seed formed), (4) post-reproductive period (number of days between the first mature seed and plant senescence), (5) reproductive period (number of days between the first seed head emergence and plant senescence), and (6) total life period (number of days between emergence and plant senescence). Additionally, the proportion of the total life period spent within each of these phenological time intervals was calculated.
The second experiment was set up for destructive measurements of plant biomass. There were two seedlings/pot for each population at each sowing time. Each plant at physiological maturity was carefully cut near the soil surface to obtain vegetative (leaf and stem) and reproductive biomass (seed head with seeds) separately. Prior to harvest, plant architecture (prostrate, semi-prostrate and elongated) was visually assessed from the soil surface to the apex of the plant to determine the nature of lateral spread. Then each plant was separated into stems, leaves, and reproductive biomass (including the seed head or inflorescence and seeds), bagged and dried at 70 °C for 48 h. Based on 500-seed weight, we estimated seed production per plant. Other measurements including seed head length (cm) and number of spikelets per seed head. The historic average weather data (50 years average) and monthly average weather data during experimentation 2020–2021 of WWAI is presented in Table 2 and Table 3 respectively.

2.3. Design and Data Analysis

A factorial design (4 × 4 levels of combination) with 12 replications was employed for each experiment. A mixed model with sowing time and seed weights as fixed and population as the random effect was applied to assess the differences of variables among sowing time treatments within populations (p < 0.05). Also, a multivariate (MVA) data analysis approach was employed to determine the interactions between sowing time and population for all the response variables. Dependent variables included phenological periods (vegetative period, seed maturity period, post-reproductive period, reproductive period, and total life period), fitness-related traits (vegetative biomass, seed head numbers, seed head length, number of spikelets, reproductive biomass, and seed number) and proportion of life history period (vegetative period, seed maturity period, and post-reproductive period). The reproductive period was regressed with the total life period using linear functions. The number of seed heads, seed head length, reproductive mass was regressed with the reproductive period using linear regression models. Within a population at each sowing time, reproductive effort is quantified as the slope of the relationship between reproductive biomass per plant and vegetative biomass per plant. In doing so, we assumed that reproductive biomass was primarily determined by vegetative biomass. Heterogeneity in slope value among sowing time treatments was assessed by sowing time and vegetative biomass interaction term. A significant interaction term indicates heterogeneity of the (unequal) slope in the relationship between reproductive biomass and vegetative biomass, which means that the relative impact of vegetative biomass on reproductive biomass differs among sowing time treatments. Therefore, there is true plasticity in reproductive effort [22]. The additive main effects and multiplicative interaction (AMMI) biplot was used (P × E) to visually represent population performances and environmental interactions on weed seed production.

3. Results

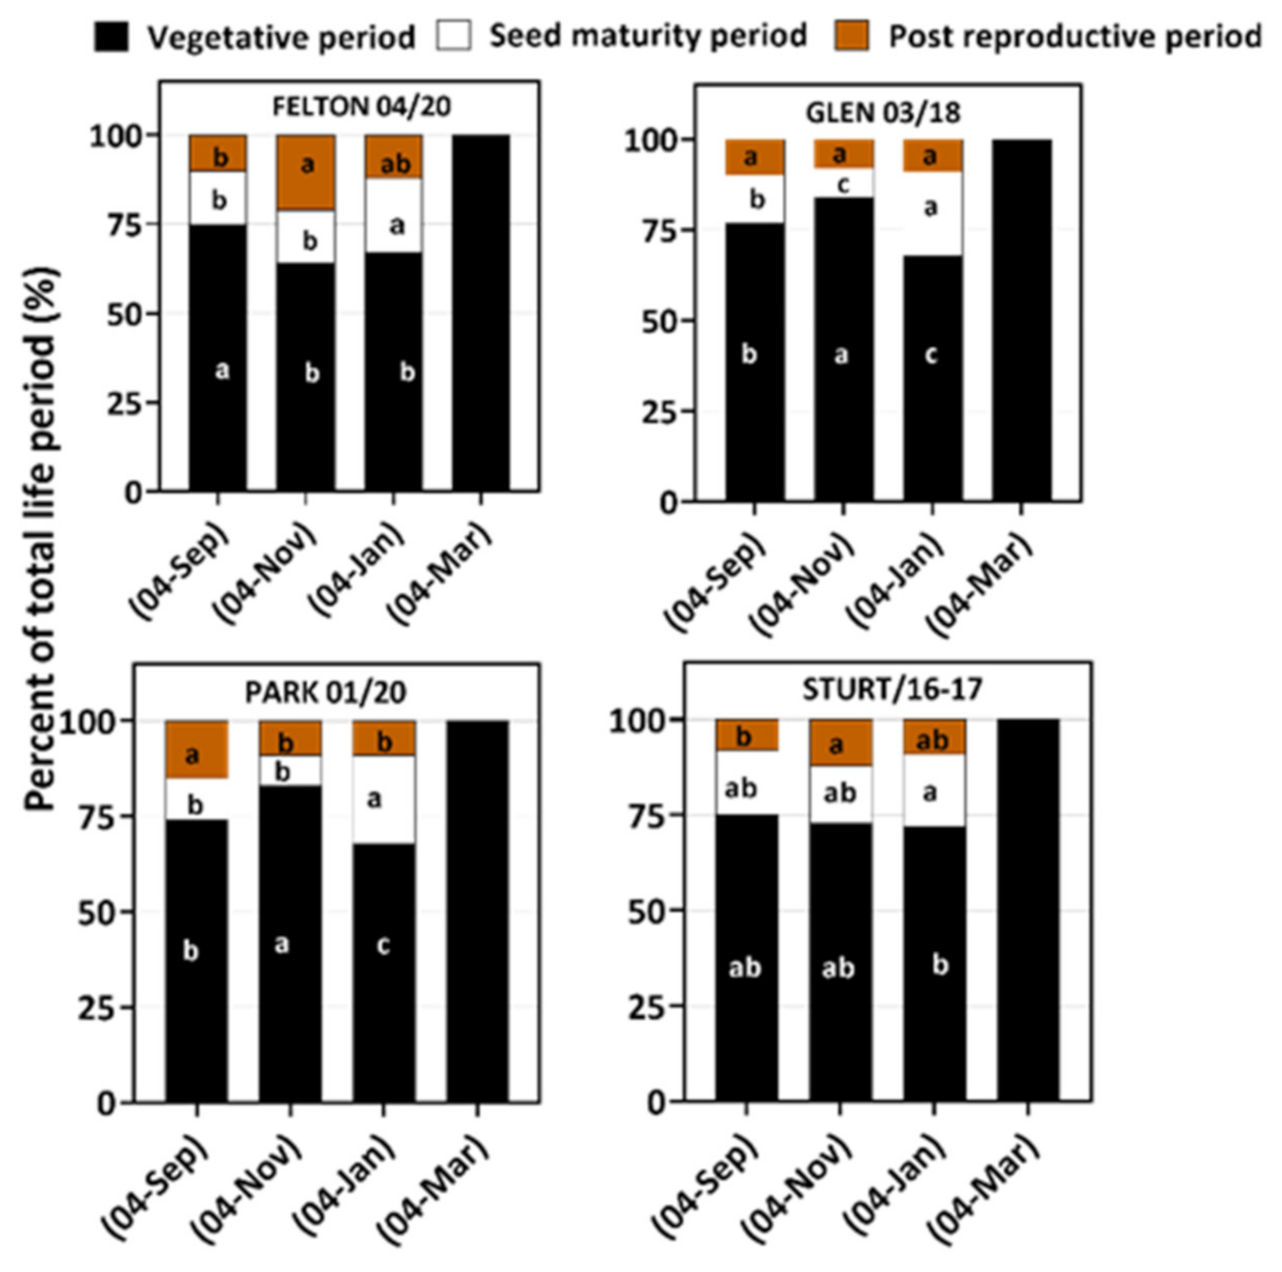
3.1. Phenophase of Four Populations

Sowing time and population had significant (p < 0.001) effect on the timing of key phenological events, and more importantly on the period each population spent within a phenological growth stage (Table 4). Generally, population FELT 04/20 seeds emerged at 3–4 days after sowing, which was 1–2 days earlier than the other three populations at all four sowing time treatments (Table 4). All populations, except GLEN 03/18, which emerged in early spring and mid-summer, had a shorter vegetative period than the plants that emerged in late spring. Among the four sowing times, the late spring sowing treatment took the longest time from emergence to the first seed head emergence (70–110 days), the longest post-reproductive period (8–23 days), while it had the shortest seed maturity period (8–16 days). The average reproductive period was the longest in the mid-summer sowing time treatment (30 days) and the shortest in early spring (4 September) time (22 days). Similarly, the mid-summer sowing time treatment resulted in the longest in the total life period (92–116 days). Feathertop Rhodes grass that emerged in early autumn (4 March) did not progress to the reproductive stage in all four populations as a result of low temperatures and frosts in winter, which eventually killed the plants (Table 2 and Table 3).
Populations differed significantly (p = 0.004) in the duration required for vegetative growth and reproduction. The populations FELT 04/20 and STURT 16/17 took about 70 days from emergence to the first seed head emerging and 82–85 days from emergence to the first seed maturing when sown in early spring and mid-summer, respectively. GLEN 03/18 took the longest time (78–95 days) from emergence to the first seed head emerging. Across the four sowing times, the time from emergence to senescence (total life period) of STURT/16–17 and FELT 04/20 were 85–87 and 105–107 days, respectively, when emerged in early spring and late spring. Total life period of FELT 04/20 and STURT/16–17 was similar within a given sowing time treatment and responded in a similar manner with sowing time treatments. These two populations were sourced from non-cropping situations and their life period increased from early spring to late spring sowing times and then decreased. PARK 01/20 and GLEN 03/18 were sourced from cropping situations and tended to have a longer life period when they emerged in mid-summer than other sowing times. Across the four feathertop Rhodes grass populations, the variation in reproductive period (seed maturity + post-reproductive period) was greater in the late spring sowing (17–39 days), while it was narrower in both the early spring (20–24 days) and mid-summer sowings (28–32 days).
The percentage of the total reproductive period (seed maturity + post-reproductive period) for all populations was higher in the mid-summer sowing time than in the early and late spring sowing times (Figure 2). All four populations had a similar trend for reproductive periods when they emerged in early spring. However, the two roadside populations FELT 04/20 and STURT/16–17 had significantly (p = 0.002) higher reproductive periods in late-spring emerged plants than the two cropping populations.
Vegetative period = the interval from emergence to booting stage; seed maturity period = the interval from seed head emergence to the first mature seed formed; post-reproductive period = the interval from the first mature seed to plant senescence; reproductive period = the interval from the first seed head emergence to plant senescence; and life period = the interval from emergence to plant senescence.

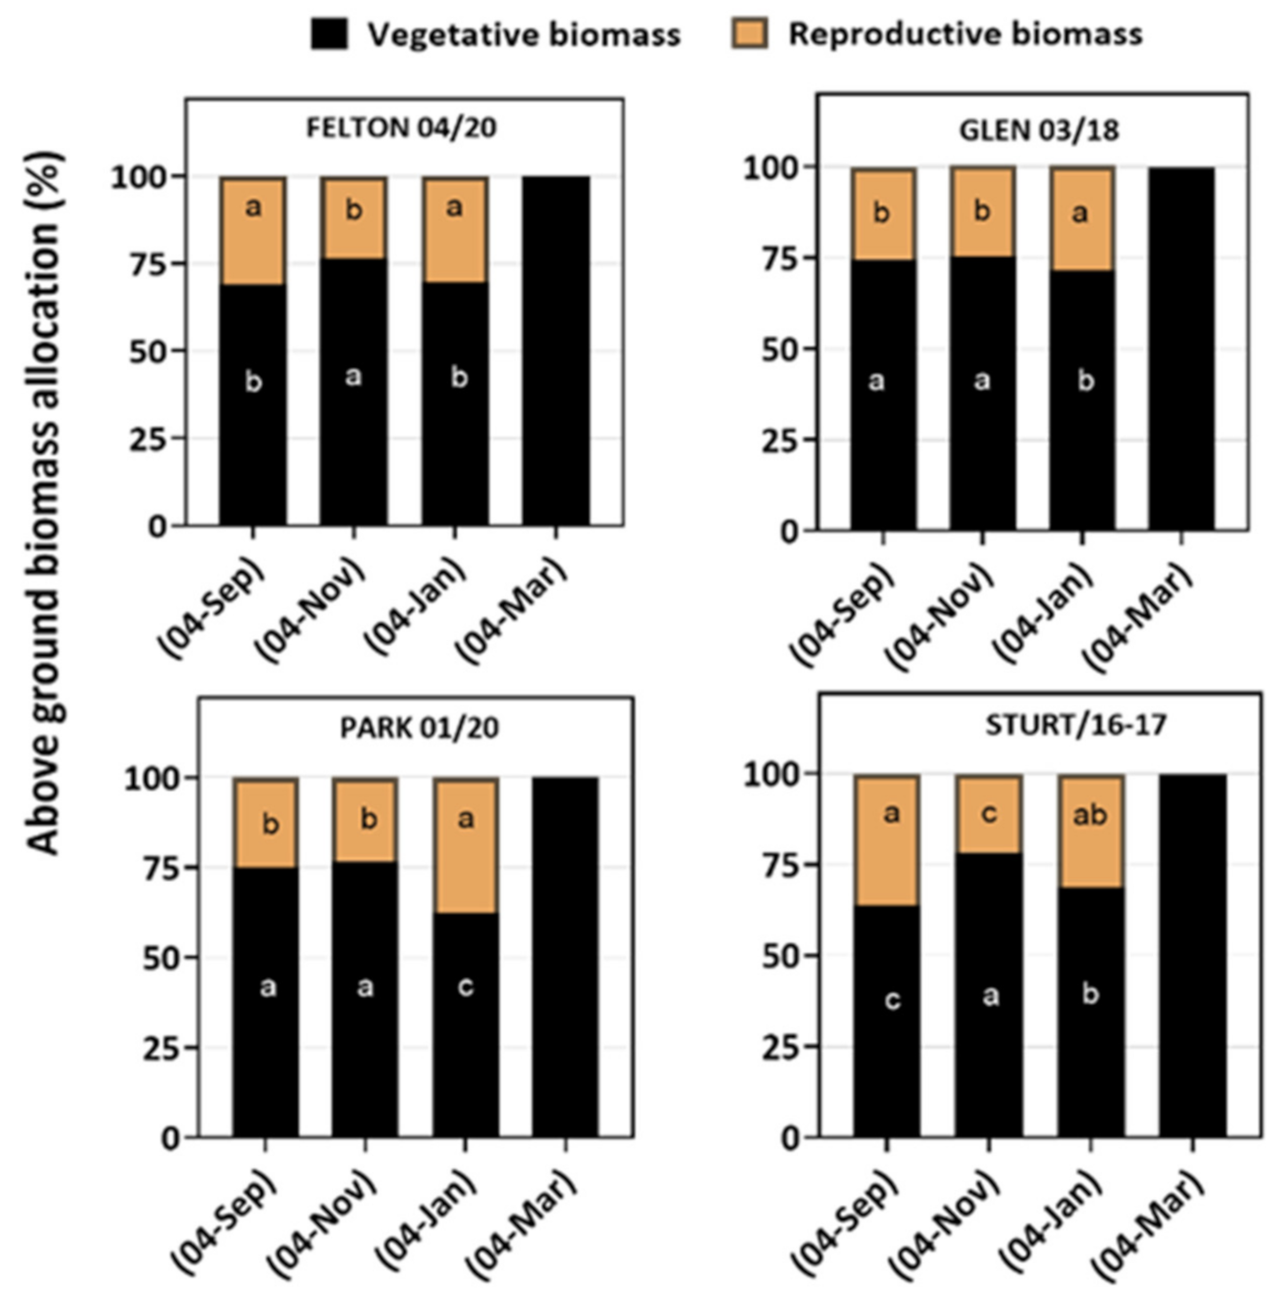
3.2. Plasticity in Plant Growth and Biomass Allocation

Determination of numbers of basal tillers was difficult because of the characteristic branching habit that occurs at most nodes on the main culm of feathertop Rhodes grass. Therefore, data on tiller numbers included primary and secondary tillers. The number of tillers produced by feathertop Rhodes grass ranged from 9 to 24 tillers/plant across the four sowing times and four populations (Table 5). However, in most cases, the tillers/plant ranged from 12 to 14, except for 24 and 22 tillers/plant in FELT 04/2 and STURT-16/17 sown in mid-summer, respectively. The tiller number was not greatly affected by growing season.
There was a significant (p = 0.001) interaction effect of sowing time and population on the plant growth habit. All populations that emerged in early spring and autumn had prostrate to semi-prostrate growth habits, whereas plants that emerged in either end of spring or summer had semi-prostrate to erect growth habits. Among the populations, GLEN 03/20 showed the most prostrate growth habit, followed by PARK 01/20, FELT 04/20, and STURT/16–17, in that order.
The proportion of total biomass in vegetative (above-ground) parts varied significantly (p = 0.003) across the four populations and sowing times (Figure 3). However, all populations had significantly (p = 0.005) higher vegetative biomass allocation in the late spring cohort than the early spring and mid-summer cohorts. The reproductive biomass allocation was significantly (p = 0.007) higher in the mid-summer emerged plants. The two roadside populations (FELT 04/20 and STURT/16–17) tended to have less vegetative biomass allocation than reproductive biomass allocation at early spring, whereas the opposite trend was observed in the cropping populations (PARK 01/20 and GLEN 03/18).

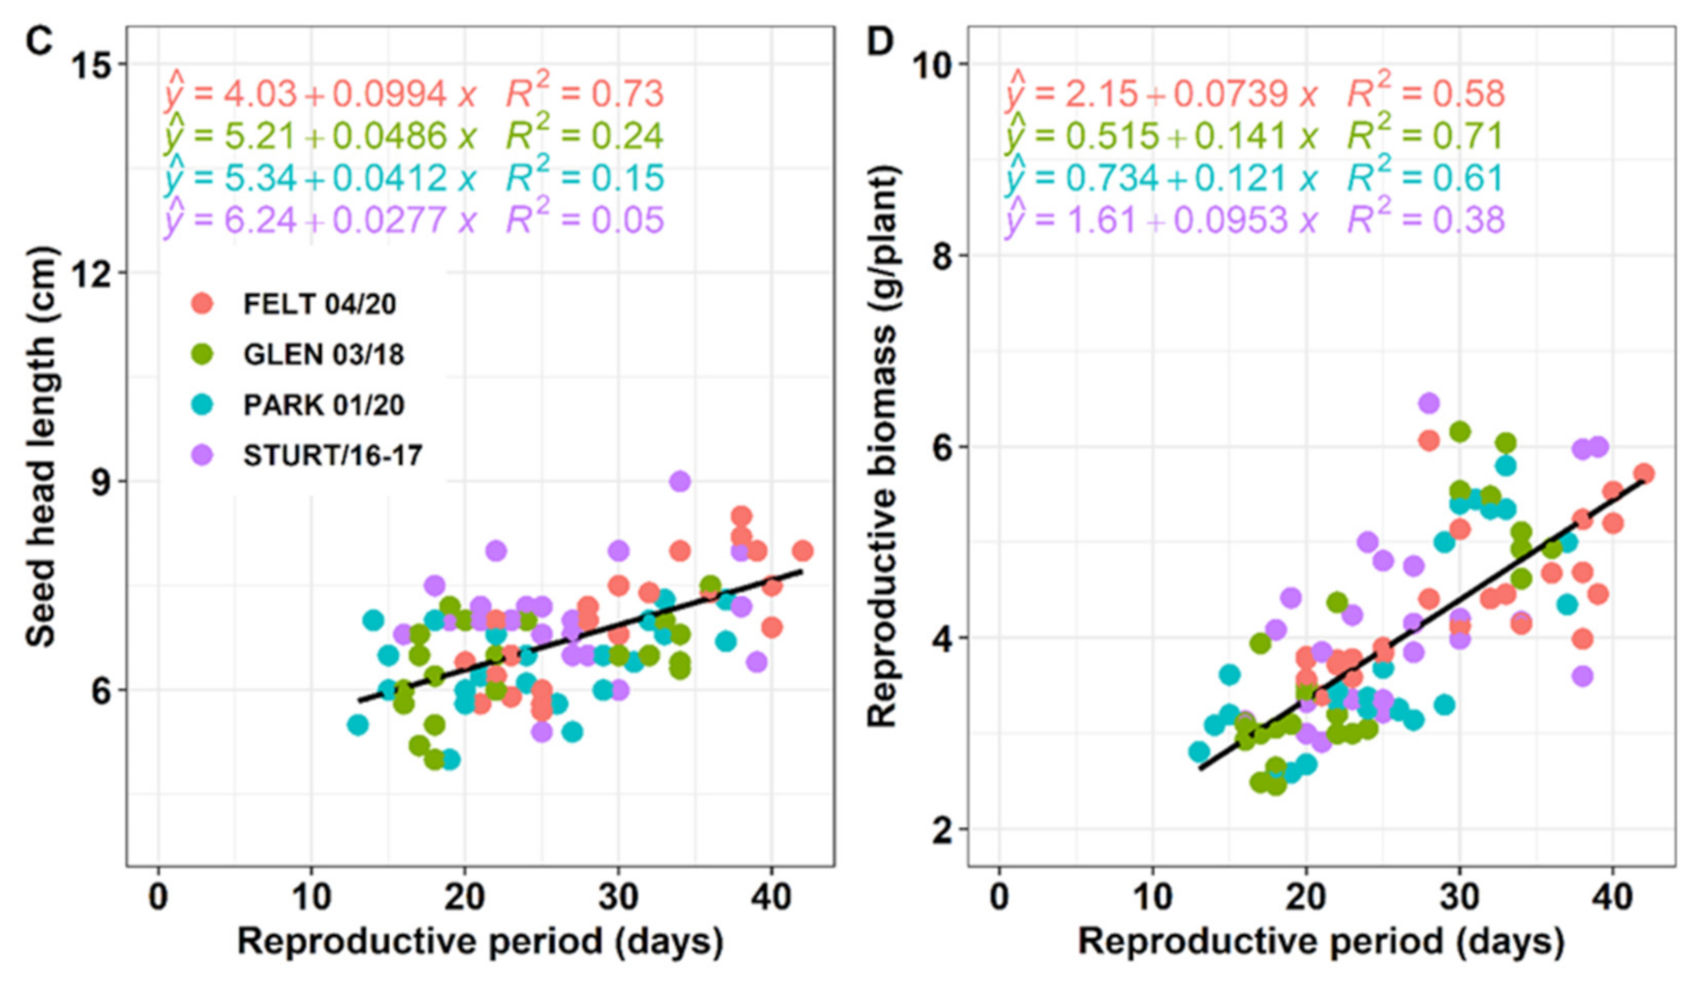
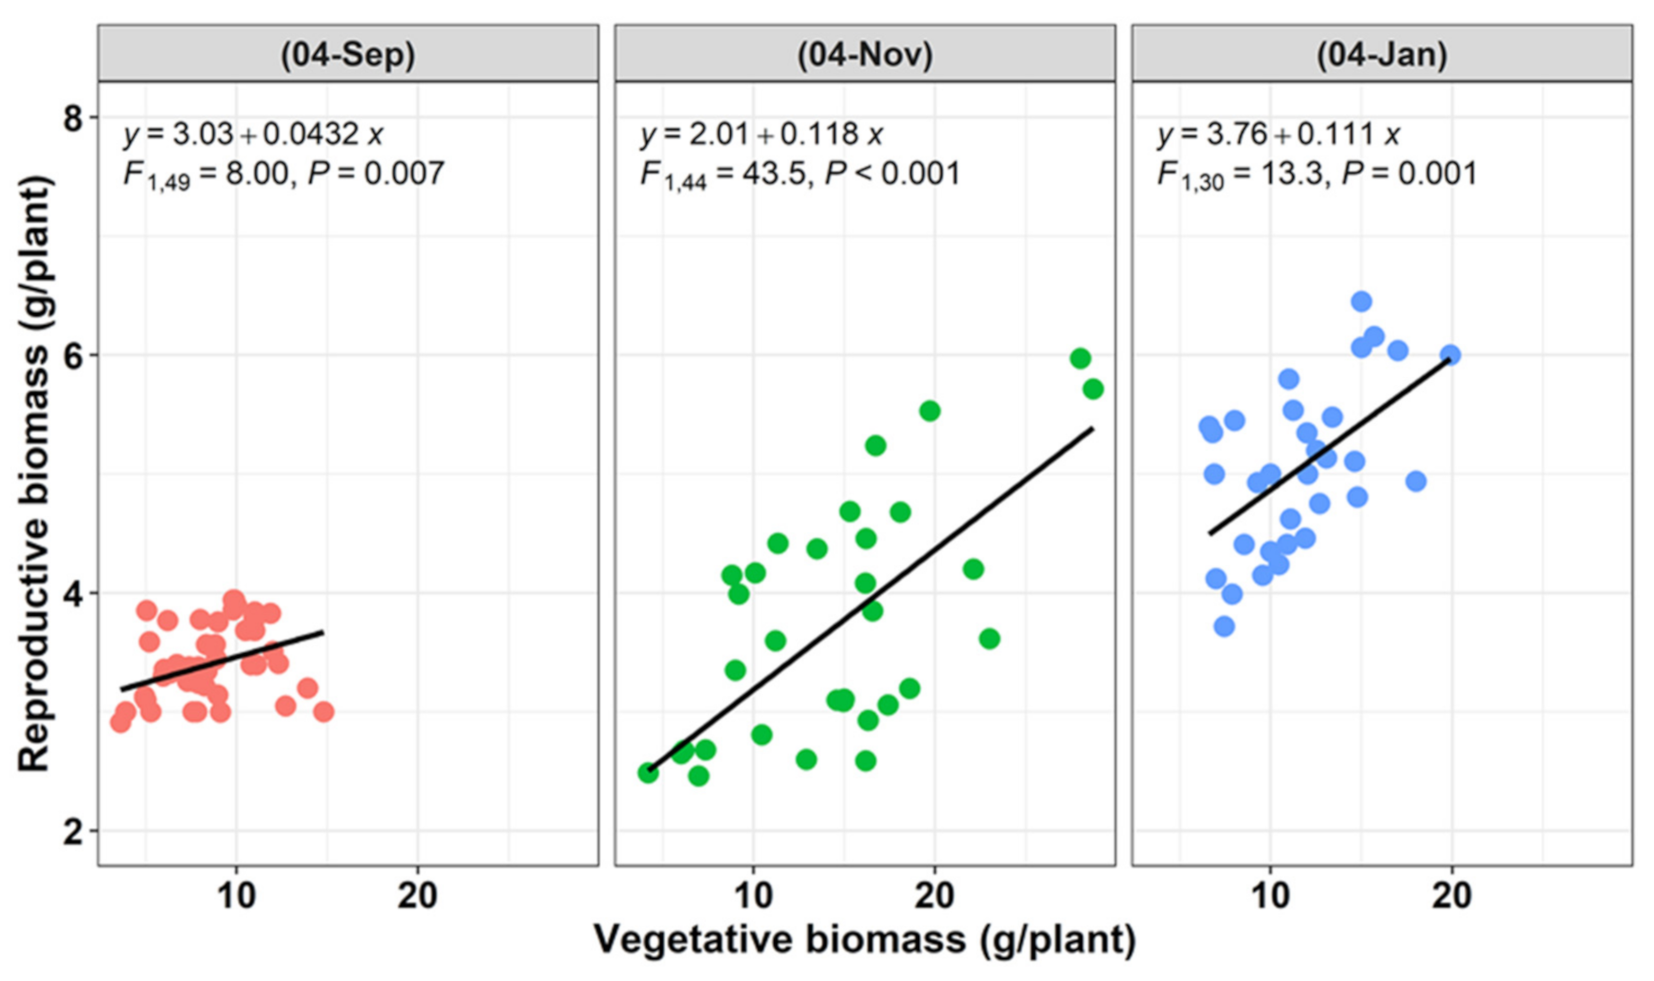
3.3. Plasticity in Reproductive Effort

Feathertop Rhodes grass plants that emerged in the autumn sowing time (4 March) did not progress to the reproductive stage and were therefore excluded from the analysis of reproductive traits. A significant (p < 0.005) linear relationship was observed between the total life period and the reproductive period for all populations except PARK 01/20 among the three sowing times (Figure 4A). Additionally, a similar trend was observed between the reproductive period and the numbers of seed heads/plant (Figure 4B). Such relationships were more pronounced in the two roadside populations than the two cropping populations with a few outliers. The explanatory data analysis further indicated that seed head numbers/plant at harvest differed significantly (p = 0.002) between populations and sowing times. The seed head number per plant ranged from 2 to 20 depending on the population and sowing time (Table 5). The two roadside populations, STURT/16–17 and FELT 04/20, had a 35% higher number of seed heads/plant across the three sowing times than the two cropping populations, GLEN 03/18 and PARK 01/20. FELT 04/20 and STURT/16–17 produced on average 10 and 9, 18 and 20, 12 and 14 seed heads/plant in early spring, late spring, and mid-summer sowing time, respectively. On average the two southern populations, STURT/16–17 and PARK 01/20, generated more (10%NS) seed heads across four sowing times than the two northern populations, FELT 04/20 and GLEN 03/18.
Seed head biomass and reproductive structure, such as number of spikelets per head, were significantly (p = 0.002) affected by the two-way interactions of sowing time and populations (Table 5). Seed head weight increased from the early spring to summer cohorts, with the mid-summer emerged plants having 50% to 70% heavier seed heads than the early- and late-spring emerged plants. The two roadside populations produced 20% heavier seed heads than the two cropping populations. The summer emergence cohorts had on average 13 spikelets/seed head across the four populations, which was significantly (p = 0.001) higher than the 10 spikelets/head assessed in both the early- and the late-spring emerged plants.
We found that seed head length did not differ significantly (p = 0.07) between populations at each sowing time, represented by the closeness of the data points (Figure 4C). However, head length was significantly (p = 0.001) affected by sowing time (Table 5). Therefore, we conclude that sowing time was the main driving force to influence the seed head length of feathertop Rhodes grass. The largest seed head length (7 cm) was recorded in the mid-summer sowing time followed by the late-spring and early-spring cohorts (6 cm). The coefficient of determination (R2) value of four populations showed that the reproductive biomass was significantly correlated with the reproductive period (Figure 4D). The mid-summer sowing time led to the longest total reproductive period with limited variation between the four populations.
Seed production of the four feathertop Rhodes grass populations across the four sowing treatments was significantly (p = 0.0003) different (Table 5). On average, seed production increased from the early spring (3240 seeds/plant) and late spring (8000 seeds/plant) to the mid-summer sowing time (9942 seeds/plant). The two roadside populations, FELT 04/20 (6730 seeds/plant) and STURT/16–17 (6449 seeds/plant), produced higher numbers of seeds per plant than the two cropping populations, PARK 01/20 (4590 seeds/plant) and GLEN 03/18 (3590 seeds/plant), across the four sowing times despite a slight decrease in the seed numbers in FELT 04/20 at the mid-summer sowing time.
Plasticity in allocation to reproduction is assessed by the relationship between reproductive biomass (seed head with seeds) and total vegetative biomass (leaf and stem) (Figure 5). For all populations, the interaction effect of vegetative biomass and sowing time on reproductive biomass was significant (p = 0.002), indicating differences in the slope of the relationship among sowing time treatments and true plasticity in reproductive effort. The slopes of each population at different sowing times were significantly (p = 0.0005) different (Table 5).
Principal component analysis (PCA) among measured traits of feathertop Rhodes grass at four sowing times is presented in Figure 6. The proportion of the first and second components were 56.6% and 14.4%, respectively. The first component (PC1) mainly consists of reproductive features and these are plotted in close proximity, including reproductive period, reproductive mass, seed head length, number of spikelets, seed head mass, and post-reproductive period. The total life period, reproductive period, seed head mass, number of spikelets, seed head number, and vegetative mass are positively correlated with PC1, but their relative contribution varied. The vegetative period was negatively correlated with PC1. This component can be viewed as a measure of the reproductive fitness because of the different sowing times of feathertop Rhodes grass. In PCA, the second component was mainly due to the vegetative period, total life period, and greenness.
Seed fecundity under different conditions is a key fitness feature of a weed species. The additive main effects (populations), multiplicative interaction (AMMI) analysis, and biplot of population × growing environment (P × E) of four populations were used to evaluate seed production. The PC1 is significant (p = 0.001), with PC1 axis explaining 96% variation of the P × E (Figure 7). The two roadside populations (FELT 04/20 and STURT/16–17) clustered together in the AMMI biplot. They are placed closer than the two cropping populations (PARK 01/20 and GLEN 03/18) and produced a higher number of seeds per plant across the sowing times. Seed production was largely influenced by the mid-summer environment, rather than the early-autumn and late-spring environments.

4. Discussion

Plant life-history characteristics vary widely within and among species, which allows species to succeed under varying environmental conditions [23]. For example, time of seedling emergence determines the ability of a plant to compete with its neighbours, its survival against biotic and abiotic stresses and its reproduction [24]. Therefore, knowledge of weed periodical emergence is important in planning effective weed control programs such as herbicide application or non-chemical strategies. This study demonstrated that feathertop Rhodes grass can emerge throughout the cropping season (early September to March) of southern NSW. Feathertop Rhodes grass required a short time (2 to 4 days) from sowing to emergence, and the time to emergence was not significantly different between populations. All the populations emerged 1 day earlier in mid-summer treatment and we infer that a warmer environment with sufficient soil moisture favours the emergence of this species.
Sowing time treatments affected the amount of time that plants spent in each phenological stage in the life cycle of feathertop Rhodes grass. In southern NSW, the late-spring emerged plants had the longest vegetative period with the shortest seed maturity period; conversely, the mid-summer plants produced seed heads earlier in their life span than in the early- and late-spring sowing times. The results suggest that photoperiod and temperature could be primary environmental factors determining when the reproductive events occur. The low temperature during June–August in southern NSW significantly impacted the growth and development of feathertop Rhodes grass. This argument can be clarified by historic weather data of WWAI. The multiple frost events eventually killed the early-autumn emerged plants in our study. Therefore, the frost frequency and intensity are an important benchmark for implementing an economic post-emergent control of feathertop Rhodes grass, particularly in southern NSW.
The proportion of the total life period spent in the reproductive stages significantly varied between environmental conditions because of different sowing times. All populations tended to have the highest post-reproductive period at the mid-summer sowing treatment. It could have a positive effect on high seed production and contribute to the overall fitness by replenishing extra seeds in the soil seed banks. Similarly, Zhou et al. [25] found that later sown plants of Amaranthus retroflexus increased the proportion of total life period spent in the reproductive stage and produced a higher number of seeds per plant. The vegetative and reproductive responses of feathertop Rhodes grass to the increase in both temperature and day length towards the summer season was more pronounced than that of the early-spring emerged plants. Feathertop Rhodes grass might be historically better adapted in northern NSW, and southern and central QLD of Australia where temperature is generally higher than in southern Australia. Plants spend more time in their reproductive stage with massive seed production as a form of long-term fitness. Furthermore, the total life period was affected by reproductive period, which is correlated to reproductive performance including seed head production, seed head length, and seed production. This is more noticeable in the two roadside populations (PARK 01/20 and GLEN 03/148). These characteristics are typical for annual plants that were well adapted to varying environmental conditions [26]. Under favourable conditions, both total life and reproductive periods are maximised for higher seed head, longer seed head length, and higher number of seeds, thereby improving the overall fitness. Conversely, seedlings that emerged in early autumn are not tolerant to cold or frost and therefore died before proceeding to the reproductive stage. Based on our study, we can hypothesise that variation in seed production or reproductive fitness of this species is also determined by the reproductive period.
Additionally, sowing time led to plasticity in morphological characteristics such as plant architecture and seed head length. The plants that emerged in early spring had a prostrate growth habit with shorter seed heads than the mid-summer emerged plants. The late-spring emerged plants produced greater vegetative biomass, while the mid-summer emerged plants tended to allocate more biomass for the reproductive parts than the vegetative growth. These results exhibit the plants’ phenotypic plasticity to the varying abiotic conditions that affect morphological and physiological features. The increased reproductive biomass of later emerged plants (mid-summer) also translated into an increased number of seeds produced per plant. It is interesting that reproductive biomass of two roadside populations were higher in the earliest sowing time treatment (early spring), but seed production was still lower than the other two sowing times (late spring and mid-summer). The reason for this is not clear; however, we hypothesise that these two populations are less sensitive to environmental variability, showing different biomass allocation patterns under different environments.
The cropping and roadside populations differed in their rate of development. The time spent for reproductive periods and number of reproductive features are higher in the two roadsides than the two cropping populations. The variation might be due to different habitats of the populations even though they are from same geographic locations. Weed populations that are continuously associated with specific agricultural systems may evolve phenological patterns that optimise survival only within the most favourable growing area [27]. The results demonstrated that differentiation between local populations was probably encouraged by the self-pollinating reproduction of the feathertop Rhodes grass. We believe that the source of these variations or changes came mainly from phenotypic plasticity rather than from local adaption, as both roadside populations were from two different geographic locations. A similar result was found in barnyard grass (Echinochloa crusgalli) by Yamasue [27], who reported that morphological and phenological responses were significantly different among populations collected from different habitats. Feathertop Rhodes grass was initially dominant in non-cropping situations in southern NSW but has gradually moved to cropping paddocks and is now an established cropping weed. Previously, other research on E. crusgalli showed that plant plasticity ensured the survival and reproduction of offspring in heterogenous and unpredictable environments [10,28,29]. Therefore, such plasticity can increase the probability of a population or a species to move from one adaptive area more easily to another.
Weed populations can differentiate genetically to become locally adapted [29,30,31]. Alternatively, individuals may be phenotypically plastic, expressing the optimal phenotype in different environments with no genetic differentiation [32,33]. It was observed that development of size inequality of individual populations and even between plants within populations could contribute to reproductive success. The results demonstrated that different populations produced different amounts of biomass and their allocation pattern was different. This may be due to different individual responses or the resource utilisation capability of the individual plant. Moreover, partitioning patterns were not consistent, even though all populations emerged at almost the same time and under similar temperature and photoperiod. It is particularly true that environmental change may induce alterations and alternations in the phenotype, but there are also influences of the genotypic characteristics [9]. There were significant differences in seed production between the populations at all the sowing times. It has previously been shown that population and environment interactions largely influence plant phenological development and seed production [24]. The four populations do not cluster together in the AMMI biplot (Figure 7) and this suggests that they behave differently for seed production across environments. Roadside populations were broadly adapted across a wide range of conditions and are less responsive to the various sowing times. The proportion of their life cycle spent in the reproductive stages was longer and the proportion of total biomass in reproductive tissues increased in the two non-cropping populations. However, the same was not true for the two cropping populations in the study. This predicts that the apparent difference between the cropping and non-cropping populations within same location could be related to the domestication of both roadside populations in non-cropping situations and different cultivation practices for both cropping populations.
The relationship between plant size and reproductive output is central to a plant’s strategy to convert growth into fitness [34]. A more accurate measure of reproductive allocation is quantified by the relationship between reproductive biomass and vegetative biomass because this considers whatever factors influenced plant size during growth. The slope of the relationship between reproductive tissue biomass and vegetative tissue biomass (R-V) increased from the early spring emergence to late spring and summer emergences, indicating higher reproductive biomass per unit of vegetative biomass produced. There was a great range in vegetative tissue biomass of individual plants of four populations across sowing time treatments (Figure 5). The reproductive tissue biomass is linearly related to vegetative biomass, regardless of populations. However, the slope of the relationship between reproductive tissue biomass and vegetative tissue biomass within a population also varied among sowing time treatments and between populations (Table 5) and this relationship indicated true plasticity in biomass allocation across treatments. The two southern populations had larger slope values than the two northern populations in the early-spring emerged cohort. Conversely, the two roadside populations had higher slopes than the two cropping populations in the late spring and the mid-summer sowing times. Therefore, there is a trend in the changes in plasticity of southern and northern populations in biomass allocation across sowing time treatments. The southern populations (from southern NSW) were distinctly different for biomass allocation than the two northern populations (from southern QLD) in the early spring sowing time. This finding suggests that the overall R-V relationship across all treatments appears to be far more important than the R-V relationship among individual populations shown in Figure 5. Other studies found a linear association between plant biomass and plant seed production in both annual weeds and crops, and claimed that high vegetative mass enhanced high reproductive mass and plant fitness [35,36,37].
Currently, feathertop Rhodes grass is a problematic weed for many crops in Australia. Feathertop Rhodes grass is difficult to eradicate once established because it produces abundant seeds. The study confirmed the major role of environmental conditions such as temperature and day length as the driving factors of feathertop Rhodes grass phenological development and confirmed the diversity of the populations and their suitability to different environments. Abiotic stresses influenced phenological development leading to seed production for the next generations. Low temperatures or frosts can slow the rate of plant development and can stop seed production. However, the results from this phenological study were obtained from non-moisture-stressed condition and these need to be further verified under moisture stress as erratic rainfall patterns in the summer often result in a dry period in southern NSW. Populations from even the same geographic location may differ in characteristics and idiosyncratic ways in the magnitude and direction of environmental effects on individual fitness. This complex mechanism may be important for better understanding the ecological distribution of a weed species because organisms in nature encounter numerous interacting stresses [38]. The January sowing (mid-summer) produced the greatest number of seeds, whereas the early spring resulted in the lowest seed production. The information of seed production is critical for effective weed control [39,40]. The more seeds produced, the more serious the potential impact on crops in the following year. The recommendation is that controlling feathertop Rhodes grass seedlings prior to reproduction will reduce population growth and alleviate their negative effects on crop yield in future generations.

5. Conclusions

This study demonstrated that feathertop Rhodes grass has a prolonged emergence pattern, from early spring through to autumn, in southern NSW. Therefore, there is need for multiple tactics for effective control in a fallow situation, such as tillage, residual, and post emergent herbicides. However, in a winter cropping situation in southern NSW, the emergence in early and late spring is often challenged by strong competition from the growing crops during the season, resulting in limited survivors (data not presented). Plants that emerged in early autumn died before the reproductive stage because of frosts in southern NSW. Concerted efforts should be diverted to control early emergence, especially the mid-summer emergence caused by the removal of crop competition after harvest and by more aggressive growth and seed production.

Author Contributions

Conceptualization M.A.; format analysis M.A.; investigation M.A., M.H. and A.S.; methodology M.A.; visualization M.A.; writing—original draft M.A.; funding acquisition H.W.; writing—review & editing H.W. and E.K. All authors have read and agreed to the published version of the manuscript.

Funding

The authors acknowledge co-investment from the Grain Research Development Corporation (GRDC) and the NSW Department of Primary Industries, Australia.

Informed Consent Statement

Not applicable.

Acknowledgments

We thank all the collaborators who provided seeds of two northern populations of feathertop Rhodes grass. We also thank Bernie Dominiak and Ali Bajwa for reviewing an early version of the manuscript.

Conflicts of Interest

The authors declare no conflict of interest.

References

  1. Schwartz, M.D. Phenology: An Integrated Environmental Science, 3rd ed.; Kluwer Academic Publishers: Dordrecht, The Netherlands, 2003; pp. 275–293. [Google Scholar]
  2. Godoy, O.; Richardson, D.; Valladares, F.; Castro-Diez, P. Flowering phenology of invasive alien plant species compared with native species in three Mediterranean-type ecosystems. Ann. Bot. 2008, 103, 485–494. [Google Scholar] [CrossRef] [PubMed] [Green Version]
  3. Young, J.A.; Evans, R.A.; Kay, B. Phenology of Reproduction of Medusa Head. Weed Sci. 1970, 18, 451–454. [Google Scholar] [CrossRef]
  4. Ghersa, C.M.; Holt, J.S. Using phenology prediction in weed management: A review. Weed Res. 1995, 35, 461–470. [Google Scholar] [CrossRef]
  5. Kumar, A.; Singh, S.; Bahadur, H.; Chand, B.; Kumar, B. Phenological documentation of Lantana camara L. using modified BBCH scale in relation to climatic variables. Plant Sci. Today 2022, 1481, 1–10. [Google Scholar] [CrossRef]
  6. Bryson, C.T.; Carter, R. Biology of Pathways for Invasive Weeds1. Weed Technol. 2004, 18, 1216–1220. [Google Scholar] [CrossRef]
  7. MacLaren, C.; Storkey, J.; Menegat, A.; Metcalfe, H.; Dehnen-Schmutz, K. An ecological future for weed science to sustain crop production and the environment. A review. Agron. Sustain. Dev. 2020, 40, 1–29. [Google Scholar] [CrossRef]
  8. Dinçer, D.; Var, M.; Baykal, H.; Atamov, V. Phenological features of some geophytes from the Anzer plateau in Rize and utilization possibilities for landscape architecture. In Proceedings of the XXIX International Horticultural Congress on Horticulture: Sustaining Lives, Livelihoods and Landscapes (IHC2014), Brisbane, Australia, 17–22 August 2014; Volume 1108, pp. 187–194. [Google Scholar]
  9. Rafferty, N.E.; Ives, A.R. Effects of experimental shifts in flowering phenology on plant-pollinator interactions. Ecol. Lett. 2010, 14, 69–74. [Google Scholar] [CrossRef]
  10. Sultan, E.E. Evolutionary implications of phenotypic plasticity in plants. In Evolutionary Biology; Hecht, M., Wallace, B., Prance, G., Eds.; Plenum Press: New York, NY, USA, 1987; pp. 127–178. [Google Scholar]
  11. Alpert, P.; Simms, E.L. The relative advantages of plasticity and fixity in different environments: When is it good for a plant to adjust? Evol. Ecol. 2002, 16, 285–297. [Google Scholar] [CrossRef]
  12. Bradshaw, W.E.; Holzapfel, C.M. Evolutionary Response to Rapid Climate Change. Science 2006, 312, 1477–1478. [Google Scholar] [CrossRef] [Green Version]
  13. Clements, D.R.; Jones, V.L. Rapid Evolution of Invasive Weeds Under Climate Change: Present Evidence and Future Research Needs. Front. Agron. 2021, 3, 10. [Google Scholar] [CrossRef]
  14. Schlichting, C.D. The evolution of phenotypic plasticity in plants. Ann. Rev. Ecol. Syst. 1986, 17, 667–693. [Google Scholar] [CrossRef]
  15. Sans, F.X.; Masalles, R.M. Demography of the arable weed Diplotaxis erucoides in central Catalonia, Spain. Can. J. Bot. 1997, 75, 86–95. [Google Scholar] [CrossRef]
  16. Donohue, K.; De Casas, R.R.; Burghardt, L.; Kovach, K.; Willis, C.G. Germination, Postgermination Adaptation, and Species Ecological Ranges. Annu. Rev. Ecol. Evol. Syst. 2010, 41, 293–319. [Google Scholar] [CrossRef]
  17. Carter, S.K.; Saenz, D.; Rudolf, V.H.W. Shifts in phenological distributions reshape interaction potential in natural communities. Ecol. Lett. 2018, 21, 1143–1151. [Google Scholar] [CrossRef]
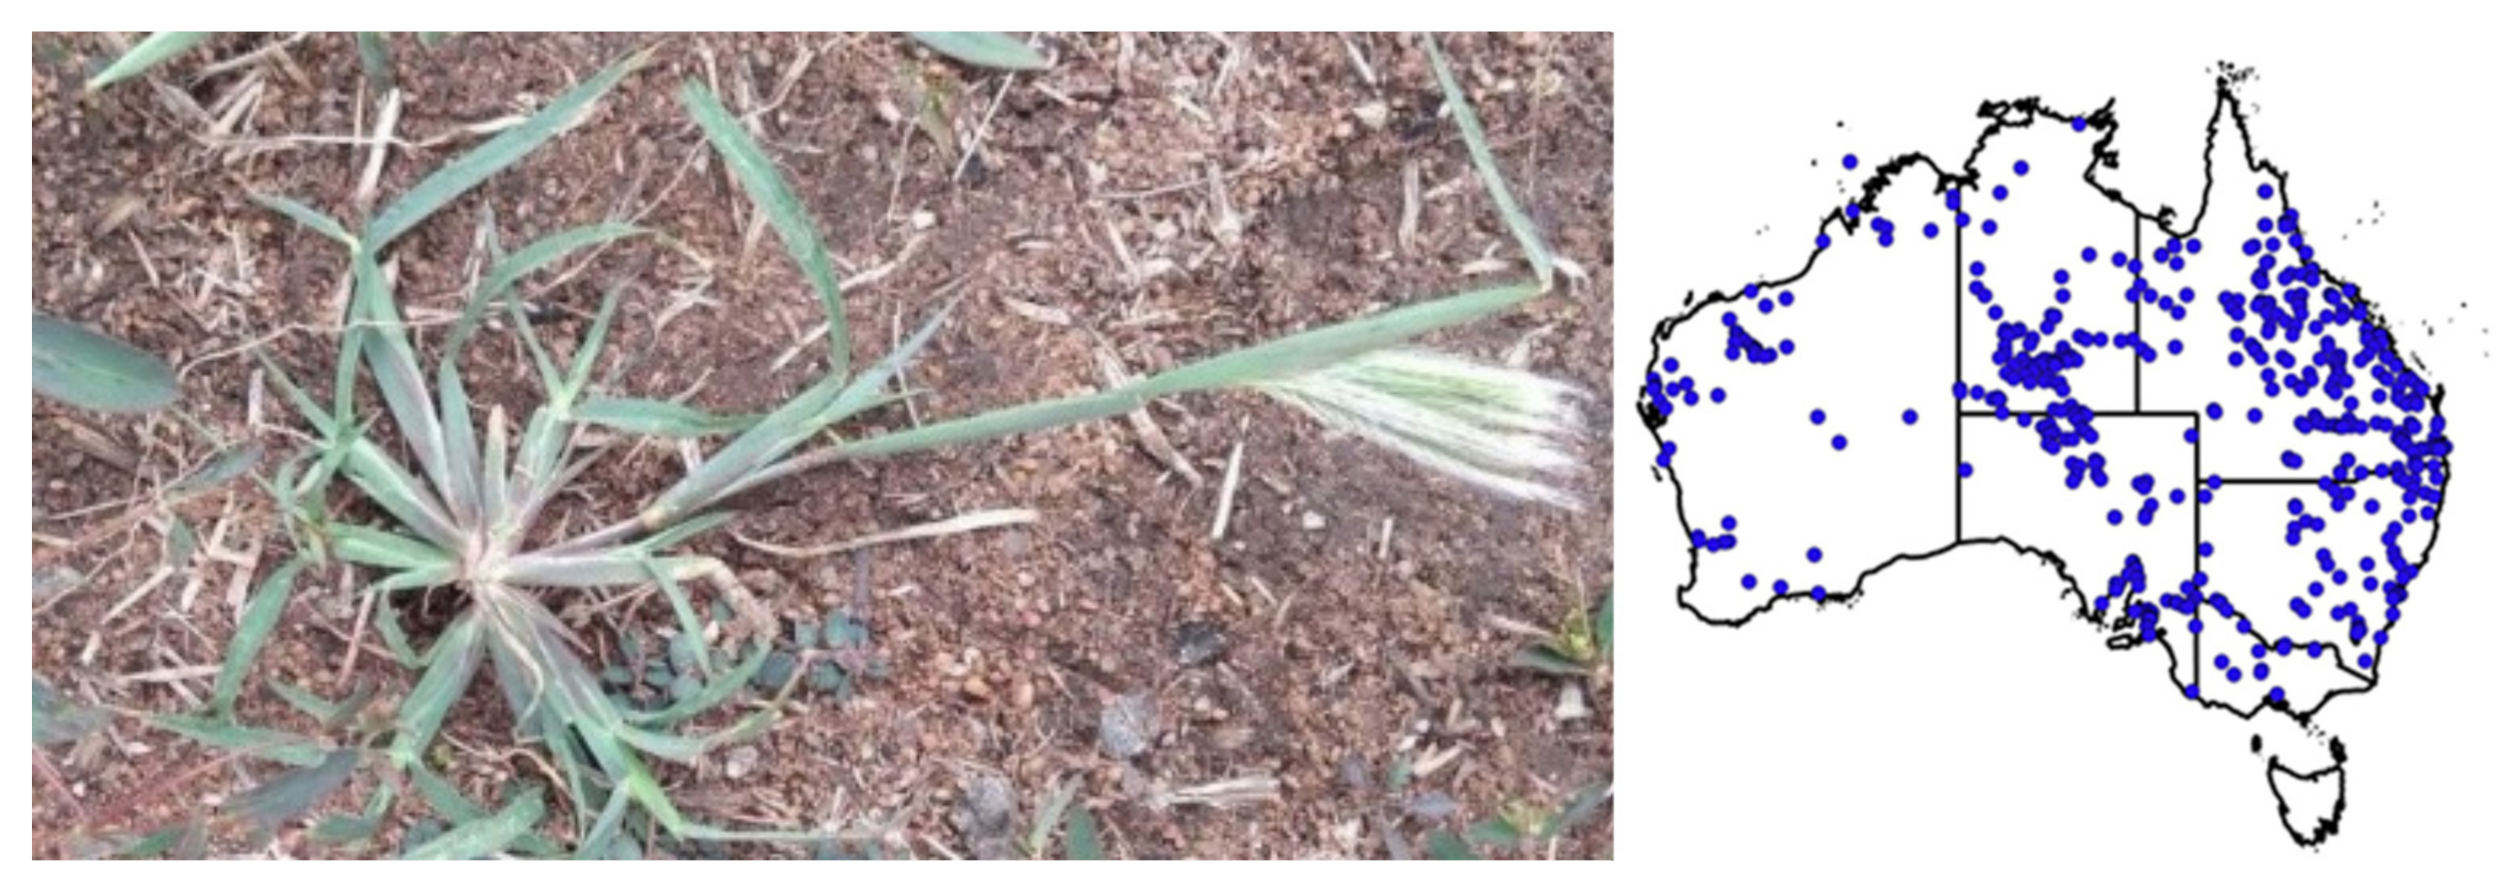
  18. Anderson, D.E. Taxonomy of the Genus Chloris (Gramineae). Brigh. Young Univ. Sci. Bull. 1974, 2, 133. [Google Scholar]
  19. Werth, J.; Boucher, L.; Thornby, D.; Walker, S.; Charles, G. Changes in weed species since the introduction of glyphosate-resistant cotton. Crop Pasture Sci. 2013, 64, 791–798. [Google Scholar] [CrossRef]
  20. Llewellyn, R.; Ronning, D.; Ouzman, J.; Walker, S.; Mayfield, A.; Clarke, M. The cost of weeds to Australian grain growers and the adoption of weed management and tillage practices. In Impact of Weeds on Australian Grain Production; GRDC: Kingston, Australia, 2016; Volume 112. [Google Scholar]
  21. Atlas of Living Australia. Available online: https://ala.org.au/ (accessed on 10 March 2022).
  22. Weiner, J.; Campbell, L.G.; Pino, J.; Echarte, L. The allometry of reproduction within plant populations. J. Ecol. 2009, 97, 1220–1233. [Google Scholar] [CrossRef]
  23. Manuel, C.; Molles, J. Ecology: Concepts and Applicants, 2nd ed.; Higher Education Press: Beijing, China, 2002; pp. 279–299. [Google Scholar]
  24. Forcella, F.; Arnold, R.L.B.; Sanchez, R.; Ghersa, C.M. Modeling seedling emergence. Field Crop. Res. 2000, 67, 123–139. [Google Scholar] [CrossRef]
  25. Zhou, D.; Wang, T.; Valentine, I. Phenotypic plasticity of life-history characters in response to different germination timing in two annual weeds. Can. J. Bot. 2005, 83, 28–36. [Google Scholar] [CrossRef]
  26. Li, H.; Lindquist, J.L.; Yang, Y. Effects of Sowing Date on Phenotypic Plasticity of Fitness-Related Traits in Two Annual Weeds on the Songnen Plain of China. PLoS ONE 2015, 10, e0127795. [Google Scholar] [CrossRef] [Green Version]
  27. Yamasue, Y.; Murayama, H.; Inoue, H.; Matsui, T.; Kusanagi, T. Productive structures of rice and Echinochloa phyllopogon Vasing. in mixed stands. J. Weed Sci. Technol. 1997, 42, 57–365. [Google Scholar]
  28. Clements, D.R.; DiTommaso, A.; Jordan, N.; Booth, B.D.; Cardina, J.; Doohan, D.; Mohler, C.L.; Murphy, S.D.; Swanton, C.J. Adaptability of plants invading North American cropland. Agric. Ecosyst. Environ. 2004, 104, 379–398. [Google Scholar] [CrossRef]
  29. Moran, E.V.; Alexander, J. Evolutionary responses to global change: Lessons from invasive species. Ecol. Lett. 2014, 17, 637–649. [Google Scholar] [CrossRef] [PubMed]
  30. Andersson, S.; Shaw, R.G. Phenotypic plasticity in Crepis tectorum: Genetic correlations across light regimes. Heredity 1994, 72, 113–125. [Google Scholar] [CrossRef]
  31. Kaweck, T.; Ebert, D. Conceptual issues in local adaptation. Ecol. Lett. 2004, 7, 1225–1241. [Google Scholar] [CrossRef] [Green Version]
  32. Gould, B.; Moeller, D.A.; Eckhart, V.M.; Tiffin, P.; Fabio, E.; Geber, M.A. Local adaptation and range boundary formation in response to complex environmental gradients across the geographical range of Clarkia xantiana ssp. xantiana. J. Ecol. 2014, 102, 95–107. [Google Scholar] [CrossRef]
  33. Schlichting, C.D.; Smith, H. Phenotypic plasticity: Linking molecular mechanisms with evolutionary outcomes. Evol. Ecol. 2002, 16, 189–211. [Google Scholar] [CrossRef]
  34. Weiner, J.; Rosenmeier, L.; Massoni, E.S.; Vera, J.N.; Hernández Plaza, E.; Sebastia, M.T. Is reproductive allocation in Senecio vulgaris plastic? Botany 2009, 87, 475–481. [Google Scholar] [CrossRef] [Green Version]
  35. Aarssen, L.W.; Taylor, D.R. Fecundity Allocation in Herbaceous Plants. Oikos 1992, 65, 225. [Google Scholar] [CrossRef]
  36. Grundy, A.C.; Mead, A.; Burston, S.; Overs, T. Seed production of Chenopodium album in competition with field vegetables. Weed Res. 2004, 44, 271–281. [Google Scholar] [CrossRef]
  37. Neytcheva, M.S.; Aarssen, L.W. More plant biomass results in more offspring production in annuals, or does it? Oikos 2008, 117, 1298–1307. [Google Scholar] [CrossRef]
  38. Bazzaz, F.A.; Morse, S.R. Annual plants potential responses to multiple stresses. In Response of Plants to Multiple Stresses; Mooney, H.A., Winner, W.E., Pell, E.J., Chu, E., Eds.; Academic Press: San Diego, CA, USA, 1991; Volume 1, pp. 283–305. [Google Scholar]
  39. Knezevic, S.; Evans, S.; Blankenship, E.; Van Acker, R.; Lindquist, J. Critical period for weed control: The concept and data analysis. Weed Sci. 2017, 50, 30–40. [Google Scholar] [CrossRef] [Green Version]
  40. Knezevic, S.Z.; Weise, S.F.; Swanton, C.J. Interference of redroot pigweed (Amaranthus retroflexus L.) in corn (Zea mays L.). Weed Sci. 1994, 42, 568–573. [Google Scholar] [CrossRef]
Figure 1. Feathertop Rhodes grass plant and its distribution in Australia, adapted from Atlas of Living Australia [21].
Agronomy 12 00736 g001
Figure 2. The percentage of life period at the vegetative, seed maturity, and post-reproductive stages of four feathertop Rhodes grass populations at four sowing times. Different letters for the same period of development indicate significant differences with a 5% level of significance. Here 04-Sep = 4 September, 04-Nov = 4 November, 04-Jan = 4 January, 04-Mar = 4 March.
Agronomy 12 00736 g002
Figure 3. The biomass allocation (% of total biomass) of four feathertop Rhodes grass populations at four sowing times. The early-autumn cohort (4 March) had only vegetative growth because of cold winter conditions. Different letters for the same developmental period indicate significant differences with 5% level of significance.
Agronomy 12 00736 g003
Figure 4. Reproductive period (A) and number of seed heads/plant (B) of feathertop Rhodes grass in relation to the total life period and reproductive period, respectively. Seed head length (C) and reproductive biomass (D) of feathertop Rhodes grass in relation to reproductive period. There were significant (p < 0.05) differences in slopes between populations. R2 represents the co-efficient of determination.
Agronomy 12 00736 g004aAgronomy 12 00736 g004b
Figure 5. Relationship between biomass of reproductive and vegetative biomass of four populations of feathertop Rhodes grass at four different sowing times.
Agronomy 12 00736 g005
Figure 6. Principal component analysis (PCA) of plant morphological and reproductive features of feathertop Rhodes grass. The first axis explains 56.6% and the second axis 14.4% of the variance. The color of the arrows (in the bottom scale 0 to 10) represents the degree of the variation affected by different sowing times.
Agronomy 12 00736 g006
Figure 7. Additive main effects and multiplicative interaction (AMMI) biplot for seed production of four populations at four different sowing times.
Agronomy 12 00736 g007
Table 1. Four populations used in the phenology study of feathertop Rhodes grass.
PopulationGeographic LocationHabitatEcotype
FELT 04/20Felton, QLDRoadsideNorthern
GLEN 03/18Toowoomba, QLD CroppingNorthern
STURT 16–17Wagga Wagga, NSWRoadsideSouthern
PARK 01/20Parkes, NSW CroppingSouthern
Table 2. Average (50 years) monthly temperature, rainfall, and solar exposure at WWAI.
Month Temperature
(°C)
Rainfall
(mm)
Solar Exposure
(MJ m−2)
January24.1543.427.3
February23.6553.824.0
March20.651.219.9
April15.929.414.4
May11.6536.610.3
June8.852.17.7
July7.846.08.4
August9.042.611.6
September11.4042.016.1
October14.7540.721.4
November18.4562.326.6
December21.7551.527.3
Table 3. Weather data (monthly average) at WWAI during experimentation 2020–2021.
Month Min. Temperature
(°C)
Max. Temperature
(°C)
Rainfall
(mm)
Solar Exposure
(MJ m−2)
September/20205.623.457.416.0
October/20208.828.285.018.4
November/202011.636.360.025.7
December/202012.134.978.226.6
January/202114.940.177.425.0
February/202114.140.0378.223.8
March/202112.233.4112.216.6
April/20216.531.72.414.7
May/20215.025.532.210.4
June/20213.819.174.27.7
July/20213.913.859.28.5
Table 4. Phenological traits and duration of developmental periods (days) of four populations of feathertop Rhodes grass emerged at different times (environmental condition).
Sowing TimePopulationEmergence DateEmergence to First Seed Head Emerging
(Days)
Vegetative PeriodSeed Maturity PeriodPost-Reproductive PeriodReproductive PeriodLife Period
4 SeptemberFELT 04/207 September69–7164. 00 (±0.28)13.07 (±0.65)9.38 (±0.89)22.45 (±0.70)86.45 (±0.65)
STURT16–178 September63–7363.87 (±0.85)14.50 (±1.11)6.60 (±0.50)21.10 (±0.93)84.97 (±1.34)
PARK 01/208 September72–8069.00 (±1.17)10.00 (±1.30)14.71 (±1.11)24.28 (±0.92)93.75 (±1.5)
GLEN 03/189 September85–9565.27 (±4.90)11.37 (±0.77)9.00 (±0.54)20.37 (±0.92)85.64 (±5.4)
4 NovemberFELT 04/207 November70–7268.10 (±2.00)15.28 (±0.60)23.27 (±1.78)39.07 (±0.85)107.17 (±2.34)
STURT16–178 November85–9577.07 (±4.00)16.00 (±2.15)12.72 (±1.05)28.72 (±2.76)105.79 (±5.00)
PARK 01/208 November95–10069.00 (±0.75)8.25 (±0.80)8.54 (±0.70)16.79 (±0.99)85.79 (±3.86)
GLEN 03/1810 November100–11090.00 (±2.26)8.78 (±0.65)8.89 (±0.84)17.67 (±0.71)107.67 (±3.28)
4 JanuaryFELT 04/206 January65–7061.50 (±1.13)19.75 (±1.30)10.63 (±0.74)30.38 (±1.81)91.80 (±1.61)
STURT16–176 January63–7570.75 (±4.20)18.75 (±1.03)9.12 (±0.93)27.87 (±1.77)98.62 (±0.73)
PARK 01/207 January72–7883.18 (±3.03)23.75 (±1.04)9.00 (±0.46)32.75 (±1.04)115.93 (±1.07)
GLEN 03/187 January78–8570.37 (±1.50)23.00 (±0.92)9.25 (±0.59)32.25 (±1.04)102.62 (±1.64)
4 MarchFELT 04/207 March67–8069.57 (±1.34)----
STURT16–177 March67–8164.15 (±0.48)----
PARK 01/208 March80–9071.25 (±1.11)----
GLEN 03/188 March80–9079.26 (±1.63)----
-p-value -p = 0.003p = 0.004p = 0.003p = 0.002p = 0.002p = 0.002
Table 5. Effect of sowing time on tiller number, plant architecture, seed head number, seed head length, seed head biomass, number of spikelets per seed head, seeds per plant, and the relationship slope between the reproductive biomass and the vegetative biomass (R-V) of four different populations of feathertop Rhodes grass.
Sowing TimePopulationTillers/PlantPlant ArchitectureNumber of Seed Heads/PlantSeed Head Length (cm)Seed Head Biomass (g)Number of Spikelets/HeadSeeds/PlantSlope
(R-V)
4 SeptemberFELT 04/2013 (±1.0)Semi-erect 9.60 (±0.90)6.09 (±0.77)1.22 (±0.03)10.53 (±0.21)6521 (±770)0.045c
STURT16-1714 (±1.6)Semi-erect 9.46 (±0.22)6.72 (±0.25)0.74 (±0.08)9.46 (±0.25)5951 (±390)0.063 b
PARK 01/2015 (±1.3)Semi-erect 6.20 (±0.41)6.15 (±0.17)0.98 (±0.05)10.14 (±0.18)4390 (±415)0.061 b
GLEN 03/1817 (±1.0)Semi-prostrate 4.45 (±1.40)6.75 (±0.11)0.82 (±0.14)8.80 (±0.61)1969 (±600)0.008 c
4 NovemberFELT 04/2013 (±1.3)Erect 17.90 (±1.88)8.00 (±0.28)2.42 (±0.20)10.63 (±0.33)11112 (±1575)0.085 b
STURT16-1722 (±2.8)Erect 18.18 (±2.28)7.20 (±0.28)2.03 (±0.26)9.36 (±0.21)9875 (±1362)0.094 b
PARK 01/2024 (±1.8)Erect 3.50 (±0.55)6.05 (±0.11)1.10 (±0.45)10.36 (±0.20)8071 (±446)0.042 c
GLEN 03/1812 (±1.0)Semi-prostrate4.50 (±1.01)7.10 (±0.08)1.14 (±0.53)8.92 (±0.14)2937 (±1400)0.059 c
4 JanuaryFELT 04/2013 (±1.3)Erect12.12 (±1.50)6.90 (±0.18)2.19 (±0.14)13.00 (±0.50)9930 (±1232)0.233 a
STURT16-1713 (±1.7)Erect14.37 (±1.80)7.00 (±0.18)2.64 (±0.32)12.00 (±0.52)10867 (±1362)0.194 a
PARK 01/2013 (±1.4)Semi-prostrate15.00 (±1.01)6.68 (±0.18)3.56 (±0.35)13.00 (±0.35)16687 (±670)0.002 c
GLEN 03/1812 (±1.3)Erect12.00 (±2.0)6.30 (±0.16)2.98 (±0.18)13.00 (±0.908)12285 (±579)0.078 b
4 MarchFELT 04/2009 (±1.0)Semi-prostrate------
STURT16-1713 (±1.3)Semi-prostrate------
PARK 01/2014 (±1.2)Semi-prostrate------
GLEN 03/1811 (±11)Prostrate ------
p-value p = 0.004p = 0.0001p = 0.0002p = 0.0002p = 0.0001p = 0.0002p = 0.0003p = 0.0005
Slope (R-V) from the reproductive biomass that was regressed with the vegetative biomass using linear functions.
Publisher’s Note: MDPI stays neutral with regard to jurisdictional claims in published maps and institutional affiliations.

