Article

Mitigation of Greenhouse Gas Emissions with Biochar Application in Compacted and Uncompacted Soil

1
Faculty of Horticulture and Landscape Engineering, Institute of Landscape Engineering, Slovak University of Agriculture, 949 76 Nitra, Slovakia
2
Department of Soil Science, Faculty of Agrobiology and Food Resources, Institute of Agronomic Sciences, Slovak University of Agriculture, 949 76 Nitra, Slovakia
3
Faculty of Environmental Sciences, Czech University of Life Sciences Prague, Kamýcká 129, 165 21 Prague, Czech Republic
4
Dekonta, a.s., Dřetovice 109, 273 42 Stehelčeves, Czech Republic
5
School of Agriculture, Policy and Development, University of Reading, Reading RG1 1AF, UK
6
Department of Forest Management, Faculty of Forestry and Wood Sciences, Czech University of Life Sciences, 16 521 Prague, Czech Republic
*
Author to whom correspondence should be addressed.
Agronomy 2022, 12(3), 546; https://doi.org/10.3390/agronomy12030546
Submission received: 30 November 2021 / Revised: 17 January 2022 / Accepted: 18 February 2022 / Published: 22 February 2022

Abstract

:
Biochar may offer a substantial potential as a climate change mitigation and soil improvement agent; however, little is known about its effects in fertile soils subjected to standard agricultural practices. The aim of this short-term (60 days) lab experiment, under controlled temperature and soil moisture regimes, was to investigate the interaction between soil compaction and fertiliser and biochar addition in relatively fertile Luvisol. Three different biochar types and two soil compaction levels were investigated to describe their interactive effect on soil greenhouse gas emission (GHG). A very strong effect of soil compaction on N2O emission (+280%) and an interaction with biochar were found. The cumulative N2O emissions from the compacted soil were higher (from +70 to +371%, depending on the biochar type) than the uncompacted soil. Soil compaction resulted in a faster onset and a faster decrease of N2O production. Biochar did not affect the temporal dynamics of N2O evolution from either soil. The addition of digestate/crop biomass biochar has resulted in a significant increase in CO2 evolution both in compacted and uncompacted soils, compared to softwood from spruce (mixture of branches and wood chips) and wood pallets from softwood (spruce without bark) biochar. In the compacted soil, NH4+ availability was positively related to N2O efflux, and CO2 emission was positively correlated to both NH4+ and SOC content. An increase in GHGs as a result of an increase in NH4+ availability was seen both in compacted and uncompacted soils, while the rates of N2O emission were modified by biochar type. Our results show a strong interaction between biochar and soil conditions and a strong effect of biochar type on GHG emissions from agricultural soils.

1. Introduction

Agricultural soils are one of the most important anthropogenic sources of GHG emissions to the atmosphere [1]. According to the IPCC [2], agriculture generates 11% of global GHG emissions due to soil and nutrient management and livestock farming. Modern agriculture is characterised by its reliance on mechanised agronomic operations and intensive soil management practices. Heavy vehicular traffic accompanying these operations increases the risk of soil compaction in arable soils [3,4,5], with a consequent change in GHG emissions [6]. At the same time, soil compaction is among the most significant drivers of soil degradation [3,5,7]. Soil compaction strongly affects soil properties; soil particles are pushed together at the expense of pores. Thus, compaction decreases total porosity [8], lowers macroporosity and connectivity between pores [9], and limits plant root growth [10], and soil microbial activity [11]. The degree of soil compaction in a specific soil is affected by its texture [3,7], humic substances content [12], and the presence of soil water [13,14].
Soil compaction is a global environmental problem; its negative impact on the food production capacity of the world’s soils is especially prominent in arable soils [3,7] and in countries with mechanised agriculture [15]. In addition, several non-productive soil functions are also affected by its compaction. Modifying soil physical properties alters element mobility and changes nitrogen and carbon cycles, interfering with GHG emissions from soils, especially under wet conditions [3]. Hartmann et al. [16] reported that soil CO2 efflux was reduced by soil compaction due to the reduction of carbon mineralisation in anaerobic conditions. On the other hand, limited soil aeration as a result of soil compaction decreases methanotrophic activity and enhances methanogenic activities [17].
Many strategies have been proposed and tested to avoid or alleviate soil compaction in agricultural fields [7]. An innovative solution that may concurrently reduce GHG emissions is the application of biochar. This could be especially effective in intensively managed soils with severe loss of organic carbon and where the mechanical working of the soil compromised soil structure. Biochar has various distinctive properties which potentially contribute to making it an effective, economic, and sustainable approach for soil carbon sequestration [18]. Biochar has already been identified as a potential agronomic tool for improving soil fertility [19,20,21,22,23,24], and at the same time it can reduce GHGs [25]. Biochar is often proposed as a useful GHG sequestration tool due to its recalcitrance [26]. Raw biochar has a proven ability to store carbon in the soil [27]. Enriched biochar [28] or biochar substrates [29,30] have been shown to increase it further. The application of biochar and enriched biochar reduced net nitrification by 81% and 94%, ammonification by 48% and 74%, and carbon dioxide by 50% and 92%, respectively, compared to control. Šimanský et al. [29] reported that in sandy soil, the biochar substrates at rate of 20 t ha−1 increased the sum of basic cations (by +112%) and CEC (by +93%) compared to the control.
Biochar is an organic material with a lower specific weight than soil, its application is thus likely to reduce the bulk density of the soil [22,31,32,33]. Several studies have shown a positive effect of biochar application on soil structure. Biochar is a porous material; its application increases the overall porosity of the soil [31]. This is likely to benefit crop growth [34,35]. Tying these observations together, biochar application to a compacted soil should increase its aeration and thus enhance aerobic microbial respiration. The balance of GHG emitted from the soil may thus shift as a result of biochar application, away from the products of anaerobic respiration and towards CO2. Little information is available about this process, there is an indication that the biochar application rate, length, and time of residence in the soil may affect the outcome [36]; in combination with mineral fertilisers [37] or its activation during the production process [38].
This study aimed to evaluate the effects of two factors on GHG emissions from agricultural soil: biochar addition and soil compaction. Current literature indicates that biochar could counteract some of the negative effects of soil compaction. Specifically, we hypothesise that (H1) soil compaction lowers overall GHG emission (N2O, CO2) as a result of limiting gas flux through soil pores, (H2) biochar addition lowers GHG emissions by stabilising soil C and N compounds, and (H3) different types of biochar vary in their GHG mitigation potential.

2. Materials and Methods

2.1. Materials and Mesocosm Setup

The soil used in this laboratory experiment was collected in November 2020 from the plow layer of an agricultural field in Kostelec nad Ohří (50°23′ N and 14°05′ E), Czech Republic. The soil was collected from the 0–20 cm layer from a single location, it contained 20.5% of sand, 52.5% of silt, and 27% of clay and was classified as loamy Luvisol [39]. The soil had 12.1 g kg−1 of SOC on average, its pH (KCl) was 6.0, and the bulk density (BD) was 1.49 g cm−3. The soil was homogenised, air-dried at 22 °C for 7 days, and finally sieved through a 10 mm sieve to remove larger debris and coarse materials to prepare the soil substrate for the experiment.
This study used three different biochars, pyrolyzed from different feedstocks by varying methodologies (Table 1). A mesocosm experiment was set up in a complete factorial design with 5 replicates per treatment for GHGs measurements and another set of 6 replicates per treatment for soil properties measurements. All treatments featured the addition of the equivalent of 70 kg N ha−1 to mimic typical arable farm soil management. Mesocosms were established by filling 1000 cm3 polypropylene buckets (surface area: 70.9 cm2, height: 14.3 cm) with 0.7 kg of dry soil. They were pre–incubated for 7 days until the initial flush of CO2 flux decreased to the background level. After that, four soil treatments were established, one with N addition only (NPK 15:15:15) and three with the addition of N and a specific type of biochar (B1, B2, and B3) at the rate corresponding to 30 t ha−1.
Each set of treatments (set for GHGs measurements and set for soil properties measurements) was established twice to test compacted and uncompacted soil. In loamy soils such as those used here, optimal bulk density (BD) values range from 1.1 to 1.3 t m−3. The critical BD value indicating soil compaction in loamy soils is 1.45 t m−3 [40]. At this BD, the physical condition deteriorates to such an extent that the growth of plant roots is limited, resulting in a reduction in crop yield. Correspondingly, the first series of mesocosms was set up to represent compacted soil as sampled in the field, with an average BD of 1.49 g cm−3. Adequate mass of soil was weighed into each mesocosm and then manually compacted to the required volume. The second series of mesocosms featured uncompacted soil at 1.02 g cm−3, simulating uncompacted conditions after the tillage of the soil. Soil water content of 18% by weight was established to represent the mean water content in field conditions at the agricultural field in Kostelec nad Ohří during the vegetation period. Soil water content was adjusted gravimetrically after each air sampling event throughout the experiment.

2.2. Incubation Experiment and Soil Analysis

The 60-day incubation experiment was carried out at a constant room temperature of 22 °C, and all mesocosms were left open throughout the experiment and kept in the dark to prevent potential autotrophic C fixation. Half of the mesocosms were randomly allocated to the gas flux observations, while the other half were assigned to soil sampling. For the GHG emission mesocosms, the headspace of each bucket was hermetically closed during the time of observation by a polypropylene lid equipped with a rubber septum. Direct fluxes of N2O and CO2 from the soils were then measured by a variation of the closed chamber technique [41]. Air samples were taken four times during the first week, then two to three times a week for three weeks, and then once a week for four weeks. In total, there were 16 measurement episodes during the experiment. Mesocosm lids were closed for 30 min, and air samples from each mesocosm were collected using an air-tight syringe (Hamilton, Bellefonte, PA, USA) through the rubber septa. Air samples were immediately transferred to hermetically close pre-evacuated 10 mL glass vials (Labco Exetainer, Lampeter, UK). A gas chromatograph (Shimadzu GC-2010 Plus, Kyoto, Japan) was used, fitted with an electron capture detector (ECD) for N2O and a thermal conductivity detector (TCD) for CO2 analysis. The chromatograph was calibrated using three certified standard gas mixtures (N2O, CO2, and N2) in the expected concentration range. Daily and cumulative N2O and CO2 fluxes were then calculated [42].
Samples were collected from the soil sampling mesocosms on the first day and then every 10–14 days throughout the experiment: 6 times throughout the experiment, each mesocosm was destructively sampled only once. We used a 2 cm diameter corer to take three subsample cores, these were mixed together to create a single composite sample per mesocosm. Samples were then analysed for soil mineral N (NO3, NH4+) content, soil pH (KCl), and soil organic carbon (SOC). Inorganic forms of N (NH4+ and NO3) was isolated in 1% K2SO4 as described by Yuen and Pollard [43] and determined using the calorimetric spectrometer method (WTW SPECTROFLEX 6100, Weilheim, Germany). The SOC was estimated by the Tyurin wet oxidation method using a mixture of 0.07 mol dm−3 of H2SO4 and K2Cr2O7 with titration using 0.01 mol dm−3 of Mohr’s salt [44]. Soil pH was measured potentiometrically in 1 mol dm−3 KCl (1 g soil to 2.5 mL KCl) using a pH meter (HI 2211, HANNA Instruments, Smithfield, RI, USA).

2.3. Statistical Analyses

A mesocosm was the unit of replication in this study; all observations carried out within a mesocosm were averaged to this level. GHG emission data were examined by fitting a series of models to the timeline of gas measurements and then choosing the best-fitting model (second-order polynomial, apart from cumulative N2O data where exponential plateau was fitted). The cumulative totals of CO2 and N2O emissions were used to compare the treatments. A two-way ANOVA was performed where biochar type was nested within soil compaction. All data were tested for ANOVA assumptions (Levene and Shapiro–Wilk test), no correction was necessary. Where an overall significant effect of biochar or compaction was detected, a post-hoc pairwise comparison with Bonferroni correction was performed. Statistical significance of effects is reported at p < 0.05. Simple and multiple linear regression models were used to assess the contribution of selected soil parameters to GHG emissions. Mean values per treatment were used for each data point for gas and soil variables (n = 24), not allowing for comparison of biochar type.

3. Results

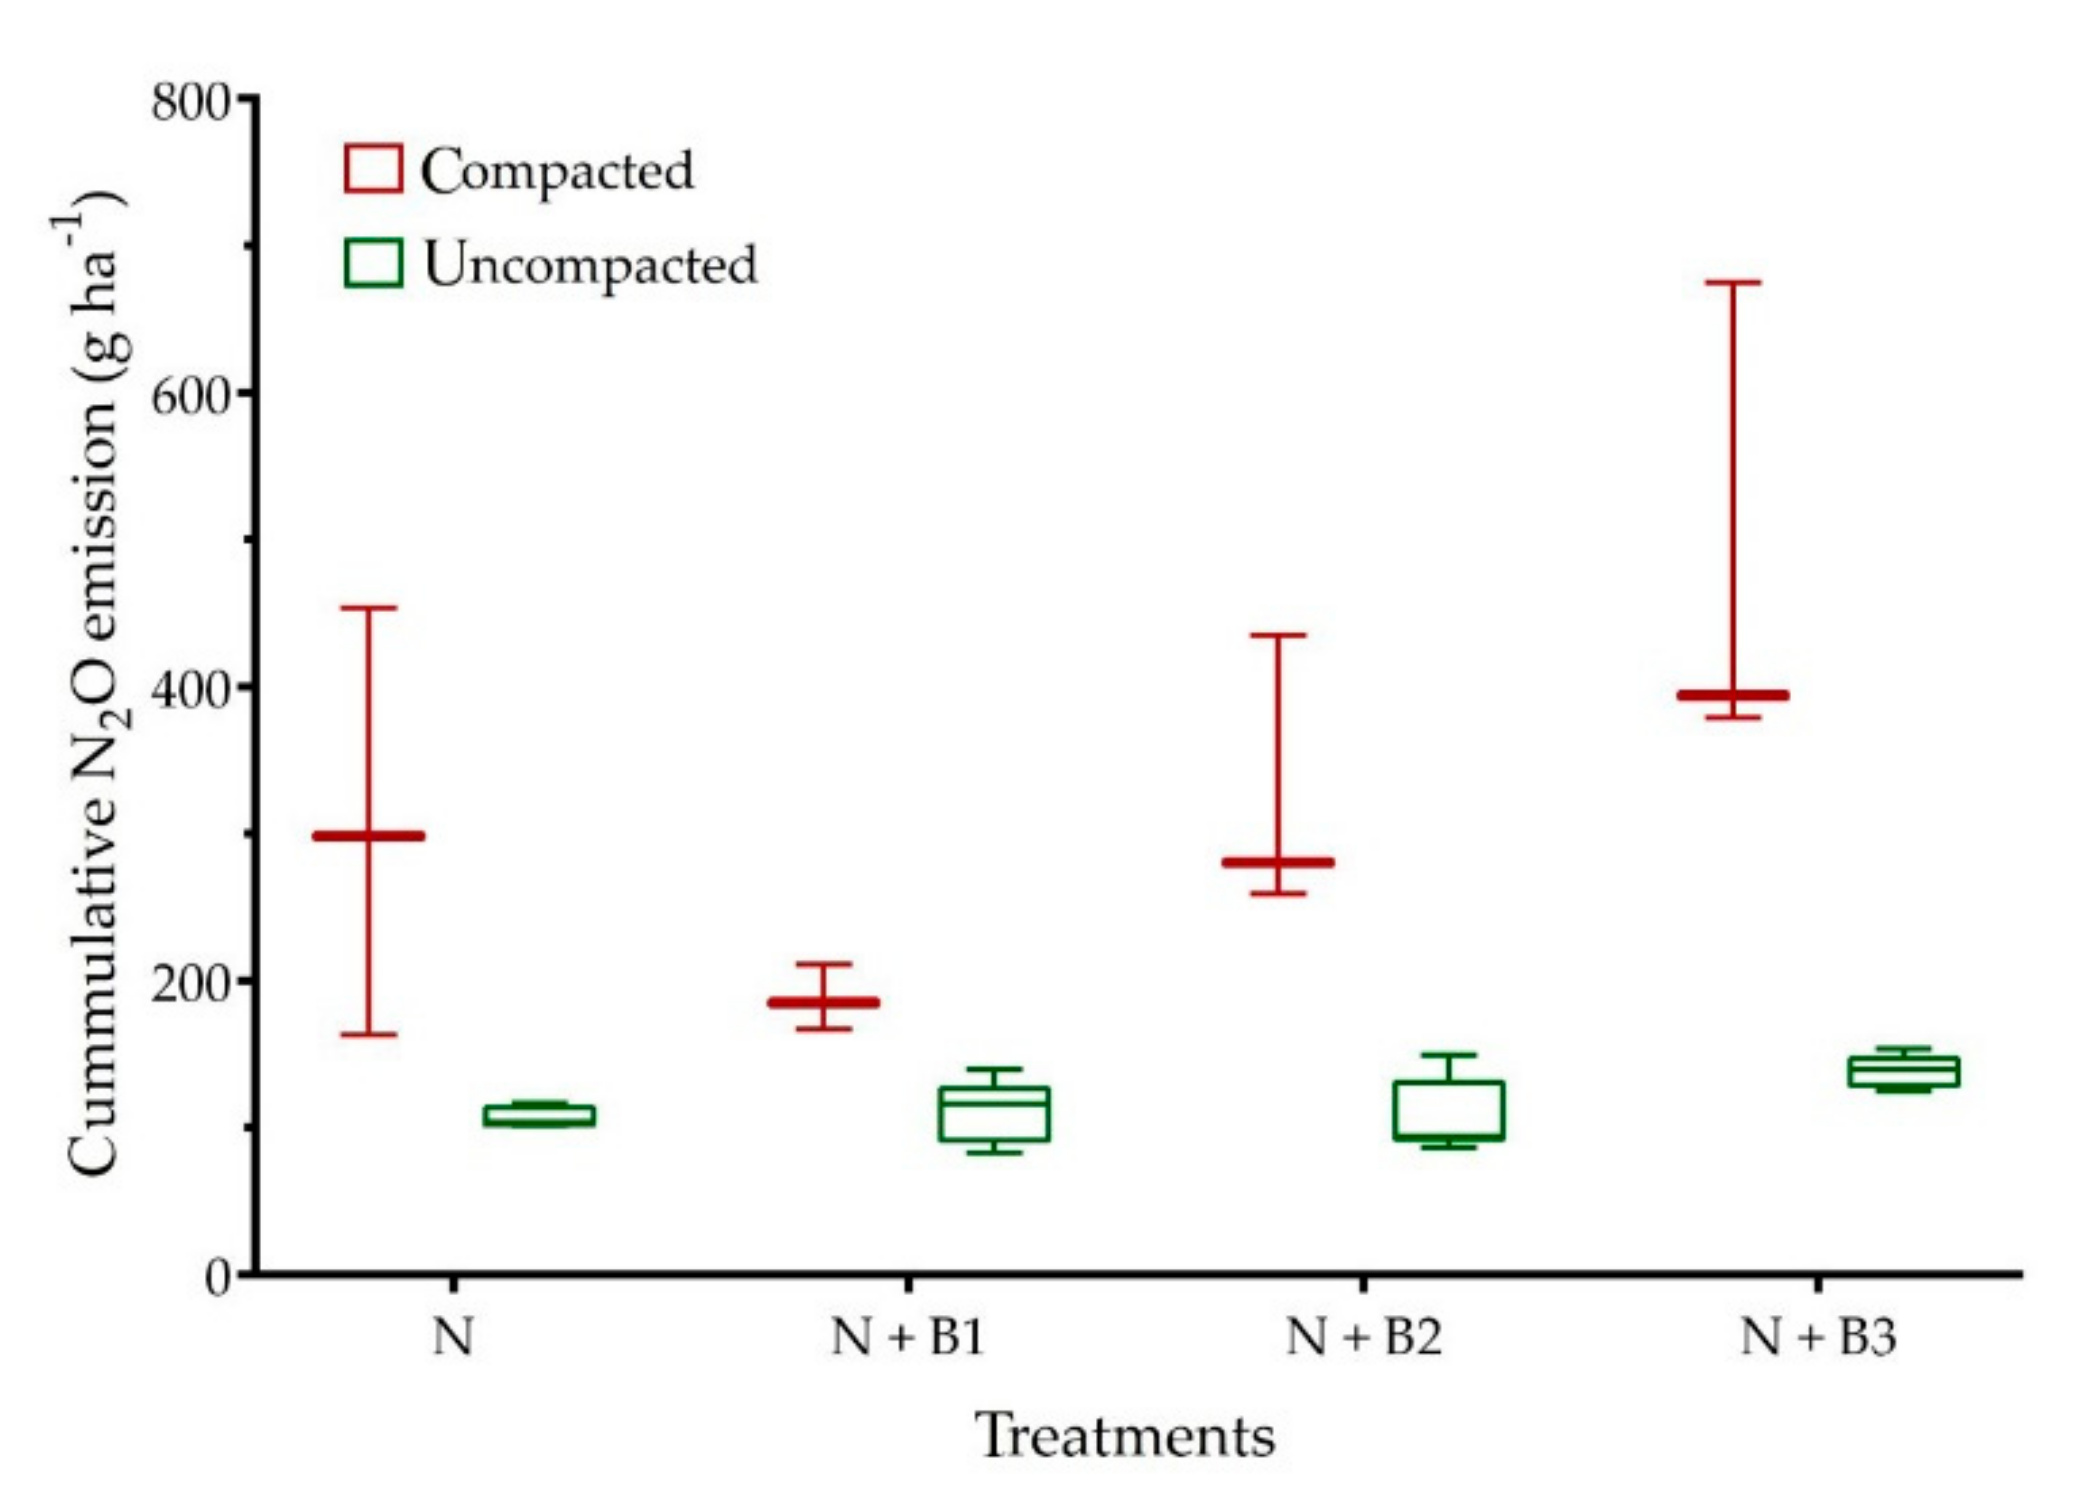
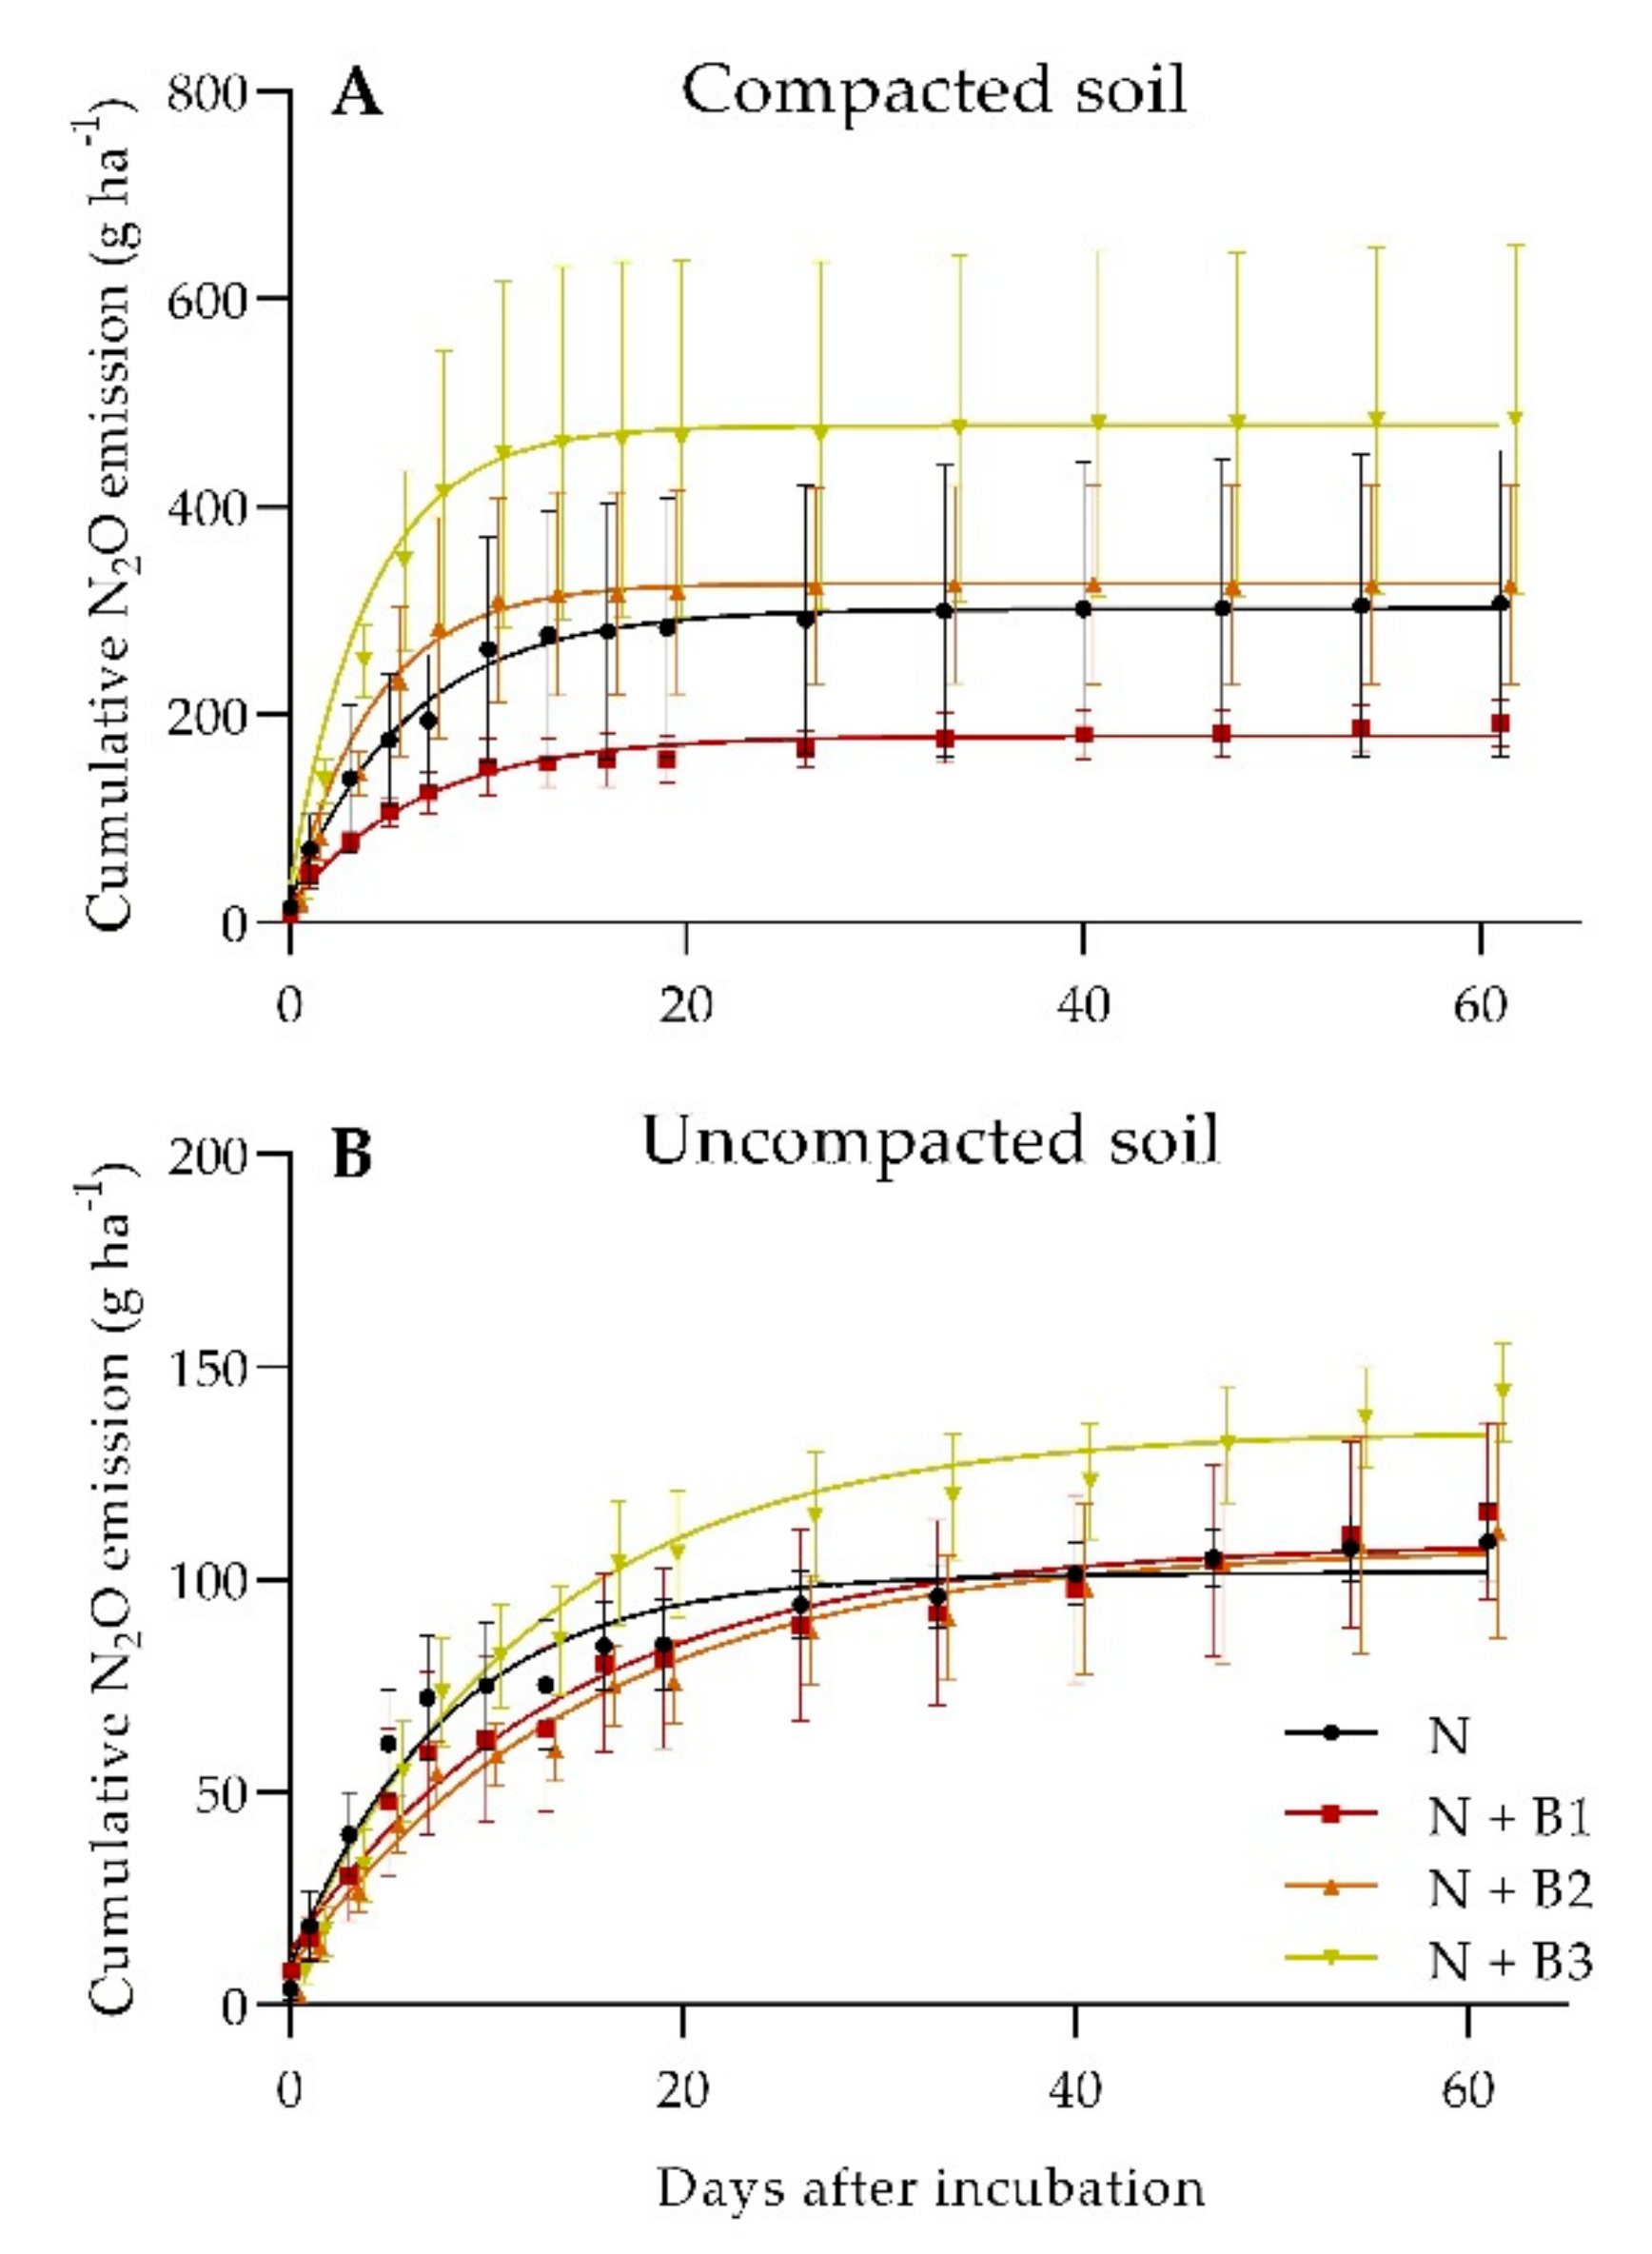
3.1. Effects of Soil Compaction and Biochar on N2O Emission

We found a very strong positive effect of soil compaction on N2O emission, as well as interaction with biochar. The cumulative N2O emissions were about three times higher in the compacted soil than in the uncompacted soil (p < 0.001, Figure 1). Biochar addition did not have an overall effect on N2O emission (p = 0.317). We saw a significant difference in the production of N2O as a result of biochar type only in compacted soils (p = 0.047). Looking at the pairwise comparisons, we did not find any difference between the effects of biochar type on N2O emissions.
Figure 2 shows the temporal dynamics of cumulative N2O emissions over the observed period. As well as higher totals, the compacted soil is characterised by a faster onset and faster decrease of N2O production. The evolution of N2O reached 90% of its final value on day 16 of the experiment, whereas on average, it took 36 days to reach this threshold in the uncompacted soil. Interestingly, biochar did not affect the temporal dynamics of N2O production from either soil compaction type.

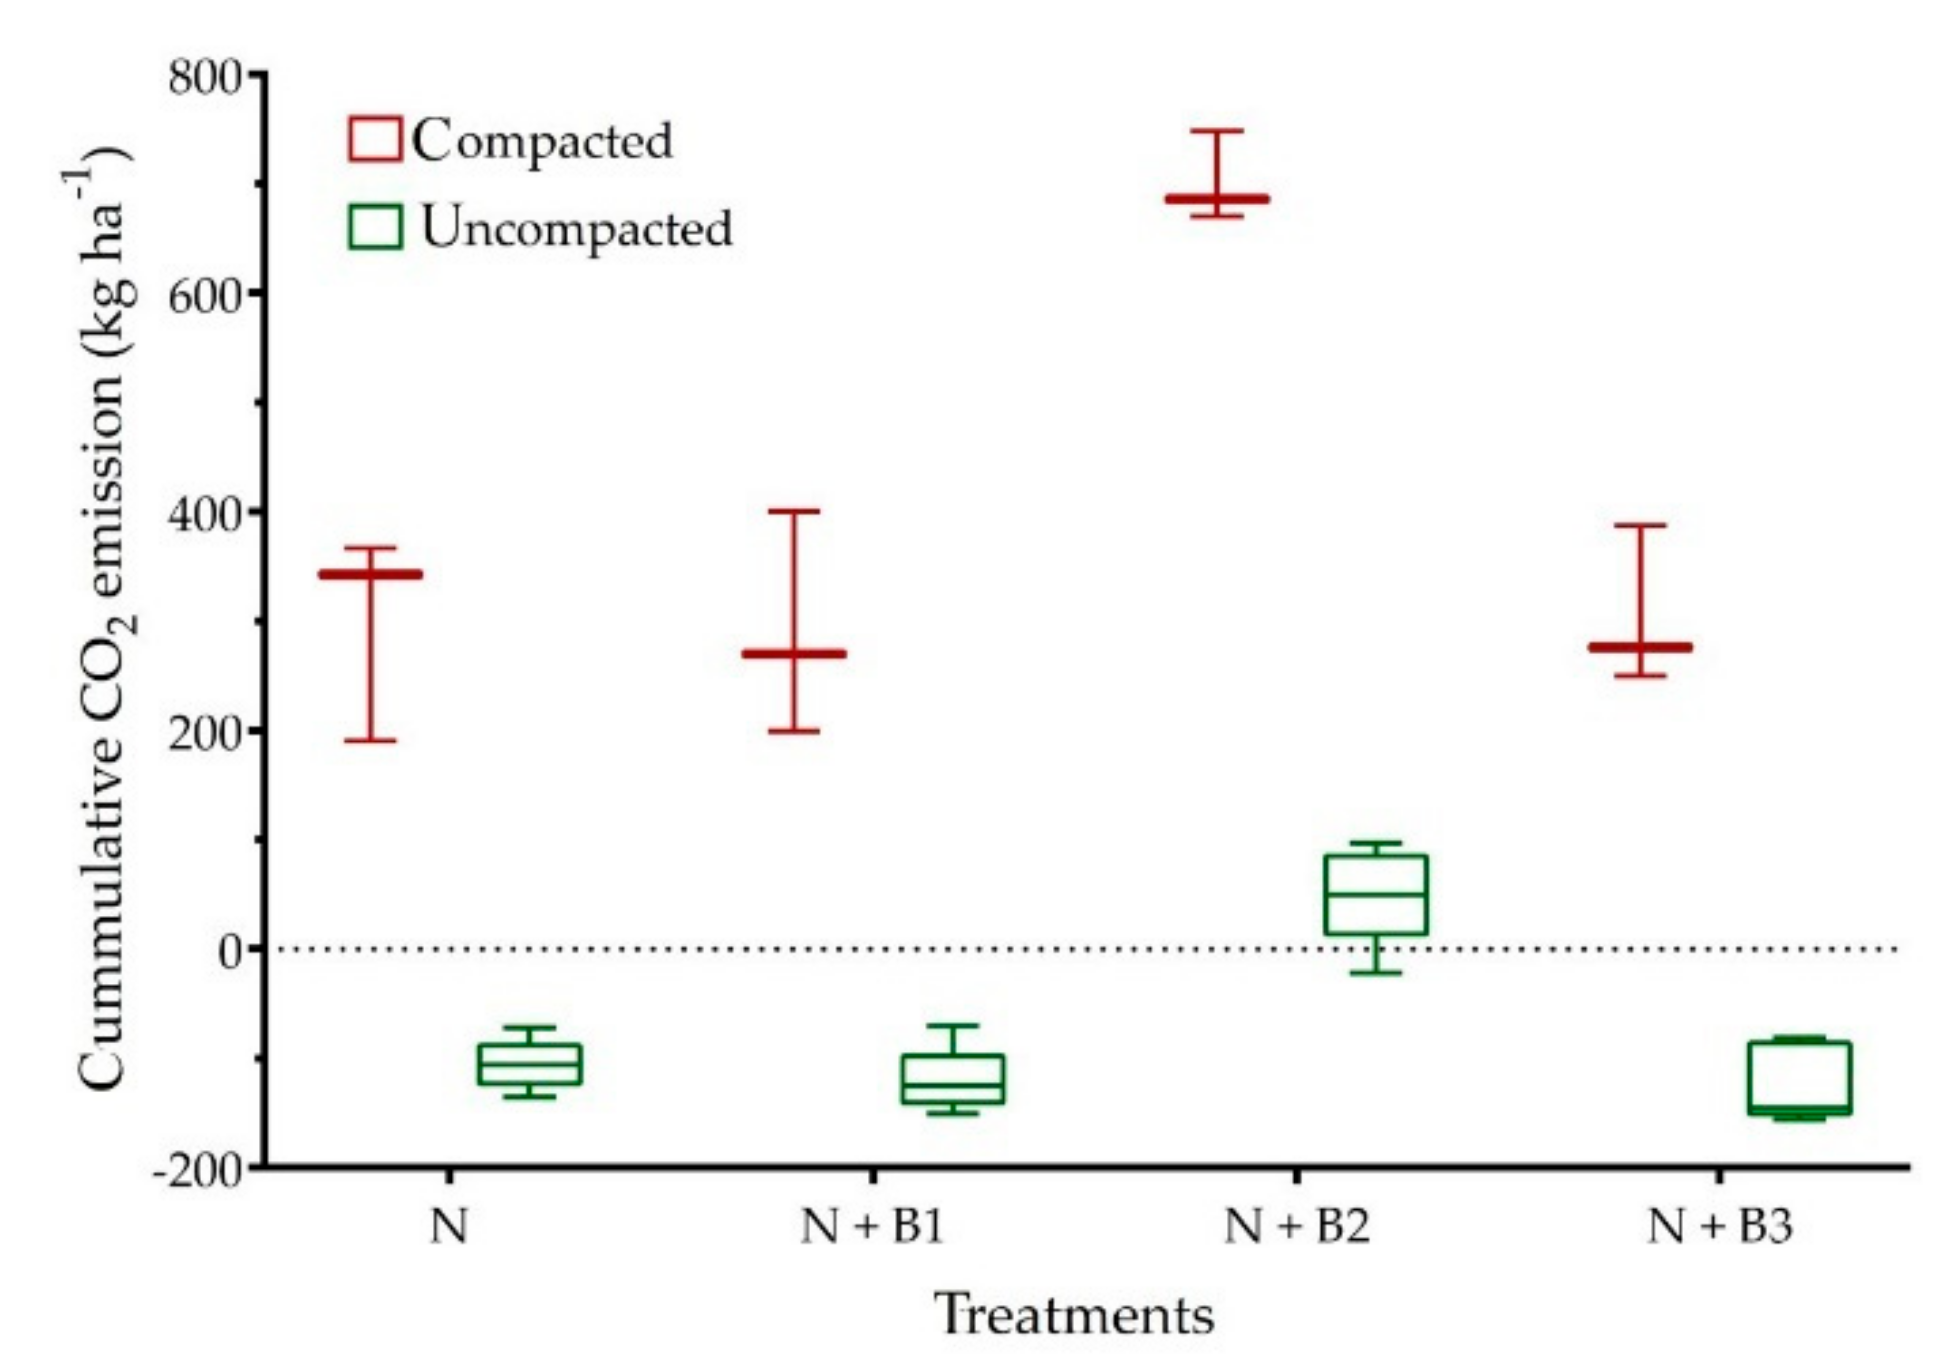
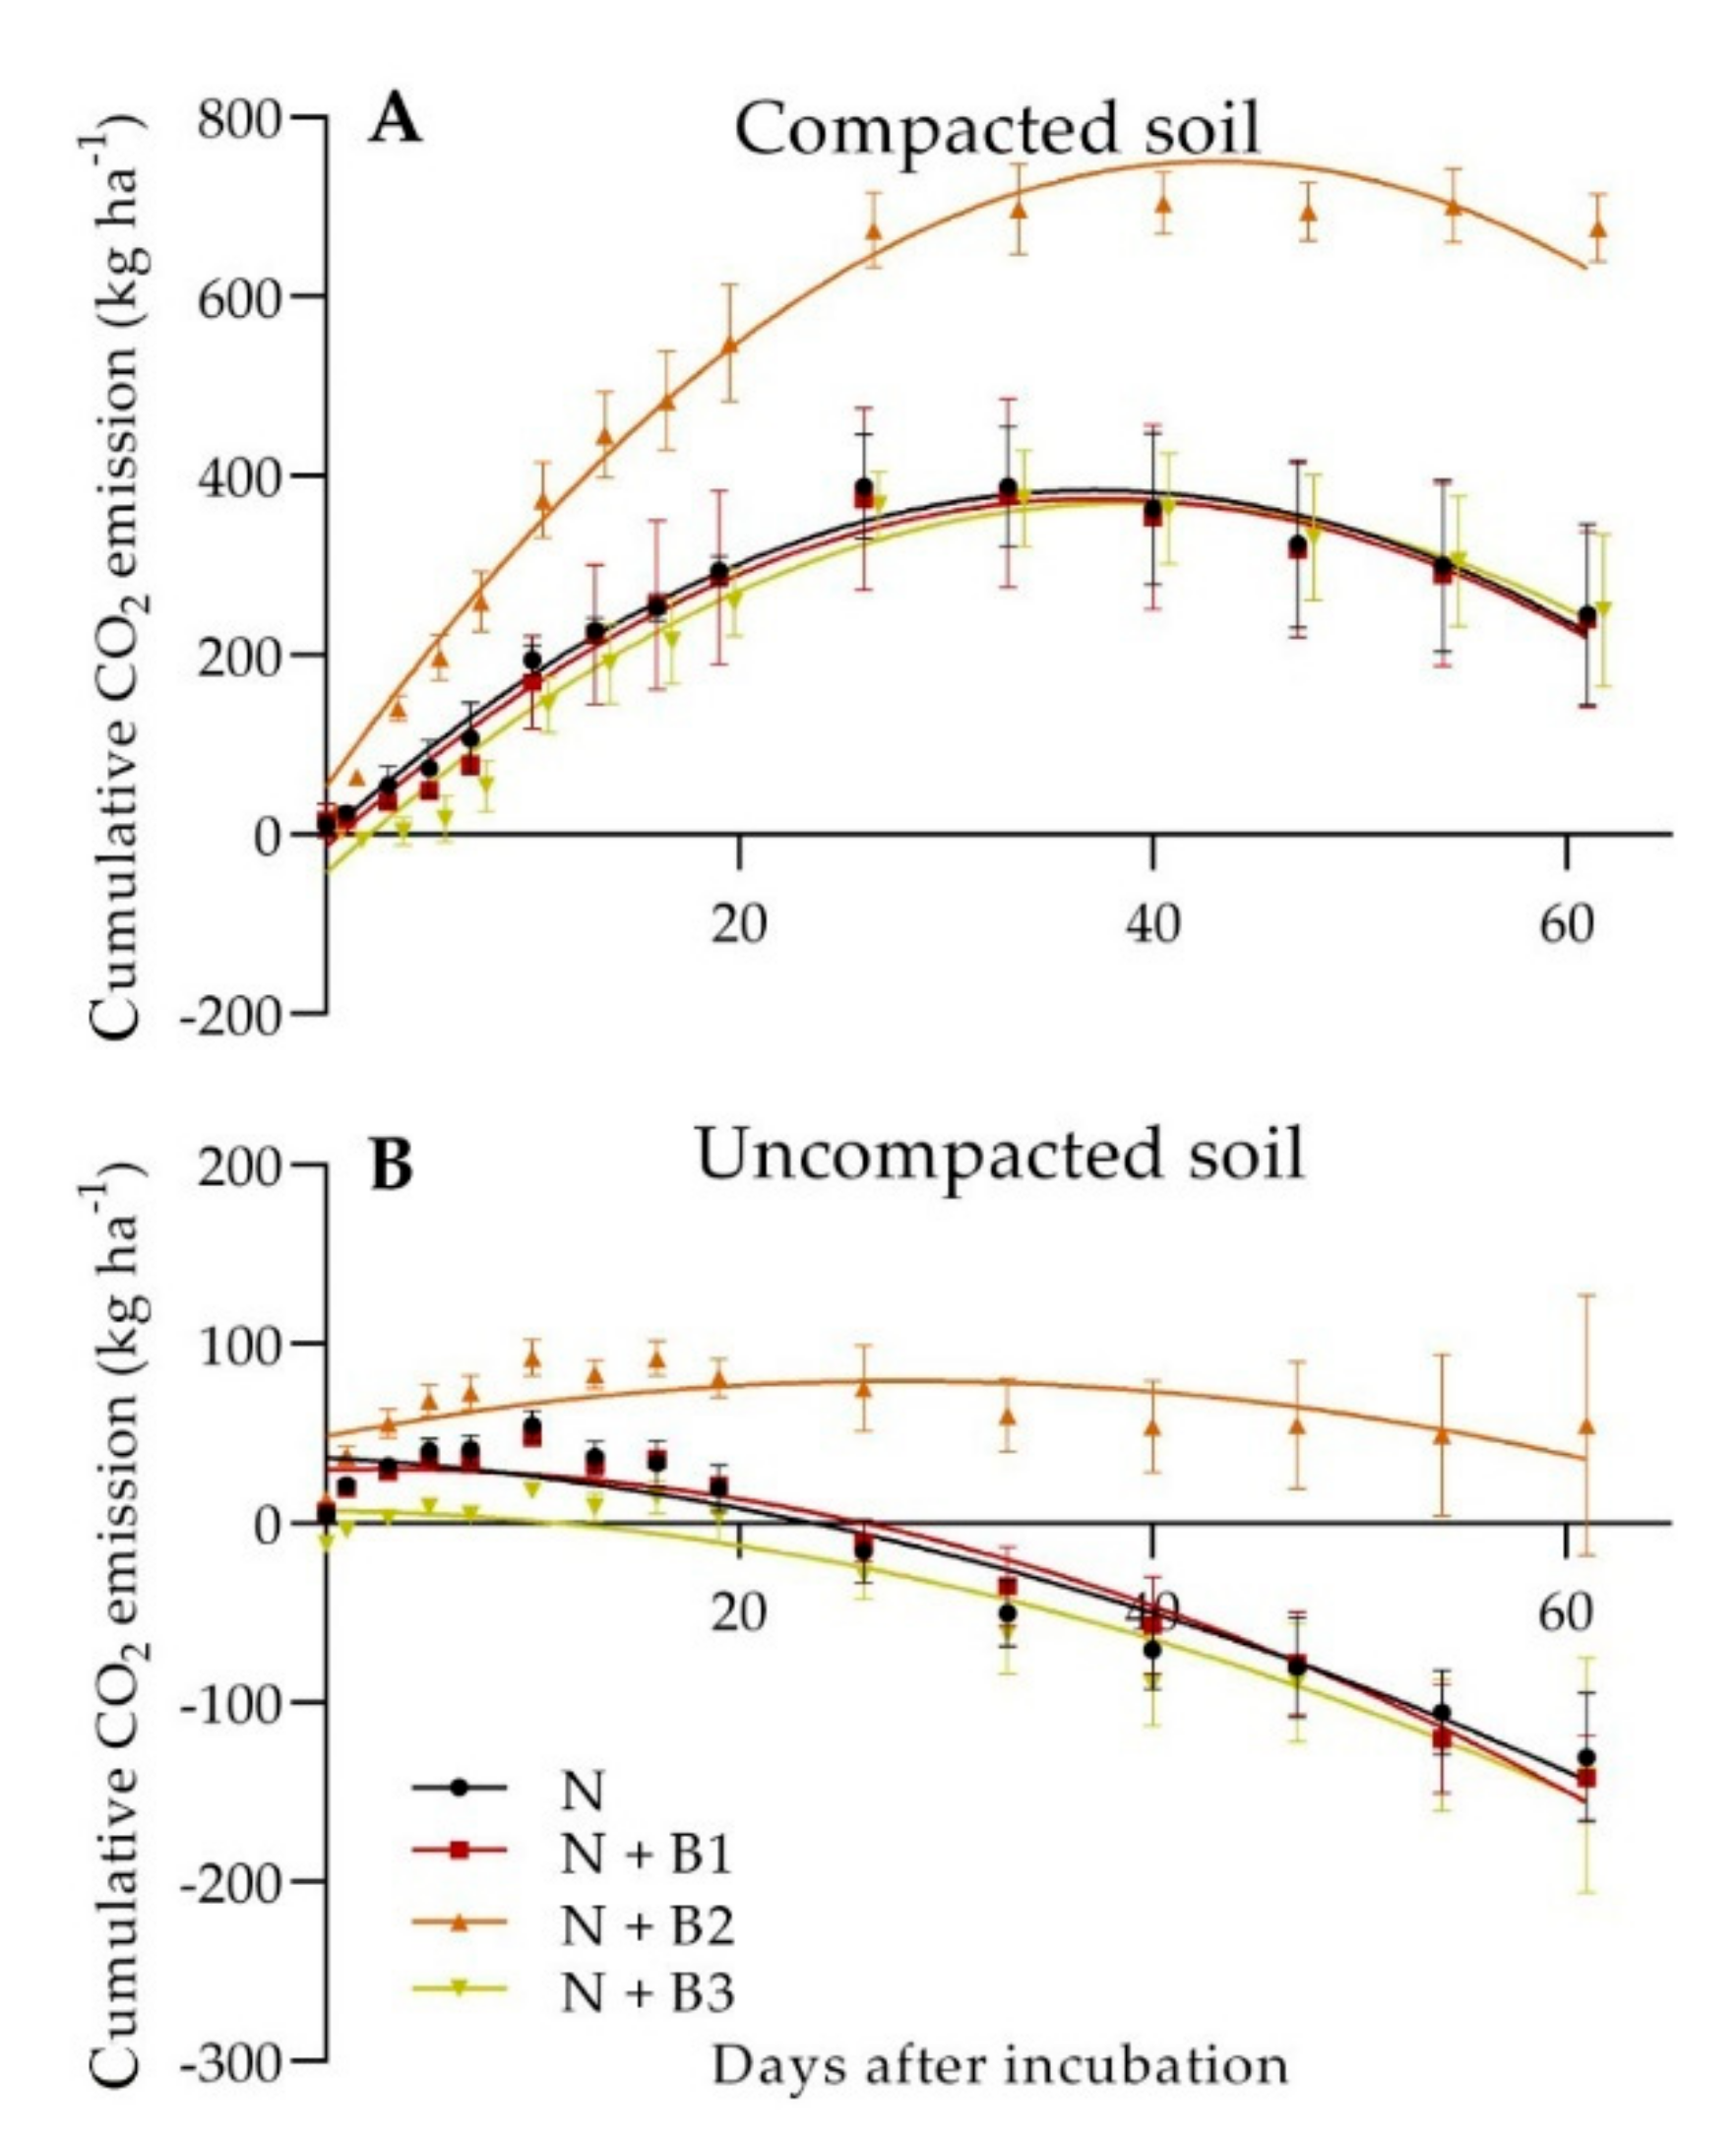
3.2. Effects of Soil Compaction and Biochar on CO2 Emission

In contrast to N2O, we found a very strong effect of biochar type on CO2 production. Adding N + B1 and N + B3 did not affect cumulative CO2 production when compared to the no biochar treatment (N) in either compacted or uncompacted soil. Mixing N + B2 into the soil, however, has resulted in a significant increase of CO2 evolution both in compacted (p < 0.001) and uncompacted (p = 0.005) soils (Figure 3). In compacted and uncompacted soil under N + B2 treatments, the overall cumulative increase in CO2 was 233% and 40% higher than the N-only treatment. We also observed a significant effect of soil compaction (p < 0.001), in the uncompacted soil. All except the N + B2 treatment acted as a CO2 sink very shortly after the start of the experiment. Interestingly, as can be seen in Figure 4, all treatments consumed CO2 by the end of the experiment.

3.3. Relationships between Greenhouse Emissions and Soil Properties

We investigated the relationships between key soil parameters (pH, NH4+, NO3, and SOC) and the emission of GHGs. Multiple regression models did not indicate any capacity of these four soil parameters to predict either N2O or CO2 emission from uncompacted soil (Table 2 and Table 3). In compacted soil, on the other hand, we found that NH4+ availability had a positive relationship with N2O efflux (p < 0.05). In addition, CO2 emission from compacted soils was positively affected by both NH4+ and SOC (p < 0.05).
Simple linear relationships between CO2, N2O, and soil parameters were also constructed (Table 4 and Table 5). The model fits between N2O and soil properties were more accurate than in the case of CO2. N2O emissions were reduced by increasing soil pH. The intensity of the relationship was influenced by the type of biochar itself but also by soil compaction (Table 4). In all biochar treatments in compacted or uncompacted soils, N2O emissions increased linearly as a result of increasing NH4+ in the soil. In uncompacted soil and in N + B1, N + B2, and N + B3 treatments, N2O emission increased for each 1 g kg−1 NH4+ by 6.09, 3.05, and 3.71 mg kg−1 soil, respectively. In compacted soil, the same trend was observed, however, the rates of increase were significantly lower. CO2 emissions increased due to increasing NH4+ content in both compacted and uncompacted soil (except N + B3 in uncompacted soil) (Table 5). Interestingly, greater SOC as a result of biochar application did not affect either N2O (except N + B2) or CO2 emissions.

4. Discussion

4.1. Soil Compaction, Biochar Addition, and GHG Emission

Soil compaction alters soil structure and hydrology, chiefly by changing the physical arrangement of soil aggregates. In turn, alteration of soil physics in arable soil influences root and shoot growth and consequently crop production [7]. If soil properties change as a result of the compaction, the flux of GHGs is likely to change; the suggestion is confirmed by our results (Figure 1 and Figure 3). Changes in GHG production and efflux are linked to changes in soil structure and physical properties [45]. Clearly a negative factor, soil compaction can be reduced mechanically or through the addition of manures and various organic additives such as biochar. Organic material particles typically are less dense than compacted mineral soil, and their application to the soil reduces the bulk density of the soil [31,32,33,46]. Organic material also supports the formation of the soil structure and increase of the porosity [34,47]. Tullberg et al. [48] reported that soil compaction affects GHG emissions, N2O production in compacted soil was increased by 30–50% compared to uncompacted soil. In our case, the average cumulative production of N2O was increased by 70–371% as a result of compaction (Figure 1 and Figure 2). Our results also show that the application of different types of biochar affects the production of GHGs to a varying degree. The onset and the subsequent dynamics of GHG emission depend on the availability of more easily degradable organic substances in the soil–biochar complex [49,50]. The porosity of biochar itself and its ability to form soil aggregates and pores [33,34] can support aeration, which reduces N2O production through nitrification [51]. Biochar can reduce the emission of N2O from the soil into the atmosphere via adsorption of NH3 [26] and decrease the inorganic N pool by enhancing the activity of nitrifiers [52]. On the other hand, if the soil is saturated with water, the soil pores and the pores of biochar itself (biochar is not part of soil aggregates), are filled with water, and an anaerobic environment is created. Such conditions typically lead to increased denitrification and subsequent N2O emissions [48]. Biochar properties affect its interaction with the soil and affect the GHG balance of the system [53]. For example, higher pyrolysis temperatures contribute to incorporating C and N into aromatic and heterocyclic rings and reducing mineralisation, and thus their availability once applied to the soil [54]. Conversely, a final product of pyrolisation conducted at a lower temperature is characterised by higher mineralisation in the soil [55].
In the case of CO2 emissions, soil quality seems to be one of the most fundamental factors: more fertile and healthier soils seem better at C sequestration than their less productive counterparts [56]. Healthier, more productive soil is typically richer in stable SOM, which is less prone to oxidation and contributes to the chemical bonding capacity of the soil. This observation is likely is confirmed by our findings in uncompacted soil (Figure 4). We used Luvisol, which usually denotes a highly fertile but very intensively used soil, subjected to extensive cultivation, fertilization, or liming [57]. As suggested by our results, an important factor influencing GHG emission could be the interaction between compaction and the type of biochar. Biochar surface contains functional groups which favour the adsorption of simple dissolved organic compounds and NH4+ ions, thus providing a suitable microbial habitat [58]. The CO2 flux showed a decreasing trend in all soils, but especially so in uncompacted soil (Figure 4). This is usually attributed to decreasing substrate accessibility to microorganisms [59,60]. Here, biochar may stimulate microbial activity by providing a steady supply of organic compounds and nutrients. For example, biochar B2 was produced from 35% corn digestate residues, 35% cereal straw, and 30% green compost at lower temperatures compared to B1 and B3. B2 was also characterised by the highest macronutrients content, the narrowest C:N ratio, and the lowest specific surface area. The stimulating effect of B2 addition on microbe respiration and subsequent CO2 emission was very clear in our study. Faster mineralisation of biochar was observed when it was produced at lower pyrolysis temperatures from grass biomass [55], whereas biochar produced at higher temperatures from wood materials had lower mineralisation rate [61]. Finally, we observed negative CO2 emissions in our mesocosms. The growth of soil algae can sequester CO2 from the atmosphere, we did not observe algal growth in our mesocosms, however this process cannot be entirely ruled out. The other likely process driving CO2 sequestration in the soil in our mesocosms is the dissolution of CO2 in deionised soil water used to maintain stable soil moisture [60].

4.2. Relationships between Greenhouse Emissions and Soil Properties

It is evident from our observations that finding a uniform mechanism affecting GHGs in soils at different levels of compaction and after the application of different types of biochar is not straightforward. Multiple regression models did not indicate any capacity of soil pH, NO3, NH4+, and SOC to predict N2O or CO2 emission from uncompacted soil. On the other hand, in compacted soil, NH4+ had a positive relationship with N2O, while CO2 emission was positively affected by both NH4+ and SOC. An increase in CO2 emissions as a result of increasing NH4+ in the soil was confirmed by our linear model in both compacted and uncompacted soil, while the rates of N2O emissions efflux depend on biochar type. Observations published by Balashov [62] suggest that a very strong factor influencing GHG emissions is the filling of soil pores with water forcing a switch between anaerobic and aerobic conditions in soils. Horák et al. [63] stated that the soil pH, but also the NH4+ content, have a major effect on increasing N2O emissions in particular since soil pH exerts control over the N2O:N2 ratio during denitrification [64] which was partially confirmed in a few treatments (Table 2 and Table 3).

5. Conclusions

Our results suggest that some biochar types offer the promise of mitigating GHG emissions from agricultural soils, however, the effects can be different in compacted and uncompacted soils. None of the biochar types tested in this experiment affected N2O emissions in either compacted or uncompacted soils. Soil compaction significantly enhanced both N2O and CO2 emission from Luvisol used in this experiment. In addition, biochar produced from a combination of digestate and crop biomass strongly increased CO2 production in both compacted and uncompacted soils. Clearly, more research into the interactive effects of biochar and soil properties on GHG emissions must be conducted before the GHG benefits of large-scale application of biochar to arable soils can be recommended.

Author Contributions

Conceptualisation, J.H., V.Š. and M.L.; Methodology, J.H., T.K., T.H. and L.T.; Software, M.L.; Formal analysis, J.H., V.Š. and M.L.; Investigation, J.H., V.Š. and T.K.; Resources, J.H. and T.H.; Data curation, J.H., V.Š. and M.L.; Writing—original draft preparation, J.H., V.Š. and M.L.; Writing—review and editing, J.H., V.Š.; M.L., T.K., L.T. and T.H.; Visualisation, T.K. and V.Š.; Supervision, J.H. and V.Š.; Project administration, J.H., L.T. and T.H.; funding acquisition, L.T. and T.H. All authors have read and agreed to the published version of the manuscript.

Funding

Research was supported by the Ministry of Education, Youth and Sports of the Czech Republic within project SWAMP—Responsible water management in built-up areas in relation to the surrounding landscape (CZ.02.1.01/0.0/0.0/16_026/0008403) and partially supported by the Cultural and Educational Grant Agency MŠVVaŠ SR (KEGA) project no. 019SPU-4/2020 and the Slovak Grant Agency (VEGA) project no. 1/0116/21. M.L. received support from the European Social Fund EVA 4.0 (OP RDE, CZ.02.1.01/0.0/0.0/16_019/0000803).

Institutional Review Board Statement

Not applicable.

Informed Consent Statement

Not applicable.

Data Availability Statement

The datasets generated during and/or analyzed during the current study are available from the corresponding author on reasonable request.

Conflicts of Interest

The authors declare no conflict of interest. The funders had no role in the design of the study; in the collection, analyses, or interpretation of data; in the writing of the manuscript, or in the decision to publish the results.

References

  1. Wang, Q.; Zhou, F.; Shang, Z.; Ciais, P.; Winiwarter, W.; Jackson, R.B.; Tubiello, F.; Janssens-Maenhout, G.; Tian, H.; Cui, X.; et al. Data driven estimates of global nitrous oxide emissions from croplands. Natl. Sci. Rev. 2020, 7, 441–452. [Google Scholar] [CrossRef] [PubMed] [Green Version]
  2. Intergovernmental Panel on Climate Change (IPCC). Climate Change and Land: An IPCC Special Report on Climate Change, Desertification, Land Degradation, Sustainable Land Management, Food Security, and Greenhouse Gas Fluxes in Terrestrial Ecosystems; IPCC: Geneva, Switzerland, 2019. [Google Scholar]
  3. Nawaz, M.F.; Bourrié, G.; Trolard, F. Soil compaction impact and modelling. A review. Agron. Sustain. Dev. 2013, 33, 291–309. [Google Scholar] [CrossRef] [Green Version]
  4. Balashov, E.; Pellegrini, S.; Bazzoffi, P. Effects of repeated passages of a wheeled tractor on some physical properties of clayey loam soil. Acta Hortic. Regiotect. 2021, 24, 109–116. [Google Scholar] [CrossRef]
  5. Voltr, V.; Wollnerová, J.; Fuksa, P.; Hruška, M. Influence of tillage on the production inputs, outputs, soil compaction and GHG emissions. Agriculture 2021, 11, 456. [Google Scholar] [CrossRef]
  6. García-Marco, S.; Ravella, S.R.; Chadwick, D.; Vallejo, A.; Gregory, A.S.; Cárdenas, L.M. Ranking factors affecting emissions of GHG from incubated agricultural soils. Eur. J. Soil Sci. 2014, 65, 573–583. [Google Scholar] [CrossRef]
  7. Gürsoy, S. Soil Compaction Due to Increased Machinery Intensity in Agricultural Production: Its Main Causes, Effects and Management. In Technology in Agriculture; Fiaz, A., Muhammad, S.E., Eds.; IntechOpen: London, UK, 2021; Available online: https://www.intechopen.com/chapters/77140 (accessed on 14 June 2021).
  8. Riggert, R.; Fleige, F.; Kietz, B.; Gaertig, T.; Horn, R. Stress distribution under forestry machinery and consequences for soil stability. Soil Sci. Soc. Am. J. 2016, 80, 38. [Google Scholar] [CrossRef]
  9. Horn, R.; Doma, H.; Sowiska-Jurkiewicz, A.; Van Ouwerkerk, C. Soil compaction processes and their effects on the structure of arable soils and the environment. Soil Tillage Res. 1995, 35, 23–36. [Google Scholar] [CrossRef]
  10. Goutal, N.; Bottinelli, N.; Gelhaye, D.; Bonnaud, P.; Nourrisson, G.; Demaison, J.; Brêthes, A.; Capowiez, Y.; Lamy, F.; Johannes, A.; et al. Le suivi de la restauration du fonctionnement de deux sols forestiers après tassement dans le Nord Est de la France. Étude et Gestion des Sols 2013, 20, 163–177. Available online: https://www.afes.fr/wp-content/uploads/2017/09/EGS_20_2_20_2_JES_Goutal_web.pdf (accessed on 11 November 2013).
  11. Frey, B.; Kremer, J.; Rüdt, A.; Sciacca, S.; Matthies, D.; Lüscher, P. Compaction of forest soils with heavy logging machinery affects soil bacterial community structure. Eur. J. Soil Biol. 2009, 45, 312–320. [Google Scholar] [CrossRef]
  12. Weber, J. Humic substances and their role in the environment. EC Agric. 2020, 1, 3–8. [Google Scholar]
  13. Hamza, M.; Anderson, W. Soil compaction in cropping systems A review of the nature, causes and possible solutions. Soil Tillage Res. 2005, 82, 121–145. [Google Scholar] [CrossRef]
  14. Ziyaee, A.; Roshan, M.R.A. Survey study on soil compaction problems for new methods in agriculture. Int. Res. J. Appl. Basic Sci. 2012, 3, 1787–1801. Available online: https://irjabs.com/files_site/paperlist/r_121_120929150101.pdf (accessed on 25 November 2021).
  15. Kobza, J.; Barančíková, G.; Makovníková, J.; Pálka, B.; Styk, J.; Širaň, M. Current state and development of land degradation processes based on soil monitoring in Slovakia. Agriculture 2017, 63, 74–85. [Google Scholar] [CrossRef] [Green Version]
  16. Hartmann, M.; Niklaus, P.; Zimmermann, S.; Schmutz, S.; Kremer, J.; Abarekov, K.; Lüscher, P.; Widmer, F.; Frey, B. Resistance and resilience of the forest soil microbiome to logging-associated compaction. ISME J. 2014, 8, 226–244. [Google Scholar] [CrossRef]
  17. Frey, B.; Niklaus, P.A.; Kremer, J.; Lüscher, P.; Zimmermann, S. Heavy machinery traffic impacts methane emissions as well as methanogen abundance and community structure in Oxic forest soils. Appl. Environ. Microbiol. 2011, 77, 6060–6068. [Google Scholar] [CrossRef] [PubMed] [Green Version]
  18. Sarfraz, R.; Hussain, A.; Sabir, A.; Fekih, I.B.; Ditta, A.; Xing, S. Role of biochar and plant growth promoting rhizobacteria to enhance soil carbon sequestration—A review. Environ. Monit. Assess. 2019, 191, 251. [Google Scholar] [CrossRef] [PubMed]
  19. Horák, J. Testing biochar as a possible way to ameliorate slightly acidic soil at the research field located in the Danubian lowland. Acta Hortic. Regiotect. 2015, 18, 20–24. [Google Scholar] [CrossRef] [Green Version]
  20. Horák, J.; Šimanský, V.; Igaz, D.; Juriga, M.; Aydin, E.; Lukac, M. Biochar: An important component ameliorating the productivity of intensively used soils—Review. Pol. J. Environ. Stud. 2020, 29, 2995–3001. [Google Scholar] [CrossRef]
  21. Hossain, M.Z.; Bahar, M.M.; Sarkar, B.; Donne, S.W.; Ok, Y.S.; Palansooriya, K.N.; Kirkham, S.; Chowdhury, M.B.; Bolan, N. Biochar and its importance on nutrient dynamics in soil and plant. Biochar 2020, 2, 379–420. [Google Scholar] [CrossRef]
  22. Toková, L.; Igaz, D.; Horák, J.; Aydin, E. Effect of biochar application and re-application on soil bulk density, porosity, saturated hydraulic conductivity, water content and soil water availability in a silty loam Haplic Luvisol. Agronomy 2020, 10, 1005. [Google Scholar] [CrossRef]
  23. Šimanský, V.; Šrank, D. Relationships between soil organic matter and crop yield after biochar substrates application and their combinatin with mineral fertilizers on sandy soil. Acta Hortic. Regiotect. 2021, 24, 14–20. [Google Scholar] [CrossRef]
  24. Šrank, D.; Šimanský, V. Differences in soil organic matter and humus of sandy soil after application of biochar substrates and combination of biochar substrates with mineral fertilizers. Acta Fytotech. Zootech. 2020, 23, 117–124. [Google Scholar] [CrossRef]
  25. Kotuš, T.; Horák, J. Does biochar influence soil CO2 emission four years after its application to soil? Acta Hortic. Regiotect. 2021, 24, 109–116. [Google Scholar] [CrossRef]
  26. Murtaza, G.; Ditta, A.; Ullah, N.; Usman, M.; Ahmed, Z. Biochar for the management of nutrient impoverished and metal contaminated soils: Preparation, applications, and prospects. J. Soil Sci. Plant Nutr. 2021, 21, 2191–2213. [Google Scholar] [CrossRef]
  27. Barracosa, P.; Cardoso, I.; Marques, F.; Pinto, A.; Oliveira, J.; Trindade, H.; Rodrigues, P.; Pereira, J.L.S. Efect of biochar on emission of greenhouse gases and productivity of cardoon crop (Cynara cardunculus L.). J. Soil Sci. Plant Nutr. 2020, 20, 1524–1531. [Google Scholar] [CrossRef]
  28. Javeed, H.M.R.; Ali, M.; Ahmed, I.; Wang, X.; Al-Ashkar, I.; Qamar, R.; Ibrahim, A.; Habib-Ur-Rahman, M.; Ditta, A.; Sabagh, A.E. Biochar enriched with buffalo slurry improved soil nitrogen and carbon dynamics, nutrient uptake and growth attributes of wheat by reducing leaching losses of nutrients. Land 2021, 10, 1392. [Google Scholar] [CrossRef]
  29. Šimanský, V.; Aydın, E.; Horák, J. Is It Possible to Control the Nutrient Regime of Soils with Different Texture through Biochar Substrates? Agronomy 2022, 12, 51. [Google Scholar] [CrossRef]
  30. Šimanský, V.; Horák, J.; Bordoloi, S. Improving the soil physical properties and relationships between soil properties in arable soils of contrasting texture enhancement using biochar substrates: Case study in Slovakia. Geoderma Reg. 2022, 28, e00443. [Google Scholar] [CrossRef]
  31. Głąb, T.; Palmowska, J.; Zaleski, T.; Gondek, K. Effect of biochar application on soil hydrological properties and physical quality of sandy soil. Geoderma 2016, 281, 11–20. [Google Scholar] [CrossRef]
  32. Blanco-Canqui, H. Biochar and soil physical properties. Soil Sci. Soc. Am. J. 2017, 81, 687–711. [Google Scholar] [CrossRef] [Green Version]
  33. Blanco-Canqui, H. Does biochar application alleviate soil compaction? Review and data synthesis. Geoderma 2021, 404, 115317. [Google Scholar] [CrossRef]
  34. Šimanský, V. Effects of biochar and biochar with nitrogen on soil organic matter and soil structure in Haplic Luvisol. Acta Fytotech. Zootech. 2016, 19, 129–138. [Google Scholar] [CrossRef] [Green Version]
  35. Are, K.S. Biochar and soils physical health. In An Imperative Amendment for Soil and the Environment; Abrol, V., Sharma, P., Eds.; IntechOpen: Rijeka, Croatia, 2019; pp. 21–33. [Google Scholar] [CrossRef] [Green Version]
  36. Šimanský, V.; Horák, J.; Igaz, D.; Jonczak, J.; Markiewicz, M.; Felber, R.; Rizhiya, E.Y.; Lukac, M. How dose of biochar and biochar with nitrogen can improve the parameters of soil organic matter and soil structure? Biologia 2016, 71, 989–995. [Google Scholar] [CrossRef]
  37. Horák, J.; Šimanský, V. Effect of biochar on soil CO2 production. Acta Fytotech. Zootech. 2017, 4, 72–77. [Google Scholar] [CrossRef] [Green Version]
  38. Qian, K.; Kumar, A.; Zhang, H.; Bellmer, D.; Huhnke, R. Recent advances in utilization of biochar. Renew. Sustian. Energy Rev. 2015, 42, 1055–1064. [Google Scholar] [CrossRef]
  39. IUSS. World Reference Base for Soil Resources 2014, International Soil Classification System for Naming Soils and Creating Legends for Soil Maps; FAO: Rome, Italy, 2015. [Google Scholar]
  40. Fulajtár, E. Fyzikálne vlastnosti pôd Physical Properties of Soil; VÚPOP: Bratislava, Slovakia, 2006; p. 158. (In Slovak) [Google Scholar]
  41. Buchkina, N.P.; Balashov, E.V.; Rizhiya, E.Y.; Smith, K.A. Nitrous oxide emissions from a light-textured arable soil of North-Western Russia: Effects of crops, fertilizers, manures and climate parameters. Nutr. Cycl. Agroecosyst. 2010, 87, 429–442. [Google Scholar] [CrossRef]
  42. Parkin, T.B.; Venterea, R.T.; Hargreaves, S.K. Calculating the detection limits of chamber-based soil greenhouse gas flux measurements. J. Environ. Qual. 2012, 41, 705–715. [Google Scholar] [CrossRef] [Green Version]
  43. Yuen, S.H.; Pollard, A.G. Determination of nitrogen in agricultural materials by the Nessler reagent. II. Micro-determinations in plant tissue and in soil extracts. J. Sci. Food Agric. 1954, 5, 364–369. [Google Scholar] [CrossRef]
  44. Dziadowiec, H.; Gonet, S. Przewodnik Metodyczny do Bada’n Materii Organicznej Gleb Methodological Guidebook for the Organic Matter Researches; Prace Komisji Naukowych Polskiego Towarzystwa Naukowego 120; PTG: Warszawa, Poland, 1999; pp. 31–34. (In Polish) [Google Scholar]
  45. Alskaf, K.; Mooney, S.J.; Sparkes, D.L.; Wilson, P.; Sjogersten, S. Short-term impacts of different tillage practices and plant residue retention on soil physical properties and greenhouse gas emissions. Soil Tillage Res. 2021, 206, 104803. [Google Scholar] [CrossRef]
  46. Razzaghi, F.; Obour, P.B.; Arthur, E. Does biochar improve soil water retention? A systematic review and meta-analysis. Geoderma 2020, 361, 114055. [Google Scholar] [CrossRef]
  47. Omondi, G.; Xia, O.M.; Nahayo, X.; Liu, A.; Korai, X.; Pan, K.P. Quantification of biochar effects on soil hydrological properties using meta-analysis of literature data. Geoderma 2016, 274, 28–34. [Google Scholar] [CrossRef]
  48. Tullberg, J.; Antille, D.L.; Bluetta, C.; Eberhard, J.; Scheer, C. Controlled traffic farming effects on soil emissions of nitrous oxide and methane. Soil Tillage Res. 2018, 176, 18–25. [Google Scholar] [CrossRef]
  49. Whitman, T.; Singh, B.P.; Zimmerman, A. Priming effects in biochar amended soils: Implications of Biochar-Soil Organic Matter Interactions for Carbon Storage. In Biochar for Environmental Management: Science, Technology and Implementation; Lehmann, J., Stephen, J., Eds.; Routhledge: London, UK, 2015; pp. 455–487. [Google Scholar]
  50. Šimanský, V.; Horák, J.; Lukáč, M. Application of degradable carbon and nitrogen moderates carbon sequestration potential of biochar in arable soils. Ekológia 2021, 40, 124–129. [Google Scholar] [CrossRef]
  51. Cayuela, M.L.; Van Zwieten, L.; Singh, B.P.; Jeffery, S.; Roig, A.; Sanchez-Monedero, M.A. Biochar’s role in mitigating soil nitrous oxide emissions: A review and meta-analysis. Agric. Ecosyst. Environ. 2014, 191, 5–16. [Google Scholar] [CrossRef]
  52. Esfandbod, M.; Phillips, I.R.; Miller, B.; Rashti, M.R.; Lan, Z.M.; Srivastava, P. Aged acidic biochar increases nitrogen retention and decreases ammonia volatilization in alkaline bauxite residue sand. Ecol. Eng. 2017, 98, 157–165. [Google Scholar] [CrossRef]
  53. El-Naggar, A.; Lee, S.S.; Rinkelebe, J.; Farooq, M.; Song, H.; Sarmah, A.K.; Zimmerman, A.R.; Ahmad, M.; Shaheen, S.M.; Ok, Y.S. Biochar application to low fertility soils: A review of current status, and future prospects. Geoderma 2019, 337, 536–554. [Google Scholar] [CrossRef]
  54. Wang, J.; Sainju, U.M.; Barsotti, J.L. Residue placement and rate, crop species, and nitrogen fertilization effects on soil greenhouse gas emissions. J. Environ. Prot. 2012, 3, 1238–1250. [Google Scholar] [CrossRef] [Green Version]
  55. Zimmerman, A.R.; Gao, B.; Ahn, M.Y. Positive and negative carbon mineralization priming effects among a variety of biochar-amended soils. Soil Biol. Biochem. 2011, 43, 1169–1179. [Google Scholar] [CrossRef]
  56. Šimanský, V.; Horvátová, M. Soil Texture and Organic Matter in Selected Soil Types of Slovakia. In Proceedings of the Lectures from VIII of the Congress of the Slovak Society for Agricultural, Forestry, Food and Veterinary Sciences at the Slovak Academy of Sciences in Bratislava; Sobocká, J., Kobza, J., Eds.; Research Institute of Soil Science and Soil Protection: Bratislava, Slovakia, 2010; pp. 32–37. [Google Scholar]
  57. Šimanský, V.; Polláková, N.; Chlpík, J.; Kolenčík, M. Pôdoznalectvo Soil Science; SPU: Nitra, Slovakia, 2018; p. 398. (In Slovak) [Google Scholar]
  58. Wardle, D.A.; Nilsson, M.C.; Zackrisson, O. Response to comment on fire-derived charcoal causes loss of forest humus. Science 2008, 321, 1295. [Google Scholar] [CrossRef] [Green Version]
  59. Reeves, S.H.; Somasundaram, J.; Wang, W.J.; Heenan, M.A.; Finn, D.; Dalal, R.C. Effect of soil aggregate size and long-term contrasting tillage, stubble and nitrogen management regimes on CO2 fluxes from a Vertisol. Geoderma 2019, 337, 1086–1096. [Google Scholar] [CrossRef]
  60. Lin, S.; Zhang, S.; Shen, G.; Shaaban, M.; Ju, W.; Cui, Y.; Duan, C.; Fang, L. Effects of inorganic and organic fertilizers on CO2 and CH4 fluxes from tea plantation soil. Elem. Sci. Anthr. 2021, 9, 90. [Google Scholar] [CrossRef]
  61. Fischer, D.; Glaser, B. Synergisms between compost and biochar for sustainable soil amelioration. In Management of Organic Waste; Kumar, S., Bharti, A., Eds.; IntechOpen: Rijeka, Croatia, 2012; pp. 167–198. [Google Scholar] [CrossRef] [Green Version]
  62. Balashov, E.; Buchkina, N.; Šimanský, V.; Horák, J. Effects of slow and fast pyrolysis biochar on N2O emissions and water availability of two soils with high water-filled pore space. J. Hydrol. Hydromech. 2021, 69, 467–474. [Google Scholar] [CrossRef]
  63. Horák, J.; Kotuš, T.; Toková, L.; Aydın, E.; Igaz, D.; Šimanský, V. A sustainable approach for improving soil properties and reducing N2O emissions is possible through initial and repeated biochar application. Agronomy 2021, 11, 582. [Google Scholar] [CrossRef]
  64. Šimek, M.; Cooper, J.E. The influence of soil pH on denitrification: Progress towards the understanding of this interaction over the last 50 years. Eur. J. Soil Sci. 2002, 53, 345–354. [Google Scholar] [CrossRef]
Figure 1. Cumulative N2O emissions, box plots show median, percentiles, error bars confidence intervals. Soil addition treatments: N—nitrogen fertilisation, B1—softwood from spruce (mixture of branches and wood chips) biochar, B2—digestate biochar, and B3—wood pallets from softwood (spruce without bark) biochar.
Agronomy 12 00546 g001
Figure 2. Timeline of cumulative N2O emissions from compacted (A) and uncompacted (B) Luvisol. Soil addition treatments: N—nitrogen fertilisation, B1—softwood from spruce (mixture of branches and wood chips) biochar, B2—digestate biochar, and B3—wood pallets from softwood (spruce without bark) biochar.
Agronomy 12 00546 g002
Figure 3. Cumulative CO2 emissions, box plots show median, percentiles, error bars confidence intervals, from compacted and uncompacted Luvisol. Soil addition treatments: N—nitrogen fertilisation, B1—softwood from spruce (mixture of branches and wood chips) biochar, B2—digestate biochar, and B3—wood pallets from softwood (spruce without bark) biochar.
Agronomy 12 00546 g003
Figure 4. Timeline of cumulative CO2 emissions from compacted (A) and uncompacted (B) Luvisol. Soil addition treatments: N—nitrogen fertilisation, B1—softwood from spruce (mixture of branches and wood chips) biochar, B2—digestate biochar, and B3—wood pallets from softwood (spruce without bark) biochar.
Agronomy 12 00546 g004
Table 1. Biochar feedstock, pyrolysis temperature, pyrolysis duration, and physicochemical properties of three biochars used in this study.
Biochar TypesB1B2B3
FeedstockSoftwood from spruce (mixture of branches and wood chips) made in kon-tiki kilnSeparate from the digestate (corn) 35%, cereal straw 35%, greenery 30%Wood pallets from softwood (spruce without bark)
Pyrolysis temperature (°C)600460500 and 750
Pyrolysis duration (min)1525180–360
pH (H2O)9.79.811.4
C (%)804586.8
N (%)0.310.58
P (g kg−1)0.6160.72
K (g kg−1)2.4173.59
Ca (g kg−1)20.456.312.94
Mg (g kg−1)1.36.62.43
specific surface area (SSA) (m2 g−1)301120444
Table 2. Multiple regression models between key soil parameters and N2O emissions in compacted and uncompacted Luvisol (n = 24).
Regression Summary for Dependent Variable: N2O
R = 0.067142835 R2 = 0.45081603
Adjusted R2 = 0.33519836
R = 0.55106459 R2 = 0.30367218
Adjusted R2 = 0.15707685
F (4.19) = 3.8992 p < 0.01779
Standard Error of Estimate: 5.8556
F (4.19) = 2.0715 p < 0.12477
Standard Error of Estimate: 20.492
CompactedUncompacted
b *Standard Error of b *bStandard Error of bt (19)p-Valueb *Standard Error of b *bStandard Error of bt (19)p-Value
Intercept 67.92497.7820.6950.496 526.164310.2211.6960.106
NH4+0.5000.1880.2330.0882.6620.0150.2470.2170.2750.2401.1420.268
NO3−0.0550.196−0.0280.100−0.2780.784−0.0200.228−0.0790.878−0.0900.930
pH−0.1950.258−11.07214.702−0.7530.461−0.4310.275−76.27748.555−1.5710.133
SOC0.4860.2580.2690.1431.8810.0750.0090.2630.0120.3400.0340.973
NH4+—ammonium, NO3—nitrate, pH—soil pH, SOC—soil organic carbon, bold—coefficient is statistically significant p < 0.05, *—regression through origin (assuming that intercept = 0).
Table 3. Multiple regression models between key soil parameters and CO2 emissions in compacted and uncompacted Luvisol (n = 24).
Regression Summary for Dependent Variable: CO2
R = 0.71504881 R2 = 0.51129480
Adjusted R2 = 0.40840949
R = 0.41932597 R2 = 0.17583427
Adjusted R2 = 0.00232569
F (4.19) = 4.9696 p < 0.00651
Standard Error of Estimate: 8.2868
F (4.19) = 1.0134 p < 0.42532
Standard Error of Estimate: 28.129
CompactedUncompacted
b *Standard Error of b *bStandard Error of bt (19)p-Valueb *Standard Error of b*bStandard Error of bt (19)p-Value
Intercept 117.905138.3800.8520.405 64.161425.8290.1510.882
NH4+0.4520.1770.3160.1242.5530.0190.3610.2360.5050.3301.5300.143
NO3−0.1600.1850.3160.142−0.8640.399−0.0840.248−0.4081.205−0.3390.738
pH−0.2170.244−0.12320.806−0.8900.385−0.0400.299−8.87966.650−0.1330.895
SOC0.5320.244−18.5180.2032.1830.0420.0510.2860.0830.4670.1770.862
NH4+—ammonium, NO3—nitrate, pH—soil pH, SOC—soil organic carbon, bold—coefficient is statistically significant p < 0.05, *—regression through origin (assuming that intercept = 0).
Table 4. Linear regression models between key soil parameters and N2O emissions in compacted and uncompacted Luvisol.
TreatmentsLinear ModelTrendProbabilityLinear ModelTrendProbability
CompactedUncompacted
NN2O = −0.00005 soil pH + 6.59n.d.n.s.N2O = −0.0156 soil pH + 6.62decrease0.595 **
N2O = 0.0316 NO3 + 47.01n.d.n.s.N2O = 0.3011 NO3 + 54.03n.d.n.s.
N2O = 0.0141 NH4+ + 15.87n.d.n.s.N2O = 4.5145 NH4+ + 17.76increase0.644 **
N2O = 0.006 SOC + 14.44n.d.n.s.N2O = −0.363 SOC + 14.38n.d.n.s.
N + B1N2O = −0.0077 soil pH + 6.86decrease0.559 *N2O = −0.0132 soil pH + 6.88decrease0.664 **
N2O = −0.726 NO3 + 37.13n.d.n.s.N2O = −0.9659 NO3 + 60.74decrease0.575 **
N2O = 2.3578 NH4+ + 9.47increase0.680 **N2O = 6.0922 NH4+ + 10.62increase0.802 ***
N2O = 0.3697 SOC + 25.09n.d.n.s.N2O = −0.5007 SOC + 27.27n.d.n.s.
N + B2N2O = −0.001 soil pH + 6.84n.d.n.s.N2O = –0.0057 soil pH + 6.84n.d.n.s.
N2O = −0.355 NO3 + 56.66decrease0.468 *N2O = −0.3472 NO3 + 56.72n.d.n.s.
N2O = 0.739 NH4+ + 12.58increase0.666 **N2O = 3.0485 NH4+ + 21.57increase0.532 *
N2O = −0.009 SOC + 35.03n.d.n.s.N2O = −3.6418 SOC + 46.07decrease0.732 ***
N + B3N2O = −0.0032 soil pH + 6.89decrease0.723 ***N2O = –0.0105 soil pH + 6.90decrease0.495 *
N2O = 0.1923 NO3 + 22.84n.d.n.s.N2O = −1.2616 NO3 + 57.92decrease0.631 **
N2O = 0.6088 NH4+ + 8.77increase0.672 **N2O = 3.7047 NH4+ + 17.68increase0.630 **
N2O = −0.1178 SOC + 48.70n.d.n.s.N2O = 0.4076 SOC + 51.80n.d.n.s.
n.d.—non-detecated, n.s.—nonsignificant, * p < 0.05; ** p < 0.01; *** p < 0.001; Soil addition treatments: N—nitrogen fertilisation, B1—softwood from spruce (mixture of branches and wood chips) biochar, B2—digestate biochar, and B3—wood pallets from softwood (spruce without bark) biochar.
Table 5. Simple regression models between key soil parameters and CO2 emissions.
TreatmentsLinear ModelTrendProbabilityLinear ModelTrendProbability
CompactedUncompacted
NCO2 = −0.0015 soil pH + 6.59decrease0.558 *CO2 = −0.0007 soil pH + 6.59n.d.n.s.
CO2 = −0.103 NO3 + 47.45n.d.n.s.CO2 = 0.1209 NO3 + 54.71n.d.n.s.
CO2 = 0.2429 NH4+ + 17.26n.d.n.s.CO2 = 2.1865 NH4+ + 28.23increase0.684 **
CO2 = −0.0033 SOC + 14.59n.d.n.s.CO2 = −0.0893 SOC + 13.60n.d.n.s.
N + B1CO2 = −0.0003 soil pH + 6.84n.d.n.s.CO2 = −0.0033 soil pH + 6.85n.d.n.s.
CO2 = −0.2583 NO3 + 33.81decrease0.699 **CO2 = 0.0522 NO3 + 58.18n.d.n.s.
CO2 = 0.2756 NH4+ + 17.91increase0.531 *CO2 = 1.7288 NH4+ + 26.58increase0.550 *
CO2 = −0.0028 SOC + 26.22n.d.n.s.CO2 = −0.0606 SOC + 25.95n.d.n.s.
N + B2CO2 = −0.0004 soil pH + 6.83n.d.n.s.CO2 = 0.0006 soil pH + 6.83n.d.n.s.
CO2 = −0.1026 NO3 + 54.27n.d.n.s.CO2 = −0.2835 NO3 + 57.37decrease0.470 *
CO2 = 0.2464 NH4+ + 17.42increase0.510 *CO2 = 0.6126 NH4+ + 23.76increase0.494 *
CO2 = 0.0563 SOC + 34.75n.d.n.s.CO2 = −0.129 SOC + 40.92n.d.n.s.
N + B3CO2 = 0.0003 soil pH + 6.86n.d.n.s.CO2 = 0.0044 soil pH + 6.87n.d.n.s.
CO2 = −0.0953 NO3 + 24.66n.d.n.s.CO2 = 0.2228 NO3 + 54.41n.d.n.s.
CO2 = 0.1356 NH4+ + 16.71n.d.n.s.CO2 = −2.2031 NH4+ + 20.93n.d.0.808 ***
CO2 = 0.045 SOC + 47.52n.d.n.s.CO2 = −0.6719 SOC + 50.20n.d.n.s.
n.d.—non-detecated, n.s.—nonsignificant, * p < 0.05; ** p < 0.01; *** p < 0.001; Soil addition treatments: N—nitrogen fertilisation, B1—softwood from spruce (mixture of branches and wood chips) biochar, B2—digestate biochar, and B3—wood pallets from softwood (spruce without bark) biochar.
Publisher’s Note: MDPI stays neutral with regard to jurisdictional claims in published maps and institutional affiliations.

