Review

Soil Organic Carbon Sequestration after Biochar Application: A Global Meta-Analysis

Department of Soil Biogeochemistry, Martin Luther University Halle-Wittenberg, 06120 Halle (Saale), Germany
*
Author to whom correspondence should be addressed.
Agronomy 2021, 11(12), 2474; https://doi.org/10.3390/agronomy11122474
Submission received: 16 November 2021 / Revised: 2 December 2021 / Accepted: 3 December 2021 / Published: 5 December 2021

Abstract

:
Biochar application to soil has the potential to sequester carbon in the long term because of its high stability and large-scale production potential. However, biochar technologies are still relatively new, and the global factors affecting the long-term fate of biochar in the environment are still poorly understood. To fill this important research gap, a global meta-analysis was conducted including 64 studies with 736 individual treatments. Field experiments covered experimental durations between 1 and 10 years with biochar application amounts between 1 and 100 Mg ha−1. They showed a mean increase in soil organic carbon (SOC) stocks by 13.0 Mg ha−1 on average, corresponding to 29%. Pot and incubation experiments ranged between 1 and 1278 days and biochar amounts between 5 g kg−1 and 200 g kg−1. They raised SOC by 6.3 g kg−1 on average, corresponding to 75%. More SOC was accumulated in long experimental durations of >500 days in pot and incubation experiments and 6–10 years in field experiments than in shorter experimental durations. Organic fertilizer co-applications significantly further increased SOC. Biochar from plant material showed higher C sequestration potential than biochar from fecal matter, due to higher C/N ratio. SOC increases after biochar application were higher in medium to fine grain textured soils than in soils with coarse grain sizes. Our study clearly demonstrated the high C sequestration potential of biochar application to agricultural soils of varying site and soil characteristics.

1. Introduction

Many international governmental efforts aim to reduce large amounts of greenhouse gases (GHG) to comply with the “Paris agreement” by mitigating the global mean air temperature below 2 °C, compared to the pre-industrial level, with efforts to even reach the 1.5 °C mark.
Being part of the “Paris agreement”, the European Union (EU) is pursuing CO2 neutrality by 2050 within their “Green Deal”. To achieve this ambitious goal, the EU Commission proposed a net reduction in emission of GHG of 55% from 1990 emission levels as a target milestone by 2030. To reach this challenging objective, efficient CO2 removal (CDR) technologies are needed.
Compared to suggested technical solutions, such as carbon capture and storage (CCS), natural soils are an important carbon sink as they contain more carbon than stored in terrestrial vegetation and the atmosphere combined [1]. Different studies demonstrated the potential to store even more carbon in soils by applying certain management practices such as afforestation, conservational tillage practices, or the use of soil amendments, with the latter showing high potential [2,3].
This process of storing organic carbon in soils (SOC), better known as SOC sequestration, describes how organic carbon is incorporated into soils and converted into a long living C pool that would otherwise be emitted as CO2 [4]. SOC sequestration is not only be considered a CDR, but also enhances the soil quality and thus improves ecosystem functions and services, food security, and resilience to climate change [5,6,7]. Increases of SOC stocks can be achieved using different strategies such as reduced tillage [8,9], organic farming [10,11], agroforestry [12], and soil amendments such as straw [13,14] sewage sludge [15,16], or manure [17,18,19]. However, the strategies differ greatly in the amount of carbon stored and the long-term nature [11,18,20,21], with agroforestry showing the greatest potential [22,23]. Soil amendments need to be applied regularly (e.g., at the beginning of a growing season) to store C in the long-term [18,20].
Another option to sequester SOC is the use of carbon-rich soil amendments with long mean residence times and low decay rates. Especially, biochar application has high SOC sequestration potential in the long term because of its high stability [24] and large scale production potential [25,26,27,28], which is only limited by available biomass. In addition, biochar has the potential to increase nutrient availability [29], crop yields [30,31,32,33], soil water availability [32], microbial biomass [34], and soil microbial diversity [35]. By increasing biomass yields, biochar could substitute mineral fertilizers and thus reduce the carbon footprint of crops by avoiding energy intensive fertilizer production processes [30].
In sum, biochar as a soil amendment provides solutions to the most recent threats to soil health and the mitigation of climate change. However, as biochar technologies are relatively new, there is a lack of data regarding short and especially long-term stabilization of SOC stocks and their fate after biochar amendment. Many individual studies aimed to fill these research gaps, but to our best knowledge, there are no studies available analyzing the global explanatory factors influencing SOC dynamics after biochar amendments.
To fill this important research gap, a global meta-analysis was conducted by collecting available data from peer-reviewed studies using ISI Web of Science as ac reliable database. The first objective was to analyze this data collection for explanatory factors, which may affect SOC differences after biochar soil amendments. This is why we further analyzed the relationship between SOC sequestration and experiment characteristics (field, laboratory, or greenhouse study, single vs. continuous application, duration, applied amounts, sampling depth), site characteristics (climate zone, tillage intensity, crop type, additional fertilization), soil properties (texture, soil pH class, initial SOC content), biochar characteristics (feedstock, C content, C/N, surface area, cation exchange capacity (CEC)), and interactions between explanatory factors. The second objective was to identify similarities and differences between studies that were performed on a real field scale and studies conducted in the greenhouse or laboratory, as a comprehensive understanding of both settings can lead to an even better understanding of the whole research question [36].

2. Material and Methods

2.1. Data Source, Collection, and Categorization

To quantify the response of SOC stocks following biochar applications, a meta-analysis was conducted. A systematic literature review was performed using “ISI Web of Science”, using the search term “Soil organic carbon OR Carbon Sequestration AND Biochar”. Studies were included if the effect and control size was expressed as content of total organic carbon (TOC) or quantified as SOC or TOC stocks. In total, 64 studies were considered usable within our approach. In five studies, soil organic matter (SOM) rather than SOC or TOC information was given [37,38,39,40,41]. We calculated SOC or TOC as SOM *0.58 in these cases [42]. Outdoor field studies, greenhouse studies, and studies with laboratory treatments were all included. Studies were excluded if total carbon (TC) was reported rather than TOC or SOC, or if SOC was given in its fractions, such as the light or heavy fraction. Moreover, studies were excluded if they did not present a “clear” control. A control was considered “clear” if they were treated in the exact same way and the only difference to the treatment was the absence of biochar.
Field studies included biochar treatments on natural soils (n = 376) and on lysimeters and columns (n = 36). Non-field experiments included incubation experiments (n = 182), all of which were carried out in laboratories. Furthermore, non-field experiments included pot experiments (n = 141). These pots were either placed in the open air (n = 96) or indoor e.g., in greenhouses (n = 45).
We divided all treatments into two separate datasets. All field treatments were allocated to the “field dataset” (n = 412) (Table S1) and the pot and incubation treatments were allocated to the “non-field dataset” (n = 324) (Table S2).
Besides information on SOC content, we also extracted information on experiment characteristics (field, laboratory, or greenhouse study, single vs. continuous application, duration, applied amounts, sampling depth), site characteristics (climate zone, tillage intensity, crop type, additional fertilization), soil properties (texture, soil pH class, initial SOC content), and biochar characteristics (feedstock, C content, C/N, surface area, CEC). To limit the variety of different soil texture classes, we decided to group them according to their dominant particle size class (sand, silt, or clay). Exceptions are the classes “clay loam and loam”. These have been added to the fourth category, “loam”. In cases, data were presented only in figures, WebPlotDigitizer Version 4.4 was used for the extraction of data [43]. In case of annual biochar applications, annual amounts were accumulated to analyze total amounts.
In the field dataset, SOC stocks given as Mg ha−1 were used to quantify SOC dynamics after biochar application. To enable the consideration of absolute SOC stock differences among studies with different layer thicknesses, we computed them to a common layer thickness of 30 cm using weighted average. A total of twelve treatments could not be computed and were eliminated from the field dataset, as studies did not report a clear layer thickness. If no information on SOC stocks was provided at all, we quantified them using the following equation [44]
SOC   stock = SOC × Bulk   density × Depth ×   0.1
where the SOC stock is expressed as Mg ha−1, bulk density as g cm−3, layer thickness as cm and SOC as g kg−1.
In a few studies, no soil bulk density was given. In these cases, we used different pedotransfer functions and followed an approach already applied in the meta-analysis [18]. If studies included information on the initial SOC, silt, and clay content, we used the pedotransfer function given in [45] (Equation (2)). If studies included information on the initial SOC and the clay content, we used an equation given in [46] (Equation (3)). If studies only provided information on initial SOC, we used a pedotransfer function given in [47] (Equation (4)).
Bulk   density   = 1.386 0.078 × SOC   + 0.001 × Silt   + 0.001 × Clay
Bulk   density   = 1.398 0.0047 × Clay   0.042 × SOC
Bulk   density   = 1.660 0.318 × SOC 0.5
where bulk density is expressed as g cm−3 and the SOC, silt, and clay contents as %. To better understand the factors influencing SOC stock changes, we grouped the study results as follows: tillage intensity type, climate zone, initial SOC, soil texture, sampling depth, soil pH class, added biochar amount, biochar type, additional fertilizer, and experiment duration.
The non-field dataset contained solely pot or incubation experiments, thus quantification of SOC stocks was not practicable. Here, the relative or absolute difference of SOC content after biochar application given as g kg−1 was used.

2.2. Data Analysis

We used two ratios to describe the SOC dynamics following biochar applications. To describe the relative effect, we calculated the RR (Equation (5)) according to Hedges et al. (1999) [48], and transformed it into RR[%] (Equation (6)) in order to interpret results more effectively. The absolute effect was described by dSOC (Equation (7)).
RR = ln ( X E X C )
RR [ % ] = 100 × ( 1 + e RR )
dSOC = X E X C
where XE is the mean SOC stock with biochar application and XC is the mean SOC stock without application of biochar (control group) for each treatment.
Both effect sizes were estimated using a random effects model (REM) given the assumption of heterogeneity between studies.
REM’s rely on the inverse-variance method (Equation (8)) to estimate the weighting factor w k of each individual effect size k .
w k = 1 s k 2 + τ 2
with s k 2 being the variance of each individual effect size k and τ 2 being the variance of the distribution of effect sizes within their population. The Restricted Maximum Likelihood method was used to account for τ 2 , being the variance of the distribution of effect sizes within their population.
ϴ = k = 1 K ϴ k w k k = 1 K w k
The weighting factor w k was then used to calculate the pooled REM effect size ϴ for each respective category using Equation (9).
To explore interactions between variables, we conducted a subgroup analysis of variables. We assumed that the studies within each subgroup was drawn from a universe of populations and therefore used Equations (8) and (9) in a similar way to those we carried out in the REM. However, as we have assumed both random effects (within the subgroups) and fixed effects (the subgroups themselves were assumed to be fixed) in this subgroup analysis, this is a mixed-effects model approach [49].
We used R Version 4.0.3 [50], and the “meta” package for calculation [51]. Considering the fact that ~20% of the included studies provided insufficient information on statistical measures, we decided to assume a standard deviation of 10% in those cases, as already performed in a recent meta studies to include as many treatments as possible [11,19,52,53].
The REM results for both RR[%] and dSOC are presented as forest plots. Visualization was conducted with R Version 4.0.3. The vertical black solid line represents an RR[%], or a dSOC equal to 0, thus no effect. An effect size larger than 0 indicates a positive effect (i.e., an increase in SOC upon biochar application) and lower than 0 a negative effect (i.e., a decrease in SOC upon biochar application). Each effect size is presented as the range between the upper and lower 95% confidence interval. The line inside of both confidence intervals represents the range of the effect size. If the effect size range crosses the “zero-effect-line”, the result can be interpreted as statistically insignificant. The effect sizes of each group were considered to be significantly different at p < 0.05 from each other if the 95% confidence intervals were not-overlapping. The vertical black dotted line represents the grand overall mean. Group category names are presented on the y-axis in bold black letters, sub-categories are given in grey letters. The number of included treatments is given in grey brackets.

3. Results and Discussion

Overall, 64 studies with a total of 736 treatments were analyzed within this meta-analysis. The treatments were located in North America (n = 28), South America (n = 40), Sub-Saharan Africa (n = 43), North Africa (n = 4), Europe (n = 180), Australia (n = 13), South Asia (n = 90), and East Asia (n = 338). The results of all subcategories, including their REM statistics, are given in Tables S3–S6. Results of the subgroup analysis obtained from the mixed-effects model are given in Tables S7 and S8.

3.1. Experiment Setup Effect

As expected, both the results of the field dataset and the non-field dataset showed a significant increase in SOC, although among both datasets, field treatments showed a 46% lower average RR[%] than non-field treatments. Treatments retrieved from field studies showed an absolute SOC increase of 13.0 Mg ha−1 (95% CI 11.5–14.6 Mg ha−1) corresponding to a relative SOC increase of 29% (95% CI 26–33%) (Figure 1 and Figure 2). Greenhouse and laboratory studies showed an absolute SOC increase of 6.1 g kg−1 (95% CI 5.5–7.2 g kg−1) corresponding to a relative SOC increase of 75% (95% CI 67–85%) after biochar application (Figure 3 and Figure 4).
Differences between field and greenhouse studies were already observed in previous studies [54,55] and are mainly due to non-existing environmental factors such as temperature and moisture fluctuations, and “near ideal” conditions in the laboratory or the greenhouse with minimal disturbance, which is almost impossible to achieve under field conditions. Factors such as crop growth and soil tillage affect soil structure, which is strongly connected to SOC stabilization [56], and are therefore influencing factors for the C sequestration potential of soil amendments [57]. In addition, under field conditions, also other dissipation pathways such as wind and/or water erosion, leaching, and bioturbation occur.
Despite this difference among the experimental setups, different groups in both datasets showed high variability, but almost all comparisons revealed increases in SOC content or stocks, mainly due to the fact that biochar mainly adds stable carbon to the soil.
The molecular structure and stability of carbon compounds added to soil by various soil amendments is, among many other biotic and abiotic influences, a controlling factor in soil carbon persistence and SOC sequestration potential [24,58,59]. Labile C fractions such as the microbial biomass have short turnover rates and short soil persistence compared to humified, physically protected, and chemically recalcitrant C fractions [60]. Biochar consists mainly of highly stable aromatic C compounds, making up about 97% of the total biochar C, and therefore has a high mean residence time of 556 years and a low decay rate [24].
Field treatments were distinguished into lysimeter or column setups and field experiments without any further adjustments (“basic” field experiments). Lysimeter and column experiments showed significantly higher SOC sequestration than “basic” field setups, with a higher absolute SOC increase of 22.6 and 12.6 Mg ha−1, respectively, and a higher relative SOC increase of 98 and 26%, respectively (Figure 1 and Figure 2). Non-field treatments were subdivided into pot and incubation studies (Figure 3 and Figure 4). Pot experiments showed an absolute SOC increase of 5.6 g kg−1, corresponding to a relative increase of 81%. Incubation studies showed on average comparable SOC increases (absolute increase of 6.9 g kg−1 and relative increase of 70%). Pot studies conducted indoor showed a higher absolute increase in SOC (8.6 vs. 4.5 g kg−1) but a lower relative increase (55% vs. 92%) than those conducted outdoors. Comparable to the disparities between the field and laboratory scale, these differences can be explained by a lack of disturbance and environmental conditions, which are better controlled and limited in lysimeter and column trials.

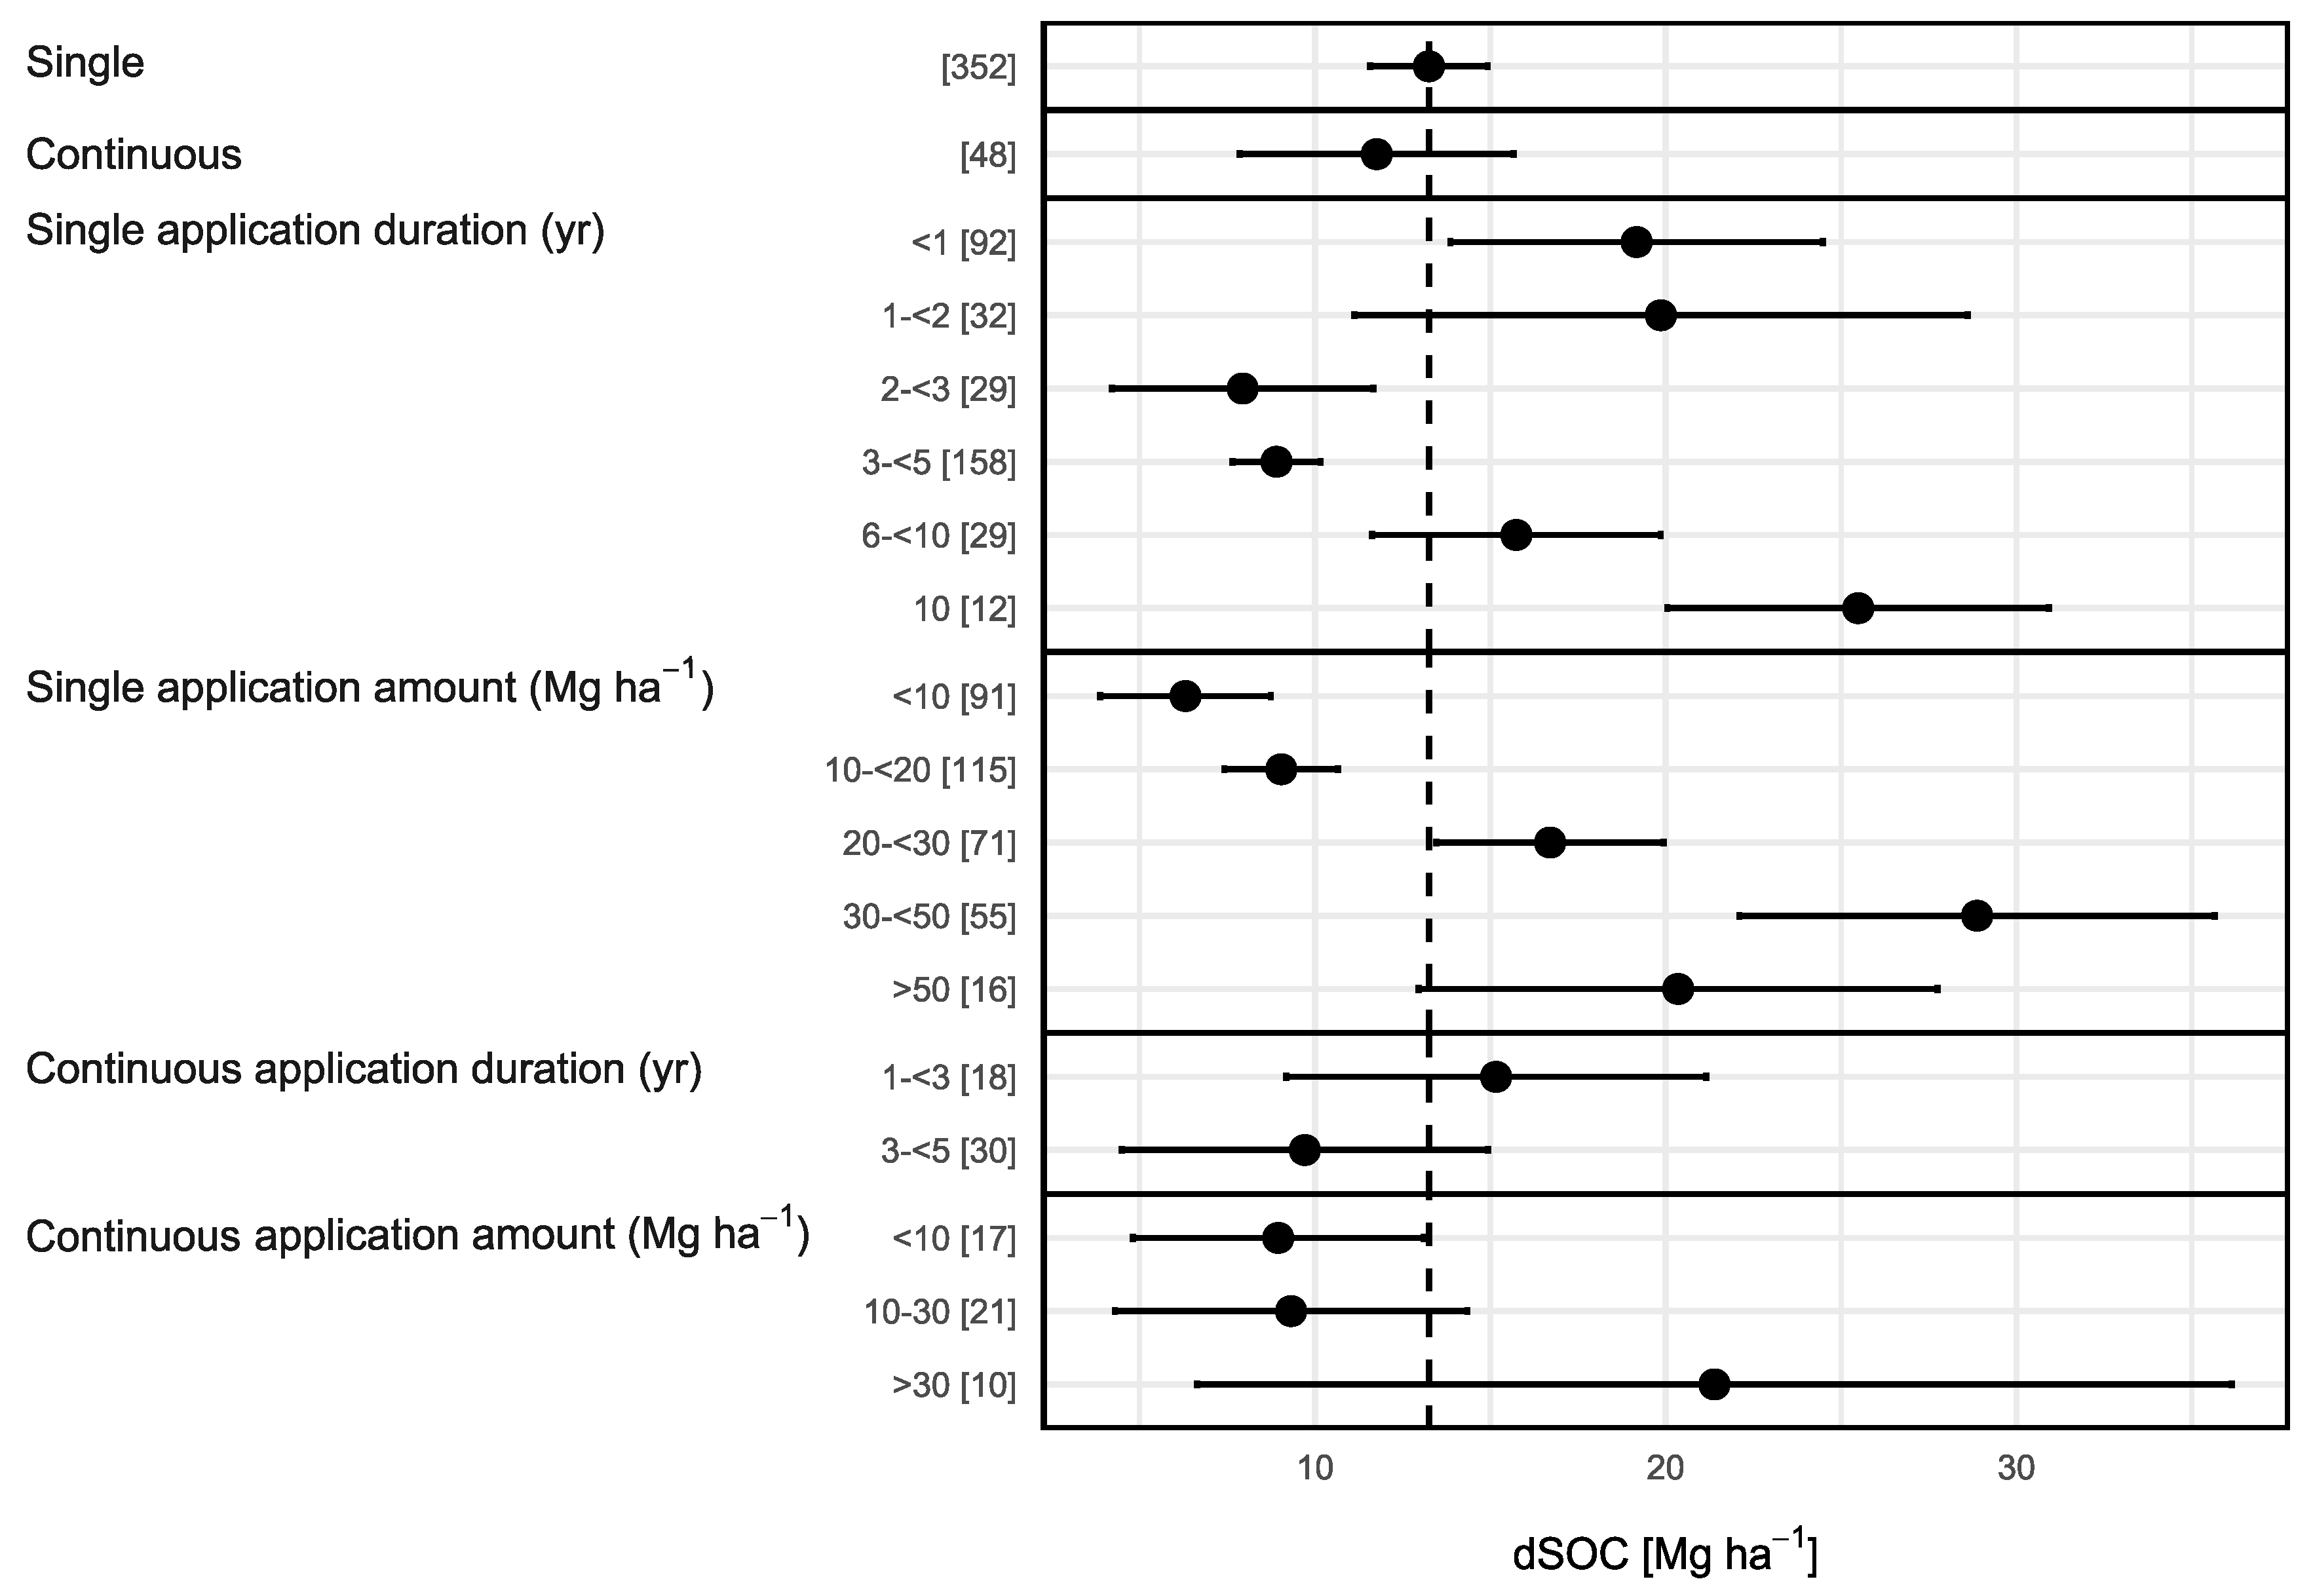
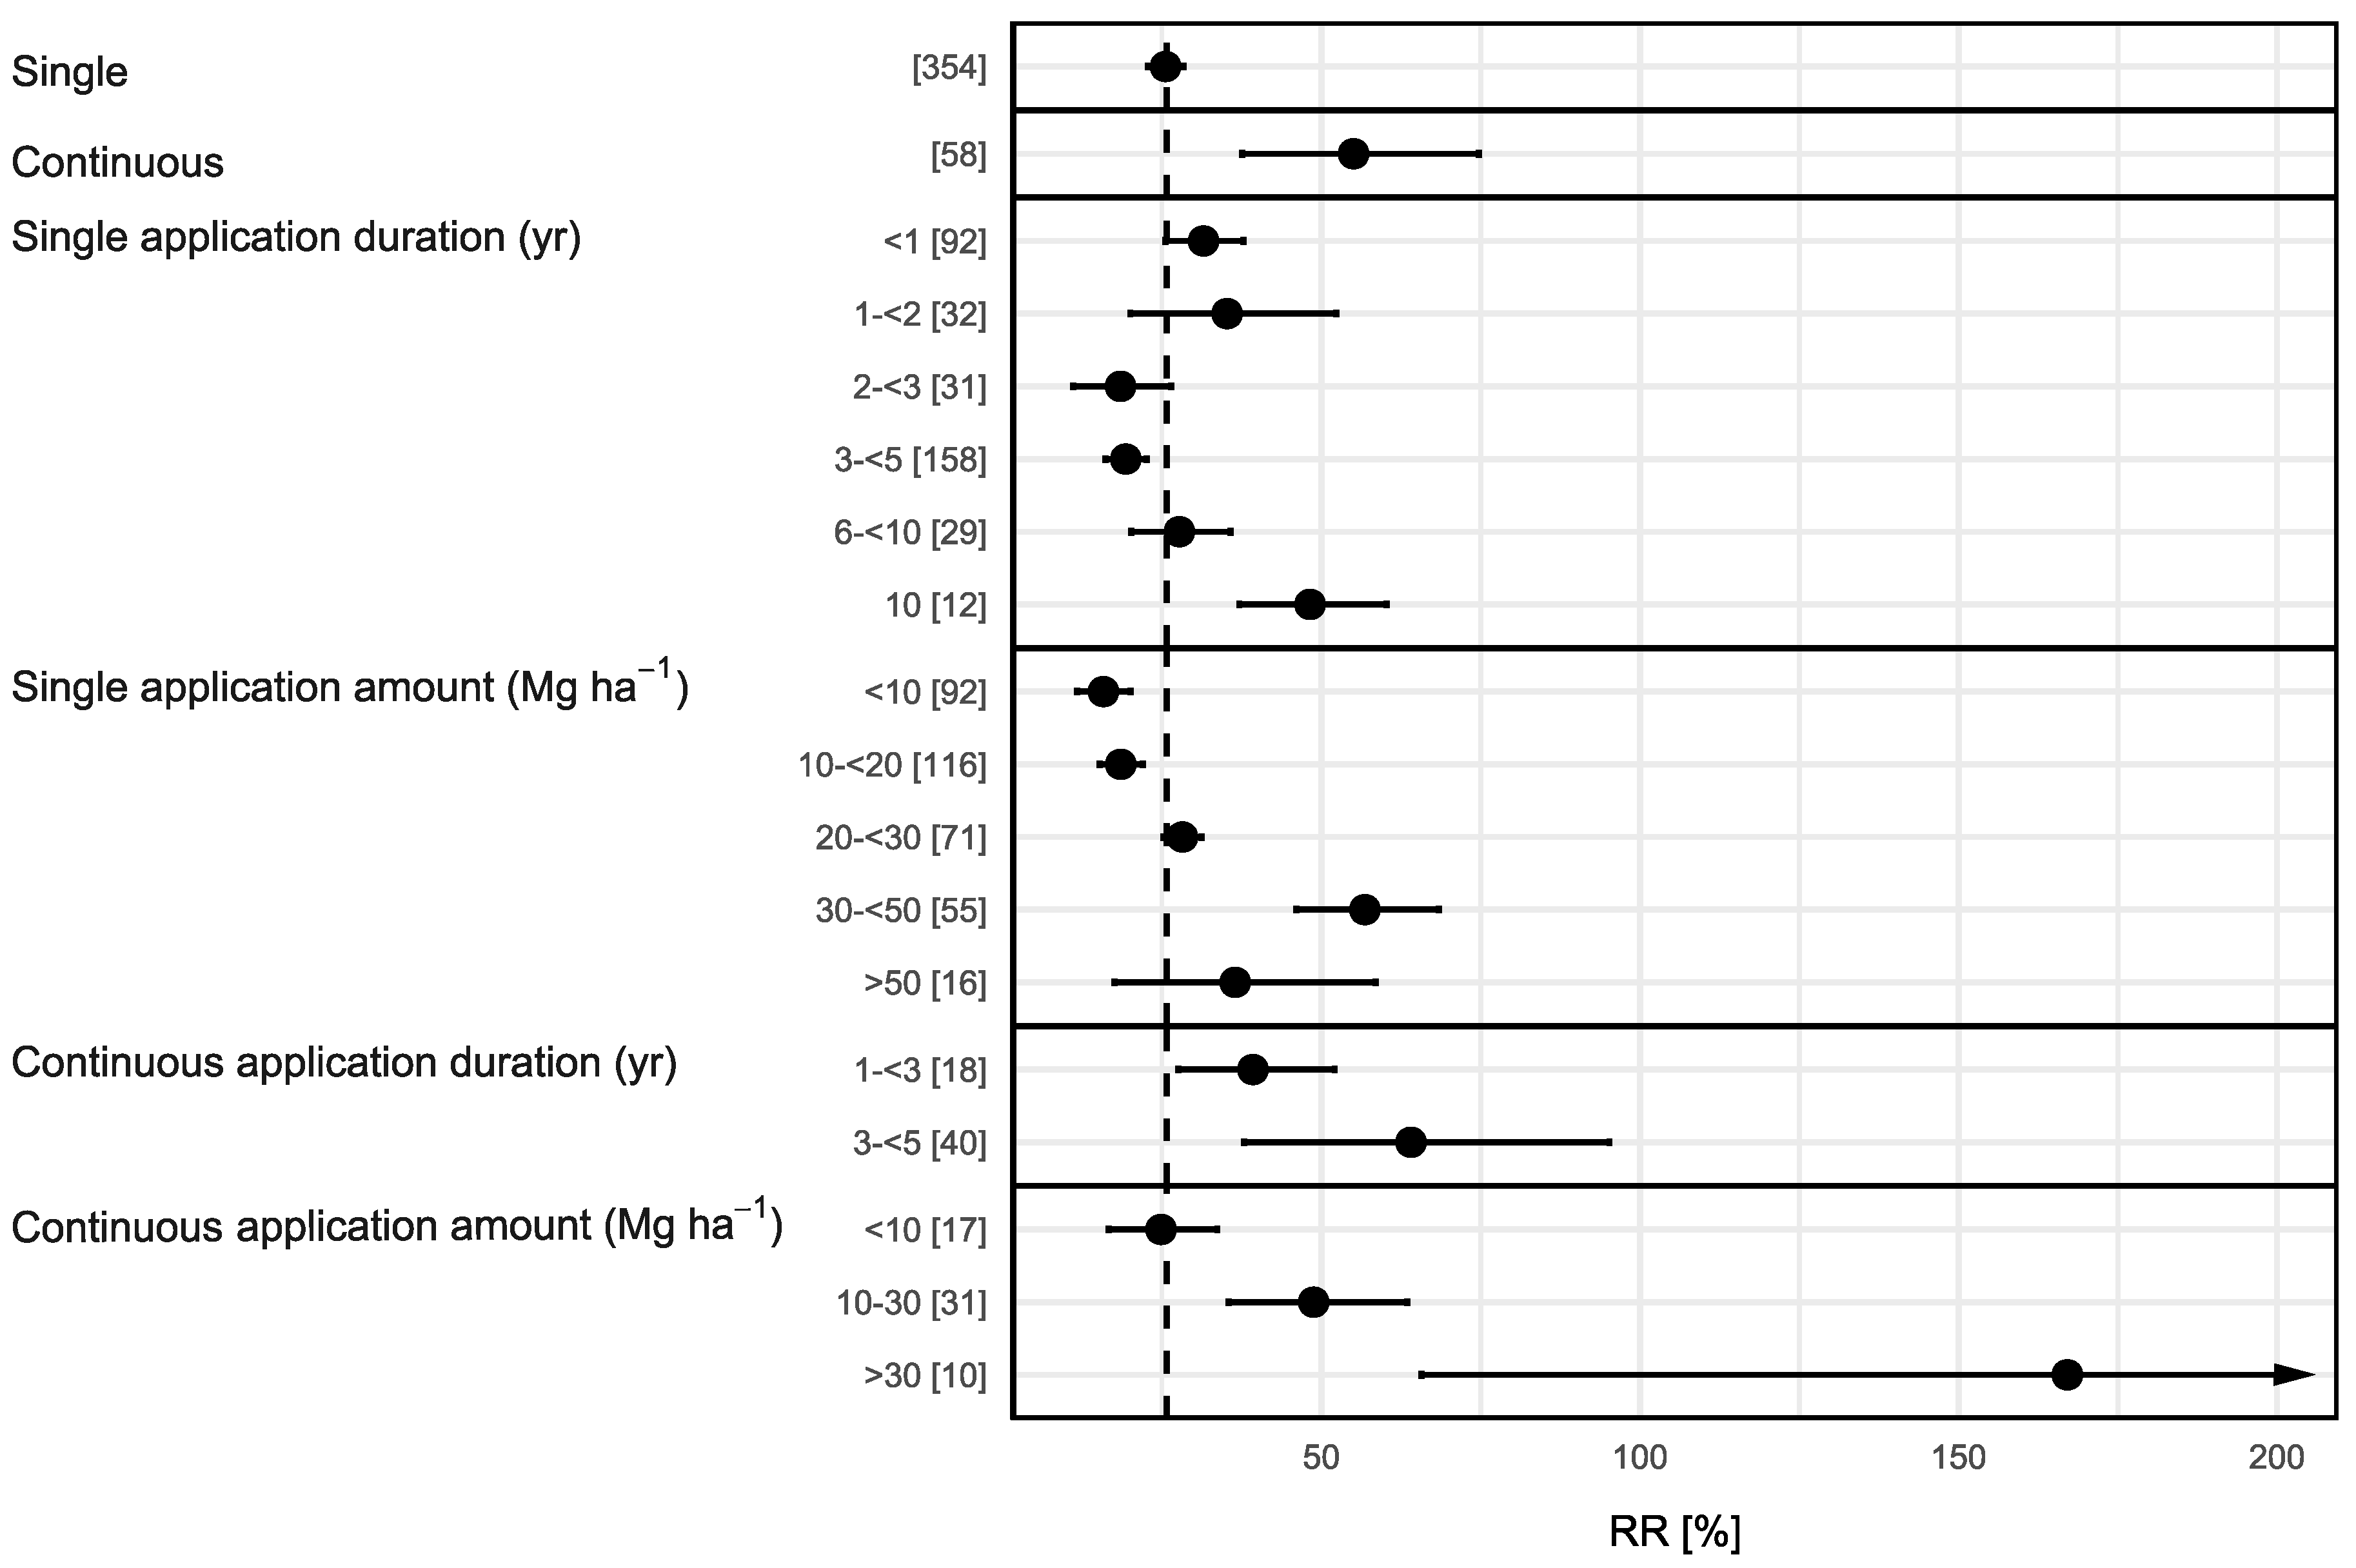
3.2. Single vs. Continuous Biochar Application

Whether biochar was applied only once at the beginning of a field experiment or repeatedly (e.g., each year or at the beginning of a growing season) significantly influenced the relative increase in SOC stock. Single applications raised SOC stocks by 26% while continuous applications led to a mean of 55% SOC stock increase at the end of the experiments (Figure 5). This difference in the relative SOC stock magnitude can be explained by different transport mechanisms and dissipation processes that determine biochar loss [61]. Microbial decomposition reduces biochar C by 0.5% in one year [62] and total biochar amount in soils by 2.2% after two years [63]. Other biochar losses are due to leaching of dissolved organic carbon (~2% over two years) [63], vertical transport (9–19%) [64], and lateral transport (20–53%) [63]. By re-applying biochar annually, those biochar losses are mitigated and SOC stocks are restored.

3.3. Duration Effect
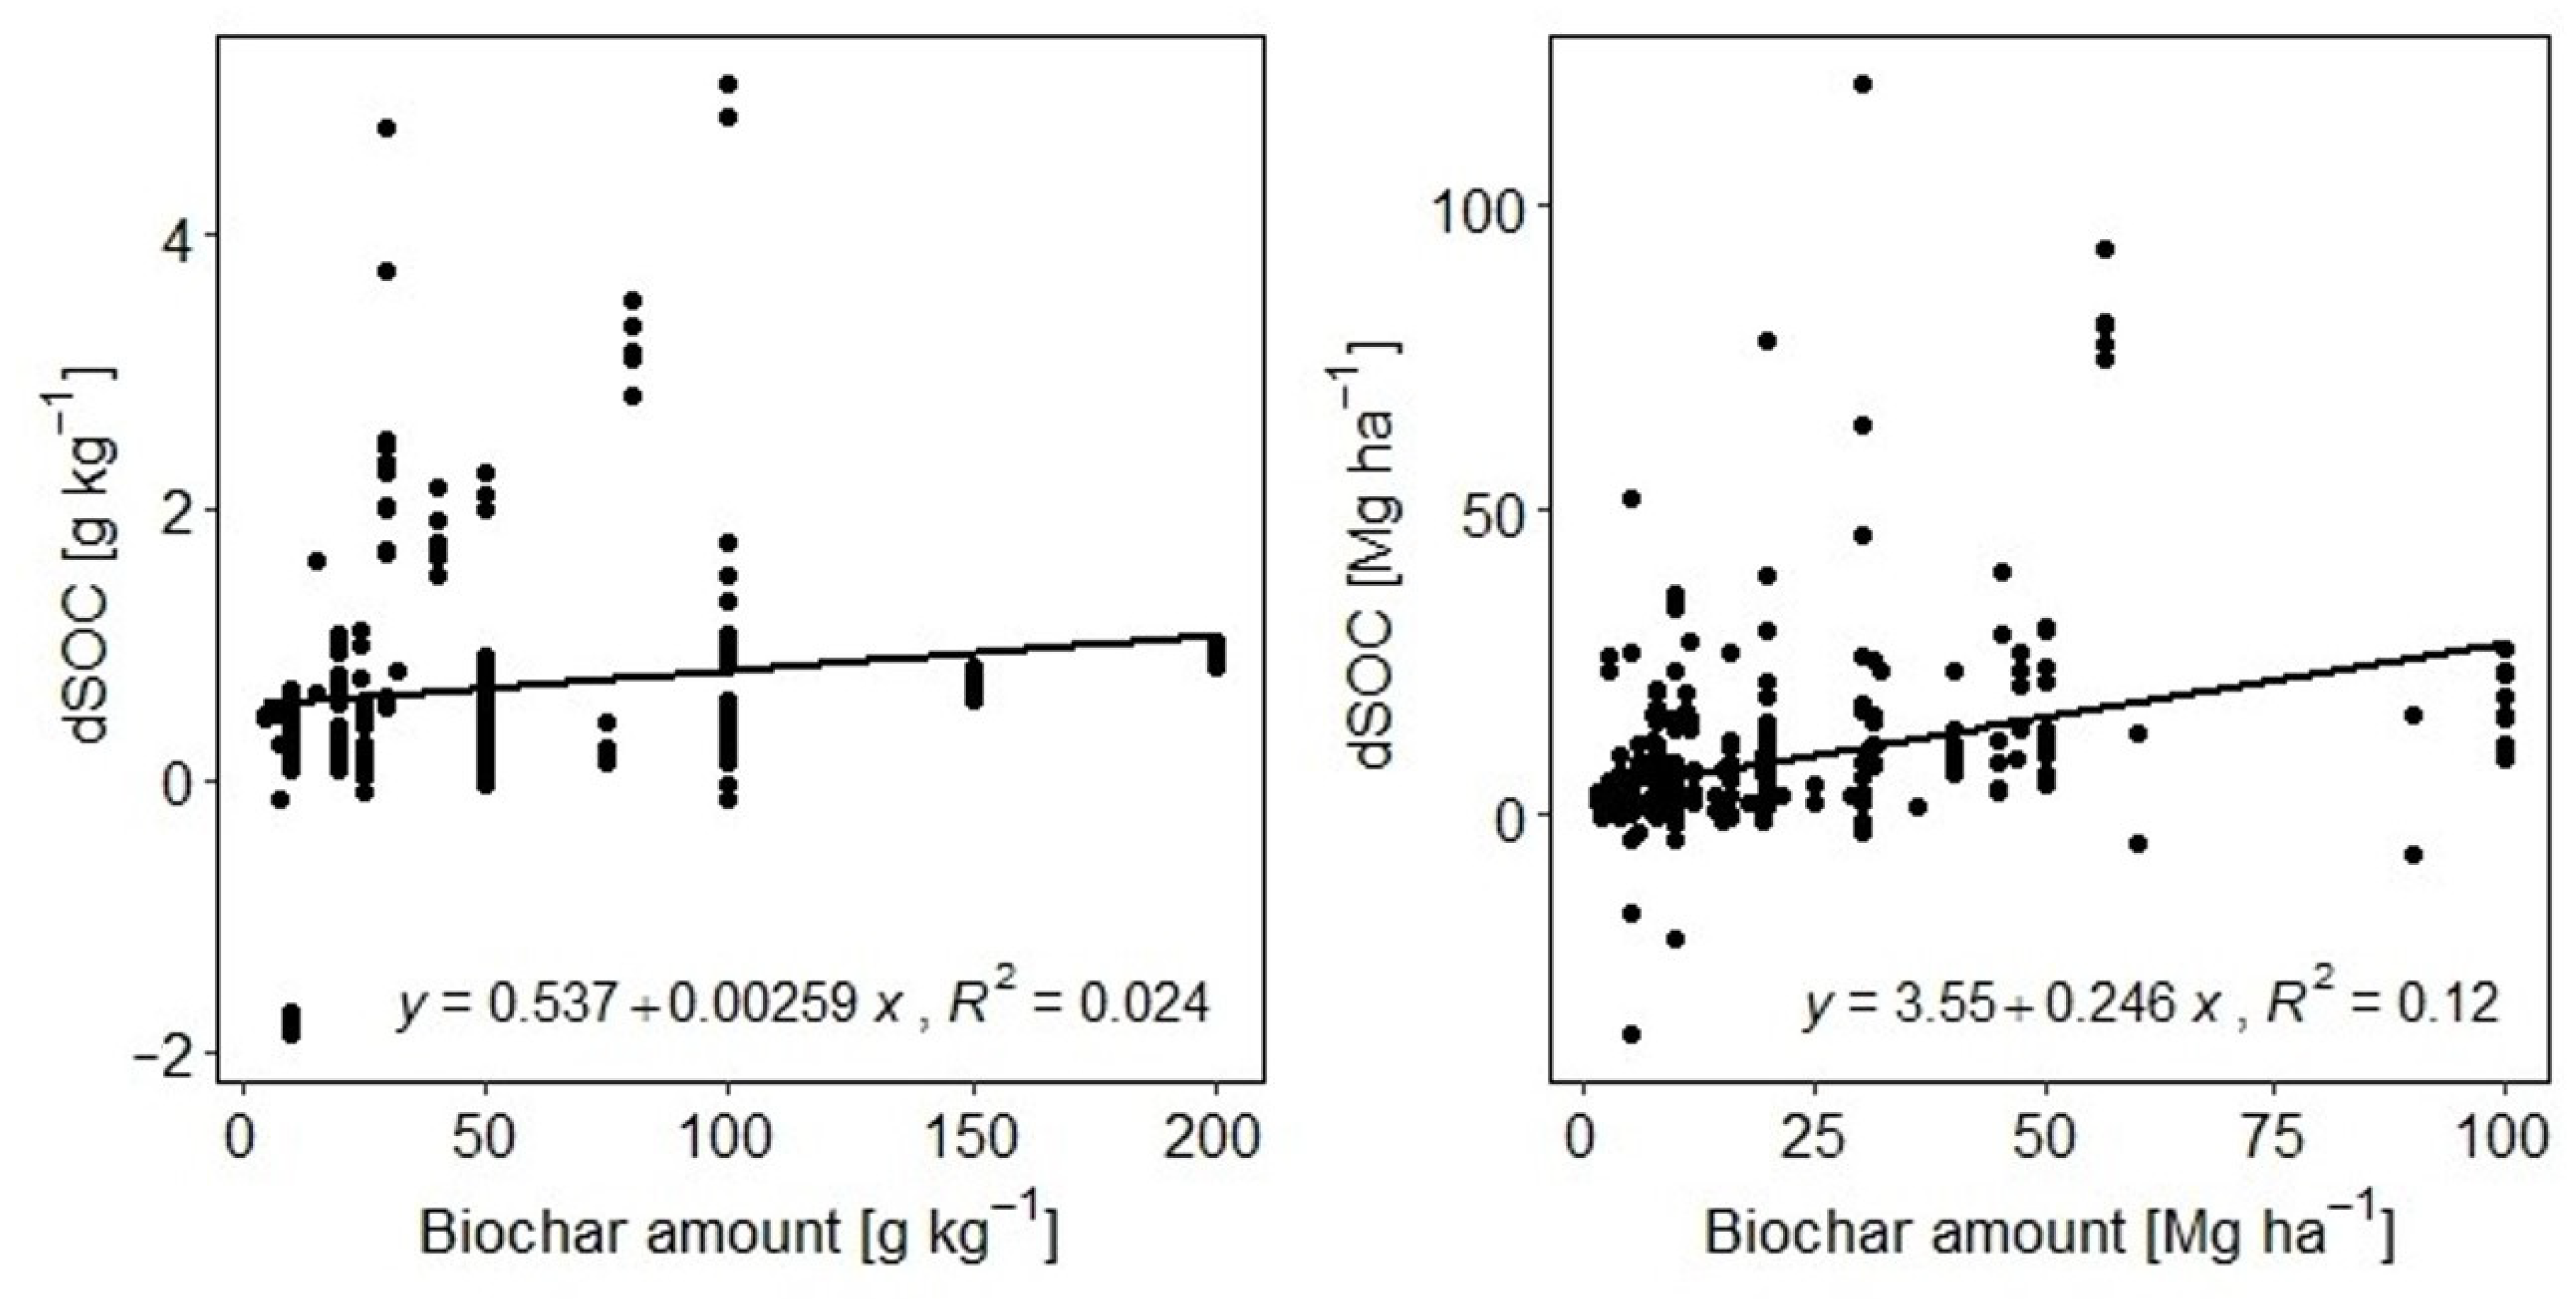
The experimental duration was grouped into six different classes, of which two can be described as short-term (<1 yr and 1–<2 yr), two as mid-term (2–<3 yr and 3–<5 yr), and two as long-term (6–<10 yr and 10 yr). The results of these duration classes show a highly interesting pattern in which short and long-term treatments led to higher absolute and relative SOC increases. This effect was irrespective of whether biochar was applied once or repeatedly (Figure 5 and Figure 6). The same principle was observed in the non-field dataset. At experiments durations of less than 10 days, SOC increased absolutely and relatively from 5.3 g kg−1 and 60%, respectively. In the case of long-term experiments with durations longer than 500 days, the SOC increase was up to 9.6 g kg−1 and 163%.
A high SOC increase in the short term is due to the application and incorporation of fresh and C-rich biochar into the soil. This initial exposition of fresh biochar leads to a high microbial response and the turnover of the labile C fractions, often referred to as a positive priming effect [24]. Positive and negative biochar-induced priming can co-exist but negative priming is more important in the long-term [62]. Microbes prefer the utilization of easily degradable C pools, but they deplete with time [24,62]. Additionally, biochar-C losses through microbial turnover are marginal compared to losses through erosion and vertical/lateral transport [62,63]. In the short-term, the availability of labile biochar-C enhances microbial turnover and a loss of oxygen. With increasing time, the stable residue biochar-C is only slightly degraded. However, the O content increases here due to the formation of O-containing functional groups [65].
Overall, durations of ten years led to the highest absolute (25.5 Mg ha−1) and relative (48%) SOC increase, and surprisingly, these results were significantly higher than the SOC stock magnitudes of all shorter duration classes. Long-term SOC enrichments are consistent with previous research on Terra Preta soils, where over a time span of ~2000a, SOC stocks were three times higher and biochar stocks were 70 times more enriched than neighboring soils [66]. This is an even larger increase in SOC stock than observed in our dataset. Therefore, biochar seems to stimulate also non-biochar SOC sequestration with increasing time, up to very long durations. But at the same time, no biochar application experiments with an experimental duration longer than ten years could be identified, thus the long-term description of SOC stocks is still limited. It also means that biochar plays one of many key roles in SOM formation in Terra Pretas, and it is more likely that a combination of nutrient-rich household wastes, excrements, bones, ash, and charred material caused SOC and nutrient enrichment in Terra Pretas [66]. In addition, this assumption is supported by our results on the combined application of biochar and organic fertilizers, as described earlier.

3.4. Amount Effect

Increasing biochar application amounts showed a positive relationship with absolute SOC increases in both “field” and “non-field” treatments (Figure 7). Low amounts, <10 Mg ha−1, led to significantly lower absolute and relative SOC increases than higher amounts of >20 Mg ha−1. This relationship is irrespective of whether the biochar was applied once or repeatedly (Figure 5 and Figure 6). Similar amounts of responses were observed in the non-field dataset. An exception was observed at amounts >10–30 g kg−1, where an increase at low amount levels appeared, but this increase was not significant. Different meta-analysis have shown that C-rich soil amendments such as straw [13] and manure [17,18,19] increase SOC with increasing C input amounts. Maillard and Angers (2014) also found the manure C input as the most decisive global influencing factor for increasing SOC stocks [17]. Similar dynamics were therefore expected within our approach. Possible saturation effects, as observed with straw returns [14], are not to be expected in the case of biochar. The observations of anthropogenic dark earths, in which the SOC content could be increased three times over adjacent soils by the use of pyrogenic C in the course of hundreds to thousands of years [2,67], contradict the saturation effects. However, in order to disprove this irrevocably, long-term field tests are required, since saturation effects require experiment durations of about 26 years to occur [14,68].

3.5. Soil Depth Effect

SOC increases after the application of biochar were higher in shallow compared to deep soil regions. The highest magnitudes were achieved if treatments sampled between 0–15 (15.1 Mg ha−1 and 29%) and 0–20 cm (14.4 Mg ha−1 and 29%). Both depth classes showed significantly higher SOC enrichment compared to 0–30 cm (8.4 Mg ha−1) or higher than 30 cm soil thickness (2.1 Mg ha−1), where the increase was not significant. But this finding is ambiguous as it might be related to the low number of five repetitions. A depth-related decline in SOC responses after incorporation of soil amendments was already observed in recent research [18], and it can be expected due to the corresponding dilution effect. There is still an ongoing debate concerning whether the SOC increases after the application of certain management decisions, e.g., reduced tillage, agroforestry, or soil amendments, are accountable across the whole soil profile [18,69,70,71,72]. The depth-wise decline is connected to the fact that biochar is generally incorporated into the topsoil or only into shallow soil depth. According to our subgroup analysis, SOC stock increases in shallow soil regions were higher under reduced tillage, whereas in intermediate soil depths (0–20 cm and 0–30 cm), conventional tillage showed stronger increases (Table S7). In soil depths 10–30 cm, reduced tillage soils showed a higher absolute SOC stock increase than conventionally tilled soils. However, only four observations under conventional tillage could be observed, leading to large error bars and nonsignificant results. These results demonstrate that SOC stock increases in different soil depths are connected to tillage, confirming previous findings [60]. The downward migration of biochar and SOC depend on tillage [64], soil texture and particle size distribution [64], rainfall amounts and hydraulic conductivity [63,64], and the activity of soil fauna and thus bioturbation [63]. As vertical biochar migration takes time, we expect the SOC stocks to increase in deeper soil regions only in the long-term. However, up to now, there has been a lack of long-term field experiments that could deliver proof of concept.
SOC sequestration processes are particularly important in deeper soil regions because subsoils are generally far from being saturated [6,73]. During downward migration, SOC is subject to preferential sorption to minerals, especially as dissolved organic carbon [73], which often have large surface areas due to high clay content and greater abundance of Fe and Al hydrous oxides in deep soil regions [74,75,76]. Moreover, the translocation of SOC in deeper soil regions can increase its persistence. Globally, more than 50% of SOC is stored below ~20 cm [77,78], with ages ranging from about 1000 to 10,000 years [77,79,80,81].

3.6. Climate Effect

In the field dataset (Figure 1 and Figure 2), the highest absolute SOC increase was observed in temperate regions (15.7 Mg ha−1) and the highest relative SOC increase after biochar application was achieved in subtropical climates (50%). The non-field treatment results were comparable. Temperate (11.3 g kg−1 and 113%) and subtropical climates (6.5 g kg−1 and 94%) achieved higher SOC content increases than soil under tropical climate (4.6 g kg−1 and 43%). These findings are consistent with previous results obtained from different soil amendments [17,18,52], where absolute SOC increases under subtropical and temperate climate were generally higher. In our dataset, biochar applications under tropical conditions led both to significantly lower absolute (7.2 Mg ha−1) and relative SOC increase (14%) than in any other climate region. In tropical soils with higher initial SOC, both absolute and relative SOC stock increases were at high levels (Table S8). Research on “Terra Preta” genesis has demonstrated that with the use of soil amendments, especially biochar, high amounts of SOC could be sequestered over hundreds of years in tropical soils and could generate highly fertile soils [2]. Similar dynamics were observed in West Africa, also a region characterized by generally low initial SOC, where the historic application of soil amendments led to formation of carbon-rich and highly fertile African Dark Earths [82]. Biochar application studies nowadays, generally restricted to a duration of 3–5 years, cannot display such long-term effects. Therefore, we suggest to either perform field application studies over a longer time frame, or to revisit or reanalyze locations where biochar has been applied longer ago.

3.7. Tillage Intensity Effect

Tillage intensity data were provided for 299 treatments, of which 88 were performed under reduced tillage, resulting in a lower relative SOC increase of 14% than conventionally tilled soils with 27%. A similar pattern is observed for absolute SOC change, where reduced tillage soils showed a lower absolute SOC stock increase of 7.3 Mg ha−1 than conventionally tilled soils with 14.3 Mg ha−1. Similar results were observed after the application of manure [18]. More intensive tillage promotes soil aeriation and thus decay and decomposition. These oxidative conditions could promote the formation of humic substances [83]. Additionally, tillage could also favor biochar incorporation into the soil, as opposed to soil surface or shallow application. This enables biochar C to reach deeper soil region more easily. This effect has already been observed with manure application, which led to greater increases in deeper soil regions with conventional tillage, but also caused a significant increase in SOC content at depths below 30 cm with reduced tillage [18]. In any case, biochar application should be combined with tillage to maximize SOC sequestration.

3.8. Crop Effect

Out of 412 field treatments, 410 provided information on crop type. The largest significant SOC gain was achieved by the combination of grains with “others”, a variety of crops appearing with a low number of replicates in the dataset. This combination led to a high absolute SOC increase of 35.2 Mg ha−1 and a relative SOC increase of 80%, and shows a large error bar, due to the small group size (n = 4). The second highest combination was grain, which led to both a high absolute SOC increase of 40.3 Mg ha−1 and a high relative SOC increase of 66%. Grain treatments conducted only for one season led to an absolute SOC increase of 13.3 Mg ha−1 and a relative SOC increase of 28%. In contrast, maize treatments showed the highest SOC sequestration if the experiment was only conducted for one growing season (dSOC = 12.8 Mg ha−1, RR[%] = 36%). Maize-bean combinations led to a SOC increase of 20.6 Mg ha−1 corresponding to 34%, whereas maize-grain combinations showed an absolute SOC stock increase of 10.5 Mg ha−1 and a relative SOC increase of 27%. Cultivation of beans and grass did not significantly increase SOC stocks. The implementation of a diverse crop rotation with more than two crops led to a SOC increase of 15.8 Mg ha−1 corresponding to 31%. Our data suggests that double-cropping systems show higher SOC accumulation after biochar application than single cropping systems. But these results show high variation and partly large error bars. Generally, more diverse crop rotations improve various ecosystem services and additionally offer the potential to increase SOC content [84]. In addition to ecological benefits, multiple-cropping systems also offer economic advantages and possibilities for farmers to adapt to climate change [85].

3.9. Fertilizer Effect

Additional organic fertilizer application led to higher SOC stock increases compared to biochar alone (Figure 1 and Figure 2), which was already shown elsewhere [34]. The opposite was observed with additional synthetic fertilizer use compared to biochar alone. In non-field treatments (Figure 3 and Figure 4), additional synthetic fertilizer also led to a lower SOC increase than without synthetic fertilizers (7.9 vs. 2.5 g kg−1 and 61 vs. 73%). Organic fertilizer input led to an opposite effect with higher SOC increases than in the unfertilized group (17.3 vs. 6.6 g kg−1 and 109 vs. 68%).
Synthetic fertilizers deliver nutrients, mainly NPK, enhance net primary production, stimulate microbial activity and thus C and N turnover, resulting in increased biomass output [86,87,88]. Organic fertilizers, however, not only provide nutrients, but also serve as a C source. Depending on the C content and C/N ratio, organic fertilizer amendments such as manure, straw, or slurry can increase and stabilize SOC stocks in the long term [13,14,18,52]. Research on Terra Preta concluded that not only biochar itself, but the combination of stable pyrogenic C, labile C fractions, and other source of nutrients such as composts and manures formed the highly fertile and C-rich tropical soils, as biochar comprises only about 20% of the SOM present in Terra Preta [66].

3.10. Soil Texture Effect

Soil texture differences in the dataset showed a clear relationship between an increasing SOC stock response with increasing clay content, both in relative and absolute terms. Biochar applications to clay soils resulted in the highest SOC stock increase (17.7 Mg ha−1 and 52%), followed by silty soils (12.8 Mg ha−1 and 31%) and loamy soils (15.3 Mg ha−1 and 25%). Sandy soils showed the lowest overall increases (6.1 Mg ha−1 and 21%), which was significantly lower than applications to other differently textured soil. In general, higher clay mineral content in finer textured soils not only provides physical protection of SOC to enzymatic activity and thus turnover [89,90], but also increases SOC stability in the form of aggregates [91,92]. With decreasing grain size, the physical protection is reduced and SOC is exposed to oxidation and thus decomposition [18], as well as SOC losses due to leaching and runoff [93]. Different SOC increases related to different soil texture classes are due to the various processes, that are driven by soil grain size.
Unexpectedly, the non-field treatments identified clay soils with the lowest results out of the four observed texture classes (2.5 g kg−1 and 20%). Sand (11.0 g kg−1 and 90%) and especially silt (16.6 g kg−1 and 119%) and loam (8.9 g kg−1 and 175%) showed significantly higher SOC sequestration potential. This difference to the field dataset is due to the importance of initial SOC for SOC increase dynamics [68]. Sandy soils generally show lower initial SOC contents, which can be seen in the non-field dataset (23 out of 25 observations with initial SOC content < 10 g kg−1) and in the field dataset (99 out of 119 observations with initial SOC < 15 g kg−1). In both datasets, low absolute increases in the SOC content or the SOC stock corresponded with high relative SOC magnitudes (Table S9). Similar effects were already observed in soils after manure application [18]. Under field conditions, sandy soils are subject to higher biochar and SOC losses than under controlled greenhouse or laboratory conditions. For this reason, relative SOC increases were higher in the field dataset, especially if the initial SOC content was between 5 and 10 g kg−1 (SOC content increase of 131.52%) (Table S9). The low relative and absolute SOC increases in clay soils in the non-field dataset, however, are due to the fact that clay treatments could only be found in two studies, with one study using biochar with a comparably low C content and low C/N ratios, and the soil used was acidic [94], and the second using NPK fertilizer in most treatments [38].

3.11. Soil pH Effect

Neutral soils (pH 6.5–7.5) significantly accumulated more SOC (19.4 Mg ha−1 and 42%) than acidic soils (pH < 6.5; 11.6 Mg ha−1 and 21%) after the application of biochar. Alkaline soils (pH > 7.5) showed a SOC increase of 12.8 Mg ha−1 corresponding to 34%, and thus showed a good potential to increase SOC stocks. SOC increases in the non-field dataset followed similar trends as seen in the field dataset with neutral (53% and 5.3 g kg−1) and alkaline soils (8.1 g kg−1 and 117%) showing larger increases than acidic soils 4.1 g kg−1 and (57%). Our findings of field and non-field treatments are consistent with previous research on biochar applications to soils with different pH [34]. Biochar application to acidic soils leads to an enhanced biochar and SOC degradation [14,95]. Liu et al. (2016) explained this finding with higher positive priming effect and higher native SOC mineralization after biochar use in acidic soils than following the addition to neutral or alkaline soils [34]. Therefore, biochar has higher stability in neutral or alkaline soils. Additionally, higher amounts of Ca2+ ions in neutral and alkaline soils could favor mineral-organic complex formation [18].

3.12. Initial SOC Effect

Low initial SOC content < 10 g kg−1 led to high relative SOC increase, both in the field and in greenhouse/laboratory treatments (Figure 1, Figure 2, Figure 3 and Figure 4), as previously shown for manure amendments [18]. However, the fact that the highest relative and absolute SOC increase was observed in SOC-rich soils > 20 g kg−1 (Figure 3 and Figure 4) was surprising, as this contradicts previous findings with manure amendments [18] and highlights the potential to increase SOC stocks by biochar application irrespective of the current or initial SOC content. With respect to the differences in the C content between manure and biochar, it becomes clear why both amendments respond differently to initial SOC content. Biochar has a much higher C content than manure and therefore generally exerts a greater influence on the soil carbon balance, even if the soil already contains of a relatively high SOC content. In addition, biochar-C is much more stable than any other SOM component.

3.13. Biochar C and C/N Effect

In the “field” dataset, the highest absolute and relative SOC increases were observed when biochar contained more than 70% C. A high magnitude of 20.0 Mg ha−1 and 37% could also be found if the C content of biochar was below 50% (Figure 1 and Figure 2). In the “non-field” dataset, the C content of biochar positively influenced the relative SOC increase. When the biochar C content was 60% or higher, the relative increase was 119% and thus higher than at lower C content (Figure 3 and Figure 4). However, higher absolute SOC increases could not be observed. The findings in both datasets indicate that the biochar C content has a secondary role in relation to SOC increase dynamics.
Additionally, there was no clear statistical evidence in either dataset whether a relatively low C/N ratio or a relatively high C/N ratio indicates a higher SOC increase. A high relative gain, however, was observed in the “field” dataset if C/N was >300 (40%), and the highest absolute increase was found at a relatively high C/N of 200–300 (31.2 Mg ha−1). The C and N content of biochar and their ratio are generally very decisive values for biochar stability and the formation of SOC [34]. Higher biochar C contents logically lead to larger C inputs, with positive effects on SOC. Low biochar C/N ratios have shown to increase soil respiration and CO2 flux [34], due to higher N availability and thus higher microbial C mineralization rates [96,97]. Consequently, high biochar C/N ratios in turn led to an increase in SOC [34]. However, these effects could not be statistically substantiated in either of the two datasets.

3.14. Biochar Feedstock Effect

Different biochars vary in their ability to alter soil properties [34] due to varying structural components in their parent material [98,99], referred to as their feedstock. Therefore, it was not surprising that there were large differences in the SOC stock magnitudes after the application of biochar retrieved from different feedstocks. The highest magnitude overall was found with straw as the feedstock (55% and 18 Mg ha−1), followed by crop residues (11.0 Mg ha−1 and 36%). Woods showed a comparatively high dSOC value of 16.4 Mg ha−1 but a low relative gain (16%). Overall, plant and wood-based sources showed a higher performance than biochars retrieved from animal excreta (10.8 Mg ha−1 and 22%). These findings are consistent with previous research [34] and are connected to higher C/N ratios in plant and wood based biochar (mean of 65.7 in our datasets) and contrarily low C/N ratios of manure and excreta based biochar (mean of 18.1 in our datasets), which generally show enhanced C mineralization rates due to higher microbial N availability, as described in the previous chapter. In the contrary, high C/N ratios have positive effects on SOC, as described above. Straw and especially wood as biochar feedstock led to the highest SOC responses in non-Field studies with dSOC of 6.0 and 12.6 g kg−1 and RR% of 84% and 103%, respectively. Crop residues, however, did not show as large increases (4.7 g kg−1 and 35%) as in the field-dataset. They were even lower than SOC increases of biochars retrieved from excreta feedstock (6.0 g kg−1 and 62%). This difference in the impact of crop residue biochar between both datasets (field vs. non field) is due to much higher C/N ratios of crop residue-based biochar used in field treatments (mean of 202.0) compared to biochar in non-field treatments (mean of 63.0).

3.15. Biochar Cation Exchange Capacity and Specific Surface Area Effect

Biochars’ CEC did not show significant differences among groups. However, biochars with a medium CEC of 10–50 cmol kg−1 raised SOC stocks the largest (18.3 Mg ha−1 and 66%). Regarding biochars’ surface area, high SOC stock increases (33.0 Mg ha−1 and 72%) were observed if the surface area was high (>100 m2 g−1) (33.0 Mg ha−1 and 72%). However, this observation showed a large error bar, and thus the difference was not significant. Below 100 m2 g−1, the different surface area classes did not vary significantly. In non-field treatments, the highest SOC increases were achieved if the CEC was higher than 50 cmol kg−1. However, only eight treatments were analyzed, and thus they showed a large range. Regarding the SOC increase as a result of a high biochars’ surface area, results were also quite ambiguous at least in their relative increase. Here, low surface areas <10 m2 g−1 as well as higher areas >100 m2 g−1 led to large increases with 74% and 62%, respectively. The absolute increase, however, showed a clear tendency regarding high areas with a dSOC of 13.7 g kg−1. But still, this result did not significantly differ from the lower biochars’ surface area subgroups.
The surface area is an important indicator of the adsorption rate and porosity of biochar when biochar is added to soil [100,101], whereas the CEC determines the biochars’ ability to exchange cations with the soil solution [101,102,103]. Both biochar properties have influences on the soil quality after application such as water retention [104], nutrient availability, and biomass production. High aboveground and root biomass, and therefore additional C inputs into soil, favor SOC sequestration. Increases in both properties in our datasets seem to have positive effects on SOC. However, it is not possible to draw definitive conclusions from our datasets.

4. Conclusions

We present a quantitative and systematic global evaluation of the C sequestration potential of biochar as a soil amendment with respect to a wide range of site and soil characteristics and differences between laboratory and field studies. Based on a meta-analysis approach, we found that biochar has a huge ability to increase and stabilize SOC.
SOC sequestration potential differed significantly between field treatments and treatments conducted in greenhouses and laboratories, with lower responses observed on a field scale. Our study indicated that SOC sequestration upon biochar application was highest under alkaline soil pH, additional organic fertilizer, plant residues as biochar feedstock, and finer soil texture. As the longest reported study was 10 years, it is very difficult to extrapolate SOC sequestration potential beyond this time scale. Therefore, longer term biochar field experiments longer than 10 years are urgently needed to evaluate the climate change mitigation potential of biochar.
Further research should therefore conduct field application studies over a longer time frame or re-visit and re-analyze locations where biochar has been applied longer ago, and respect subsoil processes to achieve a holistic understanding of SOC turnover and stabilization dynamics across the soil profile.

Supplementary Materials

The following are available online at https://www.mdpi.com/article/10.3390/agronomy11122474/s1. Table S1: Overview of the studies in the “field” dataset and their treatments and results. Table S2: Overview of the studies in the “non-field” dataset and their treatments and results. Table S3: Overview of the results of the random effects model as well as their statistics in the “field dataset”. Shown is the RR according to Hedges et al. 1999 and converted into percent. From column L onwards, measures of heterogeneity of the random effects model are presented, once for the entire data set and once for within groups. Table S4: Overview of the results of the random effects model as well as their statistics in the “field dataset”. Shown is the absolute mean difference dSOC. From column L onwards, measures of heterogeneity of the random effects model are presented, once for the entire data set and once for within groups. Table S5: Overview of the results of the random effects model as well as their statistics in the “non-field dataset”. Shown is the RR according to Hedges et al. 1999 and converted into percent. From column L onwards, measures of heterogeneity of the random effects model are presented, once for the entire data set and once for within groups. Table S6: Overview of the results of the random effects model as well as their statistics in the “non-field dataset”. Shown is the absolute mean difference dSOC. From column L onwards, measures of heterogeneity of the random effects model are presented, once for the entire data set and once for within groups. Table S7: Results of the subgroup analysis Tillage x Soil depth obtained from a mixed-effects model. Results from the field dataset are presented. Table S8: Results of the subgroup analysis Climate x Initial SOC obtained from a mixed-effects model. Results from the field dataset are presented. Table S9: Results of the subgroup analysis Soil texture x Initial SOC obtained from a mixed-effects model. Results from the non-field and the field dataset are presented. Table S10: Reference list of the literature used in this meta-analysis.

Author Contributions

Conceptualization, A.G. and B.G.; writing—original draft preparation, A.G.; writing—review & editing, A.G., T.B. and B.G.; visualization, A.G.; supervision, B.G. All authors have read and agreed to the published version of the manuscript.

Funding

Open access funding enabled and organized by DEAL.

Institutional Review Board Statement

Not applicable.

Informed Consent Statement

Not applicable.

Data Availability Statement

All data and material used for calculation are provided in the Supplementary Materials and the manuscript.

Acknowledgments

The authors acknowledge the financial support of the Open Access Publication Fund of the Martin Luther University Halle-Wittenberg.

Conflicts of Interest

The authors declare no conflict of interest.

References

  1. Lehmann, J.; Kleber, M. The contentious nature of soil organic matter. Nature 2015, 528, 60–68. [Google Scholar] [CrossRef] [PubMed]
  2. Glaser, B.; Birk, J.J. State of the scientific knowledge on properties and genesis of Anthropogenic Dark Earths in Central Amazonia (terra preta de Índio). Geochim. Cosmochim. Acta 2012, 82, 39–51. [Google Scholar] [CrossRef]
  3. Minasny, B.; Malone, B.P.; McBratney, A.B.; Angers, D.A.; Arrouays, D.; Chambers, A.; Chaplot, V.; Chen, Z.-S.; Cheng, K.; Das, B.S.; et al. Soil carbon 4 per mille. Geoderma 2017, 292, 59–86. [Google Scholar] [CrossRef]
  4. Lal, R. Carbon sequestration. Phil. Trans. R. Soc. B 2008, 363, 815–830. [Google Scholar] [CrossRef] [PubMed]
  5. Lal, R.; Negassa, W.; Lorenz, K. Carbon sequestration in soil. Curr. Opin. Environ. Sustain. 2015, 15, 79–86. [Google Scholar] [CrossRef]
  6. Lal, R.; Follett, R.F.; Stewart, B.A.; Kimble, J.M. Soil carbon sequestration to mitigate climate change and advance food security. Soil Sci. 2007, 172, 943–956. [Google Scholar] [CrossRef]
  7. Rumpel, C.; Amiraslani, F.; Chenu, C.; Garcia Cardenas, M.; Kaonga, M.; Koutika, L.-S.; Ladha, J.; Madari, B.; Shirato, Y.; Smith, P.; et al. The 4p1000 initiative: Opportunities, limitations and challenges for implementing soil organic carbon sequestration as a sustainable development strategy. Ambio 2020, 49, 350–360. [Google Scholar] [CrossRef] [Green Version]
  8. Bernacchi, C.J.; Hollinger, S.E.; Meyers, T. The conversion of the corn/soybean ecosystem to no-till agriculture may result in a carbon sink. Glob. Chang. Biol. 2005, 11, 1867–1872. [Google Scholar] [CrossRef]
  9. Schlesinger, W.H.; Amundson, R. Managing for soil carbon sequestration: Let’s get realistic. Glob. Chang. Biol. 2019, 25, 386–389. [Google Scholar] [CrossRef] [Green Version]
  10. Leifeld, J.; Fuhrer, J. Organic farming and soil carbon sequestration: What do we really know about the benefits? Ambio 2010, 39, 585–599. [Google Scholar] [CrossRef] [Green Version]
  11. Gattinger, A.; Muller, A.; Haeni, M.; Skinner, C.; Fliessbach, A.; Buchmann, N.; Mäder, P.; Stolze, M.; Smith, P.; Scialabba, N.E.-H.; et al. Enhanced top soil carbon stocks under organic farming. Proc. Natl. Acad. Sci. USA 2012, 109, 18226–18231. [Google Scholar] [CrossRef] [Green Version]
  12. De Stefano, A.; Jacobson, M.G. Soil carbon sequestration in agroforestry systems: A meta-analysis. Agroforest. Syst. 2017, 92, 285–299. [Google Scholar] [CrossRef]
  13. Berhane, M.; Xu, M.; Liang, Z.; Shi, J.; Wei, G.; Tian, X. Effects of long-term straw return on soil organic carbon storage and sequestration rate in North China upland crops: A meta-analysis. Glob. Chang. Biol. 2020, 26, 2686–2701. [Google Scholar] [CrossRef]
  14. Liu, C.; Lu, M.; Cui, J.; Li, B.; Fang, C. Effects of straw carbon input on carbon dynamics in agricultural soils: A meta-analysis. Glob. Chang. Biol. 2014, 20, 1366–1381. [Google Scholar] [CrossRef] [PubMed]
  15. Pitombo, L.M.; Carmo, J.B.d.; de Maria, I.C.; de Andrade, C.A. Carbon sequestration and greenhouse gases emissions in soil under sewage sludge residual effects. Sci. Agric. (Piracicaba Braz.) 2015, 72, 147–156. [Google Scholar] [CrossRef]
  16. Soriano-Disla, J.M.; Navarro-Pedreño, J.; Gómez, I. Contribution of a sewage sludge application to the short-term carbon sequestration across a wide range of agricultural soils. Environ. Earth Sci. 2010, 61, 1613–1619. [Google Scholar] [CrossRef]
  17. Maillard, É.; Angers, D.A. Animal manure application and soil organic carbon stocks: A meta-analysis. Glob. Chang. Biol. 2014, 20, 666–679. [Google Scholar] [CrossRef]
  18. Gross, A.; Glaser, B. Meta-analysis on how manure application changes soil organic carbon storage. Sci. Rep. 2021, 11, 5516. [Google Scholar] [CrossRef] [PubMed]
  19. Han, P.; Zhang, W.; Wang, G.; Sun, W.; Huang, Y. Changes in soil organic carbon in croplands subjected to fertilizer management: A global meta-analysis. Sci. Rep. 2016, 6, 27199. [Google Scholar] [CrossRef] [PubMed] [Green Version]
  20. Donigian, A.S.; Barnwell, T.O.; Jackson, R.B.; Patwardhan, A.S.; Weinrich, K.B.; Rowell, A.; Chinnaswamy, R.V.; Cole, C.V. Assessment of Alternative Management Practices and Policies Affecting Soil Carbon in Agroecosystems of the Central United States; Environmental Research Laboratory, Office of Research and Development, U.S. Environmental Protection Agency: Athens, GA, USA, 1994.
  21. Kopittke, P.M.; Dalal, R.C.; Finn, D.; Menzies, N.W. Global changes in soil stocks of carbon, nitrogen, phosphorus, and sulphur as influenced by long-term agricultural production. Glob. Chang. Biol. 2017, 23, 2509–2519. [Google Scholar] [CrossRef] [PubMed]
  22. Shi, L.; Feng, W.; Xu, J.; Kuzyakov, Y. Agroforestry systems: Meta-analysis of soil carbon stocks, sequestration processes, and future potentials. Land Degrad. Develop. 2018, 29, 3886–3897. [Google Scholar] [CrossRef]
  23. Feliciano, D.; Ledo, A.; Hillier, J.; Nayak, D.R. Which agroforestry options give the greatest soil and above ground carbon benefits in different world regions? Agric. Ecosyst. Environ. 2018, 254, 117–129. [Google Scholar] [CrossRef]
  24. Wang, J.; Xiong, Z.; Kuzyakov, Y. Biochar stability in soil: Meta-analysis of decomposition and priming effects. Gcb Bioenergy 2016, 8, 512–523. [Google Scholar] [CrossRef] [Green Version]
  25. Koçer, A.T.; Mutlu, B.; Özçimen, D. Investigation of biochar production potential and pyrolysis kinetics characteristics of microalgal biomass. Biomass Conv. Bioref. 2020, 10, 85–94. [Google Scholar] [CrossRef]
  26. Azzi, E.S.; Karltun, E.; Sundberg, C. Small-scale biochar production on Swedish farms: A model for estimating potential, variability, and environmental performance. J. Clean. Prod. 2021, 280, 124873. [Google Scholar] [CrossRef]
  27. Coomes, O.T.; Miltner, B.C. Indigenous Charcoal and Biochar Production: Potential for Soil Improvement under Shifting Cultivation Systems. Land Degrad. Develop. 2017, 28, 811–821. [Google Scholar] [CrossRef]
  28. Duku, M.H.; Gu, S.; Hagan, E.B. Biochar production potential in Ghana—A review. Renew. Sustain. Energy Rev. 2011, 15, 3539–3551. [Google Scholar] [CrossRef]
  29. Prendergast-Miller, M.T.; Duvall, M.; Sohi, S.P. Biochar-root interactions are mediated by biochar nutrient content and impacts on soil nutrient availability. Eur. J. Soil Sci. 2014, 65, 173–185. [Google Scholar] [CrossRef]
  30. Glaser, B.; Wiedner, K.; Seelig, S.; Schmidt, H.-P.; Gerber, H. Biochar organic fertilizers from natural resources as substitute for mineral fertilizers. Agron. Sustain. Dev. 2015, 35, 667–678. [Google Scholar] [CrossRef] [Green Version]
  31. Jeffery, S.; Abalos, D.; Prodana, M.; Bastos, A.C.; van Groenigen, J.W.; Hungate, B.A.; Verheijen, F. Biochar boosts tropical but not temperate crop yields. Environ. Res. Lett. 2017, 12, 53001. [Google Scholar] [CrossRef]
  32. Rogovska, N.; Laird, D.A.; Rathke, S.J.; Karlen, D.L. Biochar impact on Midwestern Mollisols and maize nutrient availability. Geoderma 2014, 230, 340–347. [Google Scholar] [CrossRef] [Green Version]
  33. Vaccari, F.P.; Baronti, S.; Lugato, E.; Genesio, L.; Castaldi, S.; Fornasier, F.; Miglietta, F. Biochar as a strategy to sequester carbon and increase yield in durum wheat. Eur. J. Agron. 2011, 34, 231–238. [Google Scholar] [CrossRef]
  34. Liu, S.; Zhang, Y.; Zong, Y.; Hu, Z.; Wu, S.; Zhou, J.; Jin, Y.; Zou, J. Response of soil carbon dioxide fluxes, soil organic carbon and microbial biomass carbon to biochar amendment: A meta-analysis. Gcb Bioenergy 2016, 8, 392–406. [Google Scholar] [CrossRef]
  35. Xu, H.-J.; Wang, X.-H.; Li, H.; Yao, H.-Y.; Su, J.-Q.; Zhu, Y.-G. Biochar impacts soil microbial community composition and nitrogen cycling in an acidic soil planted with rape. Environ. Sci. Technol. 2014, 48, 9391–9399. [Google Scholar] [CrossRef]
  36. Calisi, R.M.; Bentley, G.E. Lab and field experiments: Are they the same animal? Horm. Behav. 2009, 56, 1–10. [Google Scholar] [CrossRef] [PubMed]
  37. Lebrun, M.; Miard, F.; Nandillon, R.; Hattab-Hambli, N.; Léger, J.C.; Scippa, G.S.; Morabito, D.; Bourgerie, S. Influence of Biochar Particle Size and Concentration on Pb and As Availability in Contaminated Mining Soil and Phytoremediation Potential of Poplar Assessed in a Mesocosm Experiment. Water Air Soil Pollut. 2021, 232, 3. [Google Scholar] [CrossRef]
  38. Khan, Z.; Zhang, K.; Khan, M.N.; Fahad, S.; Xu, Z.; Hu, L. Coupling of Biochar with Nitrogen Supplements Improve Soil Fertility, Nitrogen Utilization Efficiency and Rapeseed Growth. Agronomy 2020, 10, 1661. [Google Scholar] [CrossRef]
  39. Jin, L.; Wei, D.; Yin, D.; Zhou, B.; Ding, J.; Wang, W.; Zhang, J.; Qiu, S.; Zhang, C.; Li, Y.; et al. Investigations of the effect of the amount of biochar on soil porosity and aggregation and crop yields on fertilized black soil in northern China. PLoS ONE 2020, 15, e0238883. [Google Scholar] [CrossRef]
  40. Mohan, D.; Abhishek, K.; Sarswat, A.; Patel, M.; Singh, P.; Pittman, C.U. Biochar production and applications in soil fertility and carbon sequestration—A sustainable solution to crop-residue burning in India. RSC Adv. 2018, 8, 508–520. [Google Scholar] [CrossRef] [Green Version]
  41. Tan, G.; Wang, H.; Xu, N.; Junaid, M.; Liu, H.; Zhai, L. Effects of biochar application with fertilizer on soil microbial biomass and greenhouse gas emissions in a peanut cropping system. Environ. Technol. 2021, 42, 9–19. [Google Scholar] [CrossRef]
  42. Department of Primary Industries and Regional Development’s Agriculture and Food. What Is Soil Organic Carbon? Available online: https://www.agric.wa.gov.au/measuring-and-assessing-soils/what-soil-organic-carbon (accessed on 10 August 2021).
  43. Rohatgi, A. WebPlotDigitizer; Ankit Rohatgi: Pacifica, CA, USA, 2020. [Google Scholar]
  44. FAO. Measuring and Modelling Soil Carbon Stocks and Stock Changes in Livestock Production Systems: Guidelines for Assessment (Version 1): Livestock Environmental Assessment and Performance (LEAP) Partnership; FAO: Rome, Italy, 2019; ISBN 978-92-5-131408-1. [Google Scholar]
  45. Men, M.X.; Peng, Z.P.; Hao, X.; Yu, Z.R. Investigation on Pedotransfer function for estimating soil bulk density in Hebei province. Chin. J. Soil Sci. 2008, 1, 20. [Google Scholar]
  46. Bernoux, M.; Cerri, C.; Arrouays, D.; Jolivet, C.; Volkoff, B. Bulk densities of Brazilian Amazon soils related to other soil properties. Soil Sci. Soc. Am. J. 1998, 62, 743–749. [Google Scholar] [CrossRef]
  47. Manrique, L.A.; Jones, C.A. Bulk density of soils in relation to soil physical and chemical properties. Soil Sci. Soc. Am. J. 1991, 55, 476–481. [Google Scholar] [CrossRef]
  48. Hedges, L.V.; Gurevitch, J.; Curtis, P.S. The meta-analysis of response ratios in experimental ecology. Ecology 1999, 80, 1150–1156. [Google Scholar] [CrossRef]
  49. Harrer, M.; Cuijpers, P.; Furukawa, T.A.; Ebert, D.D. Doing Meta-Analysis with R: A Hands-on Guide, 1st ed.; CRC Press: Boca Raton, FL, USA, 2019; ISBN 9780367610074. [Google Scholar]
  50. RStudio Team. RStudio: Integrated Development Environment for R.; RStudio, PBC: Bosten, MA, USA, 2020. [Google Scholar]
  51. Balduzzi, S.; Rücker, G.; Schwarzer, G. How to perform a meta-analysis with R: A practical tutorial. Evid.-Based Ment. Health 2019, 22, 153–160. [Google Scholar] [CrossRef] [Green Version]
  52. Tian, K.; Zhao, Y.; Xu, X.; Hai, N.; Huang, B.; Deng, W. Effects of long-term fertilization and residue management on soil organic carbon changes in paddy soils of China: A meta-analysis. Agric. Ecosyst. Environ. 2015, 204, 40–50. [Google Scholar] [CrossRef]
  53. Luo, Y.; Hui, D.; Zhang, D. Elevated CO2 stimulates net accumulations of carbon and nitrogen in land ecosystems: A meta-analysis. Ecology 2006, 87, 53–63. [Google Scholar] [CrossRef] [Green Version]
  54. Fidel, R.; Laird, D.; Parkin, T. Effect of Biochar on Soil Greenhouse Gas Emissions at the Laboratory and Field Scales. Soil Syst. 2019, 3, 8. [Google Scholar] [CrossRef] [Green Version]
  55. Wang, D.; Li, C.; Parikh, S.J.; Scow, K.M. Impact of biochar on water retention of two agricultural soils—A multi-scale analysis. Geoderma 2019, 340, 185–191. [Google Scholar] [CrossRef]
  56. Guo, Y.; Fan, R.; Zhang, X.; Zhang, Y.; Wu, D.; McLaughlin, N.; Zhang, S.; Chen, X.; Jia, S.; Liang, A. Tillage-induced effects on SOC through changes in aggregate stability and soil pore structure. Sci. Total Environ. 2020, 703, 134617. [Google Scholar] [CrossRef]
  57. Xu, J.; Han, H.; Ning, T.; Li, Z.; Lal, R. Long-term effects of tillage and straw management on soil organic carbon, crop yield, and yield stability in a wheat-maize system. Field Crops Res. 2019, 233, 33–40. [Google Scholar] [CrossRef]
  58. Kimble, J.M.; Follett, R.F.; Stewart, B.A. Assessment Methods for Soil Carbon; CRC Press: Boca Raton, FL, USA, 2000; ISBN 9781482278644. [Google Scholar]
  59. Lorenz, K.; Lal, R. Biochar application to soil for climate change mitigation by soil organic carbon sequestration. J. Plant Nutr. Soil Sci. 2014, 177, 651–670. [Google Scholar] [CrossRef] [Green Version]
  60. Silveira, M.L.; Comerford, N.B.; Reddy, K.R.; Cooper, W.T.; El-Rifai, H. Characterization of soil organic carbon pools by acid hydrolysis. Geoderma 2008, 144, 405–414. [Google Scholar] [CrossRef]
  61. Dong, X.; Li, G.; Lin, Q.; Zhao, X. Quantity and quality changes of biochar aged for 5 years in soil under field conditions. Catena 2017, 159, 136–143. [Google Scholar] [CrossRef]
  62. Maestrini, B.; Abiven, S.; Singh, N.; Bird, J.; Torn, M.S.; Schmidt, M.W.I. Carbon losses from pyrolysed and original wood in a forest soil under natural and increased N deposition. Biogeosciences 2014, 11, 5199–5213. [Google Scholar] [CrossRef] [Green Version]
  63. Major, J.; Lehmann, J.; Rondon, M.; Goodale, C. Fate of soil-applied black carbon: Downward migration, leaching and soil respiration. Glob. Chang. Biol. 2010, 16, 1366–1379. [Google Scholar] [CrossRef]
  64. Obia, A.; Børresen, T.; Martinsen, V.; Cornelissen, G.; Mulder, J. Vertical and lateral transport of biochar in light-textured tropical soils. Soil Tillage Res. 2017, 165, 34–40. [Google Scholar] [CrossRef] [Green Version]
  65. Wiedner, K.; Fischer, D.; Walther, S.; Criscuoli, I.; Favilli, F.; Nelle, O.; Glaser, B. Acceleration of Biochar Surface Oxidation during Composting? J. Agric. Food Chem. 2015, 63, 3830–3837. [Google Scholar] [CrossRef]
  66. Glaser, B. Agroecology, Ecosystems, and Sustainability: Chapter 1. Soil Biogeochemistry: From Molecular to Ecosystem Level Using Terra Preta and Biochar as Examples; Taylor and Francis: Hoboken, NJ, USA, 2014; ISBN 9781482233018. [Google Scholar]
  67. Solomon, D.; Lehmann, J.; Fraser, J.A.; Leach, M.; Amanor, K.; Frausin, V.; Kristiansen, S.M.; Millimouno, D.; Fairhead, J. Indigenous African soil enrichment as a climate-smart sustainable agriculture alternative. Front. Ecol. Environ. 2016, 14, 71–76. [Google Scholar] [CrossRef] [Green Version]
  68. West, T.O.; Six, J. Considering the influence of sequestration duration and carbon saturation on estimates of soil carbon capacity. Clim. Chang. 2007, 80, 25–41. [Google Scholar] [CrossRef]
  69. Mando, A.; Ouattara, B.; Somado, A.E.; Wopereis, M.; Stroosnijder, L.; Breman, H. Long-term effects of fallow, tillage and manure application on soil organic matter and nitrogen fractions and on sorghum yield under Sudano-Sahelian conditions. Soil Use Manag. 2005, 21, 25–31. [Google Scholar] [CrossRef]
  70. Yaduvanshi, N.; Sharma, D.R. Tillage and residual organic manures/chemical amendment effects on soil organic matter and yield of wheat under sodic water irrigation. Soil Tillage Res. 2008, 98, 11–16. [Google Scholar] [CrossRef]
  71. Bogužas, V.; Mikučionienė, R.; Šlepetienė, A.; Sinkevičienė, A.; Feiza, V.; Steponavičienė, V.; Adamavičienė, A. Long-term effect of tillage systems, straw and green manure combinations on soil organic matter. Zemdirbyste-Agriculture 2015, 102, 243–250. [Google Scholar] [CrossRef] [Green Version]
  72. Baker, J.M.; Ochsner, T.E.; Venterea, R.T.; Griffis, T.J. Tillage and soil carbon sequestration—What do we really know? Agric. Ecosyst. Environ. 2007, 118, 1–5. [Google Scholar] [CrossRef]
  73. Gross, C.D.; Harrison, R.B. The Case for Digging Deeper: Soil Organic Carbon Storage, Dynamics, and Controls in Our Changing World. Soil Syst. 2019, 3, 28. [Google Scholar] [CrossRef] [Green Version]
  74. McCarthy, J.F. Carbon fluxes in soil. J. Geogr. Sci. 2005, 15, 149–154. [Google Scholar] [CrossRef]
  75. Rasse, D.P.; Rumpel, C.; Dignac, M.-F. Is soil carbon mostly root carbon? Mechanisms for a specific stabilisation. Plant Soil 2005, 269, 341–356. [Google Scholar] [CrossRef]
  76. Deb, S.K.; Shukla, M.K. A review of dissolved organic matter transport processes affecting soil and environmental quality. J. Environ. Anal. Toxicol 2011, 1, 4172. [Google Scholar] [CrossRef]
  77. Jobbágy, E.G.; Jackson, R.B. The vertical distribution of soil organic carbon and its relation to climate and vegetation. Ecol. Appl. 2000, 10, 423–436. [Google Scholar] [CrossRef]
  78. Batjes, N.H. Total carbon and nitrogen in the soils of the world. Eur. J. Soil Sci. 1996, 47, 151–163. [Google Scholar] [CrossRef]
  79. Schmidt, M.W.I.; Torn, M.S.; Abiven, S.; Dittmar, T.; Guggenberger, G.; Janssens, I.A.; Kleber, M.; Kögel-Knabner, I.; Lehmann, J.; Manning, D.A.C. Persistence of soil organic matter as an ecosystem property. Nature 2011, 478, 49–56. [Google Scholar] [CrossRef] [PubMed] [Green Version]
  80. Fontaine, S.; Barot, S.; Barré, P.; Bdioui, N.; Mary, B.; Rumpel, C. Stability of organic carbon in deep soil layers controlled by fresh carbon supply. Nature 2007, 450, 277–280. [Google Scholar] [CrossRef] [PubMed]
  81. Rumpel, C.; Kögel-Knabner, I.; Bruhn, F. Vertical distribution, age, and chemical composition of organic carbon in two forest soils of different pedogenesis. Org. Geochem. 2002, 33, 1131–1142. [Google Scholar] [CrossRef]
  82. Frausin, V.; Fraser, J.A.; Narmah, W.; Lahai, M.K.; Winnebah, T.R.A.; Fairhead, J.; Leach, M. “God Made the Soil, but We Made It Fertile”: Gender, Knowledge, and Practice in the Formation and Use of African Dark Earths in Liberia and Sierra Leone. Hum. Ecol. 2014, 42, 695–710. [Google Scholar] [CrossRef] [Green Version]
  83. Mia, S.; Dijkstra, F.A.; Singh, B. Long-Term Aging of Biochar; Elsevier: Amsterdam, The Netherlands, 2017; pp. 1–51. ISBN 9780128124239. [Google Scholar]
  84. King, A.E.; Blesh, J. Crop rotations for increased soil carbon: Perenniality as a guiding principle. Ecol. Appl. 2018, 28, 249–261. [Google Scholar] [CrossRef] [PubMed]
  85. Kawasaki, K. Two Harvests Are Better than One: Double Cropping as a Strategy for Climate Change Adaptation. Am. J. Agric. Econ. 2019, 101, 172–192. [Google Scholar] [CrossRef]
  86. Du, Y.; Cui, B.; Zhang, Q.; Wang, Z.; Sun, J.; Niu, W. Effects of manure fertilizer on crop yield and soil properties in China: A meta-analysis. Catena 2020, 193, 104617. [Google Scholar] [CrossRef]
  87. Cai, A.; Zhang, W.; Xu, M.; Wang, B.; Wen, S.; Shah, S.A.A. Soil fertility and crop yield after manure addition to acidic soils in South China. Nutr. Cycl. Agroecosyst. 2018, 111, 61–72. [Google Scholar] [CrossRef]
  88. Obour, A.; Stahlman, P.; Thompson, C. Long-term residual effects of feedlot manure application on crop yield and soil surface chemistry. J. Plant Nutr. 2017, 40, 427–438. [Google Scholar] [CrossRef]
  89. Nannipieri, P.; Trasar-Cepeda, C.; Dick, R.P. Soil enzyme activity: A brief history and biochemistry as a basis for appropriate interpretations and meta-analysis. Biol. Fertil. Soils 2018, 54, 11–19. [Google Scholar] [CrossRef]
  90. Zhang, L.; Xiang, Y.; Jing, Y.; Zhang, R. Biochar amendment effects on the activities of soil carbon, nitrogen, and phosphorus hydrolytic enzymes: A meta-analysis. Environ. Sci. Pollut. Res. Int. 2019, 26, 22990–23001. [Google Scholar] [CrossRef]
  91. Lal, R. Digging deeper: A holistic perspective of factors affecting soil organic carbon sequestration in agroecosystems. Glob. Chang. Biol. 2018, 24, 3285–3301. [Google Scholar] [CrossRef]
  92. Zong, Y.; Wang, Y.; Sheng, Y.; Wu, C.; Lu, S. Ameliorating soil acidity and physical properties of two contrasting texture Ultisols with wastewater sludge biochar. Environ. Sci. Pollut. Res. Int. 2018, 25, 25726–25733. [Google Scholar] [CrossRef]
  93. Yang, X.Y.; Chang, K.-H.; Kim, Y.J.; Zhang, J.; Yoo, G. Effects of different biochar amendments on carbon loss and leachate characterization from an agricultural soil. Chemosphere 2019, 226, 625–635. [Google Scholar] [CrossRef] [PubMed]
  94. Nyambo, P.; Taeni, T.; Chiduza, C.; Araya, T. Effects of Maize Residue Biochar Amendments on Soil Properties and Soil Loss on Acidic Hutton Soil. Agronomy 2018, 8, 256. [Google Scholar] [CrossRef] [Green Version]
  95. Sheng, Y.; Zhan, Y.; Zhu, L. Reduced carbon sequestration potential of biochar in acidic soil. Sci. Total Environ. 2016, 572, 129–137. [Google Scholar] [CrossRef] [PubMed]
  96. Zou, J.; Huang, Y.; Zong, L.; Zheng, X.; Wang, Y. Carbon dioxide, nitrous oxide and methane emissions from a rice-winter wheat rotation system as affected by crop residue incorporation and temperature. Adv. Atmos. Sci. 2004, 21, 1–698. [Google Scholar]
  97. Huang, Y.; Zou, J.; Zheng, X.; Wang, Y.; Xu, X. Nitrous oxide emissions as influenced by amendment of plant residues with different C: N ratios. Soil Biol. Biochem. 2004, 36, 973–981. [Google Scholar] [CrossRef]
  98. Raveendran, K.; Ganesh, A.; Khilar, K.C. Influence of mineral matter on biomass pyrolysis characteristics. Fuel 1995, 74, 1812–1822. [Google Scholar] [CrossRef]
  99. Aller, M.F. Biochar properties: Transport, fate, and impact. Crit. Rev. Environ. Sci. Technol. 2016, 46, 1183–1296. [Google Scholar] [CrossRef]
  100. Cabrera, A.; Spokas, K. Impacts of Biochar (Black Carbon) Additions on the Sorption and Efficacy of Herbicides. In Herbicides and Environment; Kortekamp, A., Ed.; InTech: Vienna, Austria, 2011; ISBN 978-953-307-476-4. [Google Scholar]
  101. Shackley, S.; Sohi, S. An Assessment of the Benefits and Issues Associated with the Application of Biochar to Soil: A Report Commissioned by the UK Department for Environment, Food and Rural Affairs and Department of Energy and Climate Change; DECC: London, UK, 2010. [Google Scholar]
  102. Lee, J.W.; Kidder, M.; Evans, B.R.; Paik, S.; Buchanan, A.C.; Garten, C.T.; Brown, R.C. Characterization of biochars produced from cornstovers for soil amendment. Environ. Sci. Technol. 2010, 44, 7970–7974. [Google Scholar] [CrossRef] [PubMed] [Green Version]
  103. Lehmann, J. Bio-energy in the black. Front. Ecol. Environ. 2007, 5, 381–387. [Google Scholar] [CrossRef] [Green Version]
  104. Suliman, W.; Harsh, J.B.; Abu-Lail, N.I.; Fortuna, A.-M.; Dallmeyer, I.; Garcia-Pérez, M. The role of biochar porosity and surface functionality in augmenting hydrologic properties of a sandy soil. Sci. Total Environ. 2017, 574, 139–147. [Google Scholar] [CrossRef] [PubMed]
Figure 1. Meta-analysis results of the “field-dataset”, given as a forest plot. Presented is the mean difference of soil organic carbon stocks after biochar application (dSOC) influenced by different data groups. Number in brackets represent the number of included treatments. Points within the range represent the mean dSOC and the line within the 95% confidence interval represents the range of the effect size. If the effect size range crosses the “zero-effect-line”, given as a solid vertical line at 0%, the result can be interpreted as statistically insignificant. The effect sizes of each group were considered to be significantly different at p < 0.05 from each other if the 95% confidence intervals were not overlapping. The vertical dotted line represents the grand overall mean.
Agronomy 11 02474 g001
Figure 2. Meta-analysis results of the “field-dataset”, given as forest plot. Presented is the relative change of soil organic carbon stocks (RR[%]) after biochar application influenced by different data groups. Numbers in brackets represent the number of included treatments. Points within the range represent the mean dSOC and the line within the 95% confidence interval represents the range of the effect size. If the effect size range crosses the “zero-effect-line”, given as a solid vertical line at 0%, the result can be interpreted as statistically insignificant. The effect sizes of each group were considered to be significantly different at p < 0.05 from each other if the 95% confidence intervals were not overlapping. The vertical dotted line represents the grand overall mean.
Agronomy 11 02474 g002
Figure 3. Meta-analysis results of the “non-field dataset”, given as a forest plot. Presented is the mean difference of soil organic carbon content after biochar application (dSOC) influenced by different data groups. Number in brackets represent the number of included treatments. Points within the range represent the mean dSOC and the line within the 95% confidence interval represents the range of the effect size. If the effect size range crosses the “zero-effect-line”, given as a solid vertical line at 0%, the result can be interpreted as statistically insignificant. The effect sizes of each group were considered to be significantly different at p < 0.05 from each other if the 95% confidence intervals were not overlapping. The vertical dotted line represents the grand overall mean.
Agronomy 11 02474 g003
Figure 4. Meta-analysis results of the “non-field dataset”, given as a forest plot. Presented is the relative response ratio RR[%] of soil organic carbon content after the application of biochar influenced by different data groups. Numbers in brackets represent the number of included treatments. Points within the range represent the mean dSOC and the line within the 95% confidence interval represents the range of the effect size. If the effect size range crosses the “zero-effect-line”, given as a solid vertical line at 0%, the result can be interpreted as statistically insignificant. The effect sizes of each group were considered to be significantly different at p < 0.05 from each other if the 95% confidence intervals were not overlapping. The vertical dotted line represents the grand overall mean.
Agronomy 11 02474 g004
Figure 5. Meta-analysis results of the “field dataset”, given as a forest plot. Presented is the absolute mean difference of soil organic carbon stocks (dSOC) after the application of biochar influenced by whether the application was conducted once (single application) or repeatedly (continuous application). Points within the range represent the mean dSOC and the line within the 95% confidence interval represents the range of the effect size. If the effect size range crosses the “zero-effect-line”, given as a solid vertical line at 0%, the result can be interpreted as statistically insignificant. The effect sizes of each group were considered to be significantly different at p < 0.05 from each other if the 95% confidence intervals were not-overlapping. A vertical black dotted line represents the grand overall mean.
Agronomy 11 02474 g005
Figure 6. Meta-analysis results of the “field dataset”, given as a forest plot. Presented is the relative response ratio (RR [%]) of soil organic carbon stocks (dSOC) after the application of biochar influenced by whether the application was conducted once (single application) or repeatedly (continuous application). Points within the range represent the mean dSOC and the line within the 95% confidence interval represents the range of the effect size. If the effect size range crosses the “zero-effect-line”, given as a solid vertical line at 0%, the result can be interpreted as statistically insignificant. The effect sizes of each group were considered to be significantly different at p < 0.05 from each other if the 95% confidence intervals were not-overlapping. A vertical black dotted line represents the grand overall mean.
Agronomy 11 02474 g006
Figure 7. Relationship between the biochar amount and absolute SOC difference (dSOC) and, in “non-field” treatments (left) and “field” treatments (right). In “non-field” treatments both variables are given as g kg−1, and “field” treatments both variables are given as Mg ha−1. R2 represents the coefficient of determination.
Agronomy 11 02474 g007
Publisher’s Note: MDPI stays neutral with regard to jurisdictional claims in published maps and institutional affiliations.

