Article

Optimal Fertilization Level for Yield, Biological and Quality Traits of Soybean under Drip Irrigation System in the Arid Region of Northwest China

1
The National Engineering Research Center of Crop Molecular Breeding, MARA Key Laboratory of Soybean Biology (Beijing), Institute of Crop Sciences, Chinese Academy of Agricultural Sciences, 12 Zhongguancun South Street, Beijing 100081, China
2
Institute of Crops Research, Xinjiang Academy of Agricultural and Reclamation Sciences, Shihezi 832000, China
*
Author to whom correspondence should be addressed.
Agronomy 2022, 12(2), 291; https://doi.org/10.3390/agronomy12020291
Submission received: 27 December 2021 / Revised: 20 January 2022 / Accepted: 21 January 2022 / Published: 24 January 2022

Abstract

:
Soybean is one of the most important oilseed crops worldwide. Fertilization severely restricts the yield potential of soybean in the arid regions of Northwest China. A two-year field experiment was conducted to investigate the effects of fertilization on soybean yield in arid areas under a drip irrigation system. The treatment consisted of 14 fertilizer combinations comprising of four rates each of nitrogen (N) (0, 225, 450, and 675 kg ha−1), phosphorus (P) (0, 135, 270, and 405 kg ha−1), and potassium (K) (0, 75, 150, and 225 kg ha−1). The results revealed that grain yield was more sensitive to N fertilizer than to P and K fertilizers. The P and K fertilizers influenced harvest index and biomass, respectively. The optimized combination of fertilizers for high yield, as well as biological and quality traits was obtained by quadratic polynomial regression analysis. The theoretical grain yields based on the performed statistical calculations and plant biomass were greater than 7.21 tons ha−1 and 16.38 tons ha−1 with 300,000 plants ha−1 and were obtained under a fertilization combination of 411.62–418.39 kg ha−1 N, 153.97−251.03 kg ha−1 P2O5, and 117.77−144.73 kg ha−1 K2O. Thus, our findings will serve as a guideline for an effective fertilizer application in order to achieve a balance between grain yield and plant biomass as well as to contribute to the promotion of large-scale cultivation of soybean under drip irrigation.

1. Introduction

Soybean (Glycine max [L.] Merrill) is one of the most important oilseed crops with rich protein and oil worldwide. In China, the annual import of soybean reached more than 100 million tons, accounting for more than 83% of China’s soybean demand in 2020 according to the General Administration of Customs of the People’s Republic of China (GACC, http://www.customs.gov.cn/, accessed on 21 December 2021). A huge potential in yield increase is possible for soybean production in China, however, soybean production in China has decreased in recent years because of lower yield levels and lagging technological progress [1]. Therefore, it is important to increase and sustain the yield of soybean with optimal fertilizer application to ensure food security in China. However, the fertilizer management in the current farmers’ practices is not usually in balance with crop demand [2], which limits the soybean yield and results in low nutrient use efficiency [3].
Supply of adequate fertilizer including nitrogen (N), phosphorus (P), and potassium (K) is fundamental in optimizing soybean yield and quality. Grain yield and N relationships have been extensively explored in the scientific literature [4,5,6], nonetheless, relationships for other nutrients such as P and K have received less attention. Previous research found that treatments with high N rates extended the duration of the seed filling due to its function of biological N fixation [7]. Soybeans require higher nitrogen (8 to 9 kg of N for 100 kg soybeans), but only about 1/3 of it comes from fertilizers. An overdependence on N, P, and K fertilizers may deteriorate soil quality and health and ultimately reduce soil fertility and the size of arable land [8]. Therefore, to achieve a stable planting area, to have grain yield improvement, and to realize industrialization, the balanced requirements of N, P, and K fertilizers and their proper combinations are essential in identifying optimal fertilizer application regimes. For implementation, a robust fertilizer recommendation method must be established to maximize the soybean yield and improve nutrient use efficiency.
Fertilizer along with drip irrigation is a technology that offers precise and accurate irrigation and fertilization and can save more than 30–50% of fertilizer consumption, as well as increasing the nutrients and rainfall use efficiency together with the net-profit [9]. With the strengthening of the concept of sustainable development in people’s consciousness, the prominent role of drip irrigation and fertilization in resource utilization and environmental protection has attracted increasing attention [10,11]. Thus, exploring the optimum fertilizer recommendation for soybean under drip irrigation may be one as-yet untried method.
Since 2005, the determination of optimum fertilization has been extensively carried out throughout China. The “3414” fertilizer experiment design [three fertilizer factors (N, P, K), four fertilization levels, and 14 types of proportional fertilizer treatments] developed by the Ministry of Agriculture of China was recommended for soil testing and fertilizer research to develop a fertilization system and to guide farmers on how to apply fertilizer. The design is considered optimal with less regression, high efficiency, and comparability, easy in demonstration and promotion, and satisfying the professional requirements for fertilizer testing and fertilization decisions. Thus, this test scheme has been successfully applied to pumpkin [12], phoebe bournei [13], and adzuki bean [14] to obtain an optimal fertilizer application.
To optimize soybean grain yield, plant biomass is also the main factor that determines biological yield [15]. Previous studies improved grain yield by agronomic measures [16,17], but only a few studies have focused on the increase in grain yield balanced with biomass. Several studies have described the correlation of grain yield with plant biomass and reported contradictory conclusions. Some researchers agreed that a significant positive correlation exists between plant biomass and specific grain yield components, which increases with the process of plant growth and development and reaches the maximum at the seed-filling (stage R5 and R6) [18,19]. Other studies did not observe significant correlations between plant biomass and grain yield [20]. Therefore, the correlation appears to be unclear and the achievement of grain yield and plant biomass harmony are needed to better understand the genetic basis of grain yield and facilitate the pyramiding of the optimal fertilizer amount.
Therefore, the objectives of the current study were to (i) dissect the effect of precision N, P, and K management on soybean under drip irrigation; (ii) determine the relationship among a wide range of agronomic, quality, and biomass traits; and (iii) determine the optimal amount of N, P, K fertilizer and reasonable management balance for grain yield and plant biomass.

2. Materials and Methods

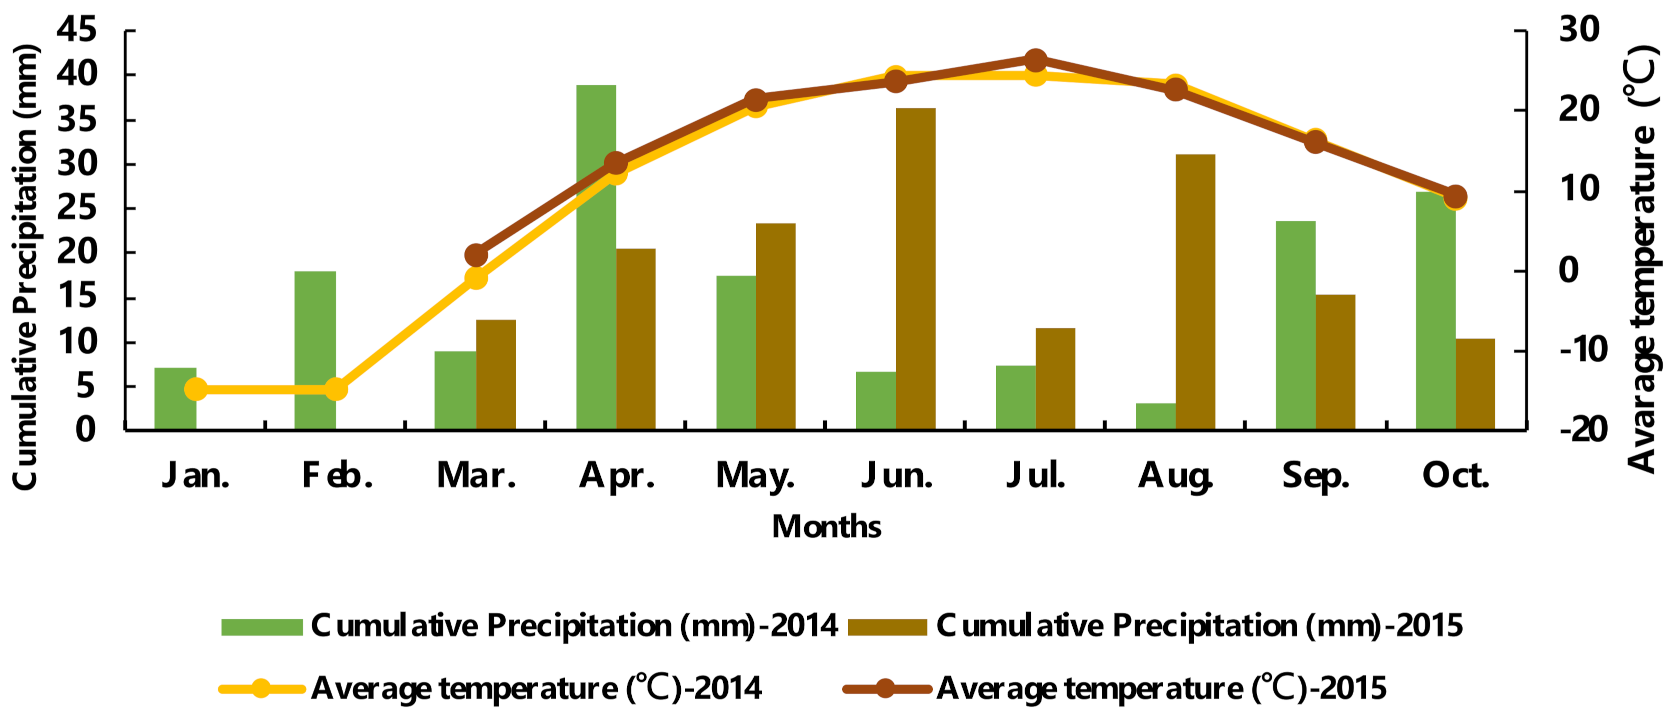
2.1. Experimental Site

A field experiment was conducted in Wulanwusu Agricultural Meteorological Experimental Station in 2014 and 2015, which represents the ecological conditions in northern Xinjiang, China. The annual mean temperatures and cumulative precipitations were 10.18 °C and 158.2 mm and 16.9 °C and 161.4 mm during the soybean growing season in 2014 and 2015, respectively (Figure 1 and Table S1). According to the FAO classification [21], the soil is Haplic Calcisols with sandy loam soil texture and pH of 8.0–8.5. The content of nitrate nitrogen, ammoniacal nitrogen, available phosphorus, and available potassium were 13.85, 12.40, 3.82, and 143.16 mg kg−1 DW of soil, respectively.

2.2. Experimental Materials and Design

A high-yielding and drought-sensitive cultivar Zhonghuang 35 was used in our research. The cultivar has high oil, early maturity, broad adaptability [22], and grain yield of 6.32 tons ha−1. The cultivar was evaluated with drip irrigation in the Xinjiang province of China, which showed the advantages of photosynthetic accumulation due to the typical continental climate, the large temperature difference between day and night with an average of 11°C and maximum higher than 20 °C [23].
In 2014 and 2015, the “3414” experiment was conducted with three factors (N, P, and K), each with four levels (0, 1, 2, and 3) giving a combination of 13 treatments (2014) and 14 treatments (2015) (Table 1). For the four levels, 0 indicates no fertilizer, 1 indicates half of the typical fertilizing amount, 2 indicates the typical fertilizer application, and 3 indicates 1.5 times the typical application. All treatments were arranged in a randomized complete block design with three replications.
The fertilizers, used for the “3414” experiment, were applied as follows: N fertilizer (urea containing 46% N and diammonium phosphate containing 12% N), P fertilizer (diammonium phosphate containing 61% P2O5 and monopotassium phosphate containing 52% P2O5), and K fertilizer (potassium chloride containing 62% K2O and monopotassium phosphate containing 34% K2O). To avoid excessive K fertilizer, monopotassium phosphate was used to meet the requirement for P and K fertilizer in N0P2K2 treatment. Detailed fertilization information is presented in Tables S2 and S3.

2.3. Field Management and Cultivation Conditions

The experiment was managed by water-saving drip irrigation under a plastic mulching film. The total irrigation water was 6750 m3 per ha. Each irrigation pipe was set up between every two soybean rows under the plastic film to facilitate mechanical harvesting. Before planting, the seeds were treated with the appropriate strains of bacteria, plant density was designed with 180,000 seedlings per ha. The sowing date was 14 April in 2014 and 25 April in 2015. The sowing rate was 65 kg ha−1, the depth of sowing was 3 cm and the average of emergence was 80% for all treatments. Independent fertilizer sources were used to apply each treatment to exactly control fertilizer amount. According to the soybean growth stages, fertilizer was applied six times in 2014, including once in June, twice in July, once in August, and twice in September. In 2015, fertilizer was applied seven times, that is once in May, once in June, thrice in July, and twice in August. Detailed information is shown in Table S4.

2.4. Data Observations

The plants were harvested on 14 September 2014 and 13 September 2015. Thirty-one (31) traits relating to grain yield, biomass, and nutrition were measured (Table S5). The identification of 12 yield-related traits, that is from T1 to T12, were measured in the laboratory after harvesting. The biological-related traits (T13 to T16) which include biomass per pod, leaf, stem, and plant were measured as dry matter weight. The nutritional traits (T17 to T31) comprised of N, P, K content in different tissues (seed, pod, leaf, and stem), H2SO4–H2O2 was used for the combined digestion, N content was determined using standard Kjeldahl by an automatic nitrogen analyzer (ZDDN-III-A, Zhejiang Top Cloud-Agri Technology Co., Zhejiang, China) [24], P content was determined by ultraviolet spectrophotometer (SHIMADZU UV-1800, Shimadzu Corporation, Kyoto, Japan) [24], K content was measured by a flame atomic absorption spectrometer (Model GGX-6, Beijing Haiguang Instrument Co., Beijing, China) after microwave digestion (Discover SP-D Gold, CEM, KampLintfort) using a contrAA 700 high-resolution continuum source atomic absorption spectrometer (Analytik Jena, Jena, Germany)) [24]. In addition, protein, oil, and moisture contents in seeds were determined on 20−30 g seed samples using Fourier-transform near-infrared spectrometry (Bruker Optik GmbH, Ettlingen, Germany) based on a method published previously [25]. The samples were stored at 4 °C in plastic bags in a fridge until measurement. In every case, three replicates were measured.

2.5. Data Analysis

To investigate the relationships among the 31 traits, heatmap for normalized data was conducted using the “pheatmap” package [26], correlation analysis was carried out using the “corrplot” package [27], and principal component analysis using the “cluster” package [28]. To select the optimal model, we compared the adjusted r2 for the different combinations of the quadratic polynomial regression models using the “leaps” package [29] and the models were fitted by using the “lm” function. All the analyses were conducted using R software. The optimal fertilizer amount and corresponding value were calculated by Matlab software (Mathworks, Inc., Natick, MA, USA) [30].

3. Results

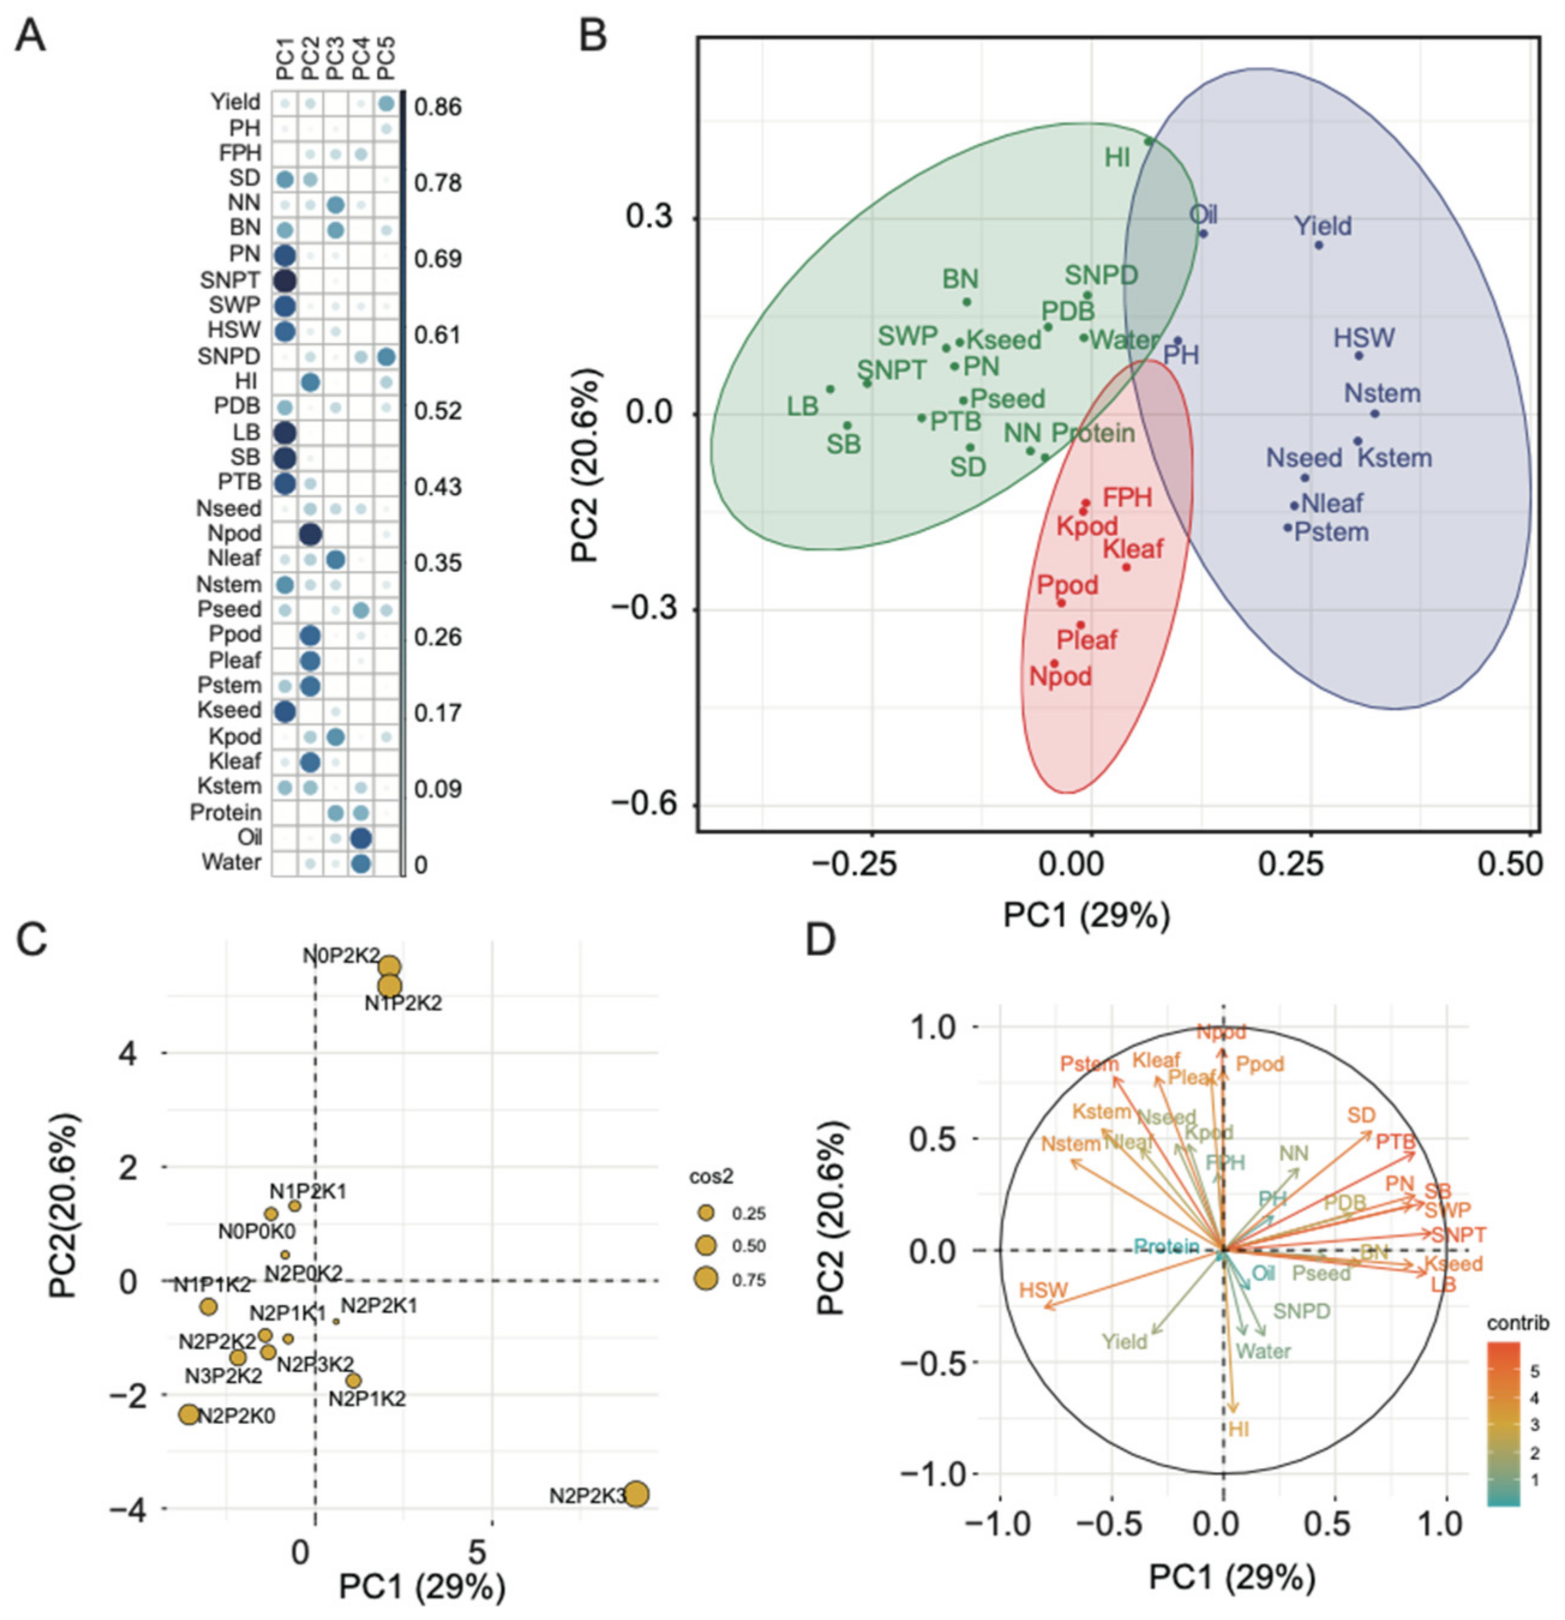
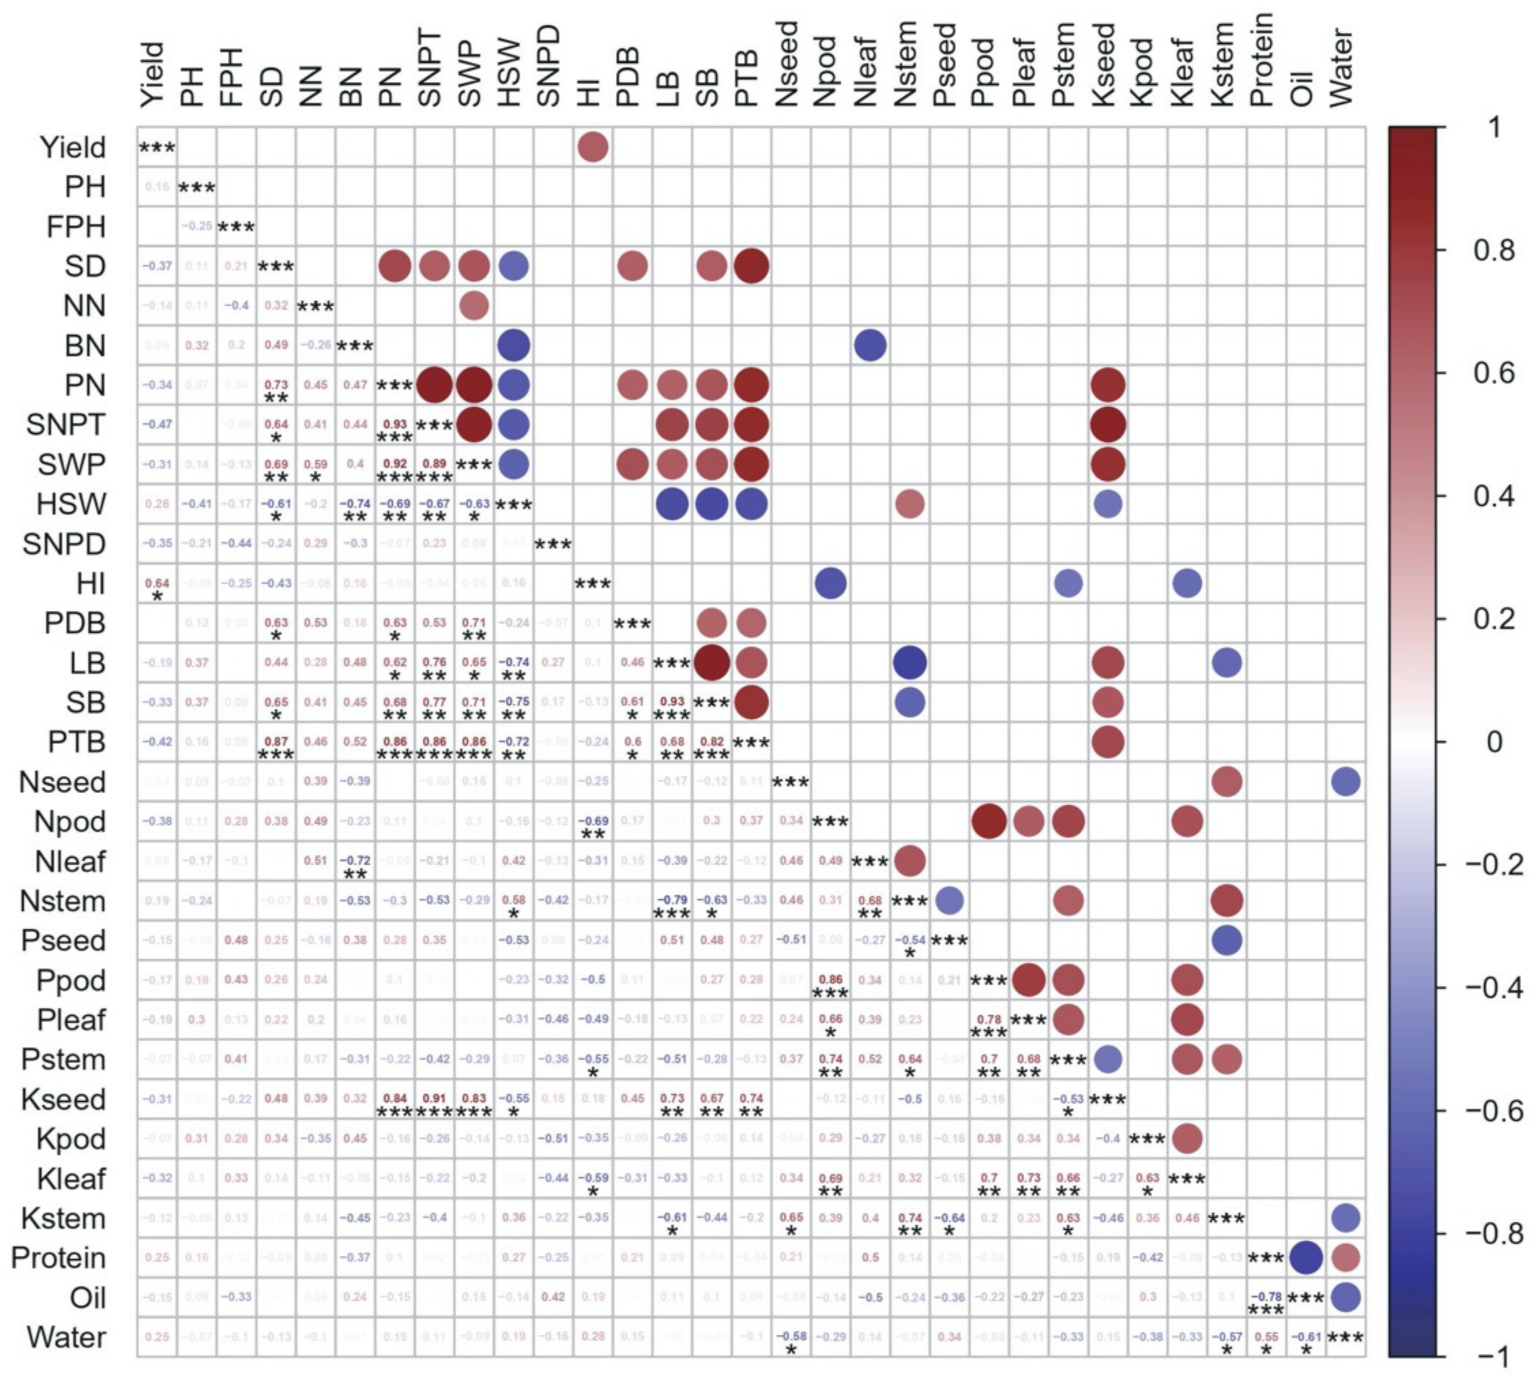
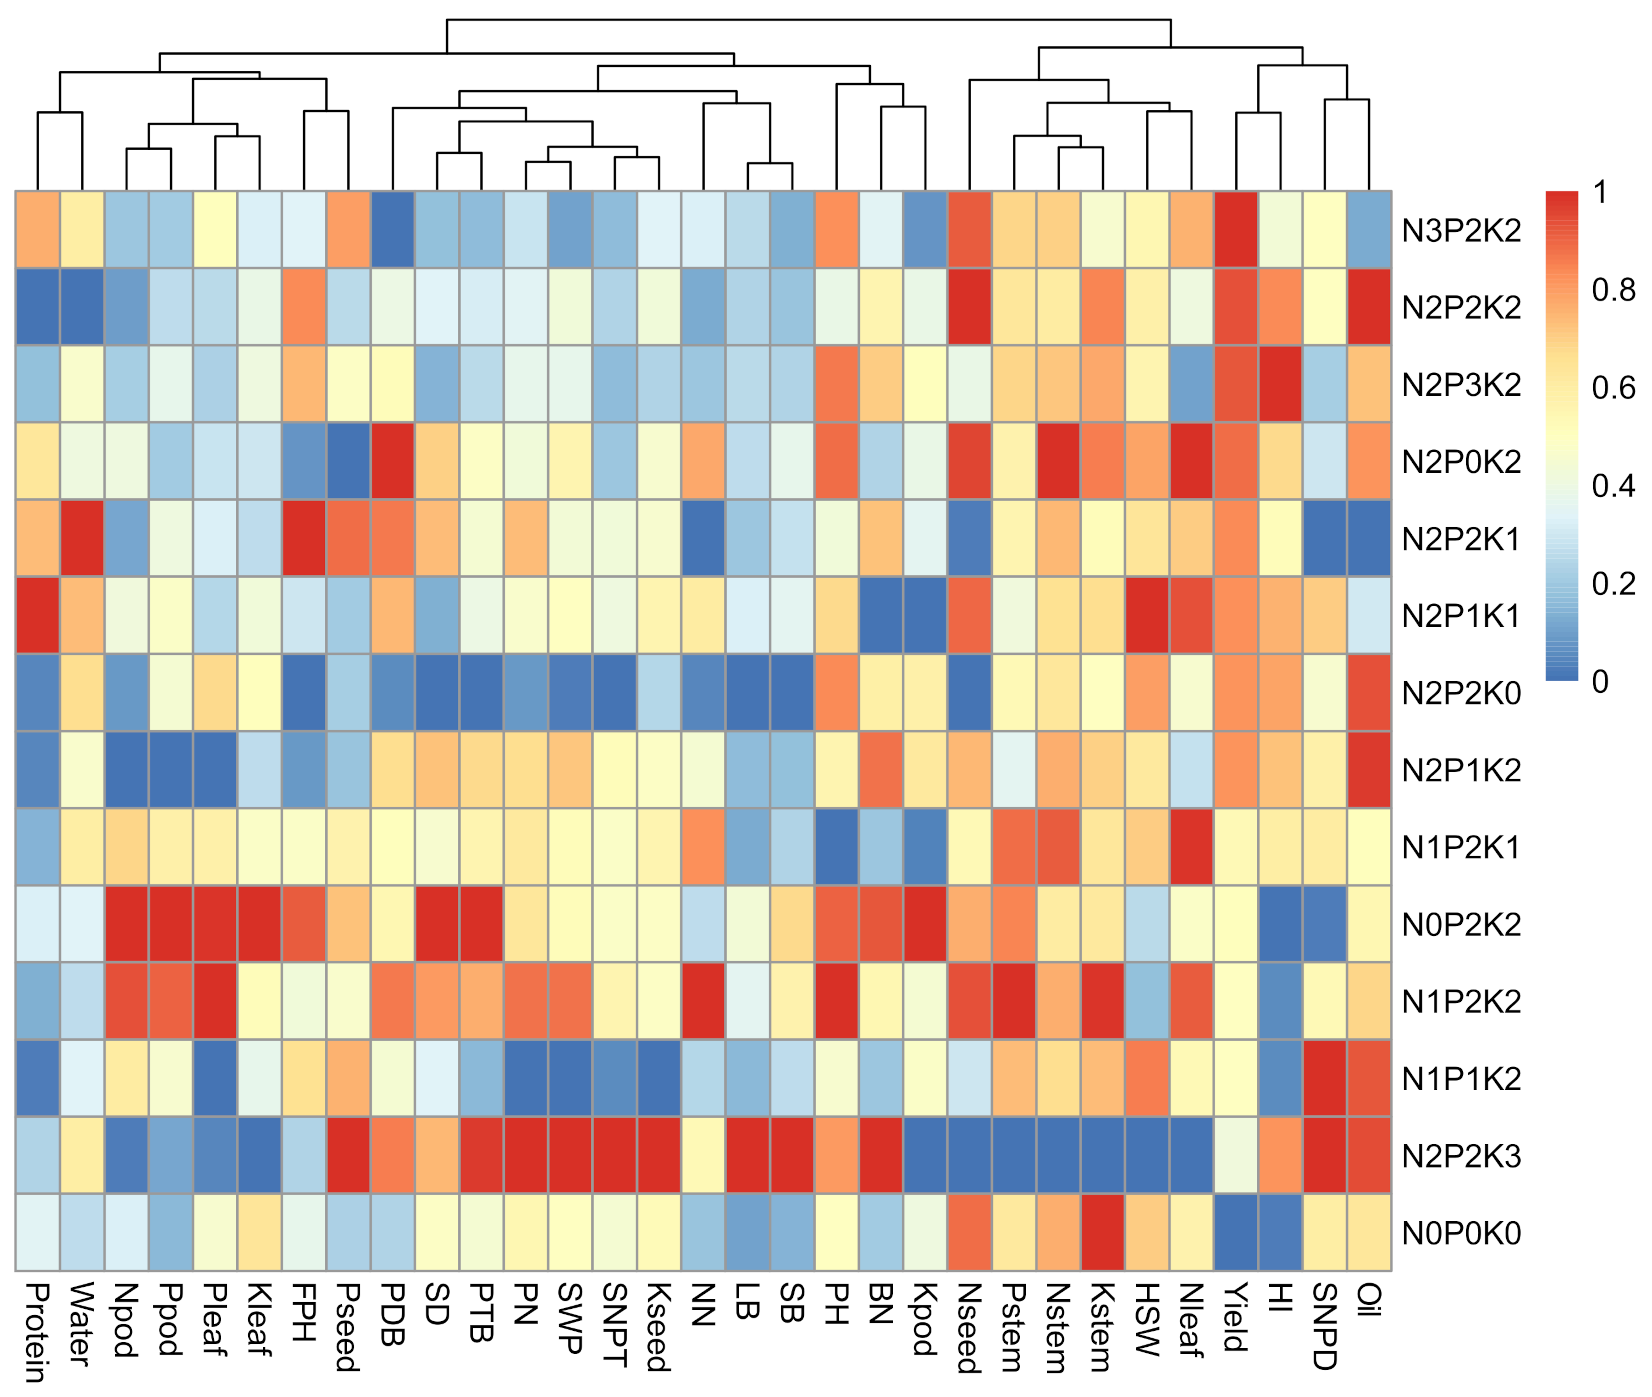
3.1. Principal Component and Correlation Analyses

The PCA result shows that the first two components accounted for 50.5% of the variance; PC1 and PC2 accounted for 29 and 20.6% phenotypic variation, respectively. The yield component traits such as seed number per plant and pod number as well as biomass traits are loaded more in PC1, while nutritional traits especially N and P were loaded more in PC2 (Figure 2A,D). In general, all the traits clustered together as per their grouping into yield, biological, and nutritional traits (Figure 2B). Among the 14 treatments, 11 treatments clustered together while N0P2K2 and N1P2K2 were grouped together and N2P2K3 was alone. This indicated that moderate P and K fertilization is necessary for plant growth and excessive K fertilization affects yield and nutritional traits (Figure 2C,D).
The correlation analysis showed that biomass per plant was significantly and positively associated with yield component traits such as stem diameter (r = 0.87, p < 0.001), pod number (r = 0.86, p < 0.001), seed number per plant (r = 0.86, p < 0.001), and seed weight per plant (r = 0.86, p < 0.001), while significantly and negatively associated with hundred seed weight (HSW, r = −0.72, p < 0.01). There was a negative correlation between protein and oil contents (r = −0.78, p < 0.001). The K in the seeds was positively correlated with pod number (r = 0.84, p < 0.001), seed number per plant (r = 0.91, p < 0.001), seed weight per plant (r = 0.83, p < 0.01), and biomass per pod (r = 0.45, p < 0.01). Furthermore, the K in the seeds was positively associated with K in the leaf (r = 0.73, p < 0.01), stem (r = 0.67, p < 0.01), and plant (r = 0.74, p < 0.01). The N in the pod was significantly and negatively associated with harvest index (r = −0.69, p < 0.01), the N in leaf was significantly and negatively associated with number of branches (r = −0.72, p < 0.01), while the N in stem was significantly and negatively associated with biomass per leaf (r = −0.79, p < 0.001) (Figure 3).

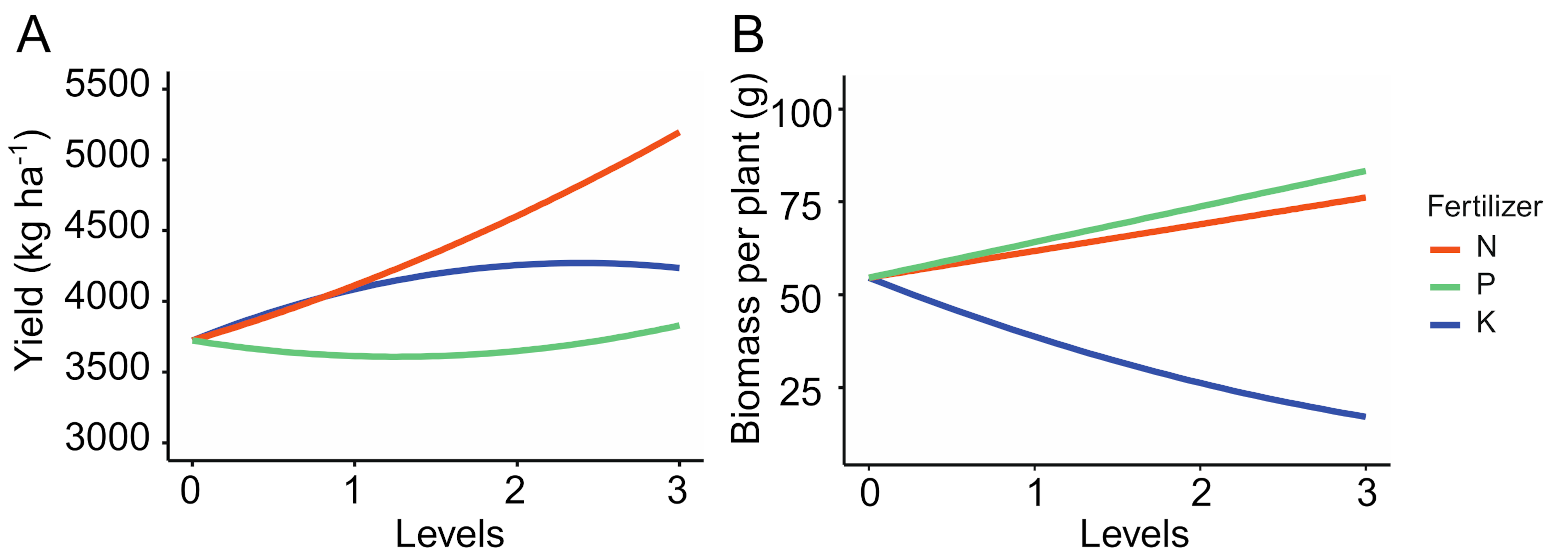
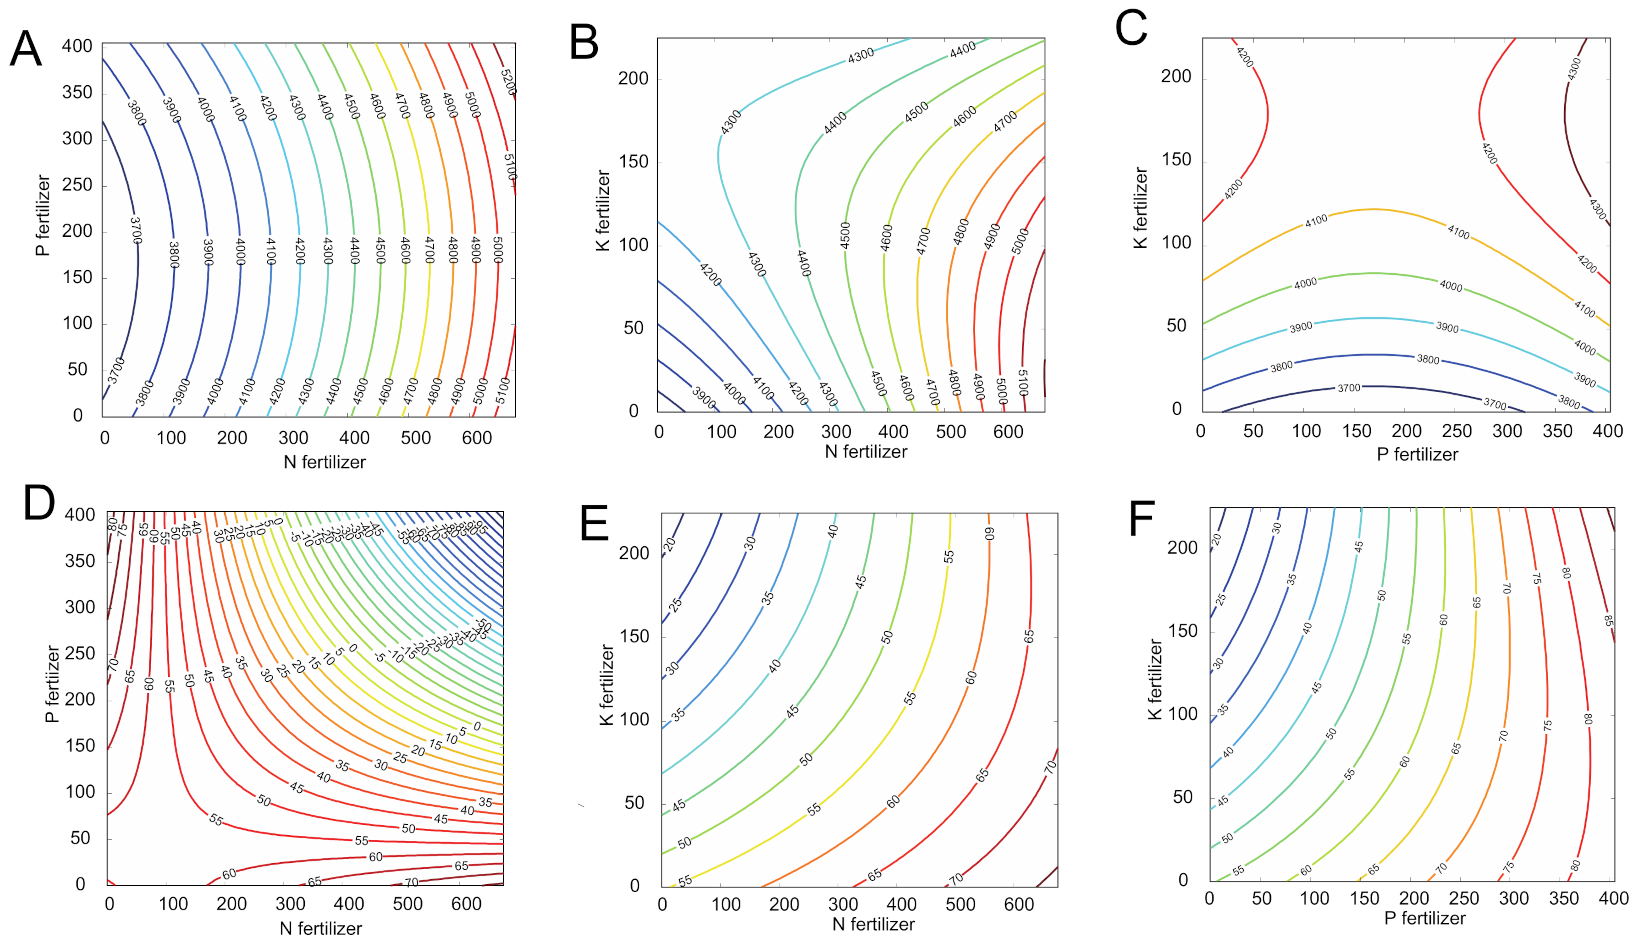
3.2. Effects of Different Fertilization Interactions on Grain Yield

Increasing soybean yield is always the core of soybean breeding. To determine the optimal fertilization for grain yield, the 14 treatments were separated into three groups (Table 2) based on grain yield parameters. The first group with a grain yield higher than 4483.75 kg ha−1 has harmonious fertilizer and adequate nitrogen, the second group has a grain yield higher than 4112.5 kg ha−1, while the third group consisting of the control has the lowest grain yield of 3726.5 kg ha−1. The percentage grain yield increase of N0P2K2, N2P0K2, N2P2K0, and N2P2K2 over N0P0K0 was 13, 22, 23, and 20%, respectively, and the percentage grain yield difference of N2P2K2 over the other treatments (N0P0K0, N0P2K2, N2P0K2, and N2P2K0) was 19, 9, 1, and 2%, respectively (Figure S1 and Table 3).
From the heatmap, there are wider variations for biological traits and pod/leaf-related nutritional traits than other traits (Figure 4). The N2P2K2 fertilizer treatment ranks second in grain yield (4590.75 kg ha−1) but resulted in the highest nitrogen (49.13 g kg−1) and oil content (22.33%) in the seed. The grain yield of N-deficient treatment (N0P2K2) declined (4195.88 kg ha−1). The N-abundant treatment, N3P2K2, resulted in the highest grain yield (4654.5 kg ha−1) but low biomass per plant (49.81 g), plant height (82.09 cm), and protein content (39.85 %). The grain yield of the P-deficient treatment (N2P0K2) decreased slightly but resulted in increased biomass per pod (12.95 g), N-stem (11.3 g kg−1), and N-leaf (15.46 g kg−1), while the P-abundant treatment, N2P3K2, resulted in the highest HI (0.57). The K-deficient treatment, N2P2K0, resulted in low biomass per plant (46.8 g), while for the K-abundant treatment (N2P2K3), the grain yield decreased (4112.5 kg ha−1), but with increased biomass per plant (64.77 g) and seed nutrients.

3.3. Optimal Fertilization Model Development

Based on the adjusted r2 for the polynomial regression model, the optimal model (r2 = 0.89) for grain yield was selected (Figure S2A). Thus, the polynomial regression equation that governs the effect of grain yield by N, P, and K fertilizers is expressed as y 1 = 3724.326 + 1.504 x 1 1.357 x 2 + 6.097 x 3 + 0.001 x 1 2 + 0.004 x 2 2 0.017 x 3 2 0.008 x 1 x 3 (Table 4). The regression was significant (p < 0.01) with N and K fertilizers having significant effects (p < 0.01) on grain yield. From the regression coefficient, the effect of different fertilizers on grain yield was in the order K > N > P (Table 4). Grain yield gradually increased with an increase in N and P, while with increasing K fertilizer, grain yield slowly increased and then rapidly decreased (Figure 5A).
Besides, there was a significant interaction (p < 0.05) between N and K fertilizer in terms of grain yield while no significant interaction between N and P (Table 4, Figure 6A,B). Grain yield slowly increased with the increase in N and K fertilizers (Figure 6B), and the maximum grain yield of 5202.3 kg ha−1 was observed at 675 kg ha−1 N and 20.5 kg ha−1 K2O (Figure 6B).
For biomass per plant, the best fitting model was y 1 = 54.575 + 0.032 x 1 + 0.071 x 2 0.234 x 3 + 0.0003 x 3 2 0.0008 x 1 x 2 + 0.0002 x 1 x 3 + 0.0005 x 2 x 3 (Table 5). The regression was significant (p < 0.05) and the adjusted r2 was 0.66 (Figure S2B). The regression result shows that K fertilizer largely affects biomass per plant (p < 0.05). The effect of fertilizer on biomass per plant was in the order K > P > N (Table 5). Biomass per plant gradually increased with an increase in N and P fertilizers, while the effect of the increased rate of P on biomass per plant was higher than N. However, with increasing K fertilizer, the biomass per plant sharply declined (Figure 5B).
For biomass per plant, a significant interaction between N and P fertilizer (p < 0.05) was observed while no interaction effects between P and K (Table 5, Figure 6E,F). Biomass per plant gradually increased and then rapidly decreased with the increase in N and P (Figure 6D). The maximum biomass per plant was 83.33 g with 405 kg ha−1 P2O5 and 0 kg ha−1 N (Figure 6D).

3.4. Optimal Fertilizer Application

To obtain the optimal fertilizer amount for grain yield, we conducted frequency analysis for the eight treatments with grain yields higher than 4480 kg ha−1. The 95% confidence intervals for N, P2O5, and K2O were 1.83–2.42, 0.86–2.39, and 0.87–2.13, respectively. Thus, the optimal fertilizer amount for high grain yield was 411.62–544.63 kg ha−1 N, 115.98–322.77 kg ha−1 P2O5, and 65.10−159.90 kg ha−1 K2O (Table 6).
Similarly, nine treatments with biomass per plant higher than 54 g were used for the fertilizer frequency analysis. The 95% confidence intervals for N and P2O5 fertilizer were 1.14−1.86 for each and 1.57−1.93 for K2O. Thus, the optimal fertilization requirement for high biomass per plant (>54 g) was 256.61–418.39 kg ha−1 N, 153.97–251.03 kg ha−1 P2O5, and 117.77−144.73 kg ha−1 K2O (Table 7).
The average plant density was 178,440 plants per hectare and ranged from 132,270 to 240,195 plants per hectare for plots. The analysis of the relationship between plant number and grain yield in 2014 and 2015 revealed that the best fitting models were y i = 440.2033 + 0.022571 x i and y i = 111.5964 0.00019 x i , respectively, where y i is the grain yield and biomass per plant for treatment i; and x i is the plant density for each treatment i. The result shows that the regression was significant for grain yield (p < 0.001) and biomass per plant (p < 0.05) and the adjusted r2 is 0.43 for grain yield and 0.13 for biomass per plant. Thus, a plant density of 300,000 plants per hectare gave a grain yield of 7211.5 kg ha−1 and plant biomass of 16378.9 kg ha−1.
To determine the optimal fertilizer amount for high grain yield (>7.21 tons ha−1) and high plant biomass (>16.38 tons ha−1), we compared the optimal range for grain yield and plant biomass. The result shows that 411.62–418.39 kg ha−1 N, 153.97–251.03 kg ha−1 P2O5, and 117.77–144.73 kg ha−1 K2O is the optimal combination.

4. Discussion

Mulched drip irrigation is regarded as an effective water-saving irrigation technique that is adopted widely in the arid and semi-arid environments, which can effectively maintain and improve soil health and functionality [31,32,33]. The combination of film mulching and drip irrigation has been applied to vegetable, corn, and cotton cultivations in Northwest China and provides a potential solution to balance the needs of the rising agricultural production and the sustainability of the oasis agroecosystem [34]. However, little attention has been paid to the optimal fertilization combination for soybean in the agro-ecosystem where mulching is implemented with drip irrigation. There is little potential to further increase current levels of soybean grain yields (2800 up to 4500 kg ha−1) with the exception when plants are grown under some favorable conditions (day length, water availability, etc.) prevailing in the arid and semiarid areas where appropriate irrigation systems have been practiced. Given the unique climate in Xinjiang which is beneficial for nutrient transportation, photosynthetic accumulation, and seed development using drip irrigation [35], it is worth improving the grain yield and plant biomass simultaneously to maintain the high-yield record. Thus, we selected Zhonghuang 35 with different fertilizer treatments in a typical agro-ecosystem to shed new insights into the fertilization effects on soybean grain yield and plant biomass under constant film mulching and drip irrigation.
Nitrogen (N), Phosphorus (P), and potassium (K) are essential to ensure adequate nutrient supply and maximum grain yield, comprising a significant proportion of total fertilizer expenditures, and can be yield limiting in soybean. Determining optimum application of these fertilizers effects has been an ongoing research focus for decades and efforts are continuing to refine recommendations. Studies have shown that excessive or insufficient N, P, and K application suppresses plant growth and dry matter accumulation, as well as the allocation and utilization ratio of nitrogen and phosphate fertilizer [36]. In the present study, fertilization at different degrees promoted the growth of agronomic characters such as plant height and stem number. High variability for grain yield was observed with N fertilization rather than P and K fertilization, thus, nitrogen has a big impact on soybean grain yield. Increasing the nitrogen amount will result in an increase in grain yield, while decreasing the nitrogen amount will promote fertilizer absorption by the nutritious organ. P fertilizer improved the harvest index while K fertilizer largely affected the biomass. Therefore, the effect of K fertilizer on biomass was more as compared to N and P. The result of the findings revealed that soybean performance was largely affected by fertilizer, and it also provides effective fertilization measures for the cultivation and production of soybean.
The “3414” fertilizer experiment design was recommended for the national soil testing and fertilization work to fast build a formula fertilization system and guide farmers in applying fertilizer due to less processing and higher efficiency. The main analysis methods include the fertilizer effect function method, the nutrient balance method, and the soil nutrient abundance index method [37], while the fertilizer effect function method is the most commonly used method in soil measurement. To the best of our knowledge, this is the first time that the recommended fertilizer Zhonghuang 35 in Xinjiang under drip irrigation has been characterized in any research.
For the fertilizer effect function method, the unary quadratic function, binary quadratic function, and quadratic polynomial regression function [38,39] have been used to fit the model and obtain the optimal fertilization application. Studies show that the quadratic polynomial regression function is the best model for the “3414” fertilizer experiment design [40], while there still exists a lot of statistical problems. For instance, there is shown to be a typical fertilizer effect function, the maximum fertilizer for the highest yield loses touch with reality, the optimal fertilizer amount with a detailed number on solving the function is not available for control. Thus, an effective and practical analytical method for the “3414” experimental design needs to be determined. Due to multicollinearity, the quadratic polynomial regression equation is difficult to put into practice and cannot account for the diminishing effects of fertilizer. To overcome this, we set a maximum grain yield target, then obtained a set of fertilization combinations within the 95% confidence interval.
Previous research on fertilizers applied to leguminous species have limited their investigations to short-term data collection with few treatments setting for establishing fertilizer combinations, while little data exploration has occurred [41]. Hence, research on the relationship among a wide range of agronomic, quality, and biomass traits under various fertilizer treatments is necessary. Studies have shown that a decrease in grain yield will also result in a decrease in biomass [19]. Inadequate biomass accumulation caused by environmental changes can lead to grain yield reduction. The correlation analysis in our experiment shows that there is a positive correlation between grain yield components and plant biomass. This is evident from the highest grain yield observed by the treatment N3P2K2 but with low plant biomass, which is consistent with the report of Huang et al. [19]. The high-yielding soybean cultivar, Zhonghuang 35, won a high seed yield record of 6.32 tons ha−1 in 2012 for this experiment. Although soybeans require higher nitrogen requirement (100 kg of soybeans require 8 to 9 kg of N), only about 1/3 comes from fertilizers.
To obtain the economically effective fertilizer combinations, the price of the fertilizer was taken into consideration. As of January 2022, the price of urea per ton was $354, monoammonium phosphate was $435, and potassium chloride was $455. The yield difference of 401kg between N2P2K2 (4591 kg) and N1P2K2 (4190 kg), at the latest soybean sales price of $0.57 a kilogram, will give an increase of $228 revenue. In this way, $55 net income per ha will be produced, which will totally cover the $173 cost of 489 kg urea. Taken together, we concluded that the optimal fertilizer needed to achieve a grain yield greater than 7.21 tons ha−1 and plant biomass greater than 16.38 tons ha−1 is 411.62–418.39 kg ha−1 N, 153.97−251.03 kg ha−1 P2O5, and 117.77−144.73 kg ha−1 K2O. The recommended fertilizer application would be useful for production and serve as a guideline for efficient fertilization of soybean. This economical fertilizer combination could promote the use of profitable fertilizer in future production of soybean.

5. Conclusions

In this study, we conducted the “3414” experiment under drip irrigation in the arid region of Northwest China based on a super-high yielding soybean cultivar Zhonghuang 35. First, we confirmed that N fertilizer significantly affects grain yield, while P and K fertilizers influence harvest index and biomass, respectively. Second, we clarified the relationship among a wide range of agronomic, quality, and biomass traits under various fertilizer treatments. Third, we offered the optimal fertilizer scheme to obtain a theoretical grain yield and plant biomass of more than 7.21 tons ha1 and 16.38 tons ha1 with 300,000 plants ha1, respectively. This will serve as a guideline for effective fertilization measures in order to achieve a balance between grain yield and plant biomass as well as to contribute to the promotion of the large-scale cultivation of soybean under drip irrigation, which will increase the efficiency and productivity of farmlands, thereby improving profitability and also helping to minimize environmental risk.

Supplementary Materials

The following supporting information can be downloaded at: https://www.mdpi.com/article/10.3390/agronomy12020291/s1, Figure S1: Grain yield of Zhonghuang 35 based on the different treatment combinations; Figure S2: The adjusted r2 on the quadratic polynomial regression model with different components for grain yield (A) and plant biomass (B), the number on the left means r2 of the model with the component colored in “black” for each row; Table S1: Statistics of meteorological data of Wulanwusu agricultural meteorological experimental station in 2014 and 2015; Table S2: The field fertilizer amount of each plot for Zhonghuang 35 in 2014; Table S3: The field fertilizer amount of each plot for Zhonghuang 35 in 2015; Table S4: The growth period and irrigation amount in 2014 and 2015; Table S5: The definition and description information for 31 soybean traits.

Author Contributions

Conceptualization, J.S. and J.L.; methodology, J.L.; software, J.L.; investigation, G.L.; resources, J.S.; writing—original draft preparation, J.L.; writing—review and editing, J.S., A.S.S., B.L., and S.Z.; visualization, J.L.; supervision, J.S.; project administration, J.S.; funding acquisition, J.S. All authors have read and agreed to the published version of the manuscript.

Funding

This research was funded by National Natural Science Foundation of China: 32161143033; National Natural Science Foundation of China: 32001574; and Agricultural Science and Technology Innovation Program of CAAS: 2060203-2.

Institutional Review Board Statement

Not applicable.

Informed Consent Statement

Not applicable.

Data Availability Statement

All data is provided in the manuscript.

Acknowledgments

We thank Jing Zhao, who works in the Institute of Crops Research, Xinjiang Academy of Agricultural and Reclamation Sciences, for helping with the data collection.

Conflicts of Interest

The authors declare no competing financial interest with regard to this manuscript.

References

  1. Wang, H.; Ni, C.; Xu, R. Analysis of change and convergence of soybean productivity in China. Jiangsu J. Agric. Sci. 2011, 27, 199–203. [Google Scholar]
  2. Zhang, F.; Niu, J.; Zhang, W.; Chen, X.; Li, C.; Yuan, L.; Xie, J. Potassium nutrition of crops under varied regimes of nitrogen supply. Plant Soil 2010, 335, 21–34. [Google Scholar] [CrossRef]
  3. Fu, C.F.; Sun, C.; Dong, Y.M. Effects of nutrient management on NPK uptake and yield of soybean. Heilongjiang Agr. Sci. 2011, 10, 33–35. [Google Scholar]
  4. Ciampitti, I.A.; Salvagiotti, F. New insights into soybean biological nitrogen fixation. Agron. J. 2018, 10, 1185–1196. [Google Scholar] [CrossRef] [Green Version]
  5. Salvagiotti, F.; Cassman, K.G.; Specht, J.E.; Walters, D.T.; Weiss, A.; Dobermann, A. Nitrogen uptake, fixation and response to fertilizer N in soybeans: A review. Field Crop. Res. 2008, 108, 1–13. [Google Scholar] [CrossRef] [Green Version]
  6. Yang, F.; Xu, X.; Wang, W.; Ma, J.; Wei, D.; He, P.; Pampolino, M.F.; Johnston, A.M. Estimating nutrient uptake requirements for soybean using QUEFTS model in China. PLoS ONE 2017, 12, e0177509. [Google Scholar] [CrossRef]
  7. Zapata, F.; Danso, S.K.A.; Hardarson, G.; Fried, M. Time Course of Nitrogen Fixation in Field-Grown Soybean Using Nitrogen-15 Methodology1. Agron. J. 1987, 79, 172–176. [Google Scholar] [CrossRef]
  8. Li, L.; Yang, T.; Redden, R.; He, W.F.; Zong, X.X. Soil fertility map for food legumes production areas in China. Sci. Rep. 2016, 6, 26102. [Google Scholar] [CrossRef] [Green Version]
  9. Fan, J.; Lu, X.; Gu, S.; Guo, X. Improving nutrient and water use efficiencies using water-drip irrigation and fertilization technology in Northeast China. Agric. Water Manag. 2020, 241, 106352. [Google Scholar] [CrossRef]
  10. Tang, P.; Li, H.; Issaka, Z.; Chen, C. Effect of manifold layout and fertilizer solution concentration on fertilization and flushing times and uniformity of drip irrigation systems. Agric. Water Manag. 2018, 200, 71–79. [Google Scholar] [CrossRef]
  11. Zou, H.; Fan, J.; Zhang, F.; Xiang, Y.; Wu, L.; Yan, S. Optimization of drip irrigation and fertilization regimes for high grain yield, crop water productivity and economic benefits of spring maize in Northwest China. Agric. Water Manag. 2020, 230, 105986. [Google Scholar] [CrossRef]
  12. Chen, Y.; Zhou, X.; Lin, Y.; Ma, L. Pumpkin yield affected by soil nutrients and the interactions of Nitrogen, Phosphorus, and Potassium fertilizers. HortScience 2019, 54, 1831–1835. [Google Scholar] [CrossRef] [Green Version]
  13. Yang, Z.J.; Wu, X.H.; Grossnickle, S.C.; Chen, L.H.; Yu, X.X.; El-Kassaby, Y.A.; Feng, J.L. Formula fertilization promotes Phoebe bournei robust seedling cultivation. Forests 2020, 11, 781. [Google Scholar] [CrossRef]
  14. Yin, Z.C.; Guo, W.Y.; Liang, J.; Xiao, H.Y.; Hao, X.Y.; Hou, A.F.; Zong, X.X.; Leng, T.R.; Wang, Y.J.; Wang, Q.Y.; et al. Effects of multiple N, P, and K fertilizer combinations on adzuki bean (Vigna angularis) yield in a semi-arid region of northeastern China. Sci. Rep. 2019, 9, 19408. [Google Scholar] [CrossRef] [PubMed] [Green Version]
  15. Parry, M.A.; Reynolds, M.; Salvucci, M.E.; Raines, C.; Andralojc, P.J.; Zhu, X.G.; Price, G.D.; Condon, A.G.; Furbank, R.T. Raising yield potential of wheat. II. Increasing photosynthetic capacity and efficiency. J. Exp. Bot. 2010, 62, 453–467. [Google Scholar] [CrossRef]
  16. Fischer, R.; Rees, D.; Sayre, K.; Lu, Z.M.; Condon, A.; Saavedra, A.L. Wheat yield progress associated with higher stomatal conductance and photosynthetic rate, and cooler canopies. Crop Sci. 1998, 38, 1467–1475. [Google Scholar] [CrossRef]
  17. Jin, J.; Liu, X.; Wang, G.; Mi, L.; Shen, Z.; Chen, X.; Herbert, S.J. Agronomic and physiological contributions to the yield improvement of soybean cultivars released from 1950 to 2006 in Northeast China. Field Crops Res. 2010, 115, 116–123. [Google Scholar] [CrossRef]
  18. Board, J.E.; Modali, H. Dry matter accumulation predictors for optimal yield in soybean. Crop Sci. 2005, 45, 1790–1799. [Google Scholar] [CrossRef]
  19. Huang, Z.W.; Zhao, T.J.; Gai, J.Y. Dynamic analysis of biomass accumulation and partition in soybean with different yield levels. Crop Sci. 2009, 35, 1483–1490. [Google Scholar] [CrossRef]
  20. Mehetre, S.S.; Jamadagni, B.M. Biomass partitioning and growth characters in relation to plant architecture in soybean. Soybean Genet. Newsl. 1996, 23, 92–97. [Google Scholar]
  21. IUSS Working Group WRB. International soil classification system for naming soils and creating legends for soil maps. In World Reference Base for Soil Resources 2014; update 2015; Food and Agriculture Organization of the United Nations: Rome, Italy, 2015. [Google Scholar]
  22. Wang, L.; Wang, L.Z.; Zhao, R.J.; Li, Q. Development of new soybean cultivar Zhonghuang 35 with high yielding, high oil, early maturity and broad adaptability. Soybean Sci. 2009, 28, 360–362. [Google Scholar]
  23. Wang, L.Z.; Luo, G.T.; Wang, L.; Sun, J.M.; Zhang, Y. Development of soybean cultivation technology with the yield over 6 tonnes per hectare for soybean cultivar Zhonghuang 35 in northern Xinjiang province. Soybean Sci. 2012, 31, 217–223. [Google Scholar]
  24. Bao, S.D. Soil Agrochemical Analysis; China Agricultural Press: Beijing, China, 2000; pp. 25–114. [Google Scholar]
  25. Zhang, Y.; He, J.; Wang, H.; Meng, S.; Xing, G.; Li, Y.; Yang, S.; Zhao, J.; Zhao, T.; Gai, J. Detecting the QTL-allele system of seed oil traits using multi-locus genome-wide association analysis for population characterization and optimal cross prediction in soybean. Front. Plant Sci. 2018, 9, 1793. [Google Scholar] [CrossRef] [PubMed] [Green Version]
  26. Kolde, R. Pheatmap: Pretty Heatmaps; R Package Version; CRC Press: Boca Raton, FL, USA, 2012; Volume 61, p. 915. [Google Scholar]
  27. Wei, T.; Simko, V. Corrplot: Visualization of a Correlation Matrix; R Package Version; CRC Press: Boca Raton, FL, USA, 2013; p. 230. [Google Scholar]
  28. Maechler, M.; Rousseeuw, P.; Struyf, A.; Hubert, M.; Hornik, K. Package ‘cluster’. Dosegljivo na. 2013. Available online: https://cran.r-project.org/web/packages/cluster/cluster.pdf (accessed on 20 January 2022).
  29. Lumley, T.; Miller, A. Package ‘leaps’. In Regression Subset Selection, R package version; CRC Press: Boca Raton, FL, USA, 2009; Volume 2, p. 2366. [Google Scholar]
  30. Grant, M.; Boyd, S.; Ye, Y. CVX: Matlab Software for Disciplined Convex Programming; CVX: San Ramon, CA, USA, 2008. [Google Scholar]
  31. Seyfi, K.; Rashidi, M. Effect of drip irrigation and plastic mulch on crop yield and yield components of cantaloupe. Int. J. Agric. Biol. 2007, 9, 247–249. [Google Scholar]
  32. He, H.; Wang, Z.; Guo, L.; Zheng, X.; Zhang, J.; Li, W.; Fan, B. Distribution characteristics of residual film over a cotton field under long-term film mulching and drip irrigation in an oasis agroecosystem. Soil Till. Res. 2018, 180, 194–203. [Google Scholar] [CrossRef]
  33. Akhtar, K.; Wang, W.; Ren, G.; Khan, A.; Feng, Y.; Yang, G.; Wang, H. Integrated use of straw mulch with nitrogen fertilizer improves soil functionality and soybean production. Environ. Int. 2019, 132, 105092. [Google Scholar] [CrossRef] [PubMed]
  34. Li, F.M.; Wang, P.; Wang, J.; Xu, J.Z. Effects of irrigation before sowing and plastic film mulching on yield and water uptake of spring wheat in semiarid Loess Plateau of China. Agric. Water Manag. 2004, 67, 77–88. [Google Scholar] [CrossRef]
  35. Zhang, D.; Liu, H.B.; Hu, W.L.; Qin, X.H.; Yan, C.R.; Wang, H.Y. The status and distribution characteristics of residual mulching film in Xinjiang, China. J. Integr. Agric. 2016, 15, 2639–2646. [Google Scholar] [CrossRef] [Green Version]
  36. Galloway, J.N.; Winiwarter, W.; Leip, A.; Leach, A.M.; Bleeker, A.; Erisman, J.W. Nitrogen footprints: Past, present and future. Environ. Res. Lett. 2014, 9, 115003. [Google Scholar] [CrossRef]
  37. Chen, X.P.; Zhang, F.S. The technical index system of soil testing and fertilization was established through “3414” test. China Agric. Technol. Ext. 2006, 4, 36–39. [Google Scholar]
  38. Zhao, B.; Wang, Y.; Zhang, Z.Y.; Zhu, X.D.; Yang, R. Identification and optimization of extreme value of effect function of multivariate secondary fertilizer. Rain Fed Crops 2001, 21, 42–45. [Google Scholar]
  39. Wang, S.R.; Chen, X.P.; Gao, X.Z.; Mao, D.R.; Zhang, F.S. Study on simulation of “3414” fertilizer experiments. Plant Nutr. Fertil. Sci. 2002, 8, 409–413. [Google Scholar]
  40. Peng, S.B.; Cheng, Y.X.; Dong, W.H.; Liu, D.L. “3414” fertilization tests and regression analysis of recommended fertilizer amount of walnut. Nonwood For. Res. 2018, 36, 27–32. [Google Scholar]
  41. Ma, R.X.; Wang, J.S.; Li, X.Z.; Liu, W.C. Effect of different npk fertilizers cooperating application on yield and quality of high starch maize. In Applied Mechanics and Materials; Trans Tech Publications Ltd.: Bäch SZ, Switzerland, 2012; Volume 214, pp. 423–429. [Google Scholar]
Figure 1. The average temperature and cumulative precipitation for each month in 2014 and 2015.
Agronomy 12 00291 g001
Figure 2. The principal component analysis of 31 traits. (A) The heatmap of 31 traits on the first five principal components, the depth of color indicates the level of trait contribution on the corresponding PC, (B) PCA plot for 31 traits, ellipses and shapes show clustering of traits, (C) principal component analysis for 14 treatments, circle size means the square cosine, (D) the contribution for 31 traits on PC1 and PC2, the length indicates the quality of trait. Yield, Grain yield; PH, Plant height; FPH, First pod height; SD, Stem diameter; NN, Number of nodes on main stem; BN, Branch number; PN, Pod number; SNPT, Seed number per plant; SWP, Seed weight per plant; HSW, 100-seed weight; SNPD, Seed number per pod; HI, Harvest index; PDB, Biomass per pod; LB, Biomass per leaf; SB, Biomass per stem; PTB, Biomass per plant; Nseed, N content in seed; Npod, N content in pod; Nleaf, N content in leaf; Nstem, N content in stem; Pseed, P content in seed; Ppod, P content in pod; Pleaf, P content in leaf; Pstem, P content in stem; Kseed, K content in seed; Kpod, K content in pod; Kleaf, K content in leaf; Kstem, K content in stem; Protein, Protein content; Oil, Oil content; Water, Water content.
Agronomy 12 00291 g002
Figure 3. The pairwise correlations (Pearson’s r) among 31 traits based on the averaged values. The lower diagonal plots show the correlation coefficient, significant differences are indicated by * p < 0.05, ** p < 0.01, *** p < 0.001, values without asterisks were not significant at p < 0.05. The upper diagonal only shows the significant correlations which are represented as colored circles, blue indicating negative correlation, and red indicating positive correlation. Yield, Grain yield; PH, Plant height; FPH, First pod height; SD, Stem diameter; NN, Number of nodes on main stem; BN, Branch number; PN, Pod number; SNPT, Seed number per plant; SWP, Seed weight per plant; HSW, 100-seed weight; SNPD, Seed number per pod; HI, Harvest index; PDB, Biomass per pod; LB, Biomass per leaf; SB, Biomass per stem; PTB, Biomass per plant; Nseed, N content in seed; Npod, N content in pod; Nleaf, N content in leaf; Nstem, N content in stem; Pseed, P content in seed; Ppod, P content in pod; Pleaf, P content in leaf; Pstem, P content in stem; Kseed, K content in seed; Kpod, K content in pod; Kleaf, K content in leaf; Kstem, K content in stem; Protein, Protein content; Oil, Oil content; Water, Water content.
Agronomy 12 00291 g003
Figure 4. The heatmap of 31 traits for the 3414-experiment design. The color indicates the correlation between treatment and trait.
Agronomy 12 00291 g004
Figure 5. Effect of N, P, and K fertilizer rates on the grain yield (A) and biomass per plant (B) of soybean.
Agronomy 12 00291 g005
Figure 6. Effects and response surface of interaction among N, P, and K fertilizers on the grain yield (AC) and biomass per plant (DF) of soybean. (A) effects and response surface of N fertilizers and P fertilizer on grain yield (fixed factor = 0); (B) effects of N fertilizers and K fertilizer on grain yield (fixed factor = 0); (C) effects of P fertilizers and K fertilizer on grain yield (fixed factor = 0); (D) effects of N fertilizers and P fertilizer on biomass per plant (fixed factor = 0); (E) effects of N fertilizers and K fertilizer on biomass per plant (fixed factor = 0); (F) effects of P fertilizers and K fertilizer on biomass per plant (fixed factor = 0).
Agronomy 12 00291 g006
Table 1. The 3414-fertilization experiment design for soybean.
No.TreatmentUrea (kg ha−1)Monoammonium
Phosphate (kg ha−1)
Potassium
Chloride
(kg ha−1)
Total Fertilizer in the Block (kg)
(N:46%)(P2O5:61%)(K2O:62%)UreaMonoammonium
Phosphate
Potassium
Chloride
1N0P0K00000.000.000.00
2N0P2K2051900.001.050.00
3N1P2K23744432420.750.890.49
4N2P0K297802421.970.000.49
5N2P1K29212212421.860.450.49
6N2P2K28634432421.740.890.49
7N2P3K28056642421.621.340.49
8N2P2K086344301.740.890.00
9N2P2K18634431211.740.890.24
10N3P2K213524432422.730.890.49
11N1P1K24312212420.870.450.49
12N1P2K13744431210.750.890.24
13N2P1K19212211211.860.450.24
14N2P2K38634433631.740.890.73
Table 2. The average result for 3414 experiment design.
RepTreatmentYieldPHFPHSDNNBNPNSNPTSWPHSWSNPDHIPDBLBSBPTBNseedNpodNleafNstemPseedPpodPleafPstemKseedKpodKleafKstemProteinOilWater
Unitkg ha−1cm g gg kg−1%
1N0P0K03726.5079.8411.330.7117.800.8062.43149.5229.6021.612.460.519.5829.8012.1954.9248.869.5713.999.855.221.251.621.4212.6317.577.796.9439.3821.876.83
2N0P2K24195.8882.6812.230.7717.901.2864.17150.9729.8520.302.360.5010.9239.4517.2065.2248.5811.3813.698.835.521.851.881.6312.4919.529.006.0139.3721.776.87
3N1P2K24190.4083.3111.410.7518.721.0369.90156.1033.1920.062.450.5112.3436.8616.1960.8448.9911.1915.169.835.361.781.891.7712.4817.697.386.9139.1521.936.83
4N2P0K24543.7582.5210.830.7418.460.8259.67133.7830.1721.852.410.5512.9534.2114.3955.6849.029.8015.4611.305.081.291.541.3812.3917.506.646.5939.7022.106.90
5N2P1K24483.7580.2410.840.7418.101.2565.02153.7431.7321.342.460.5511.4831.4912.5559.1948.538.7113.029.845.201.141.401.1812.4818.266.536.2039.0522.306.93
6N2P2K24590.7579.1012.100.7017.731.0357.68135.9528.9721.232.450.5610.2733.3812.6252.5549.138.9713.468.855.241.331.521.4312.2817.526.936.5639.0022.336.70
7N2P3K24584.2582.3611.960.6817.821.1358.43132.0428.5121.172.400.5710.7934.1113.0951.4247.699.3012.449.515.371.411.511.4911.6017.897.006.3939.2021.986.93
8N2P2K04484.0082.1810.690.6617.651.0551.89121.4525.2621.862.440.558.7926.5910.8646.8046.788.9313.618.945.211.451.731.3511.6418.117.335.7039.0522.257.03
9N2P2K14500.5079.3812.390.7417.601.1566.69147.9529.0621.412.360.5412.3632.2513.4654.9946.849.0214.469.695.621.431.561.3712.3717.396.555.7539.8221.087.20
10N3P2K24654.5082.0911.260.6817.960.8956.49131.5526.0121.152.450.538.5434.0412.1349.8148.939.2314.629.405.561.291.651.4911.9716.486.745.6239.8521.237.00
11N1P1K24189.2579.6011.810.7017.870.7949.95124.7925.0222.052.540.5110.5131.1313.4049.6247.4810.3113.889.215.541.471.401.5310.7817.796.926.3039.0322.236.87
12N1P2K14219.0076.4911.490.7118.520.7963.92151.4029.8721.622.470.5410.7830.2713.0257.0848.0410.5315.4110.785.421.551.681.6712.7316.347.236.0239.1721.727.00
13N2P1K14491.2581.0711.180.6718.280.6660.51146.7029.6322.462.480.5511.8335.9614.1754.0448.899.8215.249.155.211.471.521.2412.7216.237.076.1340.1221.477.07
14N2P2K34112.5082.0011.080.7418.201.3372.65183.9034.3519.572.530.5512.3355.8420.2864.7746.798.7712.085.075.691.221.420.8614.3016.245.654.5039.2722.277.00
Yield, Grain yield; PH, Plant height; FPH, First pod height; SD, Stem diameter; NN, Number of nodes on main stem; BN, Branch number; PN, Pod number; SNPT, Seed number per plant; SWP, Seed weight per plant; HSW, 100-seed weight; SNPD, Seed number per pod; HI, Harvest index; PDB, Biomass per pod; LB, Biomass per leaf; SB, Biomass per stem; PTB, Biomass per plant; Nseed, N content in seed; Npod, N content in pod; Nleaf, N content in leaf; Nstem, N content in stem; Pseed, P content in seed; Ppod, P content in pod; Pleaf, P content in leaf; Pstem, P content in stem; Kseed, K content in seed; Kpod, K content in pod; Kleaf, K content in leaf; Kstem, K content in stem; Protein, Protein content; Oil, Oil content; Water, Water content.
Table 3. Fertilizer interaction effect and abundance or shortage status of nutrients.
NumberFertilizer TypeTreatmentGrain Yield
(kg ha−1)
Percentage Higher than CKPercentage of N2P2K2 Compared to Other Treatments
1CKN0P0K03726.50 19
2P, KN0P2K24195.88139
4N, KN2P0K24543.75221
6N, P, KN2P2K24590.7523
8N, PN2P2K04484.00202
Table 4. Analysis of variance of the effects of N, P, and K fertilizers on grain yield.
Source of VariationEstimateStandard Errort-Valuep-Value
Intercept3724.3282.6645.060.00 ***
N1.500.403.720.01 **
P−1.360.75−1.800.12
K6.101.215.030.00 **
N20.000.001.170.29
P20.000.002.000.09
K2−0.020.01−2.940.03 *
N:K−0.010.00−2.970.03 *
Significant differences are indicated by * p < 0.05, ** p < 0.01, *** p < 0.001.
Table 5. Analysis of variance of the effects of N, P, and K fertilizers on biomass per plant.
Source of VariationEstimateStandard Errort-Valuep-Value
Intercept54.563.1817.180.00 ***
N0.030.031.300.24
P0.070.041.730.14
K−0.230.09−2.740.04 *
K20.000.001.510.18
N:P0.000.00−3.460.01 *
N:K0.000.001.380.22
P:K0.000.001.620.16
Significant differences are indicated by * p < 0.05, *** p < 0.001
Table 6. The frequency distribution and fertilization measures for grain yield greater than 4480 kg ha−1.
LevelsNP2O5K2O
TimesFrequencyTimesFrequencyTimesFrequency
00010.12510.125
10020.2520.25
270.87540.5050.625
310.12510.12500
Weight mean2.13 1.63 1.50
Standard error0.35 0.92 0.76
95% confidence interval1.832.420.862.390.872.13
Fertilization measures (kg ha−1)411.62544.63115.98322.7765.10159.90
Table 7. The frequency distribution and fertilization measures for biomass per plant > 54 g.
LevelsNP2O5K2O
TimesFrequencyTimesFrequencyTimesFrequency
02.000.252.000.251.000.13
12.000.252.000.253.000.38
25.000.6255.000.634.000.5
30.000.000.000.001.000.13
Weight mean1.50 1.50 1.75
Standard error0.47 0.47 0.23
95% confidence interval1.141.8601.141.861.571.93
Fertilization measures (kg ha−1)256.61418.39153.97251.03117.77144.73
Publisher’s Note: MDPI stays neutral with regard to jurisdictional claims in published maps and institutional affiliations.

