Article

Metabolomics Analysis Reveals Dynamic Accumulation of Sugar and Acid during Stem Development of Brassica juncea

1
College of Horticulture, Sichuan Agricultural University, Chengdu 611130, China
2
College of Horticulture and Forestry, Tarim University, Alar 843300, China
3
College of Hydraulic & Environmental Engineering, China Three Gorges University, Yichang 443002, China
*
Author to whom correspondence should be addressed.
These authors contributed equally to this work.
Agronomy 2022, 12(12), 3227; https://doi.org/10.3390/agronomy12123227
Submission received: 14 November 2022 / Revised: 16 December 2022 / Accepted: 17 December 2022 / Published: 19 December 2022
(This article belongs to the Special Issue Recent Advances in Horticultural Crops-from Omics to Biotechnology)

Abstract

:
The composition and content of sugar and acid are important indicators of organ development and the quality of horticultural products. B. juncea is an important vegetable in the cruciferous family, with a swollen fleshy stem as the edible organ. Elucidating the characteristics of sugar and acid accumulation during stem expansion of stem mustard and its regulatory mechanism could enhance stem quality. In this study, physiological indicators such as dry matter content, sugar–acid content and related enzyme activities were measured in eight stages of the tumorous stem. The results showed that the sugar and sucrose contents initially increased and then decreased during stem development: Sucrose exhibited a positive correlation with sucrose synthase and sucrose phosphate synthase, while acid content was highly positively correlated with malate dehydrogenase. Further analysis of the dynamic patterns of sugar and acid metabolite contents using metabolomics showed that 1097 metabolites were detected, including 229 organic acids and derivatives, 109 lipids, and other metabolites. Metabolic pathway enrichment analysis showed that metabolites were significantly enriched in organic acids, amino acids, glycolysis/gluconeogenesis, starch, and sucrose metabolism. Analysis of the sugar pathway and the tricarboxylic acid cycle revealed obvious differences in the content and type of metabolites, with most upregulated metabolites in S3 and S4. The expression patterns of enzyme genes associated with the biosynthesis and accumulation of sugar and acid metabolites were found based on differentially expressed genes at different developmental stages, and gene expression levels were verified by qPCR, which showed that the expression patterns of enzyme genes associated with this pathway were highly consistent with the metabolite accumulation. These results suggest that amino acids, sugars, and acids play a critical role in regulating the development of tumorous stems. Results of the present study offer a theoretical basis to improving the quality of mustard by using a metabolomics approach to determine the dynamics of metabolites and related regulatory enzymes during development and the correlation between these levels, which provides novel insights into the potential mechanisms underlying sugar and acid metabolism.

1. Introduction

Stem mustard (Brassica juncea var. tumida Tsen et Lee) is a biennial herb representing a mustard species in the genus Mustard of the family Cruciferae, with chromosome number 2n = 4x = AABB = 36 [1]. Many types and varieties exist, which are traditionally divided into oilseed mustard, seed stalk mustard, root mustard, stem mustard, and leaf mustard according to their edible organs [2]. Stem mustard is a vegetable with a swollen edible stem grown in China. It is widely consumed worldwide not only as a fresh vegetable, but its stem can be also processed to make squash [3]. Its tuberous stem develops in a concave protrusion and is a raw material crop for processing and making squash.
The growth and development of horticultural product organs generally have a long cycle, ranging from small to large in size, accompanied by the accumulation and metabolism of nutrients inside [4]. The accumulation and metabolism of internal photosynthetic assimilation are central to regulating product organ growth and development and directly affect organ expansion. The development of a tumorous stem involves several physiological and biochemical changes [5]. The components, content, and proportions of sugar and acid substances are important indicators for determining the quality [6], mainly glucose, fructose, sucrose, malic acid, citric acid, and isocitric acid [7]. Multiple key genes in sucrose metabolism affecting fruit ripening have been documented in studies on horticultural crops such as peaches, strawberries, and tomatoes [8,9]. Sucrose represents the main accumulator of the photosynthetic assimilates in plants and is an important energy carrier, broken down into glucose and fructose after accumulation in product organs [10]. These small reducing sugars are further involved in glycolysis and the tricarboxylic acid cycle (TCA), which provide energy and the carbon skeleton for early organ development and cell expansion [11]. Sucrose metabolism is a critical process for the accumulation of sugar, and studying enzymes related to sucrose metabolism is an important tool for exploring sugar accumulation in fruits. Such enzymes mainly involve sucrose synthase (SS), sucrose phosphate synthase (SPS), and invertase (INV) [12,13]. Sucrose concentration is well-established as an important factor affecting potato tuber growth and development, and potato tuber expansion is reportedly significantly correlated with nutrient accumulation and enzyme activity [14]. However, the key enzymes responsible for sucrose accumulation are heterogeneous across species or varieties of the same species [15]. Organic acids, as products of primary plant metabolism and metabolic intermediates, are major substances in determining osmotic potential and play an important role in developing horticultural crop product organs for swelling [16]. The source of organic acids depends mainly on the TCA in the mitochondria, which is the final oxidation pathway for the three major nutrients (sugars, fatty acids, and amino acids), supplying the energy to the organism while also serving as a metabolic connection hub for all three substances [17]. The accumulation of acid is regulated by enzymes related to organic acid metabolisms, such as malate dehydrogenase (MDH), malic enzyme (ME), and isocitrate dehydrogenase (IDH), which are key in regulating malate and citrate metabolism [18,19]. In recent years, much emphasis has been placed on the rational regulation of sugar and acid content [20,21]. However, sugar and acid accumulation represent a complex process controlled by multiple gene regulatory networks, influenced by environmental factors, and relying on many interrelated physiological and metabolic processes [22,23].
High-throughput technology-based omics provide powerful tools to analyze complex regulatory processes for metabolic pathways and regulatory networks [24]. Metabolomics indicates the combination of genetic and environmental factors in an organism and mirrors the physiological phenotype and biochemical levels in the organism [25]. Variations in the type and content of metabolites in plants may be the basis for the differences [26]. Metabolomic analysis has been widely used to identify pathways controlling sugar and acid synthesis and catabolism in plants. For example, Xu et al., found that the level of sugar accumulation mostly tended to increase, and the level of organic acids, including TCA cycle intermediates, decreased significantly in the four developmental stages of apple fruit [27]. Gong et al., investigated flavor changes in watermelon during its development and revealed that sugar content and gene expression in glycolytic pathways exhibited similar expression trends, providing a molecular insight of flavor formation during the development of fruits [28]. The previous studies showed that the differentially expressed genes in the transcriptome were analyzed in association with the differential metabolites to target the key pathways associated with the metabolite changes and then construct the core regulatory network to reveal the intrinsic patterns [29]. However, studies on the key genes and pathways regulating the synthesis of sugar and acid metabolites in the tumorous stem of B. juncea and the relationship between changes in sugar acid and different developmental stages have not been reported. Therefore, in this study, the metabolome was used to analyze the differential changes of sugar and acid metabolites and differential genes during stem development of stem mustard and to construct and analyze its related metabolic pathways in combination with sugar and acid changes and related enzyme activities, to clarify the regulatory mechanisms of sugar and acid regulation on growth and development in B. juncea, and to provide a theory for improving the quality of stems.

2. Materials and Methods

2.1. Plant Material and Treatment

The cultivar ‘Fuza No. 2′ of stem mustard (Brassica juncea var. tumida Tsen et Lee) was used in this study. The plants were grown in the field at the practice site in Chongzhou in the Sichuan Province of China. The stems were measured from different angles with digital calipers and the maximum diameter was measured precisely. Swelling stems were collected in three biological replicates with stem diameters of 2 (15 weeks of growth), 4 (17 weeks of growth), 6 (19 weeks of growth), 8 (20 weeks of growth), 10 (21 weeks of growth), 12 (22 weeks of growth), 14 (23 weeks of growth), and 16 cm (24 weeks of growth), representing S1, S2, S3, S4, S5, S6, S7, and S8 developmental stages, respectively. Samples were frozen immediately in liquid nitrogen and then stored at −80 °C for further experiment.

2.2. Methods for Determination of Morphological Indexes, Sugar and Acid Contents, and Related Enzymes

The vertical diameter (the length from the base of the stem to the top) and the horizontal diameter (the widest point perpendicular to the vertical diameter) of the stem were measured by using a digital vernier caliper, and the vegetable shape index = vertical diameter/horizontal diameter; the mass was measured by an analytical balance (0.001 g), and after being killed at 105 °C for 30 min, the stem was dried in an oven at 80 °C to a constant amount to determine the dry mass, and the moisture content was calculated. The titratable acid content was detected by the acid–base titration method. Sugar (soluble sugar, glucose, sucrose, and fructose) and sugar–acid-related enzymes (sucrose synthase (EC:2.4.1.13), sucrose phosphate synthase (EC:2.4.1.14), malate dehydrogenase (EC:1.1.1.37), malic enzyme (EC:1.1.1.38), and isocitrate dehydrogenase (EC:1.1.1.42)) were detected using the corresponding kit (Solabao, Beijing, China), and these kits were purchased from Nanjing Jiancheng Institute of Bioengineering Institute. These indexes were measured by UV spectrophotometer (Thermo Fisher).

2.3. Metabolomics Analysis

2.3.1. Sample Preparation and UHPLC-MS/MS

Each stem mustard sample of 50 mg was ground in liquid nitrogen, added to 1000 μL of 80% methanol solution, then the mixture was vortexed and incubated in an ice bath for 5 min and centrifuged at 5000 rpm and 4 °C for 20 min. About 50 mg of stem mustard sample was mixed with 1000 μL of extract containing internal standard (1000:2) (methanol-acetonitrile-water volume ratio = 2:2:1, concentration of internal standard 2 mg/L), vortexed for 30 s. Ceramic balls were added and ground at the speed of 45 Hz for 10 min, and then the extract was sonicated for 10 min (ice water solution bath). The mixture was allowed to stand at −20 °C for 1 h and then centrifuged at 4 °C for 15 min at 12,000 rpm. 500 μL of supernatant was taken in an EP tube and the extraction was dried in a vacuum-concentrator. Then, 160 μL of extract (acetonitrile-water volume ratio: 1:1) was added to the dried metabolites, re-solubilized, vortexed for 30 s, and sonicated for 10 min in an ice water bath. After centrifuging at 4 °C, 12,000 rpm for 15 min, 120 μL of supernatant was collected in 2 mL syringe vials, and then 10 μL of each sample was added to the QC samples for LC-MS/MS analysis.

2.3.2. Data Processing

The original data were obtained by MassLynx V4.2 and used Progenesis QI software for peak extraction, peak alignment, and other manipulation operations, and were identified according to the online METLIN database of Progenesis QI software and Bemec’s library, while theoretical fragmentation was identified, and the mass number deviations were all within 100 ppm [30,31].

2.3.3. Identification and Screening of Metabolites

The differential metabolites were screened according to OPLS-DA, VIP > 1.0, p < 0.05. The metabolites were characterized according to the public database (http://www.hmdb.ca/http://www.lipidmaps.org/accessed on 11 November 2021) and the self-built database of Shanghai Luming Biotechnology Co. The metabolic pathways of the differential metabolites were analyzed by KEGG (http://www.genome.jp/KEGG/pathway.html/accessed on 11 November 2021) pathway analysis.

2.4. Validation of Gene Expression Levels

RNA was extracted from B. juncea using Plant Total RNA Isolation Kit (Goldenstar RT6 cDNA Synthesis Kit Ver. 2 Ltd.). cDNA was obtained by Goldenstar RT6 cDNA Synthesis Kit Ver.2 kit (Beijing TsingKe Biotech Co., Ltd., Beijing, China). qPCR was performed using the real-time PCR system Bio-Rad CFX96TM (Bio-Rad, Hercules, CA, USA) with the 2× T5 Fast qPCR Mix (SYBR Green I). The gene-specific primer was designed by Primer Premier 6 and its sequence is shown in Table S1. The relative expression levels of each gene were normalized using the reference gene UBC [32] and calculated using the 2-∆∆CT method for the fold change [33].

3. Results

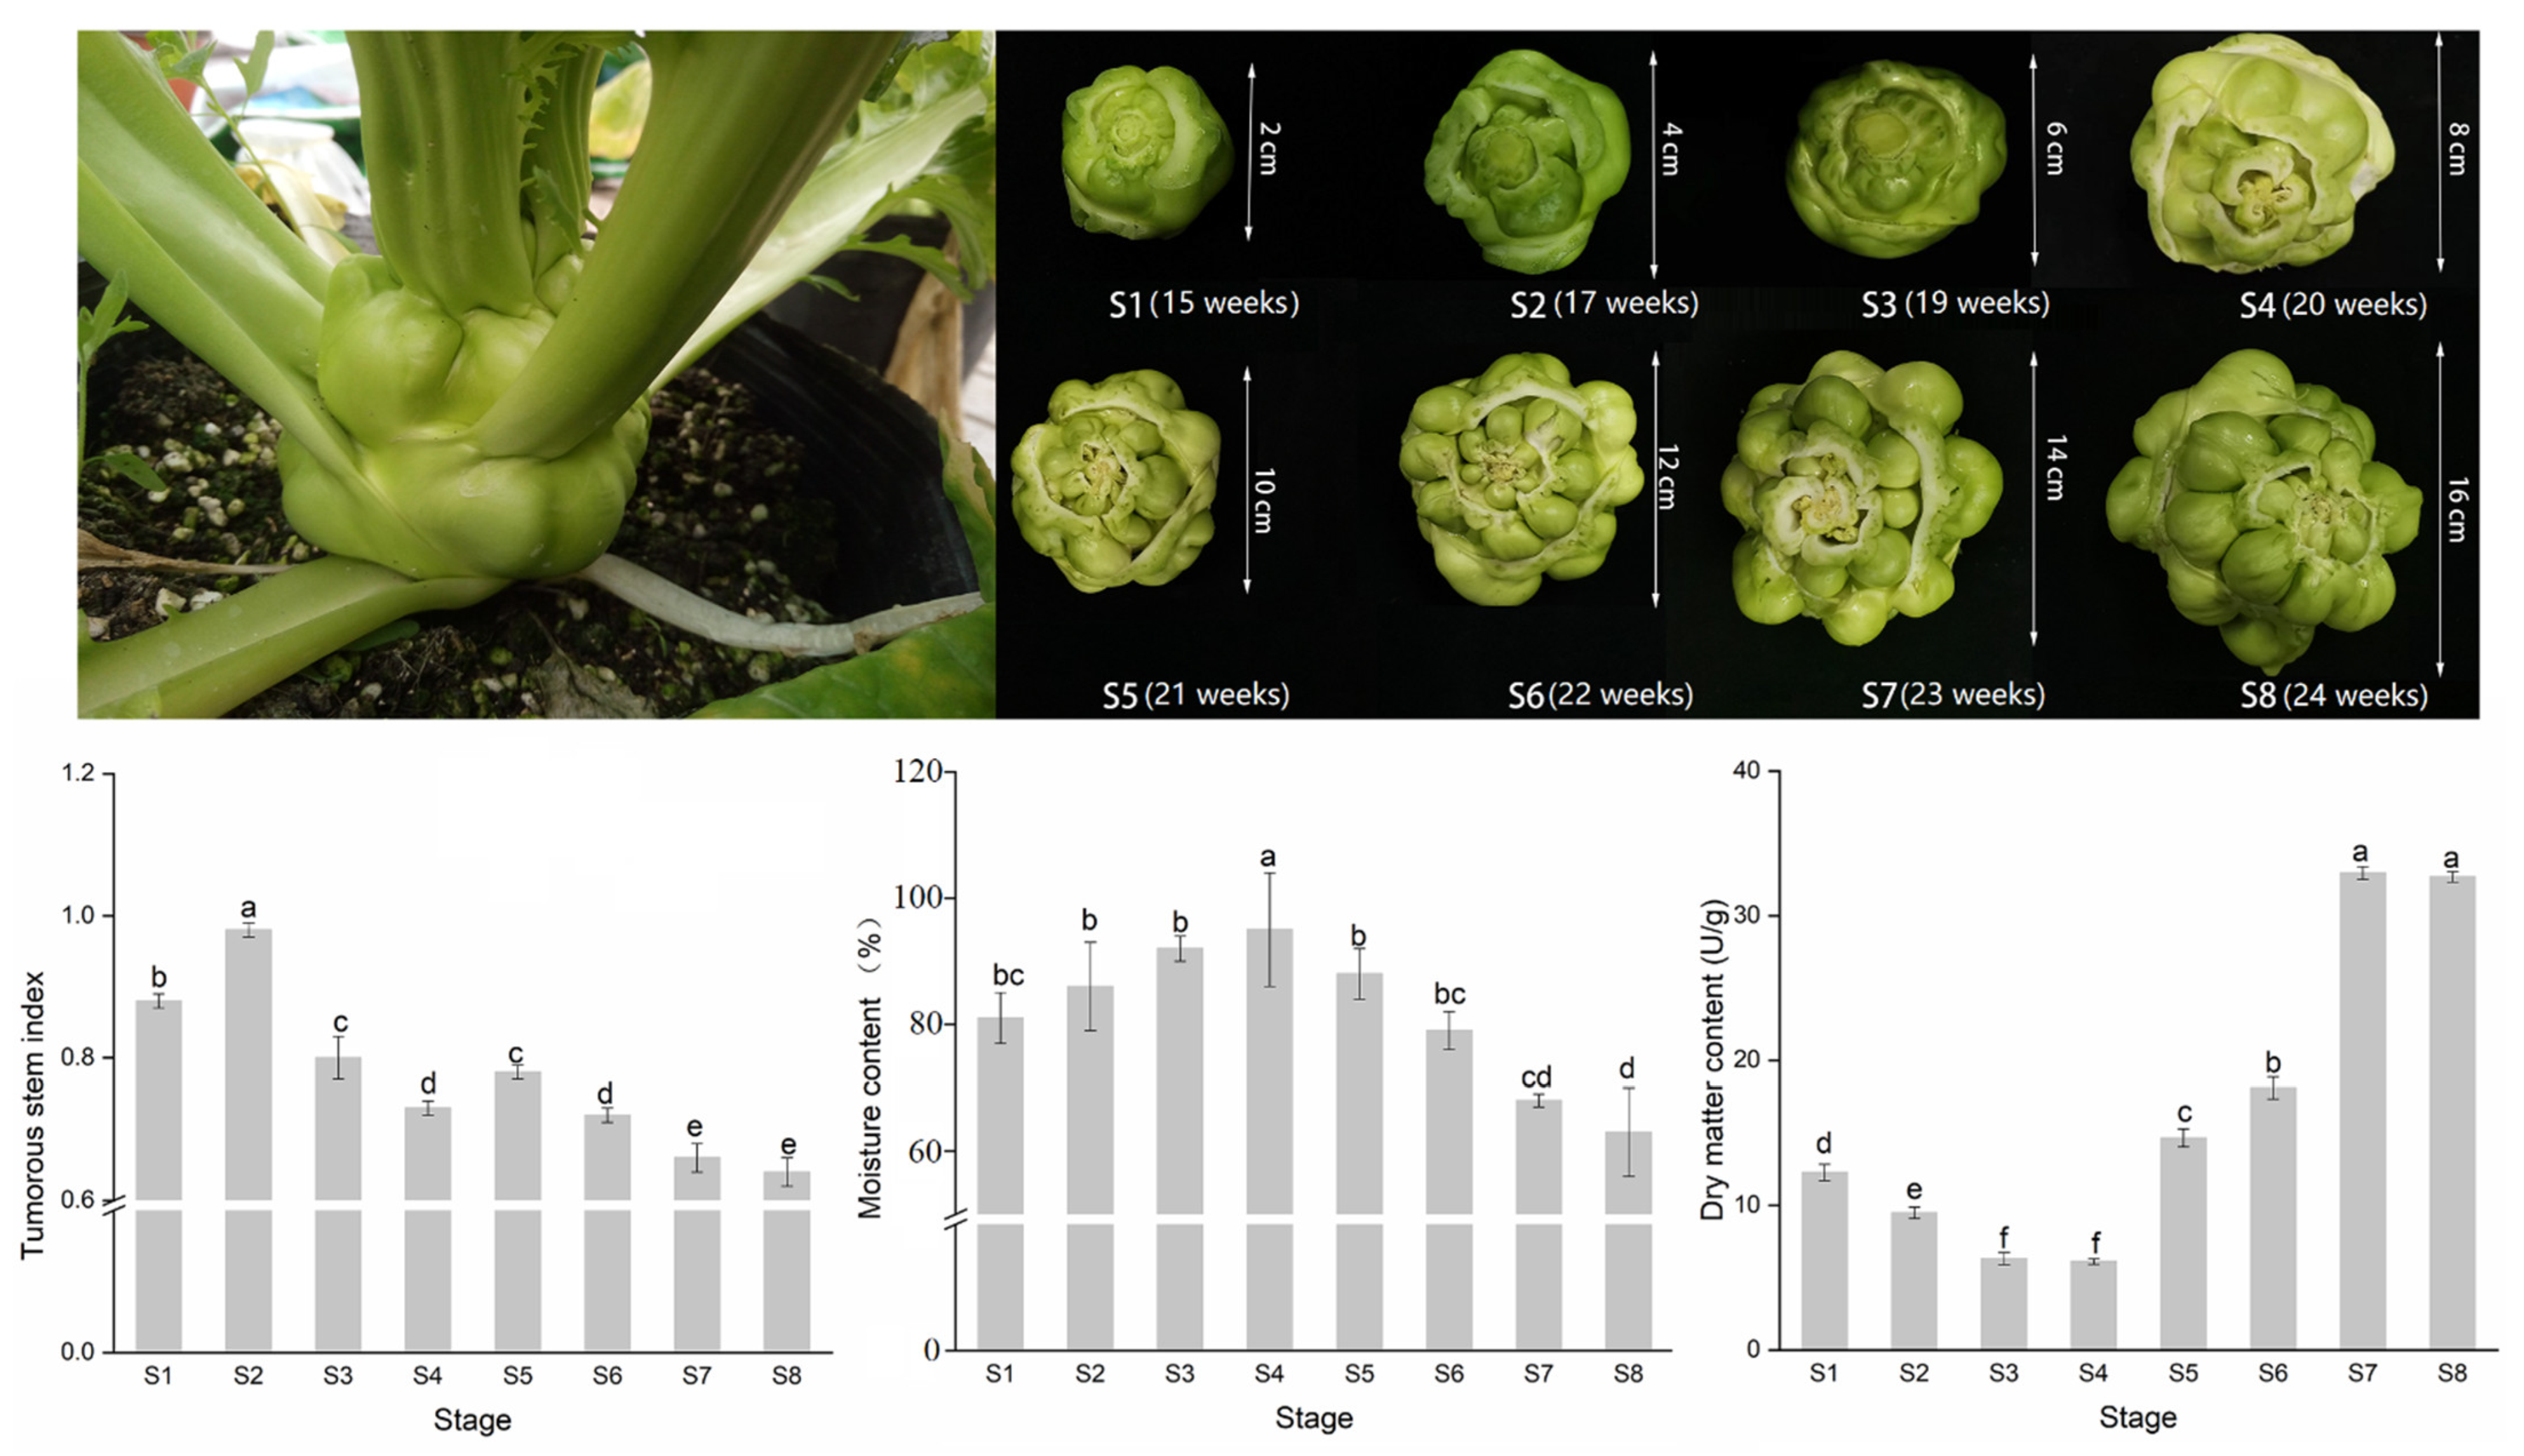
3.1. Morphological and Growth Index Changes during Stem Expansion of Stem Mustard

As shown in Figure 1, variations in the tumorous stem index during the early stages of stem mustard development were more obvious, which first increased and then decreased from S1 to S4 and exhibited small variations and decreased from S4 to S8. This finding indicates that the shape of the tumorous stem was suborbicular at the early stage of expansion and gradually became oblate after development, which was consistent with the previous studies [34,35]. The moisture content increased from S1 to S4 and peaked at 95% at S4. The moisture content gradually decreased from S4 to S8. Dry matter content in the later stages of stem development was three-fold higher than in the early stages. It is widely thought that assimilation products may be mainly used for cell division, cell expansion, and stem morphology during the early stage of development. Thus, the accumulation of dry matter was low. The assimilated products accumulated more, and the dry matter content significantly increased in the later stages, because the stems were formed and the volume increased less.

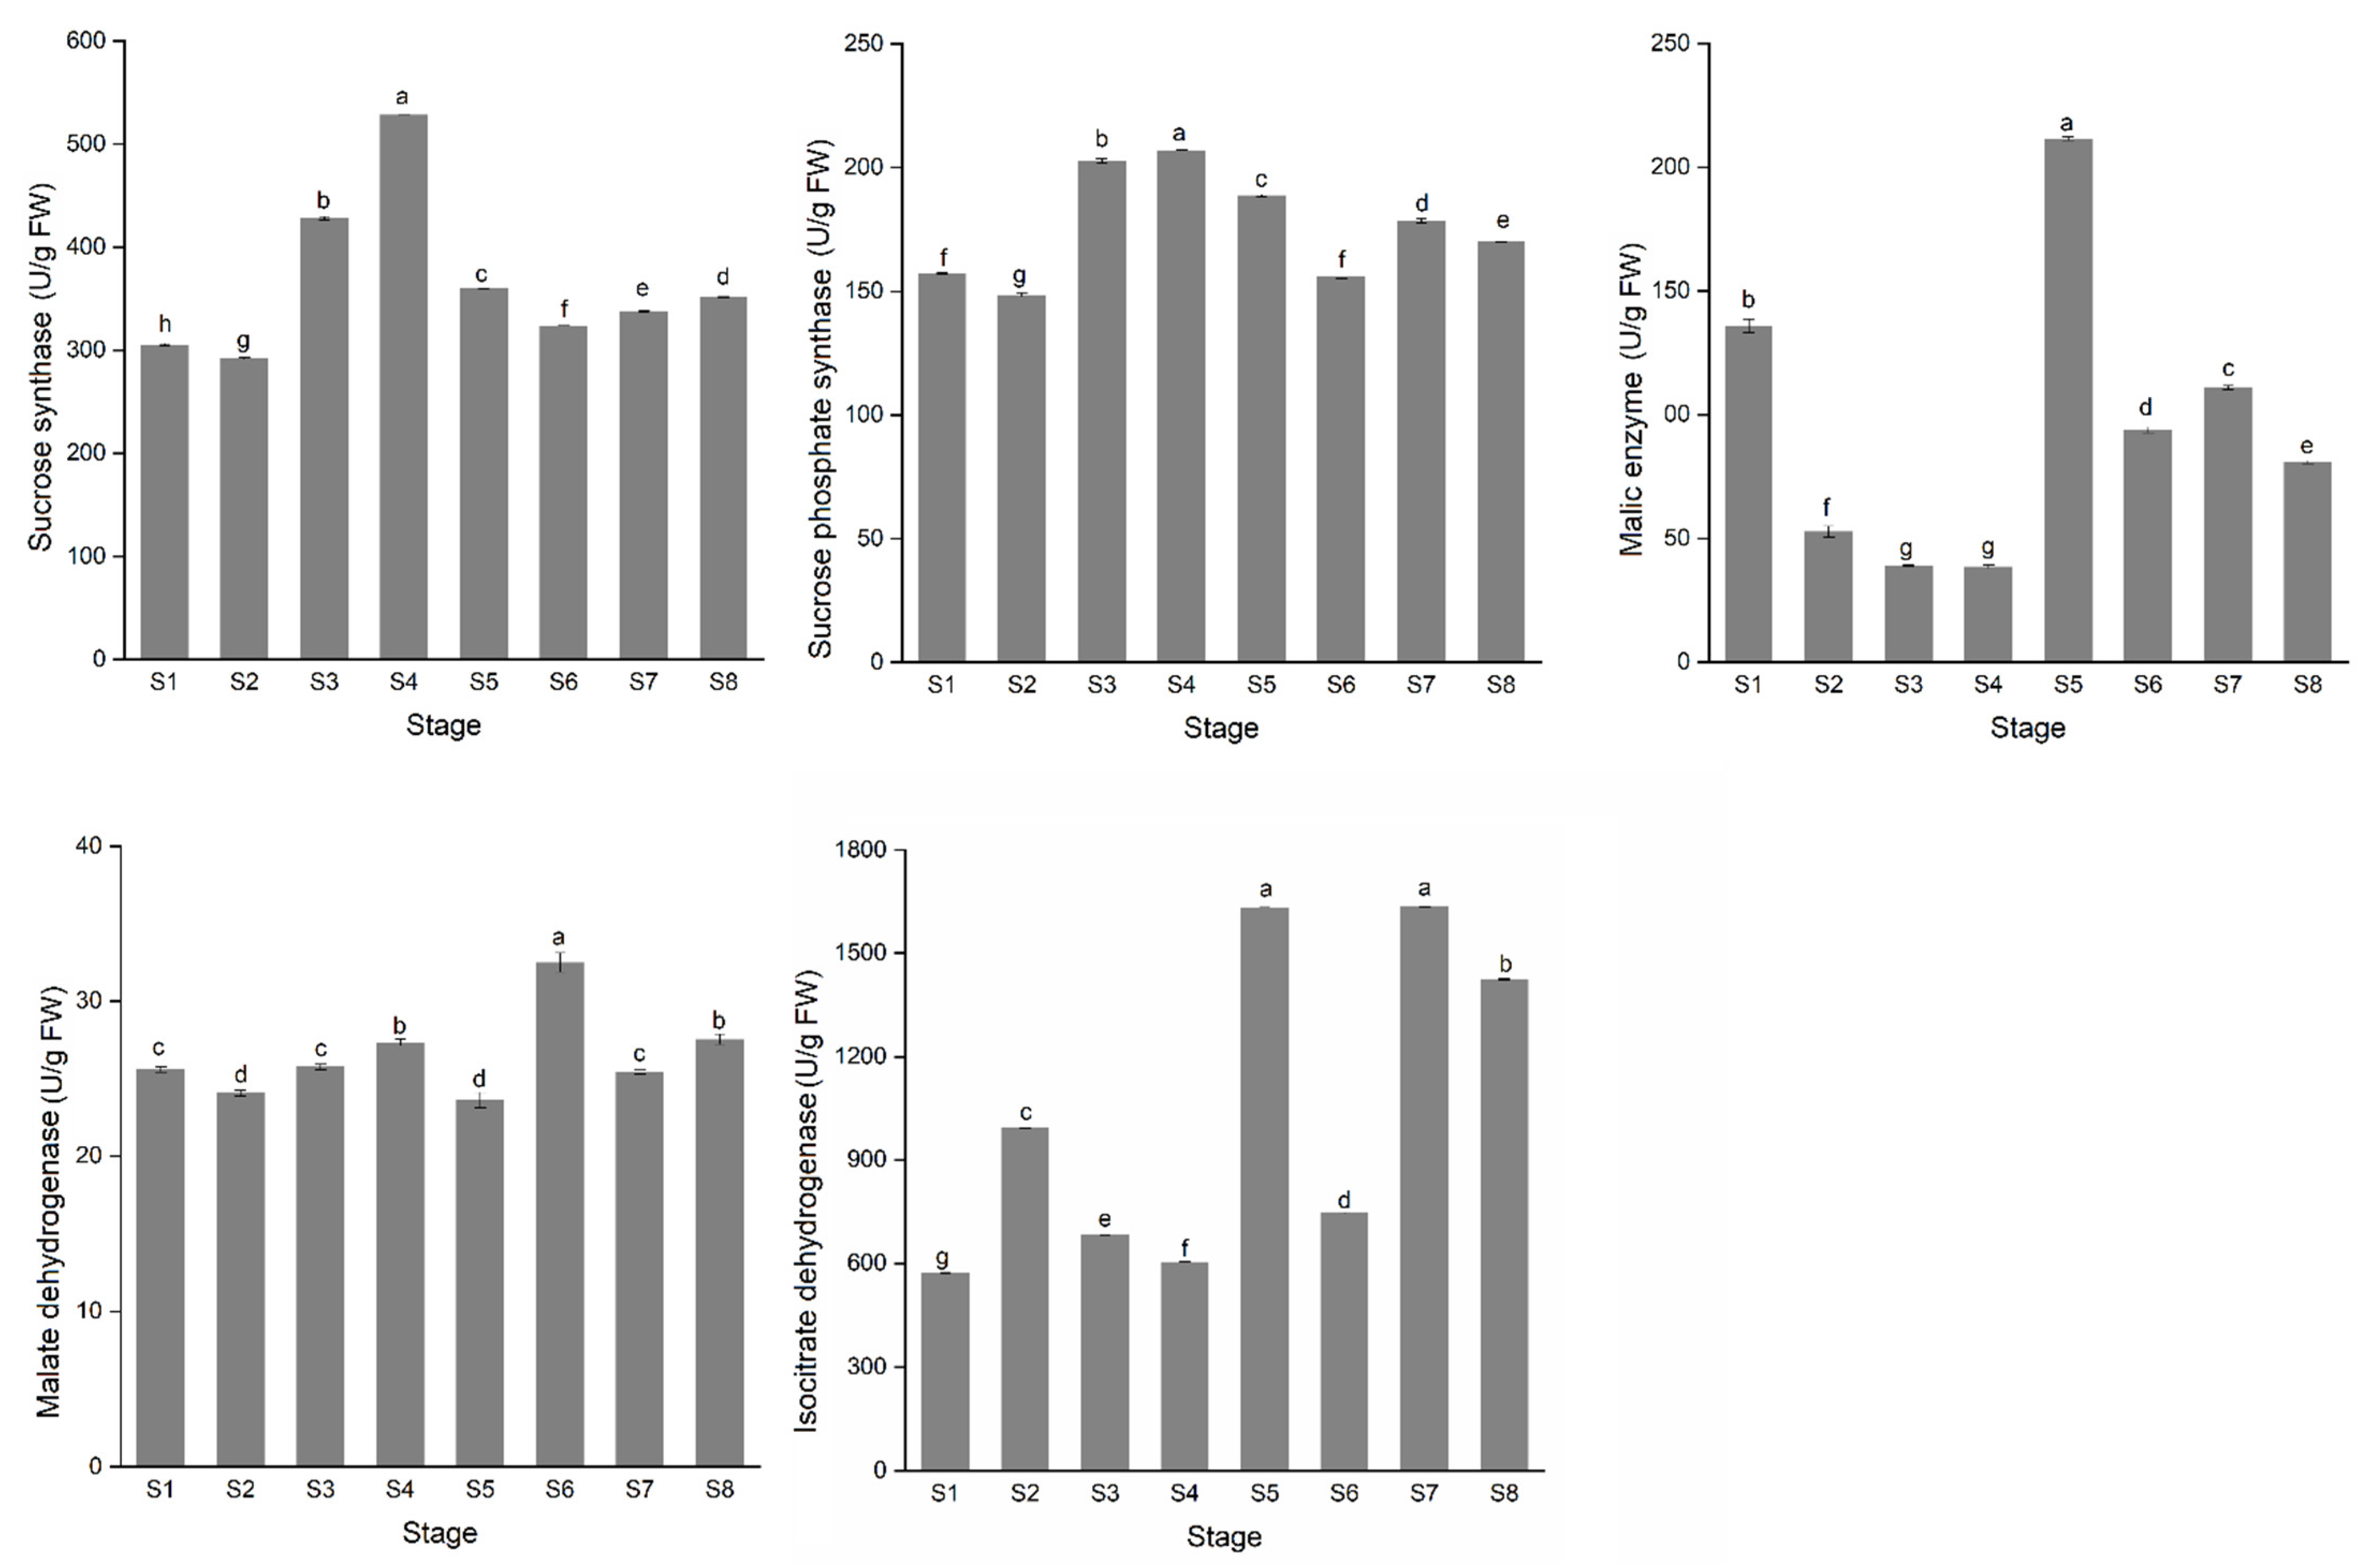
3.2. The Variation of Sugar and Acid Content during Stem Development

The trends in soluble sugar and sucrose contents were more consistent during the development of stems and initially increased, followed by a decrease. Fructose and glucose contents were lower, with glucose showing a gradually increasing trend overall, and fructose initially decreased and then increased (Figure 2). The most rapid increase in sucrose content was observed from S2 to S3, rising by 10.33 mg/g. Soluble sugar and sucrose content reached their highest levels during S4 (30.77 and 17.49 mg/g, respectively) and declined rapidly during S4 to S5 (by 11.95 and 11.85 mg/g, respectively). The titratable acid content of stems did not significantly change from S1 to S4, reaching a nadir at S5 and peaking at S6 at 34.10 mg/g. It is well-established that the sugar–acid ratio is an essential factor influencing the flavor quality of stem mustard. We found that sugar–acid ratio exhibited an increasing trend from 32% to 117% from S1 to S4 of the stem and gradually decreased from S4 to S8. The sugar–acid ratio of tuberous stems was at a low level at maturity, consistent with the special sour taste of squash [36].

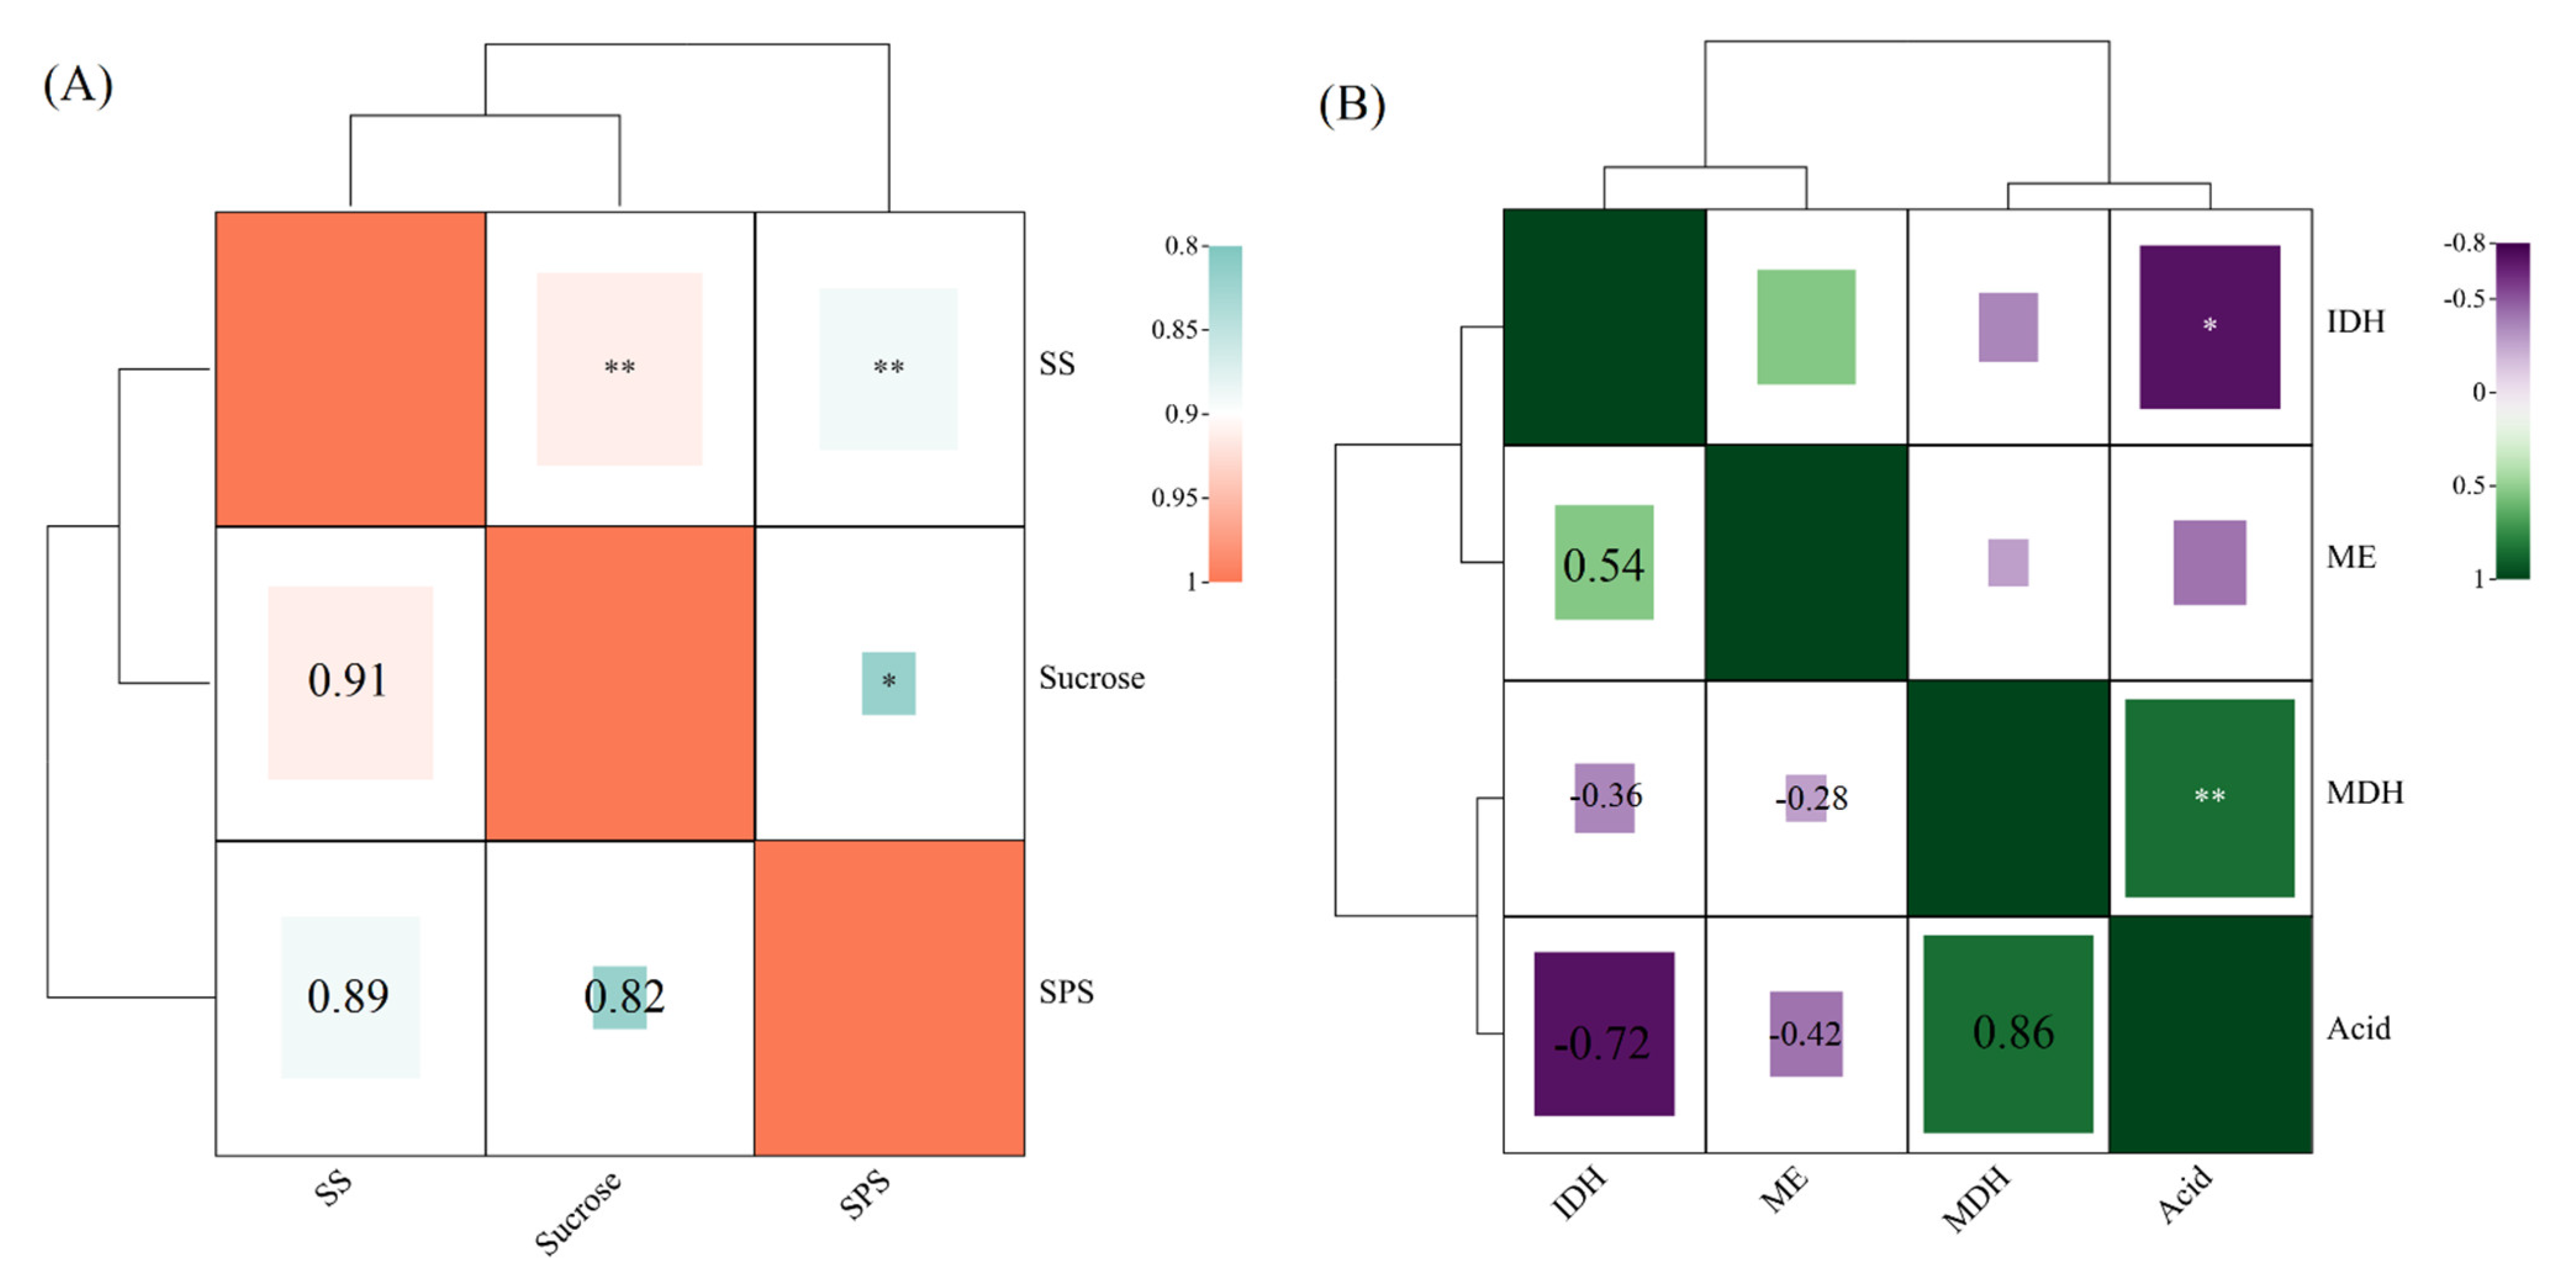
3.3. Analysis of the Correlation between Sugar and Acid Metabolizing Enzymes during the Development of Stem

Among the sugar and acid-related enzymes, SS, SPS, MDH, and IDH have high activities, while ME has low activity (Figure 3). The activities of SS and SPS, which are related to sucrose content, both exhibited an increasing trend during stem development. From S1 to S4, SS and SPS activity increased and then decreased, consistent with the trend in sucrose content, indicating that SS activity during synthesis was higher than during catabolism, and catalytic sucrose synthesis activity was higher than catalytic sucrose catabolism during this period. From S6 to S8, both SS and SPS activity increased, while the sucrose content decreased to lower levels, indicating that SS activity was increased and decreased during catabolism and synthesis, respectively. After correlation analysis, it was concluded that SS was positively correlated with sucrose content, SPS was moderately positively correlated with sucrose content, and SS was positively correlated with SPS activity with correlation coefficients 0.911, 0.817, and 0.889, respectively (Figure 4). The titratable acid content in the stem was highly positively correlated with MDH activity and negatively correlated with ME activity, with correlation coefficients of 0.851 and −0.423, respectively. The titratable acid content in stems was negatively correlated with IDH activity (correlation coefficient −0.724).

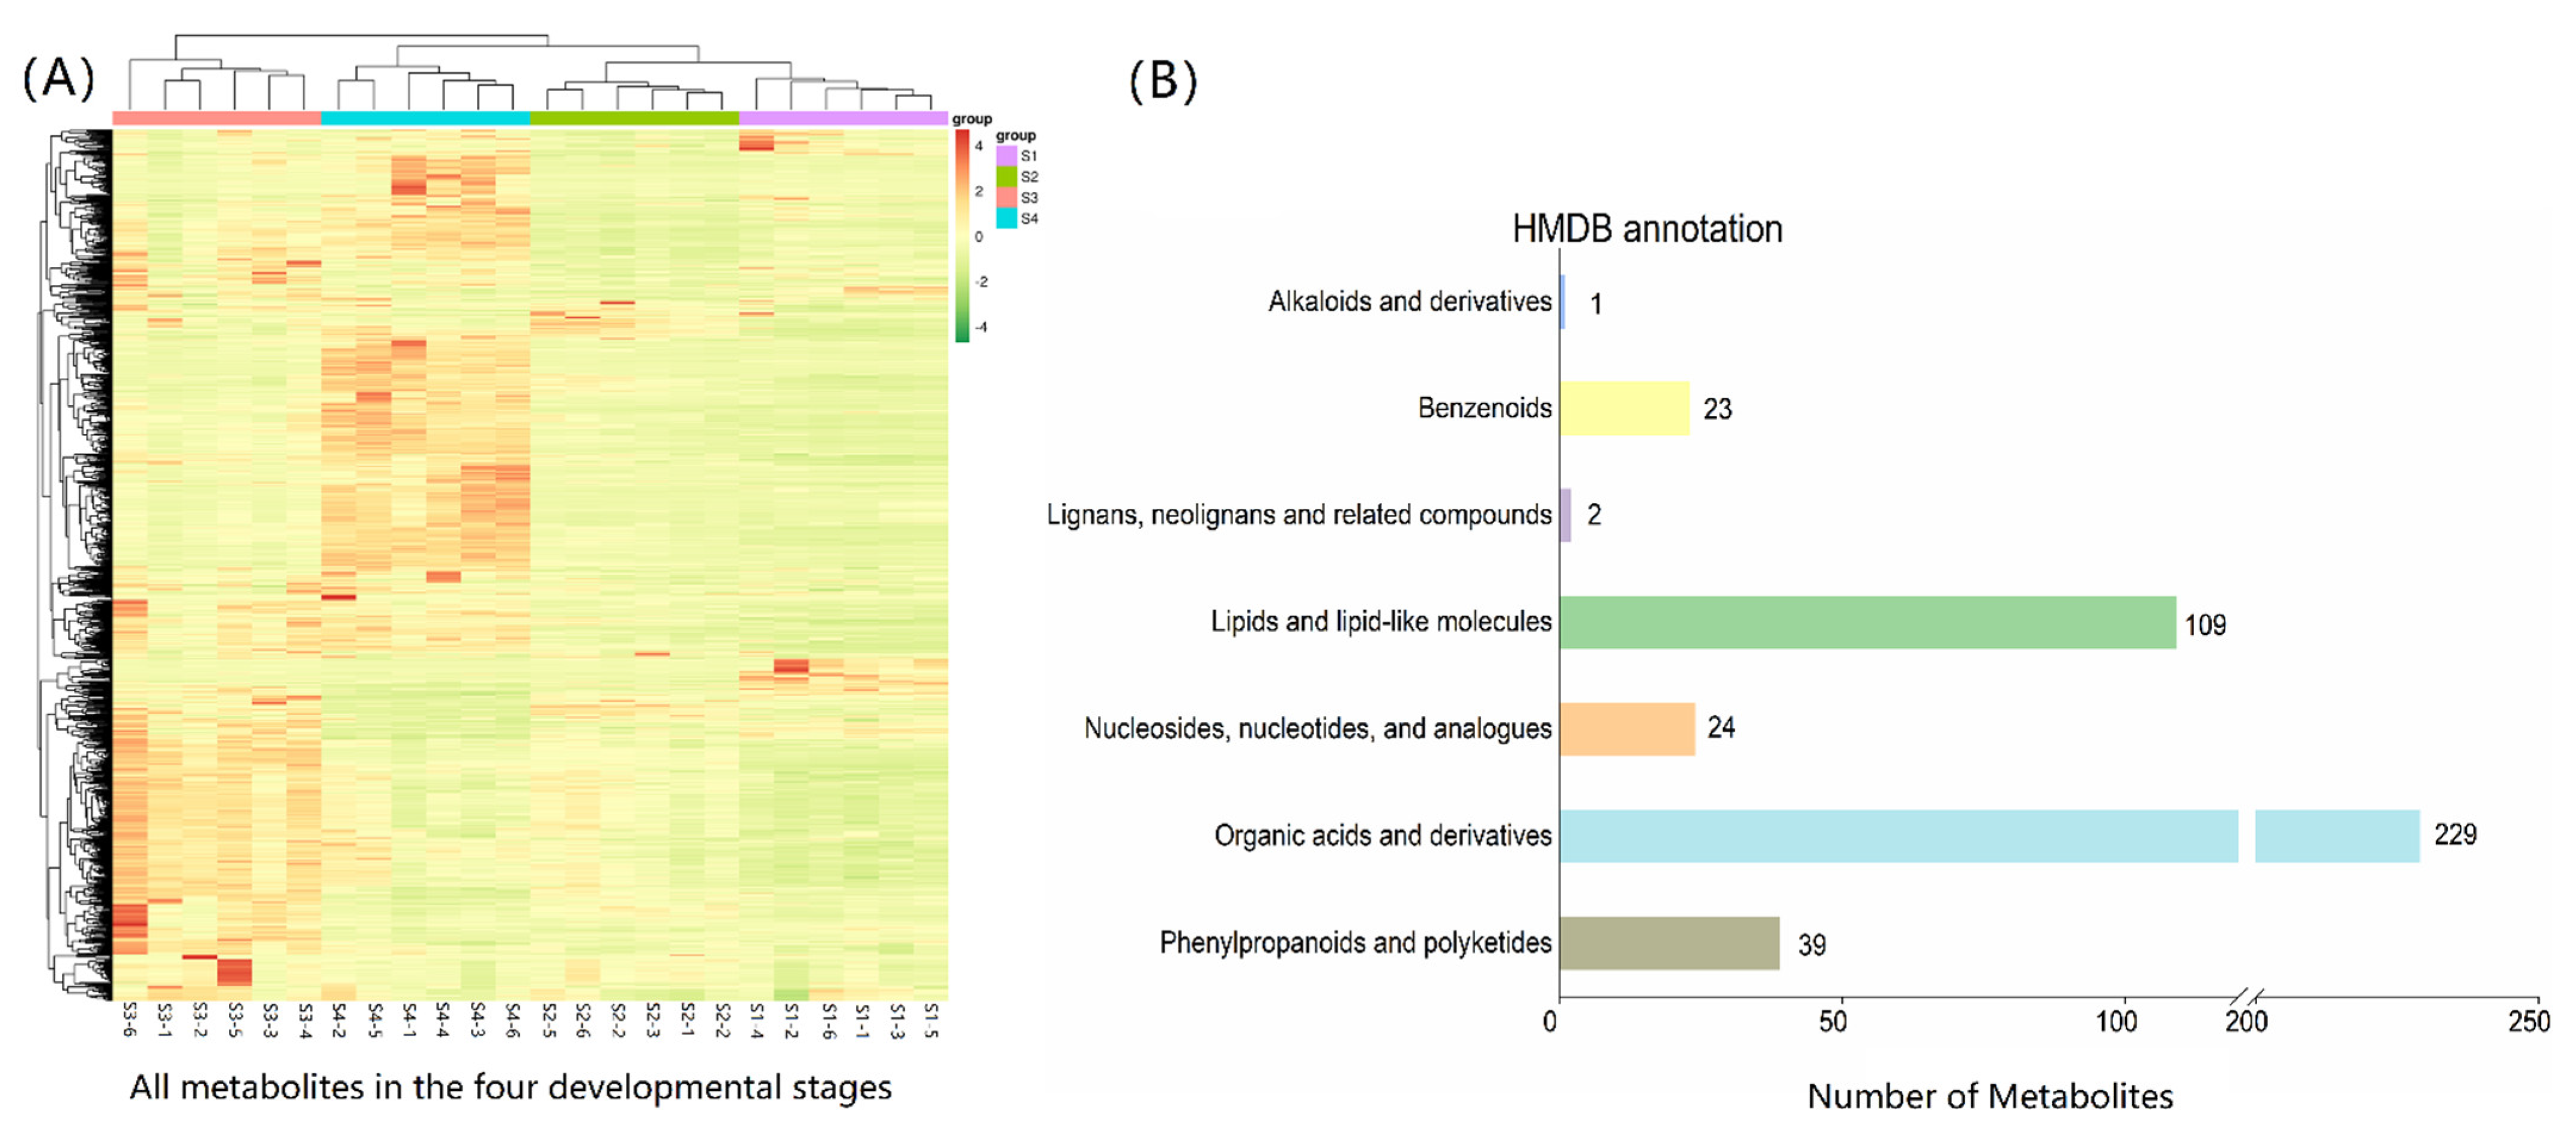
3.4. Analysis of Metabolite Levels

3.4.1. Metabolic Data Evaluation

Metabolomic analysis was used to assess the significance of variations in physiological indicators of the tumorous stem during S1–S4. The results of the QC sample spectra comparison among a total of 24 tested samples from 4 stages (S1, S2, S3, and S4 stages) of stem mustard with different developmental periods showed that the corresponding intensities and retention times of the peaks largely overlapped under positive and negative ion patterns (Figures S1 and S2). QC samples exhibited a clustered distribution on the PCA analysis plot and were clearly separated for four developmental stages. The replicates were tightly clustered, thus indicating the reliability of the experiment (Figure S3). The sample points between S1 and S4 were distant, indicating large differences in metabolites in the correlation samples.

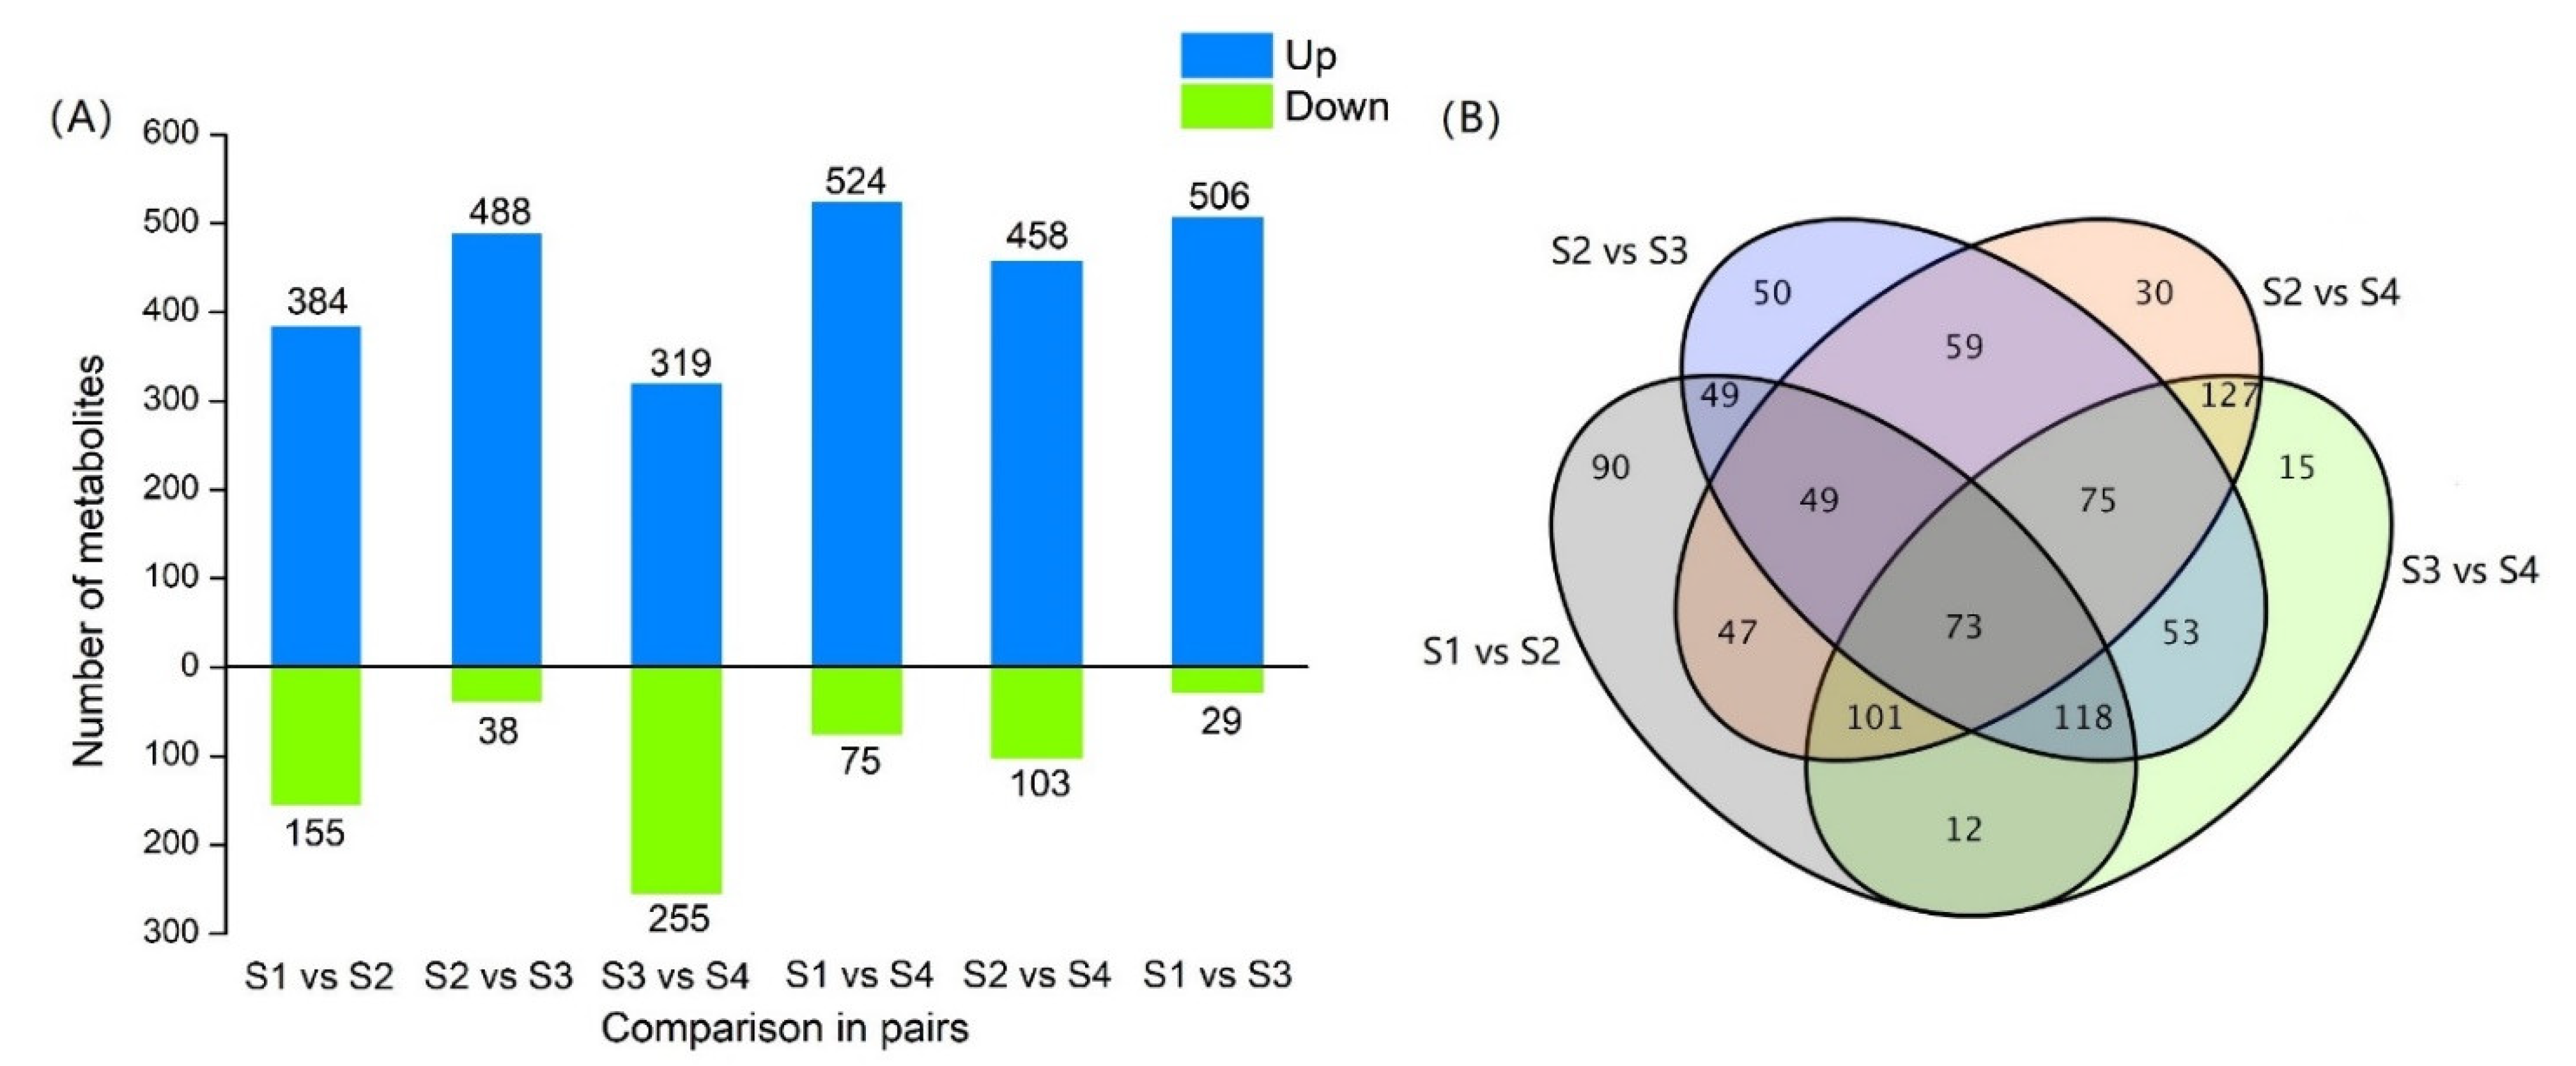
3.4.2. Analysis of Differential Metabolites

Based on untargeted metabolomic techniques, 1097 metabolites were detected in stem mustard samples from the four developmental stages (Table S2). Hierarchical clustering analysis of the 1097 metabolites from the four developmental stages showed a clear clustering pattern (Figure 5A). The most downregulated metabolites were found in S1 and S2 (green), and the most up-regulated metabolites were found in S3 and S4 periods (red). According to the HMDB database, the 427 metabolites were classified into seven categories (Figure 5B), including “organic acids and derivatives” (229 metabolites), “lipids and lipid-like molecules” (109 metabolites), and “phenylpropane and polyketide compounds” (39 metabolites), nucleosides, nucleotides, and analogs (24 metabolites), and lignans, neolignans, and related compounds (2 metabolites).

3.4.3. Analysis of Differential Metabolites

To identify metabolites related to stem development, the four developmental stages were compared between groups, and the standards for classification were FC > 1, p-value < 0.05, and VIP > 1. In the four developmental stages, metabolites were significantly different from each other (Figure 6A), and comparison of S1 vs. S4 periods yielded the greatest number of differential metabolites (n = 599, 524 upregulated and 75 downregulated), followed by S3 vs. S4 stages (n = 574, 319 upregulated and 255 downregulated). More metabolites were upregulated than downregulated, indicating that most metabolites exhibited high levels at all developmental stages. Visualization of the top 20 upregulated and downregulated metabolites (Table S3) showed that most of them belonged to organic acids and derivatives and phenyl propane and polyketide compounds. Comparisons including S1 vs. S2, S2 vs. S3, S2 vs. S4, and S3 vs. S4 were further conducted to analyze metabolites commonly or exclusively expressed in two or more comparisons (Figure 6B), yielding 90, 50, 127, and 118 differential metabolites, respectively. The intersection of the above metabolites yielded 73 common differential metabolites. This finding suggests that fewer metabolites accumulated during the early stages of stem development and more accumulated during the later stages, and new metabolites may have appeared and accumulated during the later stages.

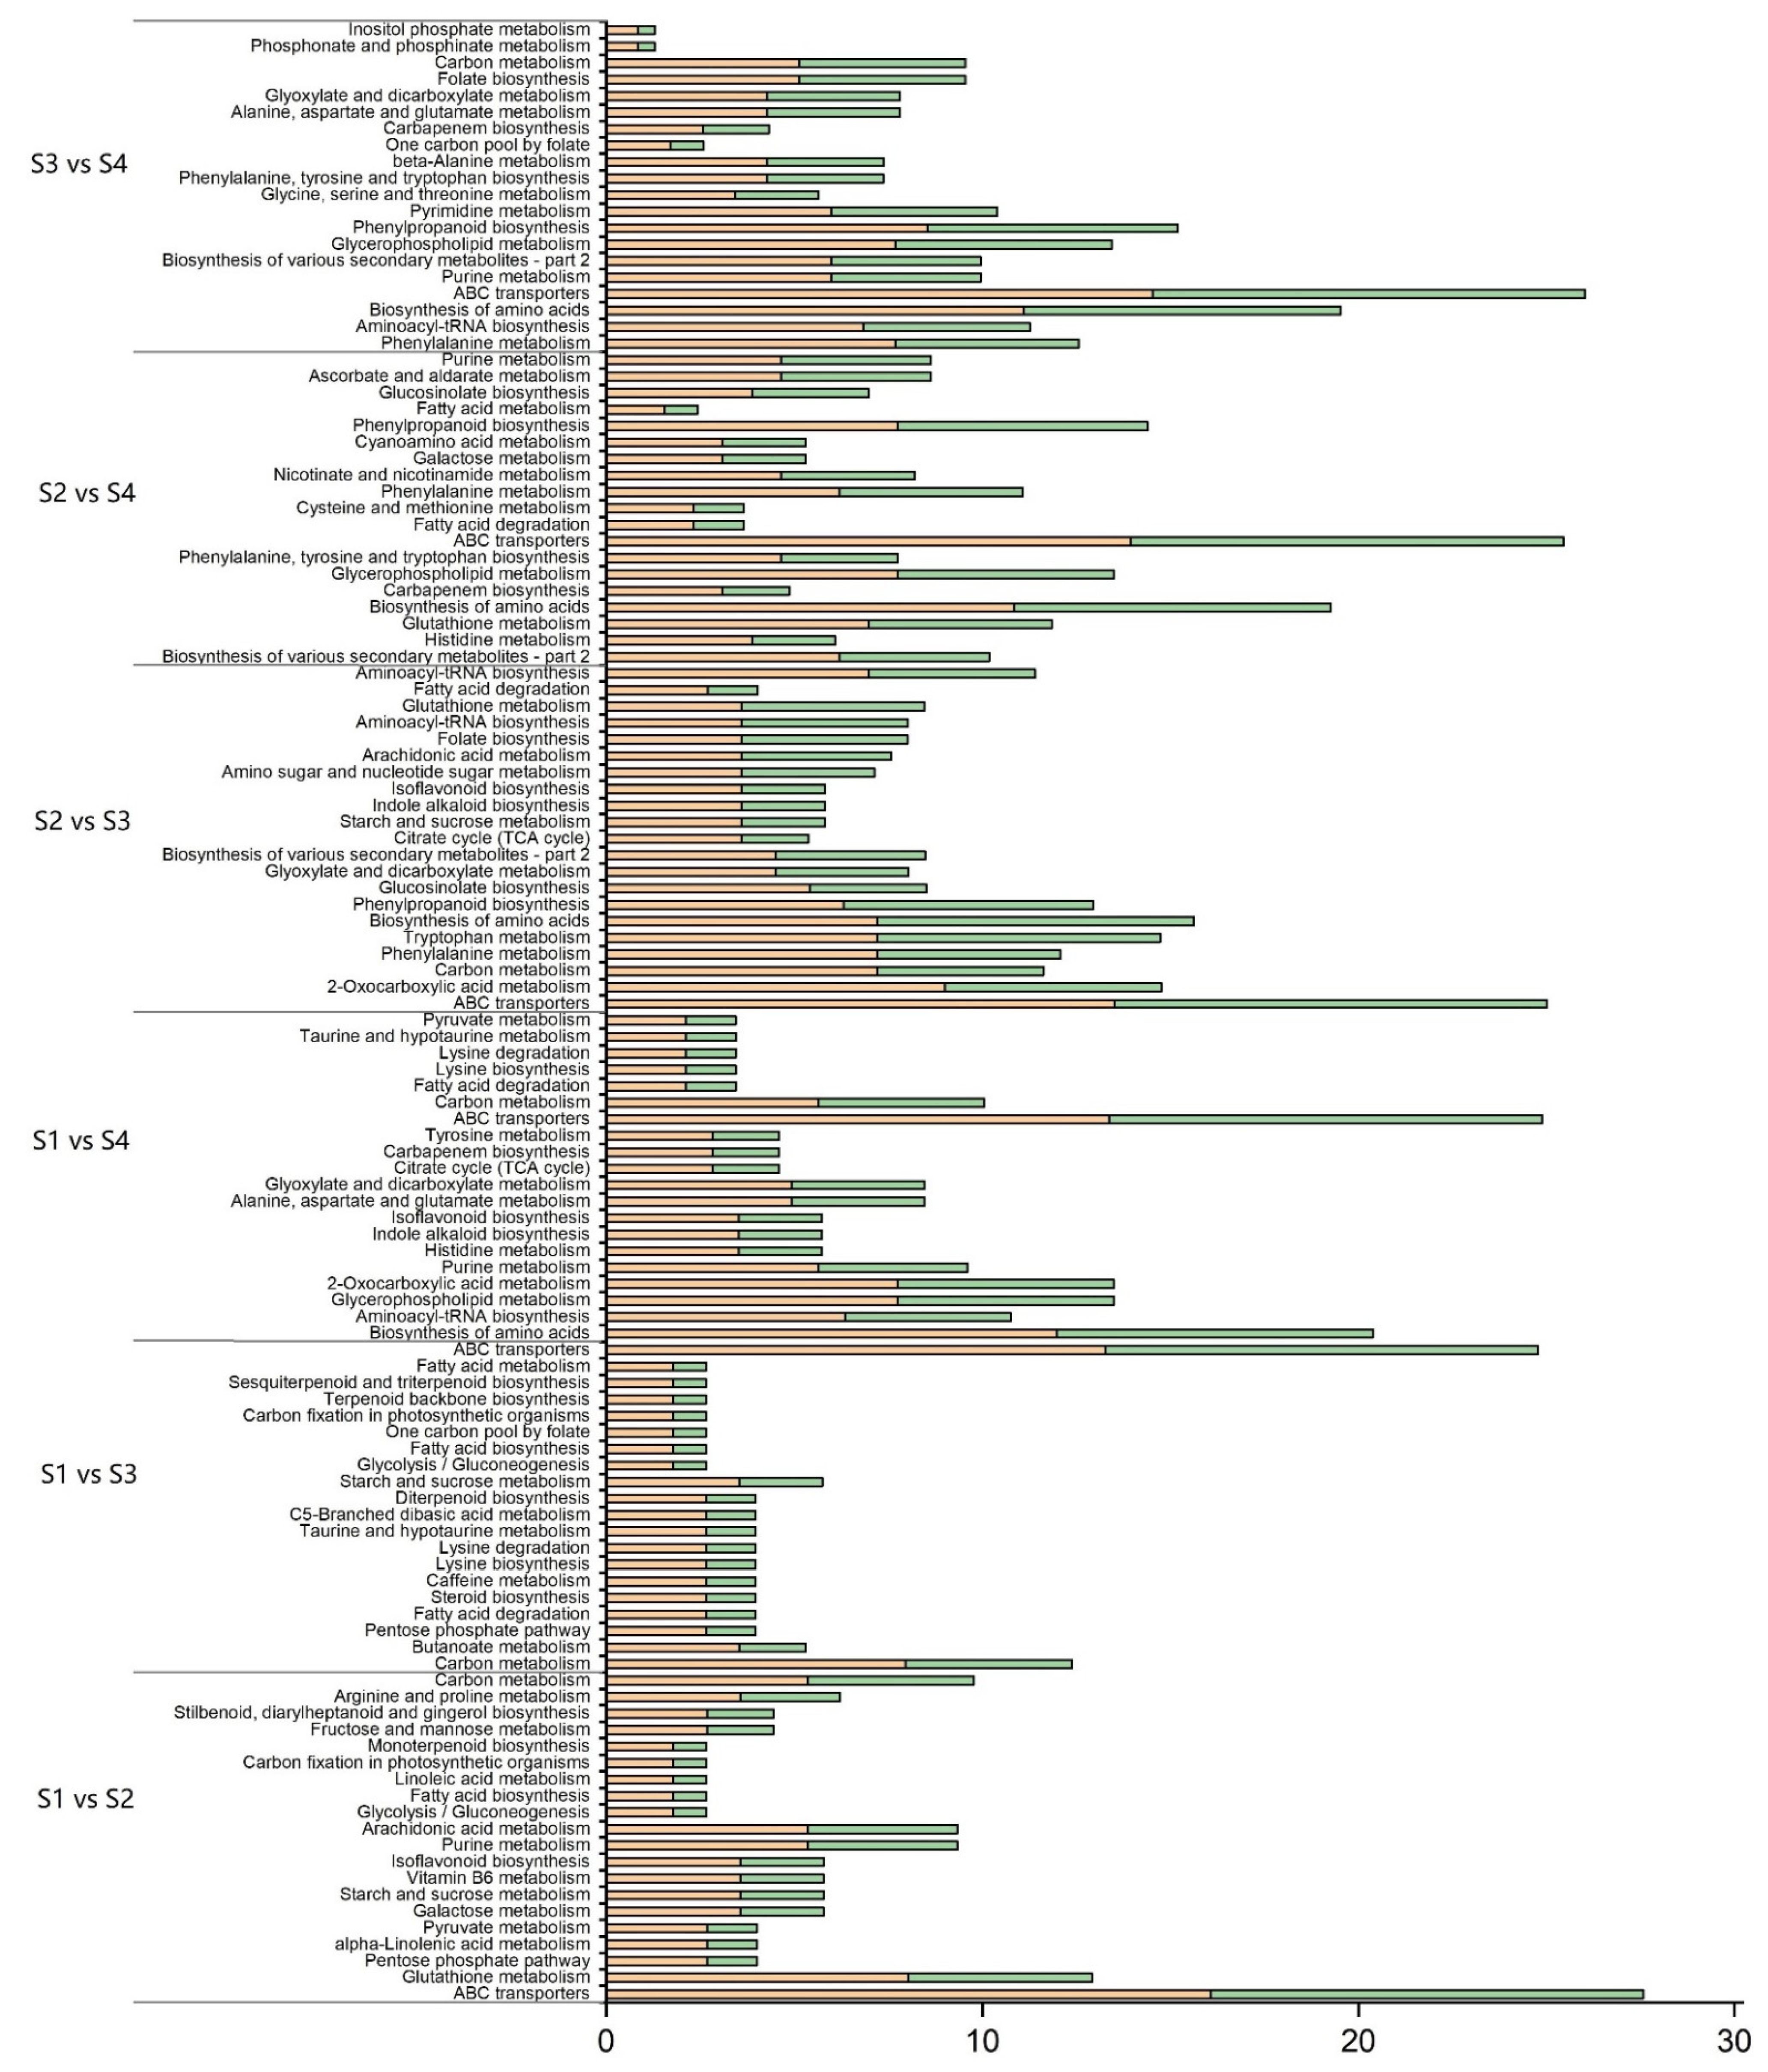
3.4.4. Analysis of Differential Metabolite Pathways

KEGG pathway analysis showed significant enrichment in relevant metabolic pathways (Figure 7 and Table S4). The differential metabolites were involved in 92 metabolic pathways. The results showed four differential metabolic pathways, namely metabolic pathways, the biosynthesis of secondary metabolites, ABC transporters, and the biosynthesis of amino acids, were enriched in 183, 97, 26, and 19 different metabolites, respectively. The most enriched metabolites were found in the top 20 KEGG pathways analyzed in S1 vs. S4 and S2 vs. S4 combinations, containing 139 and 141 metabolites, while S1 vs. S2 and S1 vs. S3 metabolites were less enriched, with 91 and 73 metabolites, respectively. The metabolites involved in sucrose and organic acid metabolism were significantly enriched, such as starch and sucrose metabolism (n = 4 for S1 vs. S2, S1 vs. S3, and S2 vs. S3), glycolysis/gluconeogenesis (n = 2 for S1 vs. S2 and S1 vs. S3). The TCA cycle was enriched in 4 metabolites (S1 vs. S4 and S2 vs. S3), and galactose metabolism was enriched in 2 metabolites (S1 vs. S2 and S2 vs. S4). Most importantly, carbon metabolism was enriched in 4, 9, 8, 8, and 6 metabolites when comparing S1 vs. S2, S1 vs. S3, S1 vs. S4, S2 vs. S3, and S3 vs. S4, respectively. The above findings demonstrated that sugars, organic acids, and amino acids were the major metabolites, among which amino acids provided the basis for protein synthesis, free amino acids provided a nitrogen source for plant growth and development, carbon metabolism accelerated photosynthetic reactions, and soluble sugars were not only substrates for starch synthesis but also regulated the growth and development of tumorous stem.

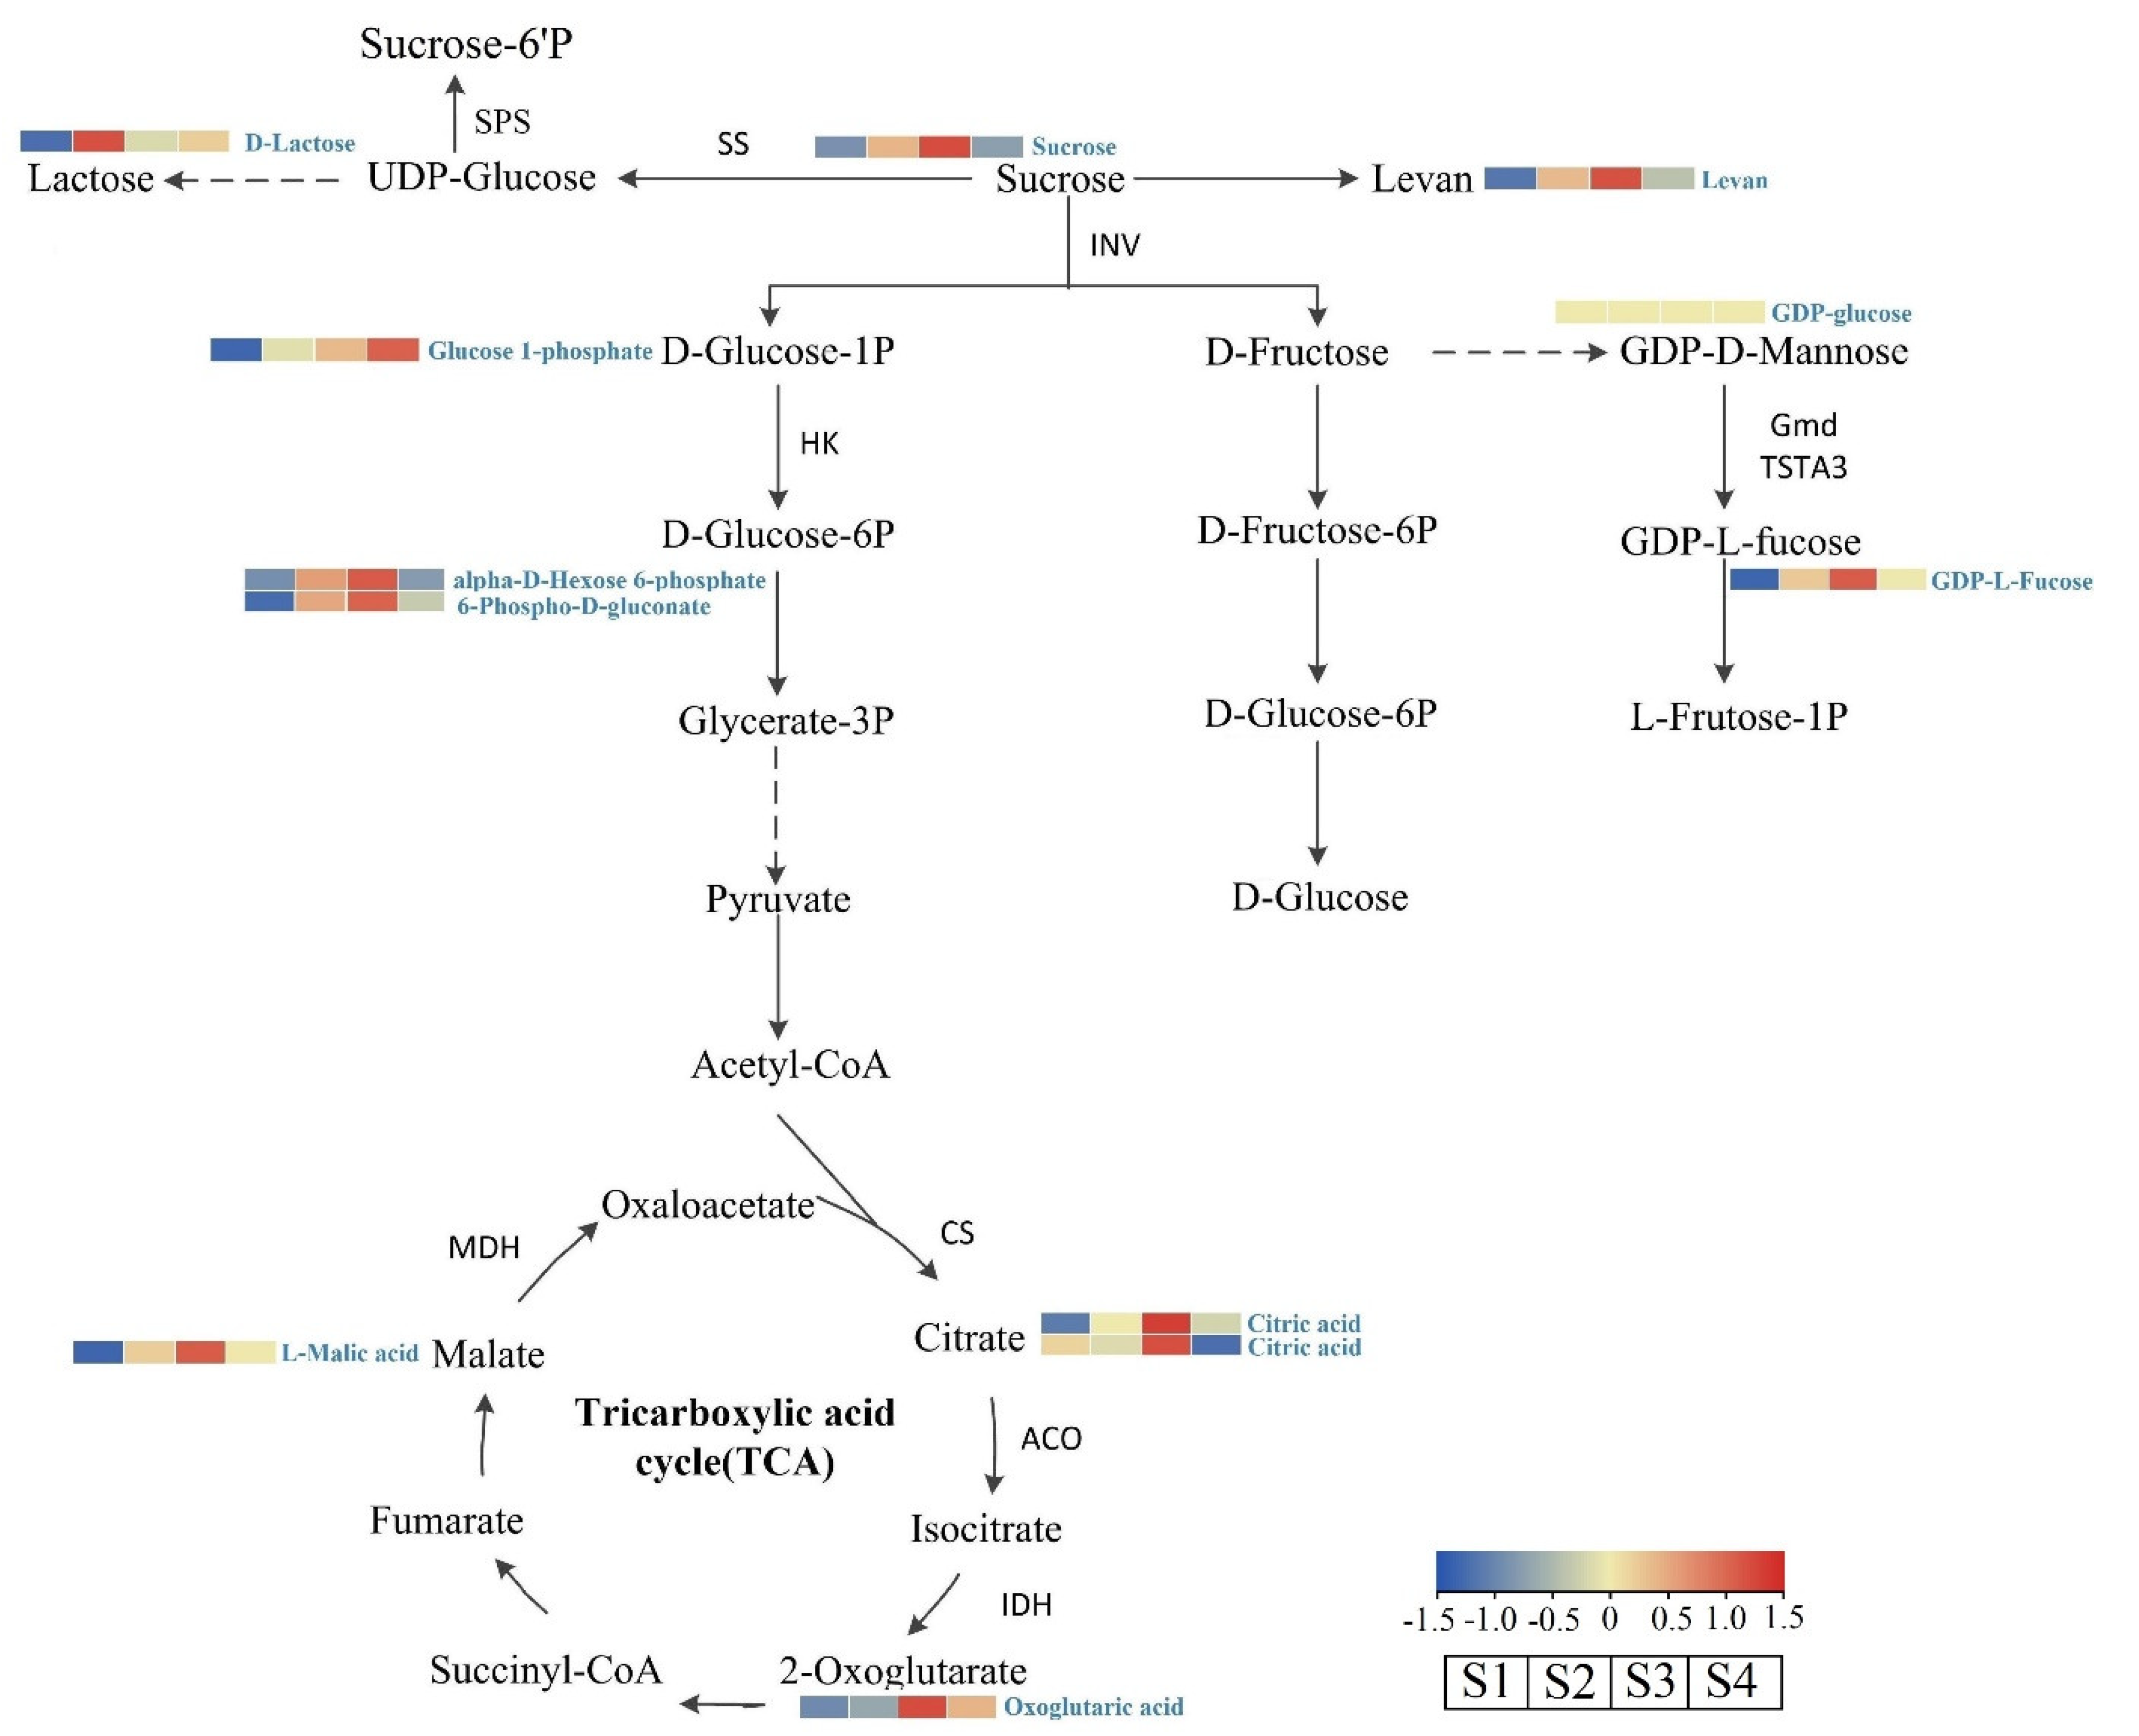
3.4.5. Analysis of Metabolites Related to Sugar and Acid Biosynthetic Pathways

The accumulation levels of sugar and acid-related metabolites were evaluated given that the sucrose biosynthesis pathway and the TCA cycle enriched with differentially accumulated metabolites. A total of 12 primary metabolites were associated with sugar and acid synthesis (Figure 8 and Table S5), of which 8 were related to sugars and 4 to acids. The expression levels of most metabolites in biosynthesis pathway of sugar and TCA cycles in the four developmental stages peaked during S3 and S4. For example, the accumulation of levan, sucrose, and alpha-D-hexose 6-phosphate in the starch and sucrose metabolism first increased and then decreased, with accumulation in the S3 stage being 6-, 2-, and 2-fold higher than in the S1 stage, respectively. The accumulation of L-malic acid, citric acid, and oxoglutaric acid was the highest in S3, which were 2-, 1.5-, and 2.2-fold higher than in S1. GDP-L-Fucose accumulation in S1 was 18.6-fold higher than in S3. D-Mannitol levels were the highest in the S4 period, with 9-fold higher levels than in S1.

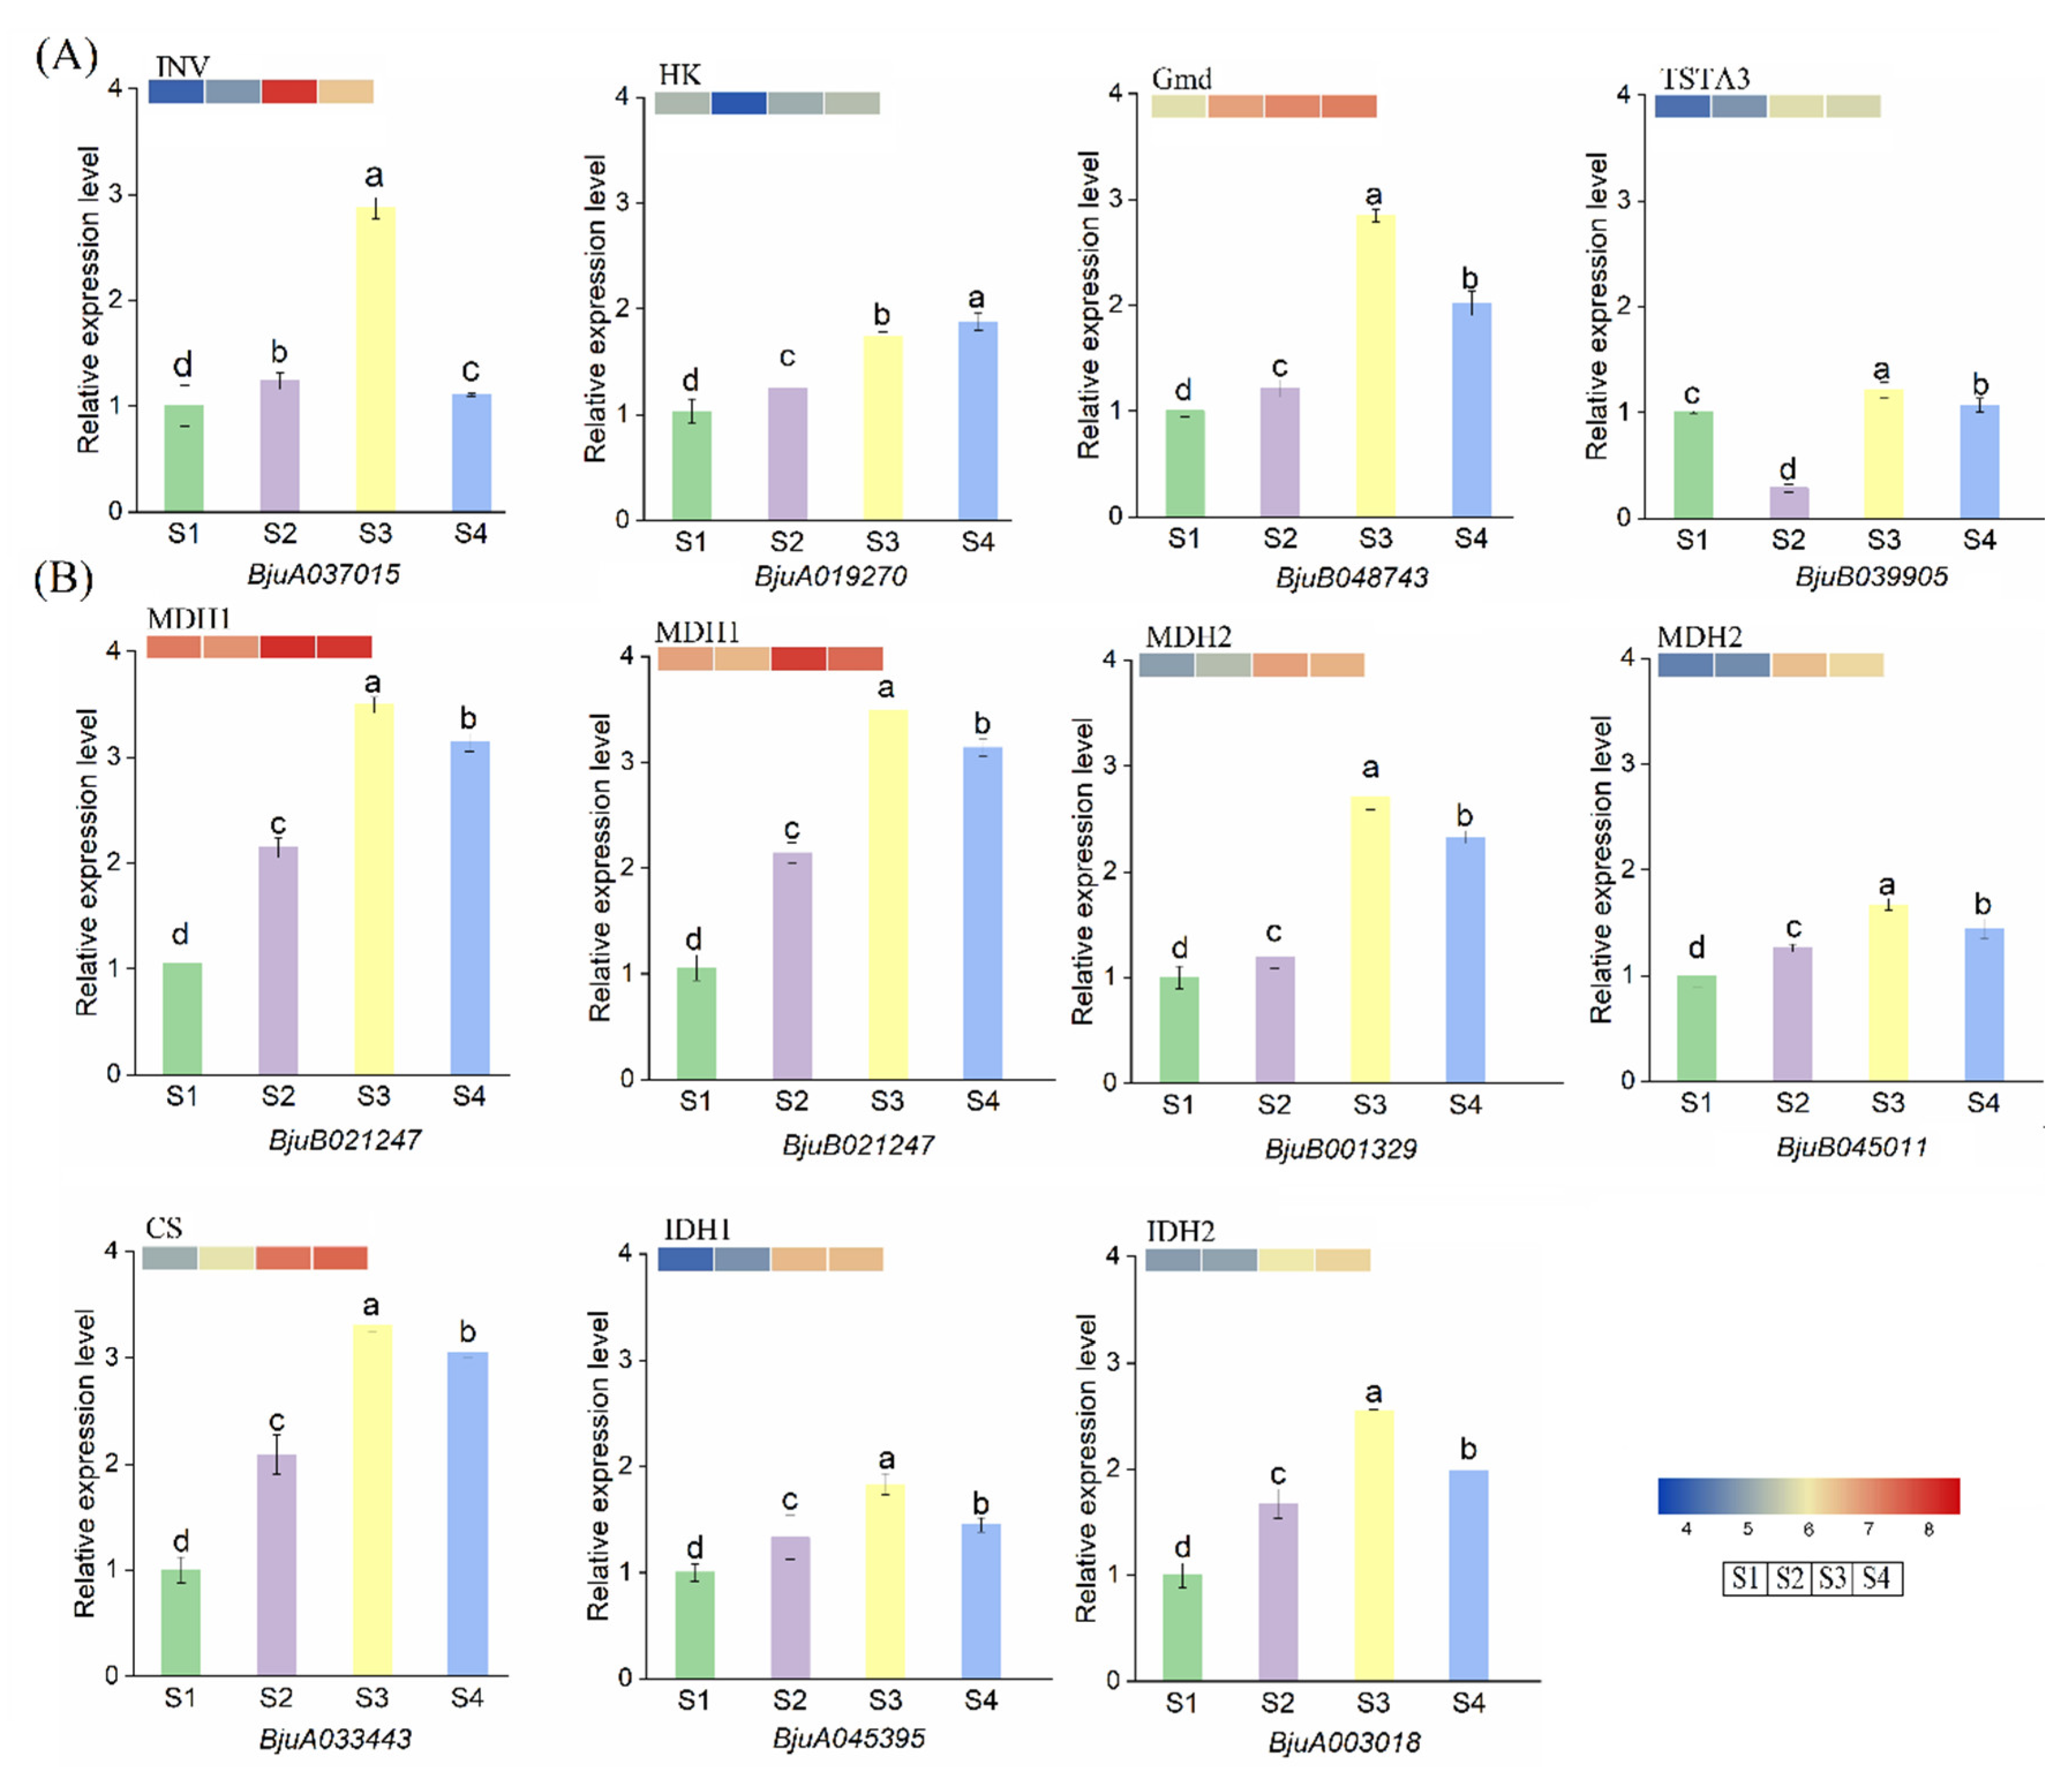
3.5. The Expression Level of Genes Related to Sugar and Acid Biosynthesis Pathway by qPCR

The role of genes involved in sugar and acid accumulation was revealed using qPCR to analyze the mRNA levels. As shown in Figure 9, the results showed that most of the genes were in agreement with the transcriptome data, and all showed an initial increase followed by decrease, with higher expression in S3 and S4 stages than S1 and S2 stages. Among the sugar-related enzyme, it seems that the relative expression of INV (BjuA037015) and Gmd (BjuB048743) is similar in S1, S2, and S4. HK (BjuA019270) expression is similar in S1 and S2 and in S3 and S4. In the sucrose and starch synthesis pathway, INV (BjuA037015), as the first enzyme gene in the sucrose catabolic pathway, had 2.8-fold higher expression levels in S3 than in S1. Both Gmd (BjuB048743) and TSTA3 (BjuB039905) genes showed the highest expression in the S3 stage after the sudden decrease in the S2 stage, which was 2.—and 1.2-fold higher than the S1 stage. In the TCA cycle, the relative expression levels of MDH1 (BjuB021247 and BjuB001329), MDH2 (BjuA019013 and BjuB045011), CS (BjuA033443), IDH1 (BjuA045395), and IDH2 (BjuA003018) showed a similar trend and were highest in the S3 stage. This finding suggests that the expression of these 11 key enzyme genes is consistent with the accumulation of sugar and acid metabolites.

4. Discussion

The tumorous stem is the edible product of stem mustard, and its growth and development can directly determine the yield and quality of stem mustard [32]. Changes in important physiological processes can significantly affect stem development, and studying these physiological processes is a prerequisite for improving stem mustard yield. Current evidence suggests that sugars and acids are the basic raw materials for organ quality components and flavor substances of horticultural products, as well as for plant life activities, and also provide osmotic propulsion for cell expansion [37]. In this respect, glucose, fructose, and sucrose are their main soluble sugar components, and their content and composition play a critical role in the development and quality formation of product organs [38]. The process of sugar and acid metabolism is complex, and their accumulation levels are regulated by a combination of related enzymes and their structural gene expression [39]. In this study, the horizontal diameter, vertical diameter, and volume were significantly increased, and the moisture content was slightly elevated during the early stage of the development of tumorous stems. The changes in the tumorous stems during this stage provide an important basis for the formation of yield and quality of stem mustard. The soluble sugar and sucrose contents first increased and then decreased with the expansion of the tumorous stems, while the fructose and glucose contents were lower, and fructose tended to decrease and then increase. The titratable acid content in tumorous stems was higher from S1 to S4 and lowest during S5. Moreover, SS and SPS activities initially increased and then decreased, while malate enzyme activity first decreased and then increased. Correlation analysis revealed that sucrose levels exhibited a significant positive correlation with SS and SPS activities. Titratable acid levels exhibited a high positive correlation with MDH activity, and NADP-ME and IDH activities were negatively correlated.
To further analyze the expression of sugar and acid-related metabolites in stem development, metabolomic analysis of four developmental stages of stem mustard was reported in this study, and 1097 metabolites were detected, including organic acids, lipids, phenylpropanoids, and polyketide compounds. After pairwise comparisons, it was found that the composition of stem mustard metabolites differed at different developmental stages, and S1 vs. S4 yielded the highest number of differential metabolites, with 524 upregulated and 75 downregulated metabolites. Metabolic pathway enrichment analysis showed that metabolites were significantly enriched in organic acid, amino acid, carbon metabolism, glycolysis/gluconeogenesis, sucrose, and starch biosynthesis pathways, which may be involved in regulating sugar and acid metabolism [40]. Metabolite synthesis pathway analysis revealed that 12 metabolites related to sugar and acid synthesis accumulated in higher levels in S3 and S4 than in S1 and S2 during the four developmental stages. Sucrose, starch, and organic acids were involved in multiple metabolic pathways, indicating that these substances have a high influence on metabolic pathways, are present at the nodes of the complex network of metabolic pathways, and are the hubs connecting the pathways [41]. There is a growing consensus that the accumulation of sugars and acids is influenced by a combination of the inter-regulatory effects of related genes and key enzymes [42,43]. Therefore, combined with gene expression analysis, revealed that the transcript levels of genes involved in sucrose and organic acid metabolism were consistent with changes in sucrose and organic acid content, indicating that sugar and acid catabolism and synthesis were associated with differences in related enzyme genes. Among them, INV enzyme genes involved in sucrose catabolism were significantly upregulated in S3, HK enzyme genes involved in glucose catabolism were also significantly upregulated with stem development, and the expression of Gmd and TSTA3 enzyme genes involved in mannitol catabolism were highest in S3. MDH, CS, and IDH enzyme genes involved in the TCA cycle were also significantly expressed during the S3 stages, while higher IDH gene expression accounted for the low acidic characteristics to a certain extent [44]. In addition, the starch and sucrose metabolism, glycolysis/gluconeogenesis pathway, and TCA cycle were significantly increased from S2 to S3 stages, indicating an enhanced flux change from sucrose metabolism to organic acid metabolism. This finding indicated that reducing sugars in the early stage of the leaf could be converted to sucrose more quickly and transported to the stem for the synthesis of other substances, such as protein. In the later stages of development, due to the gradual decline of plant organism function, the synthesis capacity of other substances in the tuberous stem weakened, resulting in less sucrose consumption, then the rate of reducing sugar conversion to sucrose decreased, resulting in a relatively higher reducing sugar content in the later stage, consistent with the literature [45].
Cell division and differentiation require many sugar nutrients at the cellular level, and sucrose is the primary carbon source for growth, development and defense [46]. Previous anatomical studies by our group during the development of the tumorous stem concluded that the tumorous stem completed the expansion process by first cell division, and cell volume increased during the S2–S3 stages [47]. Therefore, the products of photosynthesis at this stage are mainly used for the rapid development of stem cell division and volume, SS catabolism was higher than synthesis at this time, and the catabolism of sucrose into reducing sugars provides the material basis for the synthesis of other substances. During later stages of stem development in stem mustard, cell division slowed, and sugar requirements were smaller; thus, sucrose synthesis was higher than catabolism, leading to sucrose accumulation. Organic acids were produced metabolically by the TCA cycle pathway and were regulated by CS, MDH, and IDH [48]. During stem development of stem mustard, IDH, ME, and MDH were more active, while oxoglutarate metabolites accumulated in higher amounts at later stages, which suggested that organic acids were degraded to oxoglutaric acid through TCA cycle and enzymatic activities at later stages of development. In this study, the key metabolic pathways and metabolites of sugar and acid in stem mustard were explored by metabolomics, and the expression levels of the key genes were quantified in combination with the transcriptome. The results provide the foothold for future studies on the mechanism underlying sugar and acid metabolism regulation in the tumorous stem mustard.

5. Conclusions

In this study, the results showed the sugar and acid content and the activities of enzymes showed a dynamic pattern with the stem development in stem mustard. Of these, sucrose was positively correlated with SS and SPS enzyme activity, while titratable acid content was positively correlated with the activity of the MDH enzyme. However, titratable acid was negatively correlated with ME and IDH enzyme activity. Metabolites were clearly distinguishable in the S1–S4 stages, with the accumulation of sugars and acids significantly higher in S3 and S4 than in S1 and S2. The levels of enzyme activity and gene expression lead to differences in the accumulation of sugars, acids, and related metabolites. In conclusion, this study clarifies the physiological and molecular mechanisms underlying the dynamic accumulation of sugars and acids during stem development in B. juncea, providing a new perspective for the precise regulation of stem quality in stem mustard.

Supplementary Materials

The following supporting information can be downloaded at: https://www.mdpi.com/article/10.3390/agronomy12123227/s1, Table S1: Sequences of primers used in qPCR. Table S2: The total metabolites detected in four developmental stages of B. juncea. Table S3: The ten most differentially upregulated and downregulated metabolites in each comparison pair. Table S4: All Kegg pathways in four developmental stages of B. juncea. Table S5: Metabolites and contents related to sucrose and TCA cycle. Figure S1: LC-MS total ion chromatogram of four samples in both positive and negative ion modes. (A) Positive ion mode. (B) Negative ion mode; Figure S2: Positive and negative ion internal standard responses of QC samples at four developmental stages. (A) Positive ion internal standard response. (B) Negative ion internal standard response; Figure S3: PCA score plots among four developmental stages for B. juncea samples and QC samples in positive and negative ion modes.

Author Contributions

Conceptualization, F.X. and Z.X.; data curation, W.C.; formal analysis, J.D. and Y.W.; investigation, L.G.; writing—original draft preparation, E.H.; writing—review and editing, F.X. and M.L.; funding acquisition, Z.X. All authors have read and agreed to the published version of the manuscript.

Funding

This work was funded by the National Natural Science Foundation of China (32002027) and Tarim University Project of the Fund of the President (TDZKSS202245), Key project of Science and Technology Research Plan of Education Department of Hubei Province (D20221206), Construction of Scientific Research Conditions in South Xinjiang Horticultural Research Center (TDZKKY202204).

Data Availability Statement

In the research, metabolic data were yielded by Biomarker Technologies, and the physiological data were collected by the authors themselves.

Conflicts of Interest

No conflict of interest was declared by the author.

References

  1. Li, M.; Sun, B.; Xie, F.; Gong, R.; Luo, Y.; Zhang, F.; Yan, Z.; Tang, H. Identification of the GRAS gene family in the Brassica juncea genome provides insight into its role in stem swelling in stem mustard. PeerJ 2019, 7, e6682. [Google Scholar] [CrossRef] [PubMed] [Green Version]
  2. Qi, X.H.; Zhang, M.F.; Yang, J.H. Molecular phylogeny of Chinese vegetable mustard (Brassica juncea) based on the internal transcribed spacers (ITS) of nuclear ribosomal DNA. Genet. Resour. Crop Evol. 2007, 54, 1709–1716. [Google Scholar] [CrossRef]
  3. Yang, J.; Zhang, C.; Zhao, N.; Zhang, L.; Hu, Z.; Chen, S.; Zhang, M. Chinese root-type mustard provides phylogenomic insights into the evolution of the multi-use diversified allopolyploid Brassica juncea. Mol. Plant. 2018, 11, 512–514. [Google Scholar] [CrossRef] [PubMed] [Green Version]
  4. Wang, C.; Cao, J.; Hao, N.; Wu, T. Genetic and molecular regulation mechanisms in the formation and development of vegetable fruit shape. Appl. Sci. 2022, 12, 1514. [Google Scholar] [CrossRef]
  5. Seymour, G.B.; Østergaard, L.; Chapman, N.H.; Knapp, S.; Martin, C. Fruit development and ripening. Annu. Rev. Plant Biol. 2013, 64, 219–241. [Google Scholar] [CrossRef] [PubMed] [Green Version]
  6. Zhang, J.; Nie, J.Y.; Li, J.; Zhang, H.; Ye, L.I.; Farooq, S.; Bacha, S.A.S.; Wang, J. Evaluation of sugar and organic acid composition and their levels in highbush blueberries from two regions of China. J. Integr. Agric. 2020, 19, 2352–2361. [Google Scholar] [CrossRef]
  7. Kyriacou, M.C.; Loannidou, S.; Nikoloudakis, N.; Seraphides, N.; Papayiannis, L.C.; Kyratzis, A.C. Physicochemical characterization and trait stability in a genetically diverse ex situ collection of pomegranate (Punica granatum L.) germplasm from Cyprus. Sci. Hortic. 2020, 263, 109116. [Google Scholar] [CrossRef]
  8. Aslam, M.M.; Deng, L.; Wang, X.B.; Wang, Y.; Pan, L.; Liu, H.; Niu, L.; Lu, Z.H.; Cui, G.C.; Zeng, W.F.; et al. Expression patterns of genes involved in sugar metabolism and accumulation during peach fruit development and ripening. Sci. Hortic. 2019, 257, 108633. [Google Scholar] [CrossRef]
  9. Jia, H.F.; Jiu, S.T.; Zhang, C.; Wang, C.; Tariq, P.; Liu, Z.J.; Wang, B.J.; Cui, L.W.; Fang, J.G. Abscisic acid and sucrose regulate tomato and strawberry fruit ripening through the abscisic acid-stress-ripening transcription factor. Plant Biotechnol. J. 2016, 14, 2045–2065. [Google Scholar] [CrossRef] [Green Version]
  10. Zhong, L.; Lin, L.; Yang, L.; Liao, M.; Wang, X.; Wang, J.; Lv, X.; Deng, H.; Liang, D.; Xia, H.; et al. Exogenous melatonin promotes growth and sucrose metabolism of grape seedlings. PLoS ONE 2020, 15, e0232033. [Google Scholar] [CrossRef]
  11. Koch, K. Sucrose metabolism: Regulatory mechanisms and pivotal roles in sugar sensing and plant development. Curr. Opin. Plant Biol. 2004, 7, 235–246. [Google Scholar] [CrossRef] [PubMed]
  12. Mirajkar, S.J.; Suprasanna, P.; Vaidya, E.R. Spatial distribution and dynamics of sucrose metabolising enzymes in radiation induced mutants of sugarcane. Plant Physiol. Biochem. 2016, 100, 85–93. [Google Scholar] [CrossRef] [PubMed]
  13. Yu, L.; Shao, X.F.; Wei, Y.Y.; Xu, F.; Wang, H.F. Sucrose degradation is regulated by 1-methycyclopropene treatment and is related to chilling tolerance in two peach cultivars. Postharvest Biol. Technol. 2017, 124, 25–34. [Google Scholar] [CrossRef] [Green Version]
  14. Hu, J.; Xu, J.F.; Duan, S.G.; Bian, C.S.; Li, G.C.; Jin, L.P. Transcriptome analysis of potato tuber expansion stage. Potato Ind. Green Dev. 2021, 261–262. [Google Scholar] [CrossRef]
  15. Zhang, X.M.; Liu, S.H.; Du, L.Q.; Yao, Y.L.; Wu, J.Y. Activities, transcript levels, and subcellular localizations of sucrose phosphate synthase, sucrose synthase, and neutral invertase and change in sucrose content during fruit development in pineapple (Ananas comosus). J. Hortic. Sci. Biotechnol. 2019, 94, 573–579. [Google Scholar] [CrossRef]
  16. Liu, H.F.; Génard, M.; Guichard, S.; Bertin, N. Model-assisted analysis of tomato fruit growth in relation to carbon and water fluxes. J. Exp. Bot. 2007, 58, 3567–3580. [Google Scholar] [CrossRef] [Green Version]
  17. Sweetlove, L.J.; Beard, K.F.; Nunes-Nesi, A.; Fernie, A.R.; Ratcliffe, R.G. Not just a circle: Flux modes in the plant TCA cycle. Trends Plant Sci. 2010, 15, 462–470. [Google Scholar] [CrossRef]
  18. Li, Q.; Qiao, X.; Jia, L.; Zhang, Y.; Zhang, S. Transcriptome and resequencing analyses provide insight into differences in organic acid accumulation in two pear varieties. Int. J. Mol. Sci. 2021, 22, 9622. [Google Scholar] [CrossRef]
  19. Liu, X.C.; Lin, X.H.; Liu, S.C.; Zhu, C.Q.; Grierson, D.; Li, S.J.; Chen, K.S. The effect of NH4+ on phosphoenolpyruvate carboxykinase gene expression, metabolic flux and citrate content of citrus juice sacs. Plant Physiol. Biochem. 2021, 167, 123–131. [Google Scholar] [CrossRef]
  20. Park, S.H.; Lee, C.W.; Bae, D.W.; Do, H.; Jeong, C.S.; Hwang, J.; Cha, S.S.; Lee, J.H. Structural basis of the cooperative activation of type II citrate synthase (HyCS) from Hymenobacter sp. PAMC 26554. Int. J. Biol. Macromol. 2021, 31, 213–221. [Google Scholar] [CrossRef]
  21. Shukla, R.; Shukla, H.; Tripathi, T. Structure-based discovery of phenyl-diketo acids derivatives as Mycobacterium tuberculosis malate synthase inhibitors. J. Biomol. Struct. Dyn. 2021, 39, 2945–2958. [Google Scholar] [CrossRef] [PubMed]
  22. Cirilli, M.; Bassi, D.; Ciacciulli, A. Sugars in peach fruit: A breeding perspective. Hortic. Res. 2016, 20, 15067. [Google Scholar] [CrossRef] [PubMed] [Green Version]
  23. Zheng, B.B.; Zhao, L.; Jiang, X.H.; Cherono, S.; Liu, J.J.; Ogutu, C.; Ntini, C.; Zhang, X.; Han, Y. Assessment of organic acid accumulation and its related genes in peach. Food Chem. 2021, 334, 127567. [Google Scholar] [CrossRef] [PubMed]
  24. Castro-Moretti, F.R.; Gentzel, I.N.; Mackey, D.; Alonso, A.P. Metabolomics as an Emerging Tool for the Study of Plant-Pathogen Interactions. Metabolites 2020, 10, 52. [Google Scholar] [CrossRef] [PubMed] [Green Version]
  25. Yang, F.; Liu, M.; Qin, N.; Li, S.; Yu, M.; Wang, C.; Ma, Q. Lipidomics coupled with pathway analysis characterizes serum metabolic changes in response to potassium oxonate induced hyperuricemic rats. Lipids Health Dis. 2019, 18, 112. [Google Scholar] [CrossRef] [PubMed] [Green Version]
  26. He, K.; Liang, X.; Wei, T.; Liu, N.; Wang, Y.; Zou, L.; Bai, C.; Yao, Y.; Wu, T.; Kong, L.; et al. A metabolomics study: CdTe/ZnS quantum dots induce polarization in mice microglia. Chemosphere 2020, 246, 125629. [Google Scholar] [CrossRef]
  27. Xu, J.D.; Yan, J.J.; Li, W.J.; Wang, Q.Y.; Wang, C.X.; Guo, J.X.; Geng, D.L.; Guan, Q.M.; Ma, F.W. Integrative Analyses of Widely Targeted Metabolic Profiling and Transcriptome Data Reveals Molecular Insight into Metabolomic Variations during Apple (Malus domestica) Fruit Development and Ripening. Int. J. Mol. Sci. 2020, 21, 4797. [Google Scholar] [CrossRef]
  28. Gong, C.; Diao, W.; Zhu, H.; Umer, M.J.; Zhao, S.; He, N.; Lu, X.; Yuan, P.; Anees, M.; Yang, D.; et al. Metabolome and transcriptome integration reveals insights into flavor formation of ‘Crimson’ watermelon flesh during fruit development. Front. Plant Sci. 2021, 12, 629361. [Google Scholar] [CrossRef]
  29. Wang, S.S.; Liu, L.; Mi, X.Z.; Zhao, S.Q.; An, Y.L.; Xia, X.B.; Guo, R.; Wei, C.L. Multi-omics analysis to visualize the dynamic roles of defense genes in the response of tea plants to gray blight. Plant J. 2021, 106, 862–875. [Google Scholar] [CrossRef]
  30. Slade, W.O.; Werth, E.G.; McConnell, E.W.; Alvarez, S.; Hicks, L.M. Quantifying reversible oxidation of protein thiols in photosynthetic organisms. J. Am. Soc. Mass Spectrom. 2015, 26, 631–640. [Google Scholar] [CrossRef] [PubMed]
  31. Kuhl, C.; Tautenhahn, R.; Böttcher, C.; Larson, T.R.; Neumann, S. CAMERA: An integrated strategy for compound spectra extraction and annotation of liquid chromatography/mass spectrometry data sets. Anal. Chem. 2012, 84, 283–289. [Google Scholar] [CrossRef] [PubMed] [Green Version]
  32. Li, M.Y.; Xie, F.J.; He, Q.; Li, J.; Liu, J.; Sun, B.; Luo, Y.; Zhang, Y.; Chen, Q.; Zhang, F.; et al. Expression analysis of XTH in stem swelling of stem mustard and selection of reference genes. Genes 2020, 20, 113. [Google Scholar] [CrossRef] [PubMed] [Green Version]
  33. Pfaffl, M.W. A new mathematical model for relative quantification in real-time RT-PCR. Nucl. Acids Res. 2001, 29, e45. [Google Scholar] [CrossRef] [PubMed]
  34. Zhang, X.S.; Xie, C.H.; Yu, X.C.; Hu, X.Y.; Zhu, S.H.; Li, J. Effect of Sowing Date and Date of Harvest on Yield and Shape of Tumorous Stem in Brassica juncea var. tumida Tsen et Lee. North. Hortic. 2012, 22, 33–35. [Google Scholar]
  35. Yang, S.W.; Rao, L.; Hu, H.D.; Zhao, S.Z.; Lin, H.Q. Comparison of differences among different tumorous stem mustard cultivars under direct seeding cultivation. J. Chang. Veg. 2022, 8, 53–55. [Google Scholar] [CrossRef]
  36. Zhang, D.; Tian, J.Q.; Cheng, Y.J.; Ma, X.H.; Huang, K.; Deng, J.; Li, C.S.; Liu, X. Desalting process optimization and quality analysis of tuber mustard. Food Ferment. Ind. 2017, 43, 167–172. [Google Scholar] [CrossRef]
  37. Kortstee, A.J.; Appeldoorn, N.J.; Oortwijn, M.E.; Visser, R.G. Differences in regulation of carbohydrate metabolism during early fruit development between domesticated tomato and two wild relatives. Planta 2007, 226, 929–939. [Google Scholar] [CrossRef] [Green Version]
  38. Wu, S.W.; Li, M.; Zhang, C.M.; Tan, Q.L.; Yang, X.Z.; Sun, X.C.; Pan, Z.Y.; Deng, X.X.; Hu, C.X. Effects of potassium on fruit soluble sugar and citrate accumulations in Cara Cara navel orange (Citrus sinensis L. Osbeck). Sci. Hortic. 2021, 283, 110057. [Google Scholar] [CrossRef]
  39. Li, M.; Feng, F.; Cheng, L. Expression patterns of genes involved in sugar metabolism and accumulation during apple fruit development. PLoS ONE 2012, 7, e33055. [Google Scholar] [CrossRef] [Green Version]
  40. Liao, H.Z.; Lin, X.K.; Du, J.J.; Peng, J.J.; Zhou, K.B. Transcriptomic analysis reveals key genes regulating organic acid synthesis and accumulation in the pulp of Litchi chinensis Sonn. cv. Feizixiao. Sci. Hortic. 2022, 303, 111220. [Google Scholar] [CrossRef]
  41. Zhang, Q.; Dong, X.Q.; Lin, X.; Peng, J.J.; Luo, D.C.; Huang, S.A.; Zhu, S.L. Analysis of primary metabolites in three plum varieties using ultra-high performance liquid chromatography tandem mass spectrometry. Food Sci. 2022, 43, 1–13. [Google Scholar] [CrossRef]
  42. Yang, J.J.; Zhu, L.C.; Cui, W.F.; Zhang, C.; Li, D.X.; Ma, B.Q.; Cheng, L.L.; Ruan, Y.L.; Ma, F.W.; Li, M.J. Increased activity of MdFRK2, a high-affinity fructokinase, leads to upregulation of sorbitol metabolism and downregulation of sucrose metabolism in apple leaves. Hortic. Res. 2018, 5, 54–65. [Google Scholar] [CrossRef] [PubMed] [Green Version]
  43. Zhu, L.C.; Li, B.Y.; Wu, L.M.; Li, H.X.; Wang, Z.Y.; Wei, X.Y.; Ma, B.Q.; Zhang, Y.F.; Ma, F.W.; Ruan, Y.L.; et al. MdERDL6-mediated glucose efflux to the cytosol promotes sugar accumulation in the vacuole through upregulating TSTs in apple and tomato. Proc. Natl. Acad. Sci. USA 2021, 118, e2022788118. [Google Scholar] [CrossRef] [PubMed]
  44. Sheng, L.; Shen, D.; Yang, W.; Zhang, M.; Zeng, Y.; Xu, J.; Deng, X.; Cheng, Y. Gaba pathway rate-limit citrate degradation in postharvest citrus fruit evidence from hb pumelo (citrus grandis) × fairchild (citrus reticulata) hybrid population. J. Agric. Food Chem. 2017, 65, 1669–1676. [Google Scholar] [CrossRef] [PubMed]
  45. Li, L.J.; Xu, C.; Chen, J.L.; Cao, B.S. Changes of carbohydrates during lotus rhizome development of nelumbo nucifera gaertn. J. Yangzhou Univ. (Agric. Life Sci. Ed.) 2003, 24, 72–74+78. [Google Scholar] [CrossRef]
  46. Radchuk, V.; Riewe, D.; Peukert, M.; Matros, A.; Strickert, M.; Radchuk, R.; Weier, D.; Steinbiß, H.H.; Sreenivasulu, N.; Weschke, W.; et al. Down-regulation of the sucrose transporters HvSUT1 and HvSUT2 affects sucrose homeostasis along its delivery path in barley grains. J. Exp. Bot. 2017, 68, 4595–4612. [Google Scholar] [CrossRef] [PubMed]
  47. Li, M.Y.; Xie, F.J.; Li, J.; Sun, B.; Luo, Y.; Zhang, Y.; Chen, Q.; Wang, Y.; Zhang, F.; Zhang, Y.T.; et al. Tumorous stem development of Brassica Juncea: A complex regulatory network of stem formation and identification of key genes in glucosinolate biosynthesis. Plants 2020, 9, 1006. [Google Scholar] [CrossRef] [PubMed]
  48. Umer, M.J.; Bin Safdar, L.; Gebremeskel, H.; Zhao, S.J.; Yuan, P.L.; Zhu, H.J.; Kaseb, M.O.; Anees, M.; Lu, X.; He, N.; et al. Identification of key gene networks controlling organic acid and sugar metabolism during watermelon fruit development by integrating metabolic phenotypes and gene expression profiles. Hortic. Res. 2020, 7, 193. [Google Scholar] [CrossRef]
Figure 1. Changes in growth indexes of stem mustard at different developmental stages. Vertical bars with different letters (a–f) indicate significant differences at the 0.05 level. Three biological replicates were performed for each index.
Agronomy 12 03227 g001
Figure 2. Changes in sugar and acid content at different developmental stages of stems. Vertical bars with different letters (a–f) indicate significant differences at the 0.05 level. Three biological replicates were performed for each index.
Agronomy 12 03227 g002
Figure 3. Changes in the activity of sugar and acid-related enzymes at different expansion stages of the stem. Vertical bars with different letters (a–f) indicate significant differences at the 0.05 level. Three biological replicates were performed for each index.
Agronomy 12 03227 g003
Figure 4. Correlation analysis of sucrose and acid content and related enzyme activities. (A) Correlation analysis between sucrose content and sucrose-related enzyme activity. (B) Correlation analysis between acid content and acid-related enzyme activity. * At the level of 0.05, the correlation shows significance. ** At the level of 0.01, the correlation shows high significance.
Agronomy 12 03227 g004
Figure 5. Classification of metabolites according to annotation. (A) Hierarchical clustering analysis of metabolite expression for all samples. (B) Metabolites classified by HMDB database.
Agronomy 12 03227 g005
Figure 6. Identification of differentially accumulated metabolites among four development stages. (A) Number of different accumulated metabolites in at any two different developmental stages of B. juncea. (B) Venn diagram of differentially accumulated metabolites expressed commonly or distinctly in two or more comparisons.
Agronomy 12 03227 g006
Figure 7. The top 20 enrichment KEGG pathways were represented. The vertical axis is the name of the KEGG metabolic pathway and the horizontal axis is the number of metabolites and its proportion to the total number of annotated metabolites to the pathway. The orange bar represents the percentage of differential metabolites associated with each pathway among all differential accumulated metabolites; the green bar represents all differential metabolites of each pathway.
Agronomy 12 03227 g007
Figure 8. Biosynthesis pathway of sugar and TCA cycles in four developmental stages. The colored squares represent the expression levels of different metabolites in S1–S4 period shown by heatmap. SS: Sucrose synthase; SPS: sucrose phosphate synthase; INV: invertase; HK: hexokinase; Gmd: GDP mannose 4,6-dehydratase; TSTA3: GDP-L-fucose synthase; CS: citrate synthase; ACO: aconitate hydratase; IDH: isocitrate dehydrogenase; MDH: malate dehydrogenase.
Agronomy 12 03227 g008
Figure 9. Relative expression levels (target gene vs. UBC) of sugar- and acid-related enzyme genes in four different developmental stems of B. juncea. (A) Relative expression levels of sugar-related enzyme genes. (B) Relative expression levels of acid-related enzyme genes. Colored squares represent enzyme gene transcript abundance. The different letters (a–d) on the vertical bars mean significant differences at the 0.05 level. Three biological replicates were performed for each gene.
Agronomy 12 03227 g009
Publisher’s Note: MDPI stays neutral with regard to jurisdictional claims in published maps and institutional affiliations.

