Article

Assessment of Potential Heavy Metal Contamination Hazards Based on GIS and Multivariate Analysis in Some Mediterranean Zones

by
Mohamed S Shokr
1,*,
Mostafa A. Abdellatif
2,
Radwa A. El Behairy
1,
Hend H. Abdelhameed
3,
Ahmed A. El Baroudy
1,
Elsayed Said Mohamed
2,4,
Nazih Y. Rebouh
4,
Zheli Ding
5 and
Ahmed S. Abuzaid
6
1
Soil and Water Department, Faculty of Agriculture, Tanta University, Tanta 31527, Egypt
2
National Authority for Remote Sensing and Space Sciences, Cairo 1564, Egypt
3
Soil and Water Department, Faculty of Environmental Agricultural Science, Arish University, Arish 4556, Egypt
4
Department of Environmental Management, Peoples’ Friendship University of Russia (RUDN University), 6 Miklukho-Maklaya Street, 117198 Moscow, Russia
5
Haikou Experimental Station, Chinese Academy of Tropical Agricultural Sciences, Haikou 570000, China
6
Soils and Water Department, Faculty of Agriculture, Benha University, Benha 13518, Egypt
*
Author to whom correspondence should be addressed.
Agronomy 2022, 12(12), 3220; https://doi.org/10.3390/agronomy12123220
Submission received: 8 December 2022 / Revised: 15 December 2022 / Accepted: 16 December 2022 / Published: 19 December 2022

Abstract

:
One of the most significant challenges that global decision-makers are concerned about is soil contamination. It is also related to food security and soil fertility. The quality of the soil and crops in Egypt are being severely impacted by the increased heavy metal content of the soils in the middle Nile Delta. In Egypt’s middle Nile Delta, fifty random soil samples were chosen. Inverse distance weighting (IDW) was used to create the spatial pattern maps for four heavy metals: Cd, Mn, Pb, and Zn. The soil contamination levels in the research area were assessed using principal component analysis (PCA), contamination factors (CF), the geoaccumulation index (I-Geo), and the improved Nemerow pollution index (In). The findings demonstrated that using PCA, the soil heavy metal concentrations were divided into two clusters. Moreover, the majority of the study region (44.47%) was assessed to be heavily to extremely polluted by heavy metals. In conclusion, integrating the contamination indices CF, I-Geo, and In with the GIS technique and multivariate model, analysis establishes a practical and helpful strategy for assessing the hazard of heavy metal contamination. The findings could serve as a basis for decision-makers to create effective heavy metal mitigation efforts.

1. Introduction

Huge pressure has been placed on limited soil resources as a result of the improper management of land resources brought on by continuously growing human needs, particularly in third-world countries [1,2]. Soil is the most important natural resource for the survival and maintenance of ecological ecosystems [3]. However, the increased use of fertilizers and pesticides, rapid urbanization, and industrialization cause soil contamination [4,5]. Due to the detrimental effects of contaminants on crop quality, food security and human health have been more and more at risk in recent decades [6]. Additionally, arid and semi-arid regions need to pay more attention to the impacts of climate change and potential food security adaptations [7]. Negative effects on crop quality arise as soil heavy metal concentrations rise over acceptable limits, which are then reflected in the food chain [8]. Globally, there are 5 million sites with soil contamination from heavy metals or metalloids that are currently more concentrated than permissible [9]. Heavy metals can cause serious pollution in the environment and have negative impacts on ecosystems, including bioaccumulation since they cannot be biologically or chemically degraded once they are introduced into the soil and can persist in the environment for a long time [10,11]. Rising levels of soil contamination in Egyptian soils during the past 20 years have decreased soil quality and fertility [12]. In the Nile Delta, irrigation activities require the use of wastewater. The main agricultural and industrial drainage wastewater drain in El Gharbia, Egypt, was blended with Nile water for irrigation in the middle Nile Delta [13]. Due to a lack of fresh water for irrigation, farmers were forced to use drain and sewage water, which resulted in the accumulation of heavy metals in the rhizosphere zone [14]. Increased salt deposition and heavy metal concentrations in the rhizosphere zone may be harmful and can affect human health [15,16]. Numerous harmful compounds are deposited into the soil mostly as a result of uncontrolled activity, which eventually causes soil degradation and harm to human health. Agricultural practices, particularly land use, inorganic and petrochemical fertilizers for organic matter (bio-solids, animal manure, and organic fertilizers), and pesticides are the main human factors contributing to the deposition of soil-bearing solids [17]. Human activities have also had a significant impact on soil quality [18]. In order to lower the contamination risks in Egyptian soils, regular environmental monitoring and lowering the fertilization rates are necessary [19]. The first steps in effectively treating soil contamination are in understanding the spatial distribution of heavy metals and being aware of the sources of contamination. [2]. Consequently, geographic information systems (GIS) aid in mapping the spatial distribution of soil parameters [20,21,22]. A method called geostatistical analysis allows for the study of spatial data and the location of the unsampled data to be predicted [15]. Several geostatistical analysis techniques exist, including Kriging and inverse distance weighting (IDW). To assess soil ecological risk, various methods are utilized, including the index technique, quotient method, fuzzy comprehensive assessment, geoaccumulation index, potential ecological risk index, and pollution load index [23,24]. Several soil-pollution causes, such as industrial and agricultural activity, as well as the proportion of heavy metals responsible for soil contamination, have been identified using principal component analysis (PCA) [25,26]. PCA also benefits from being able to manage enormous amounts of data without being limited to a specific quantity [27,28]. Agglomerative hierarchical clustering (AHC) also looks at the separations between samples where the majority of comparable points are gathered into one cluster. AHC is an unsupervised classification technique that involves repeatedly combining the two nearest clusters. The most important aspect of AHC is how to automatically terminate the procedure at the time when the clustering error rate reaches its lowest feasible value because of its recursive nature [29]. The geostatistical and multivariate analysis combined can be useful methods for evaluating environmental pollution [30]. The current study aims to analyze soil contamination with several chosen heavy metals by mapping their spatial distribution in the middle Nile Delta, Egypt, defining contamination levels using PCA, and determining the degree of contamination of the study region. The objectives are to investigate various soil characteristics and total Cd, Mn, Pb, and Zn concentrations in some areas of the middle Nile Delta, Egypt. The statistical analysis utilized in the current study is a useful tool for identifying potential sources of contaminants because it allows for the assessment of cause-and-effect linkages and highlights exceeded levels.

2. Methodology

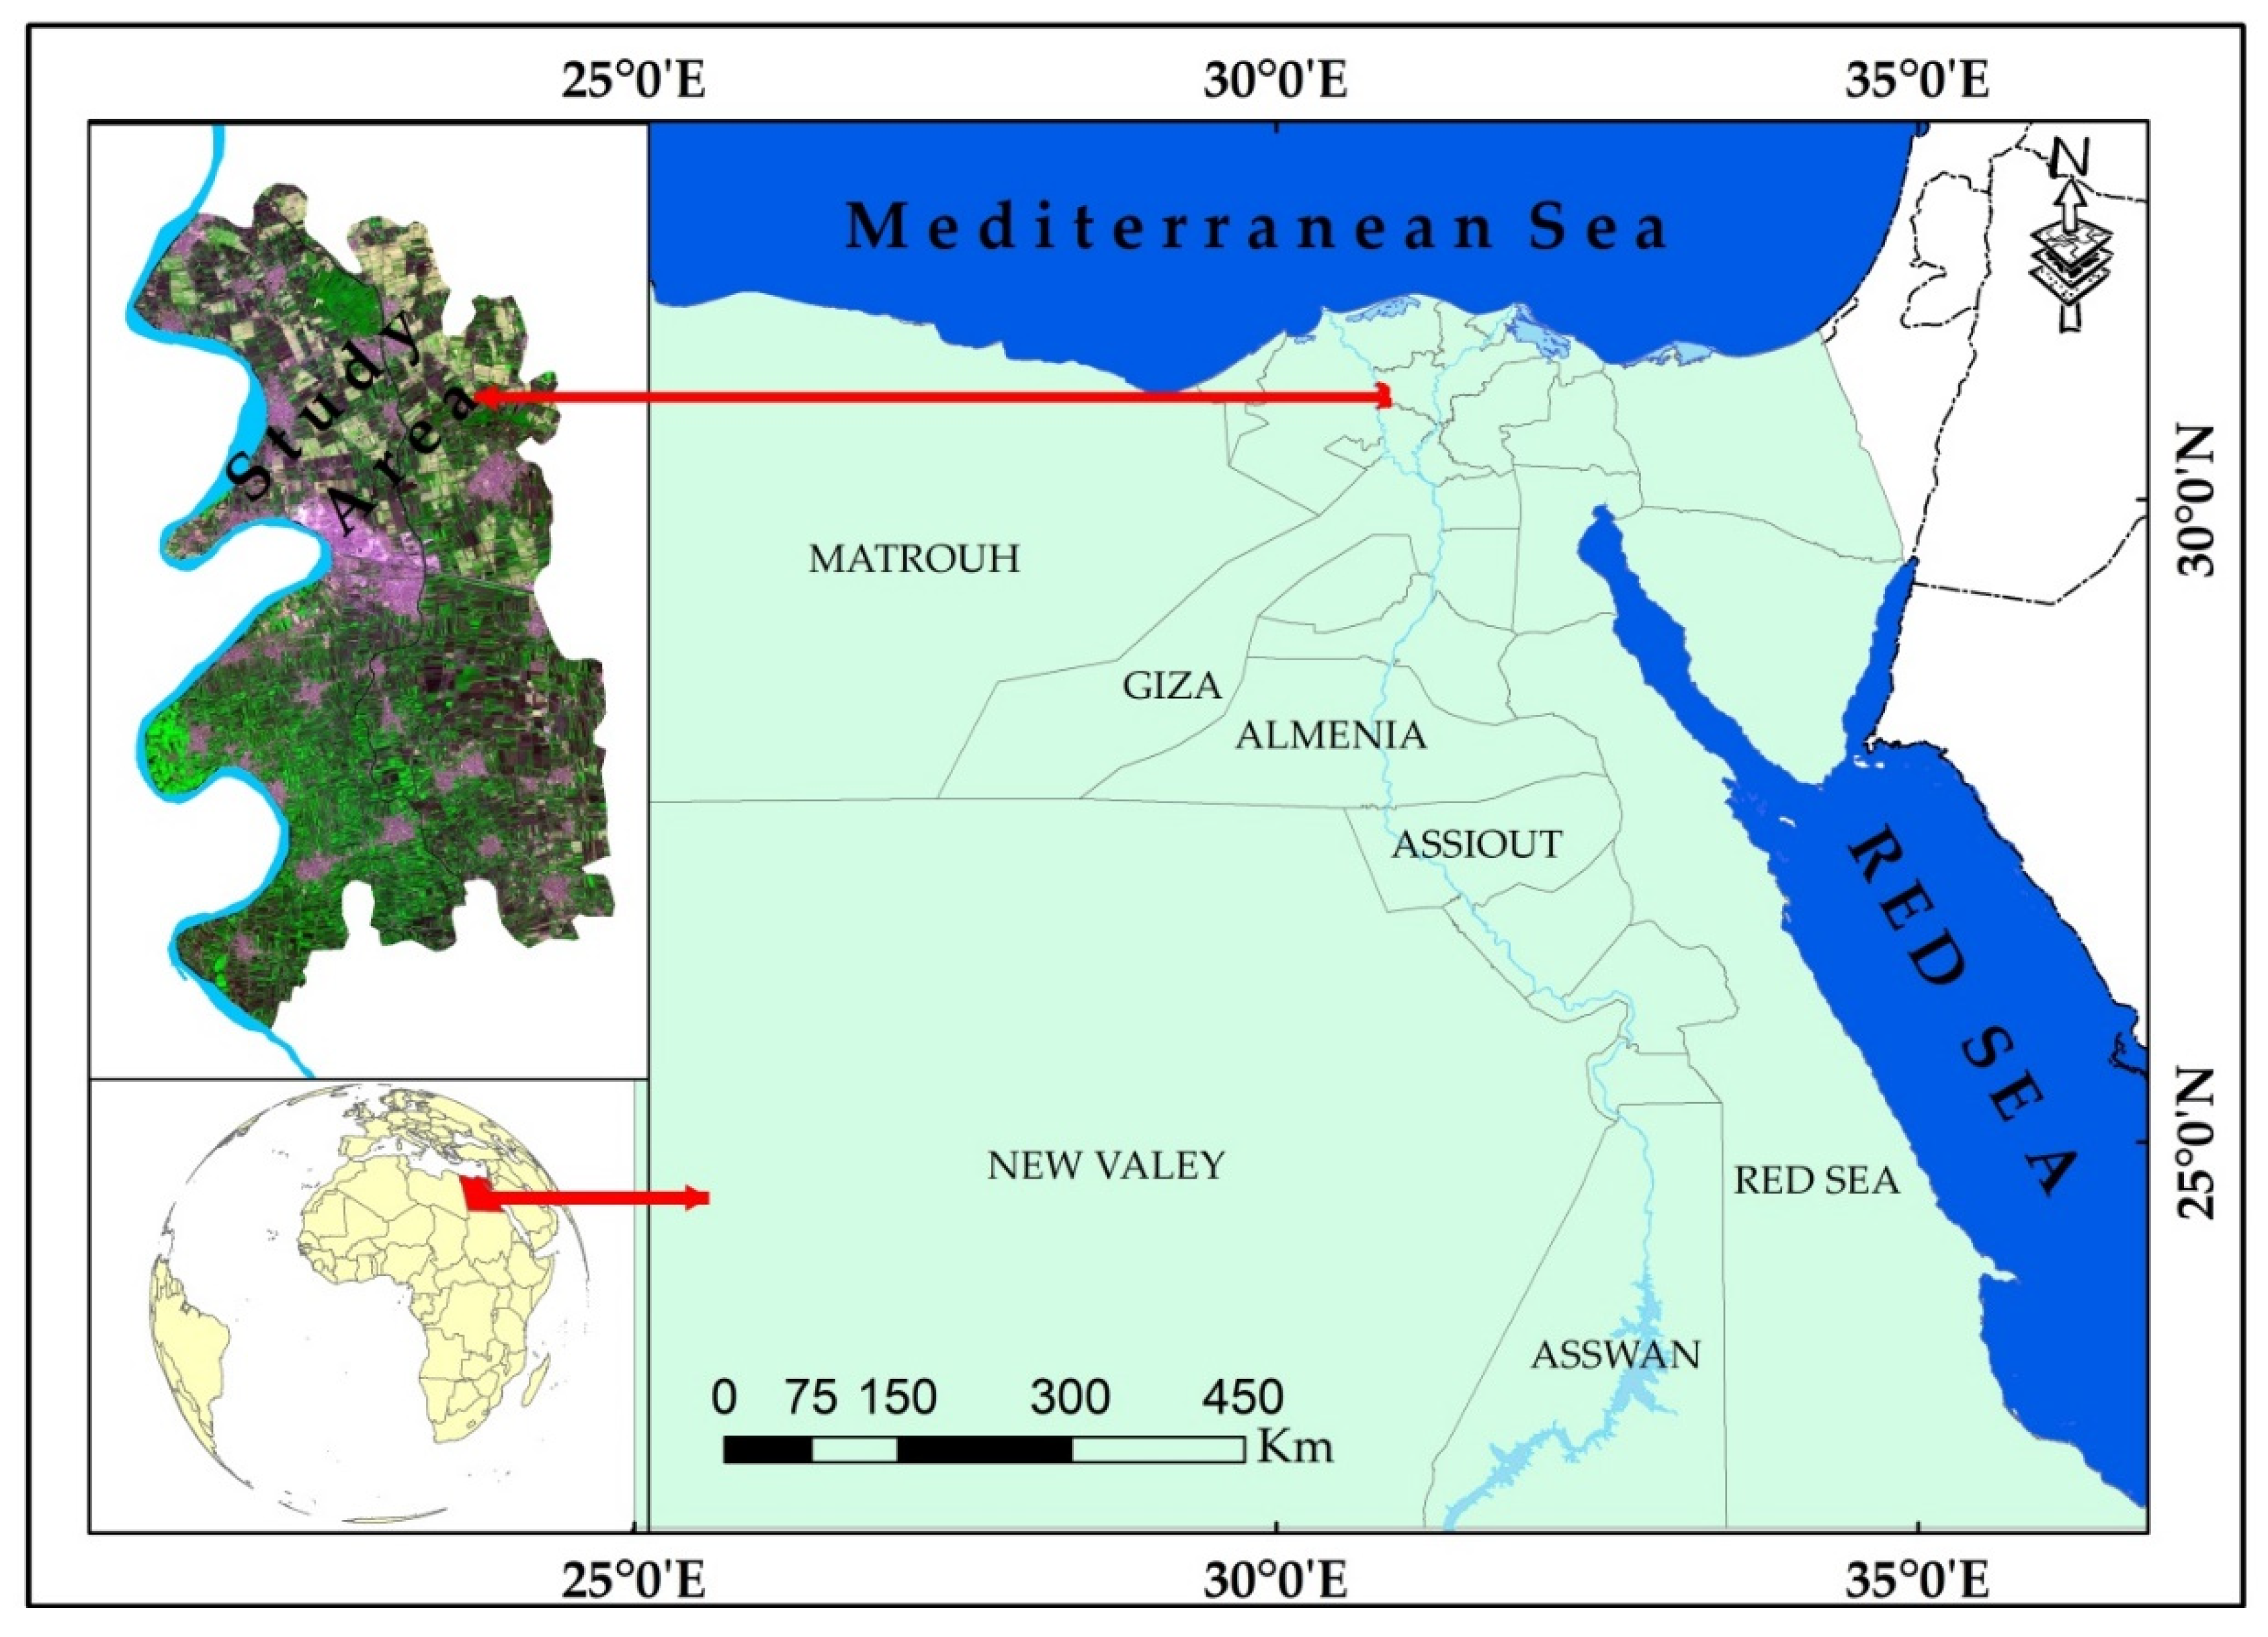
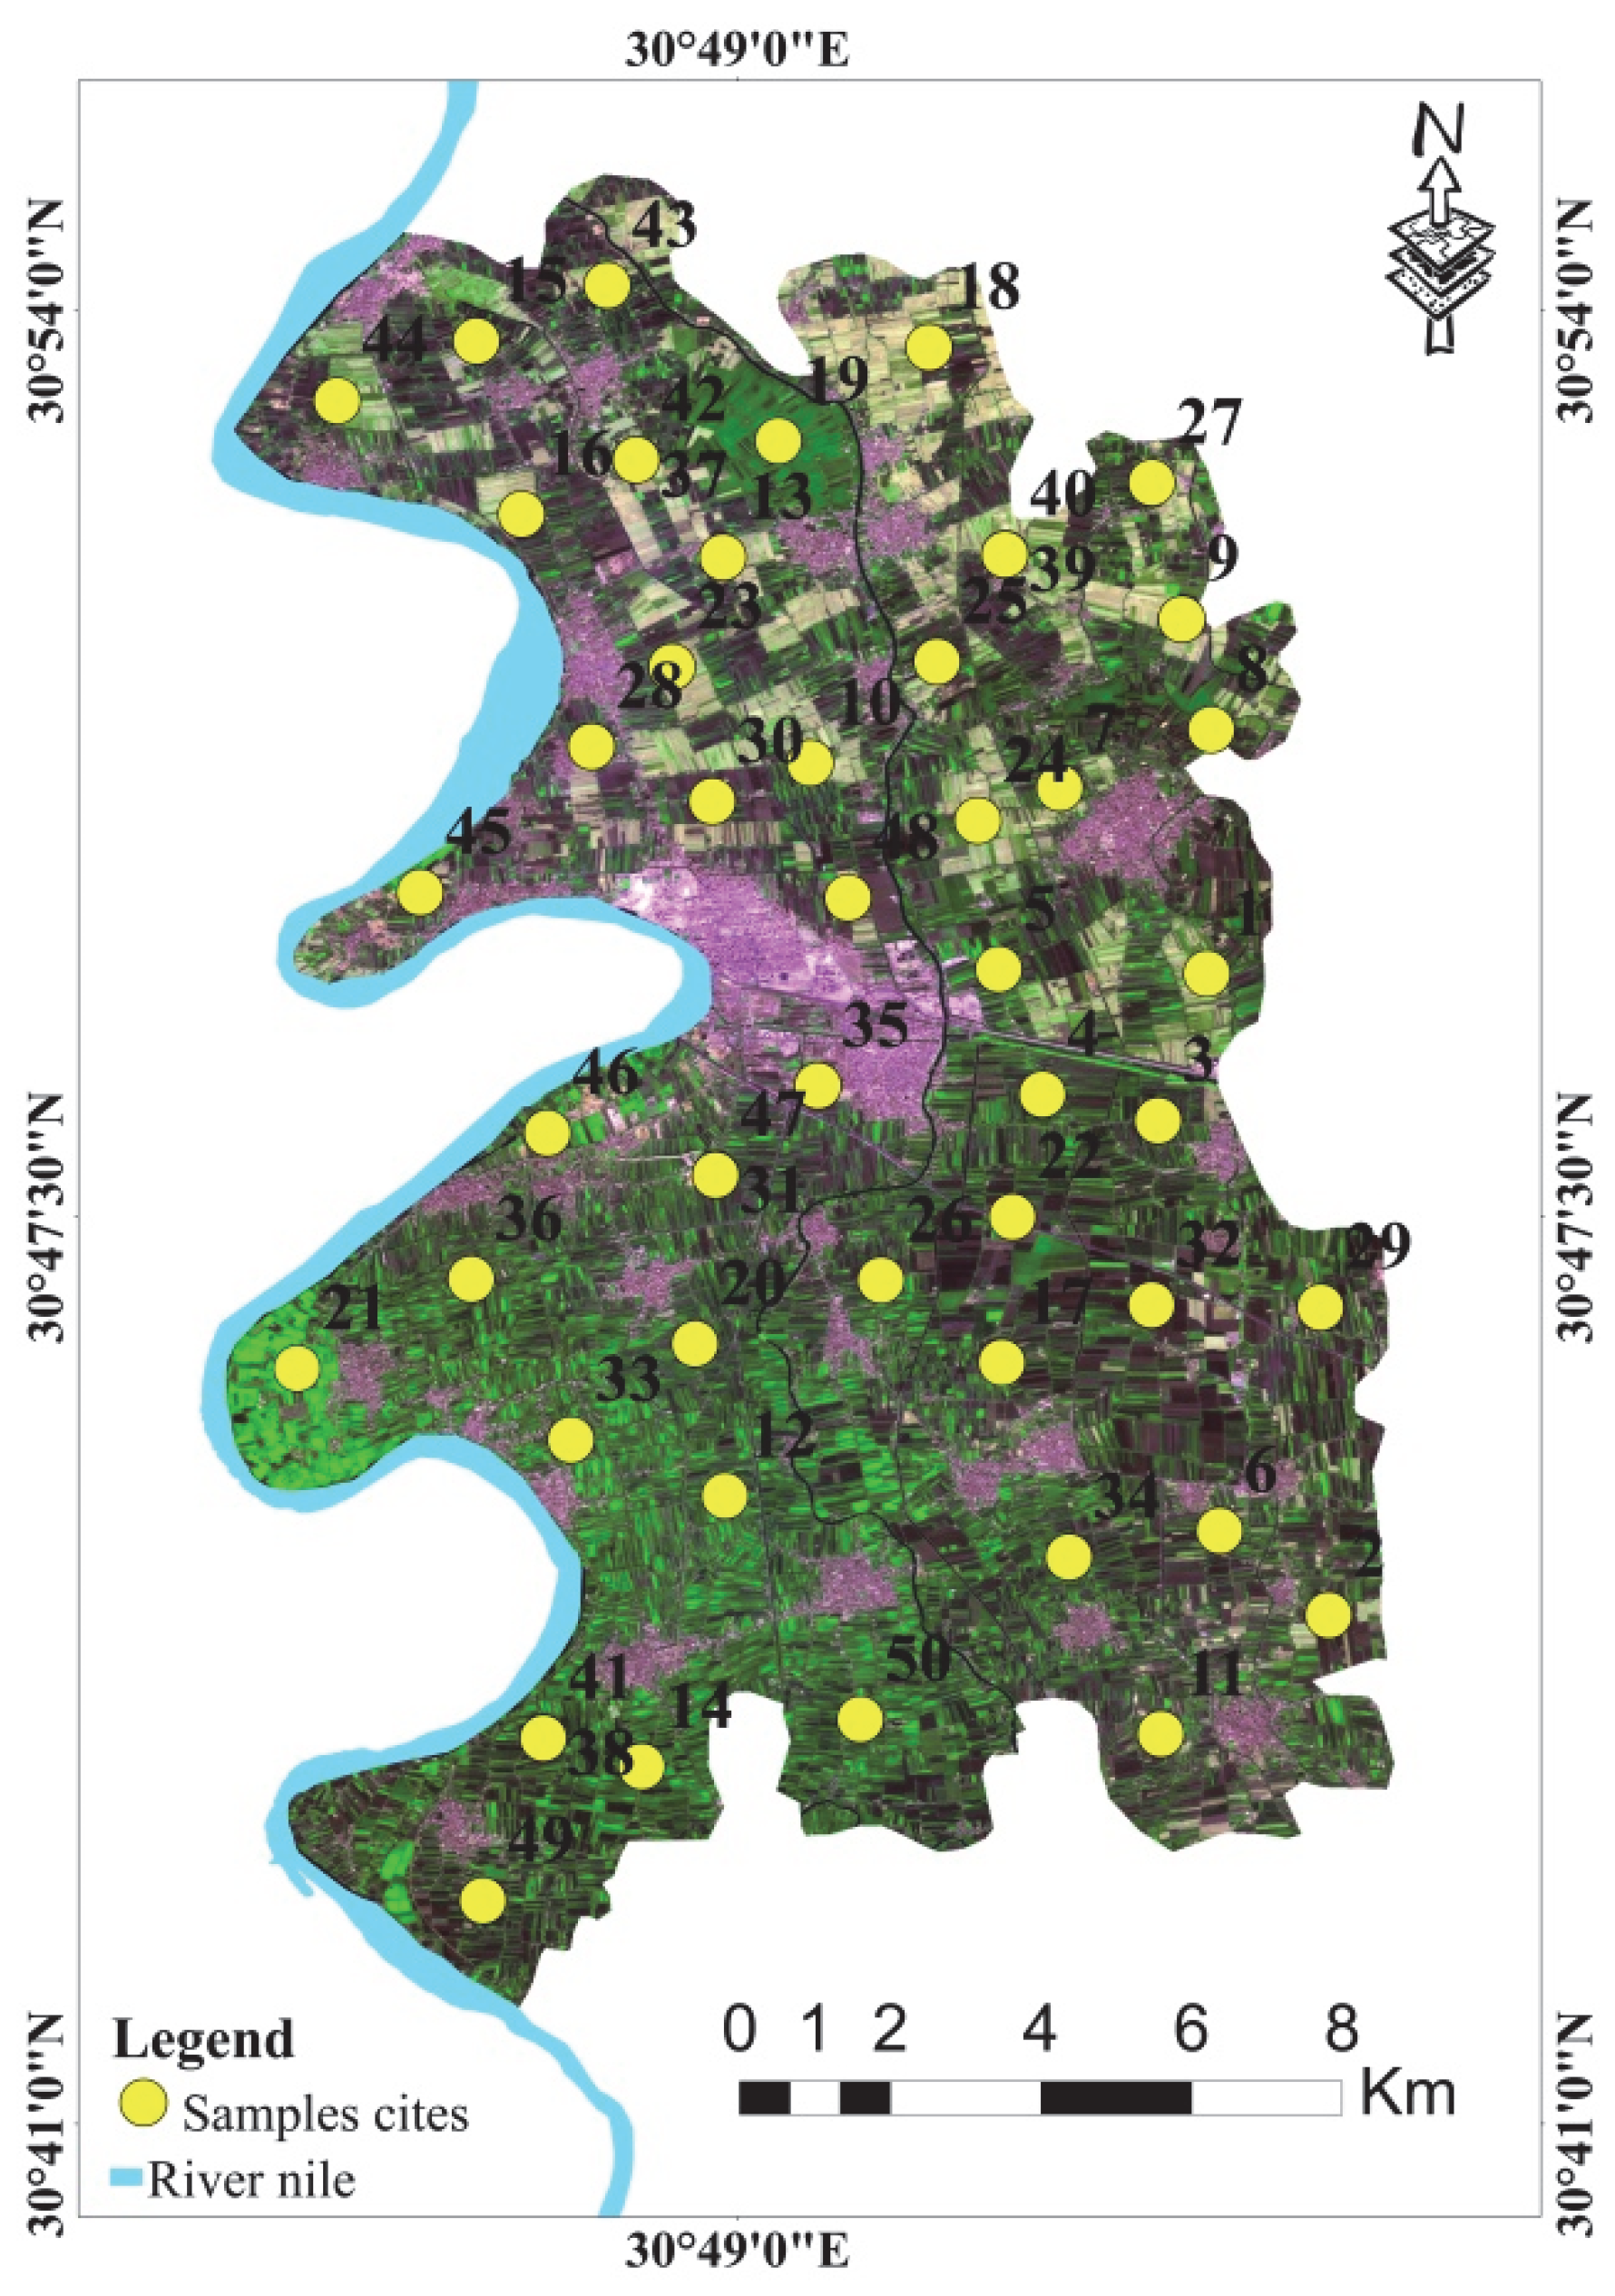
2.1. Experimental Area

The study area is situated in the middle of the Nile Delta in Egypt. (Kafr EL—Zayat area). The study area is a portion of the Gharbia Governorate in Egypt. It has a total area of 19,715.85 hectares (ha) and is bordered by the longitudes 30°48′00″ and 30°52′59″ and the latitudes 30°55′11″ and 30°43′18″, as shown in Figure 1. The region has a Mediterranean climate, with hot, dry summers and few rainy winters. The average temperature is 22 °C, while the average difference between summer and winter is 6 °C. The mean temperatures are especially high in the dry season when they vary between 24 and 31 °C. According to the Soil Survey Staff [31], the investigated area’s soil temperature regime is thermic, while its soil moisture regime is torric. Sedimentary non-consolidated deposits from the quaternary era, which are divided into four types of deposits—young deltaic, Fluvio-marine, young Eolian, and old Eolian—classify the central region of the Nile Delta. The district of Kafr EL–Zayat, is notable for its textile industry. The surface irrigation system is essential to the farming system in the studied area. Instead of taking into account the recommendations made by the relevant authorities, the amount of additional chemical and organic fertilizers that produce heavy metal contamination in the research region is normally determined by the Egyptian farmer based on his personal experience [32].

2.2. Analysis of Selected Samples

To determine the level of soil contamination, fifty random soil samples were selected, as shown in Figure 2. To prepare the collected soil samples for analysis, they were stored in plastic bags at a temperature of around 4 °C after being air-dried and crushed to pass through a 2 mm sieve. The distribution of particle sizes was determined using the Bouyoucous hydrometer method [33]. The pH of the soil in a suspension of 1:2.5 soil to water was measured using a pH meter. Soil electrical conductivity (ECe) was assessed in a soil paste extract using an EC-meter. According to the Walkley and Black procedure [34], soil organic matter (SOM %) was determined. A mixture of hydrofluoric acid and concentrated nitric acid was used to digest soil the samples [35]. The concentrations of Cd, Mn, Pb, and Zn were measured by inductively coupled plasma mass spectrometry (ICP-MS model Prodigy Plus).

2.3. Indices of Contamination

2.3.1. Geoaccumulation Index (I-Geo)

By contrasting the recorded levels of measured heavy metals with the background values, the I-Geo demonstrates contamination. The calculation for the geoaccumulation index employed the following equation [36]:
I geo = l o g 2 C n 1.5 B n
where Cn is the heavy metal concentration, as determined by soil sample analysis, and Bn is the geochemical background concentration, as seen in the average upper crust Muller- [37] identified seven pollution levels according to the Igeo values, which are presented in Table S1.

2.3.2. The Contamination Factor (CF)

The contamination factor (CF) of each metal in the study was computed by dividing the total concentration of each measured heavy metal by the background value. The CF arranges pollution levels into four categories, as set by Hakanson [38] (See Table S2).

2.3.3. Improved Nemerow’s Pollution Index (In)

The improved Nemerow’s pollution index’s adoption allowed for a thorough assessment of the soil ecosystem’s condition. The following equation was used to determine the modified formula offered by Guan et al. [39] for each sampling site:
I n = ( I geomax 2 + I geoave 2 ) 2
where Igeomax is the maximum possible value for Igeo, and Igeoave is the numerical average of Igeo. There are seven categories of pollution based on the value of In, as outlined in Table S3.

2.4. Statistical Analysis

Using SPSS version 25, the statistical analysis for the studied soil properties and heavy metals was computed and the variables were normalized using Z-scores [6]. The Pearson correlation coefficient was utilized to show linear relationships between studied variables. The samples’ suitability for PCA was assessed using the Kaiser–Meyer–Olkin (KMO) approach. The data were appropriate for PCA if KMO values were greater than 0.5 [40]. The dataset was divided into PC variables using principal component analysis (PCA) to eliminate multicollinearity between the original variables. To further confirm the data fitness for PCA, the Bartlett test was applied, and the results revealed that p < 0.05 [41]. Heavy metal data were clustered using hierarchical cluster analysis (HCA) to analyze their behavior, sources, and origins. Understanding the relationships between the various heavy metals was made easier by this analysis [42,43].

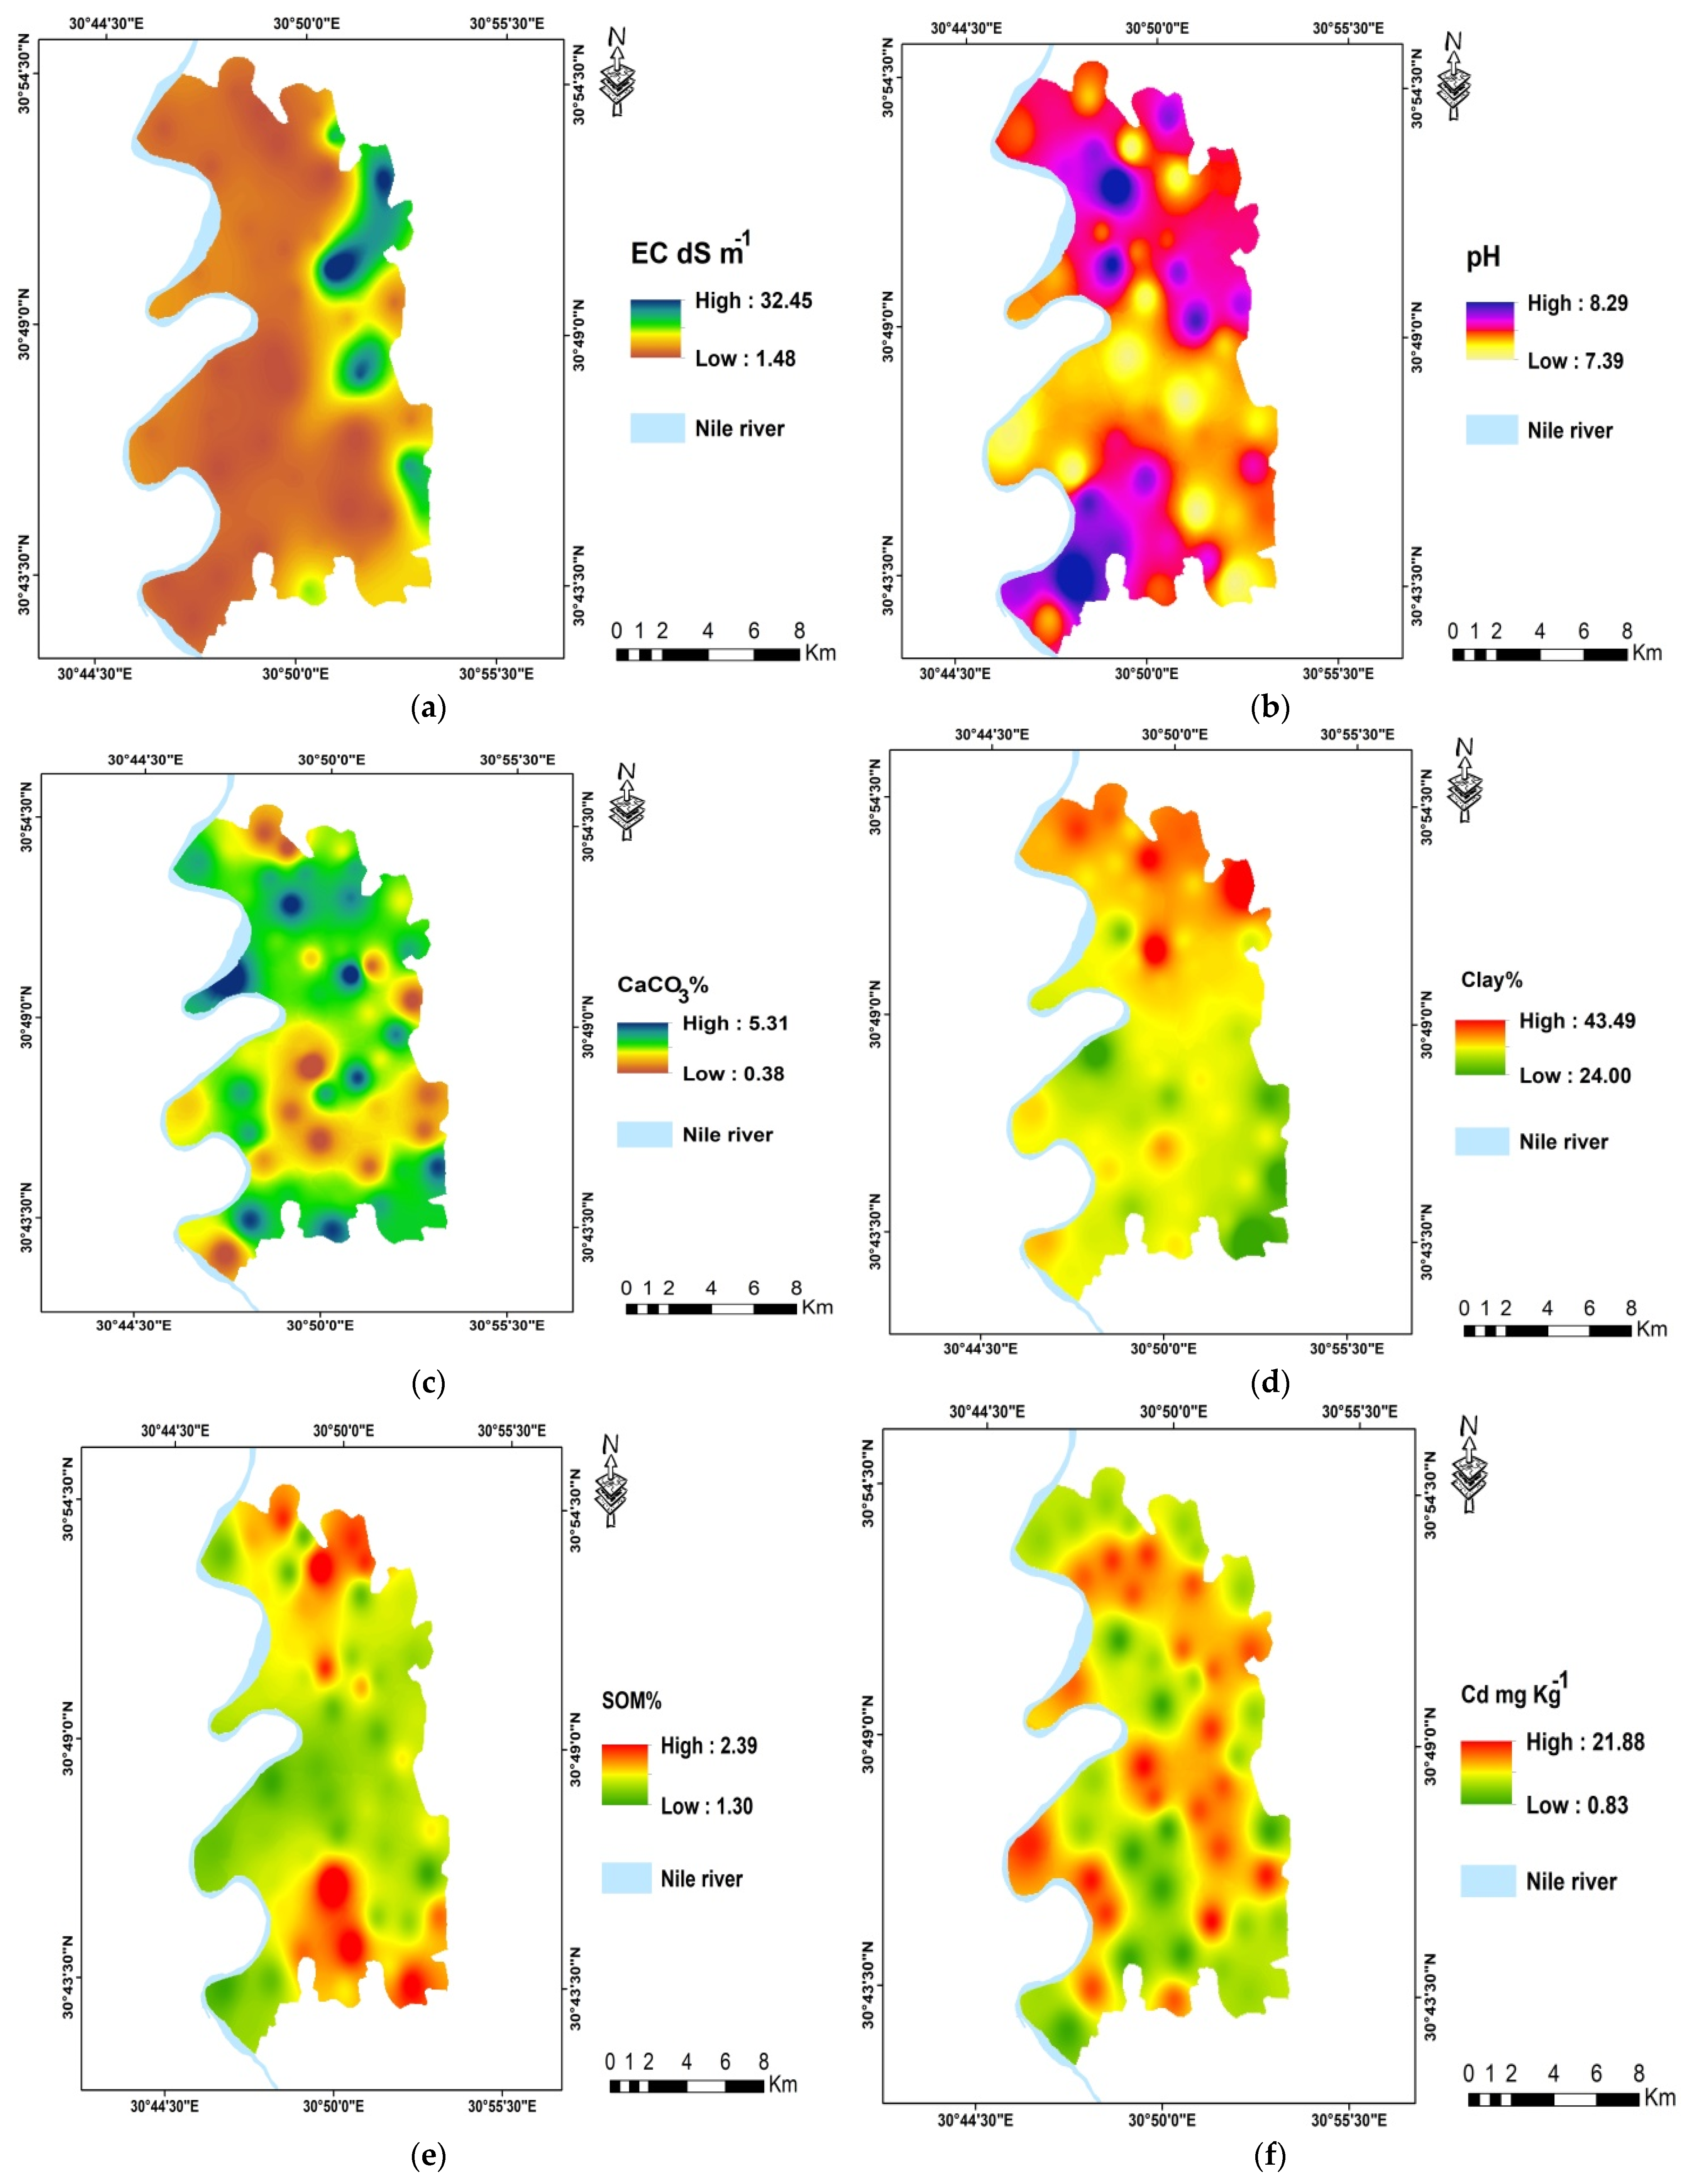
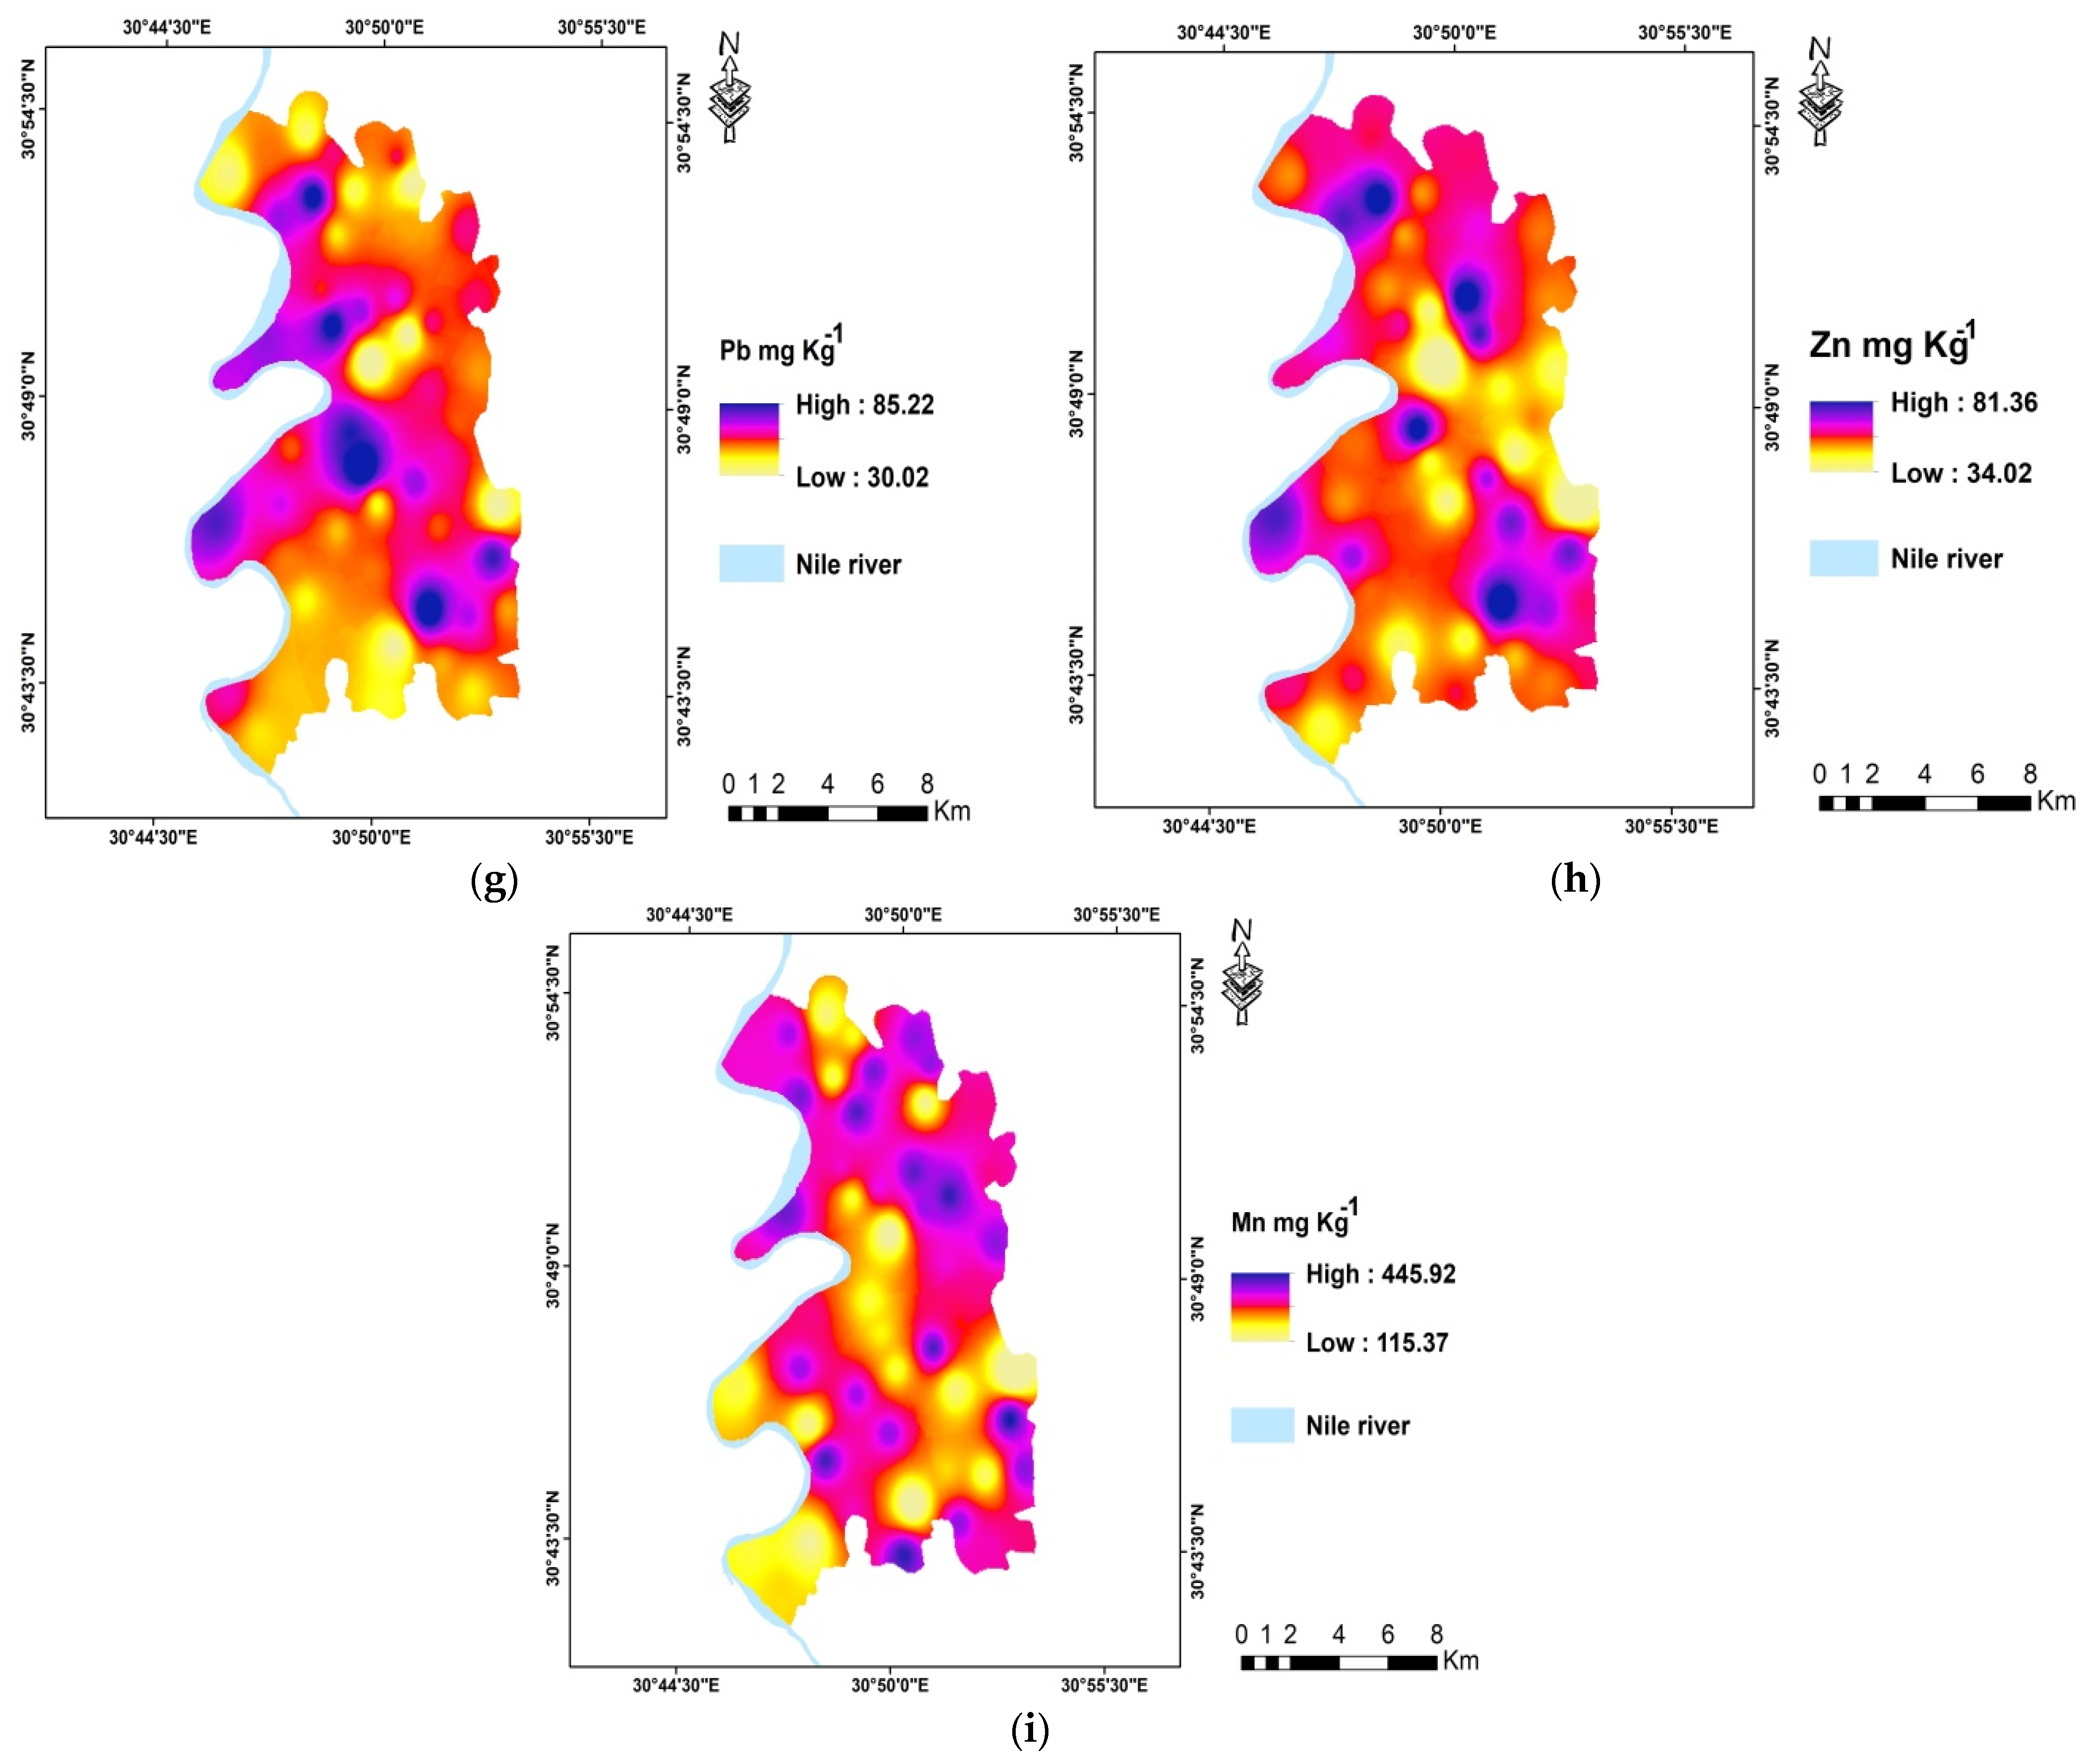
2.5. Heavy Metals and Some Soil Properties’ Spatial Variability Maps

The ArcGIS Spatial Analyst 10.4 extension provides spatial data analysis capabilities that model geographically referenced data using statistical theory and methods. The interpolation techniques of ArcGIS Spatial Analysis were utilized to obtain the intervening values from data for four heavy metals. A technique for interpolation called the weighted inverse distance (IDW) makes use of data that have been measured close to the prediction point. A stronger weight is given to the points nearest to the prediction site, with the weight being a function of distance. The values measured closest to the prediction site have a greater impact on the expected values of the distant ones. IDW is effective, which is a benefit for mapping the spatial distribution of heavy metals [6,44]. The presence of other sources, such as agricultural and industrial drainage directly affects the concentration of elements in the soil, which varies depending on the distance from the source, making it preferable to use the IDW method in this study because the concentration of elements is not due to natural sources.

2.6. Remote Sensing Data

Using 13 spectral bands of the MSI (Multispectral Imager) instrument, Sentinel 2 satellite images acquired in 9/2021 from the European Space Agency (ESA) offer high-resolution multispectral optical imagery with four bands at 10 m, six bands at 20 m, and three bands at 60 m spatial resolution. The digital image preprocessing (radiometric calibration and atmospheric correction) was performed using ENVI 5.3 software [45]. Thereafter, a supervised classification (maximum likelihood) was accomplished to identify the land use/land cover classes.

3. Results and Discussion

3.1. Relevant Soil Characteristics and Heavy Metal Concentrations

Table 1 and Figure 3 provide descriptive data for the investigated Cd, Pb, Zn, and Mn total concentrations. Total cadmium concentrations ranged from 0.82 to 21.89 mg kg−1, with an average of 11.26 ± 7.57 mg kg−1. Increasing concentrations toward the eastern regions of the soil sample’s spatial distribution map for Cd were observed in Figure 3f. The extensive use of phosphate fertilizers, herbicides, and sewage sludge is associated with cadmium soil contamination [23]. Therefore, soil protection procedures are required to maintain or improve the current situation by preventing any further Cd contamination, such as controlling Cd in phosphorus fertilizers, as the majority of this Cd enters the human body through food materials which accumulate Cd from the soil [46]. An average of 54.15 ± 11.97 mg kg−1 of lead (Pb) is present in the whole content. The spatial distribution maps of heavy metals are crucial for identifying potential sources of enrichment and locating areas with high levels of pollution [2]. The Pb spatial distribution map showed increasing concentrations in the western parts, as seen in Figure 3g. The irrigation canals and drainages in these areas (close to urban sites) are subject to several types of pollution that may be brought on by human activity and agricultural management practices in these areas, such as the application of fertilizer. The main route of exposure to Pb is through the food chain, although it can also be acquired through the consumption of dust and soil [47]. Lead (Pb) can harm the brain and neurological systems, even at relatively low lead levels, especially in children. Consequently, a thorough evaluation of the risk caused by Pb in topsoil is necessary. The greatest concentrations of Mn and Zn are both spread over the research area and do not represent any particular patterns, as seen in Figure 3h,i. The total zinc concentrations had an average value of 61.29 ± 9.50 mg kg−1. Although humans and plants both require zinc, an excessive amount can be harmful [48]. It might cause instant harm, which could lead to immune system and digestive system issues. Additionally, high zinc levels may inhibit copper absorption, resulting in copper deficiency symptoms [46]. The total Mn concentration was 115.25–446.05 mg kg−1, with a mean of 330.06 ± 22.29 mg kg−1. Except for Mn, all of the studied heavy metal concentrations were higher than background levels [36]; nonetheless, Cd and Pb are above the permissible values set by the DEA [49], while Zn and Mn are lower than these levels, as shown in Table 1 and Table 2. The ECe values in the research region range widely, from 1.45 to 32.30 dS m−1, with an average of 7.52 ± 8.32 dS m−1. The northeast of the research region has the greatest value, in line with the area’s spatial distribution of salinity, as shown in Figure 3a. A considerable portion of the planet, particularly arid and semi-arid regions, is affected by the problem of soil salinization [50]. A high saline water table or dissolved minerals in irrigation water are common sources of salts [51]. High osmotic pressure reduces agricultural output, which makes it more difficult for crops to absorb enough water from the soil [52]. The accumulation of salts in agricultural roots results in salinity dangers by significantly decreasing the amount of water available, which harms crop productivity [53,54]. The pH was between 7.39 and 8.30, with an average of 7.70 ± 0.20, for the analyzed soil samples. The interpolation map (Figure 3b) revealed the research area’s zone pH values, while some of its northern areas have lower pH values. Soil pH affects soil quality and plant cultivation by affecting the equilibrium of carbonate, the mobility, and availability of heavy metals, and the relative ratio of nitrogen components [55]. The range of calcium carbonate (CaCO3%) content is 0.38 to 2.32 ± 2.79%. Figure 3c displays the spatial interpolation of CaCO3%. The study area’s north and west zones had the highest concentration of CaCO3%. The presence of shell fragments is responsible for high values of CaCO3% within the study area [56]. The SOM% varied from 1.30 to 2.4% (Figure 3d) and this might be used as the only indicator of soil degradation [57], supporting its significance in determining soil quality. SOM is crucial for preserving appropriate soil structure, improving the availability of nutrients that enhance soil fertility, and sustaining the agro-equilibrium of ecosystems [58]. Because of how negatively the dry and semi-arid climatic conditions affect the SOM content due to the high-temperature rise in the rate of decomposition of organic material in the soil, the SOM content is relatively low in the research area. The average clay content within the study area is 33.39 ± 3.64% (Figure 3e). Particle size is thought to play a significant role in determining how well sediment can concentrate and hold trace elements [59]. Fine particles are the primary site for the accumulation of trace elements compared to coarse particles due to their greater specific surface area [60]. It has been noted that when the clay content increases, the concentration of all elements in the various soils increases.

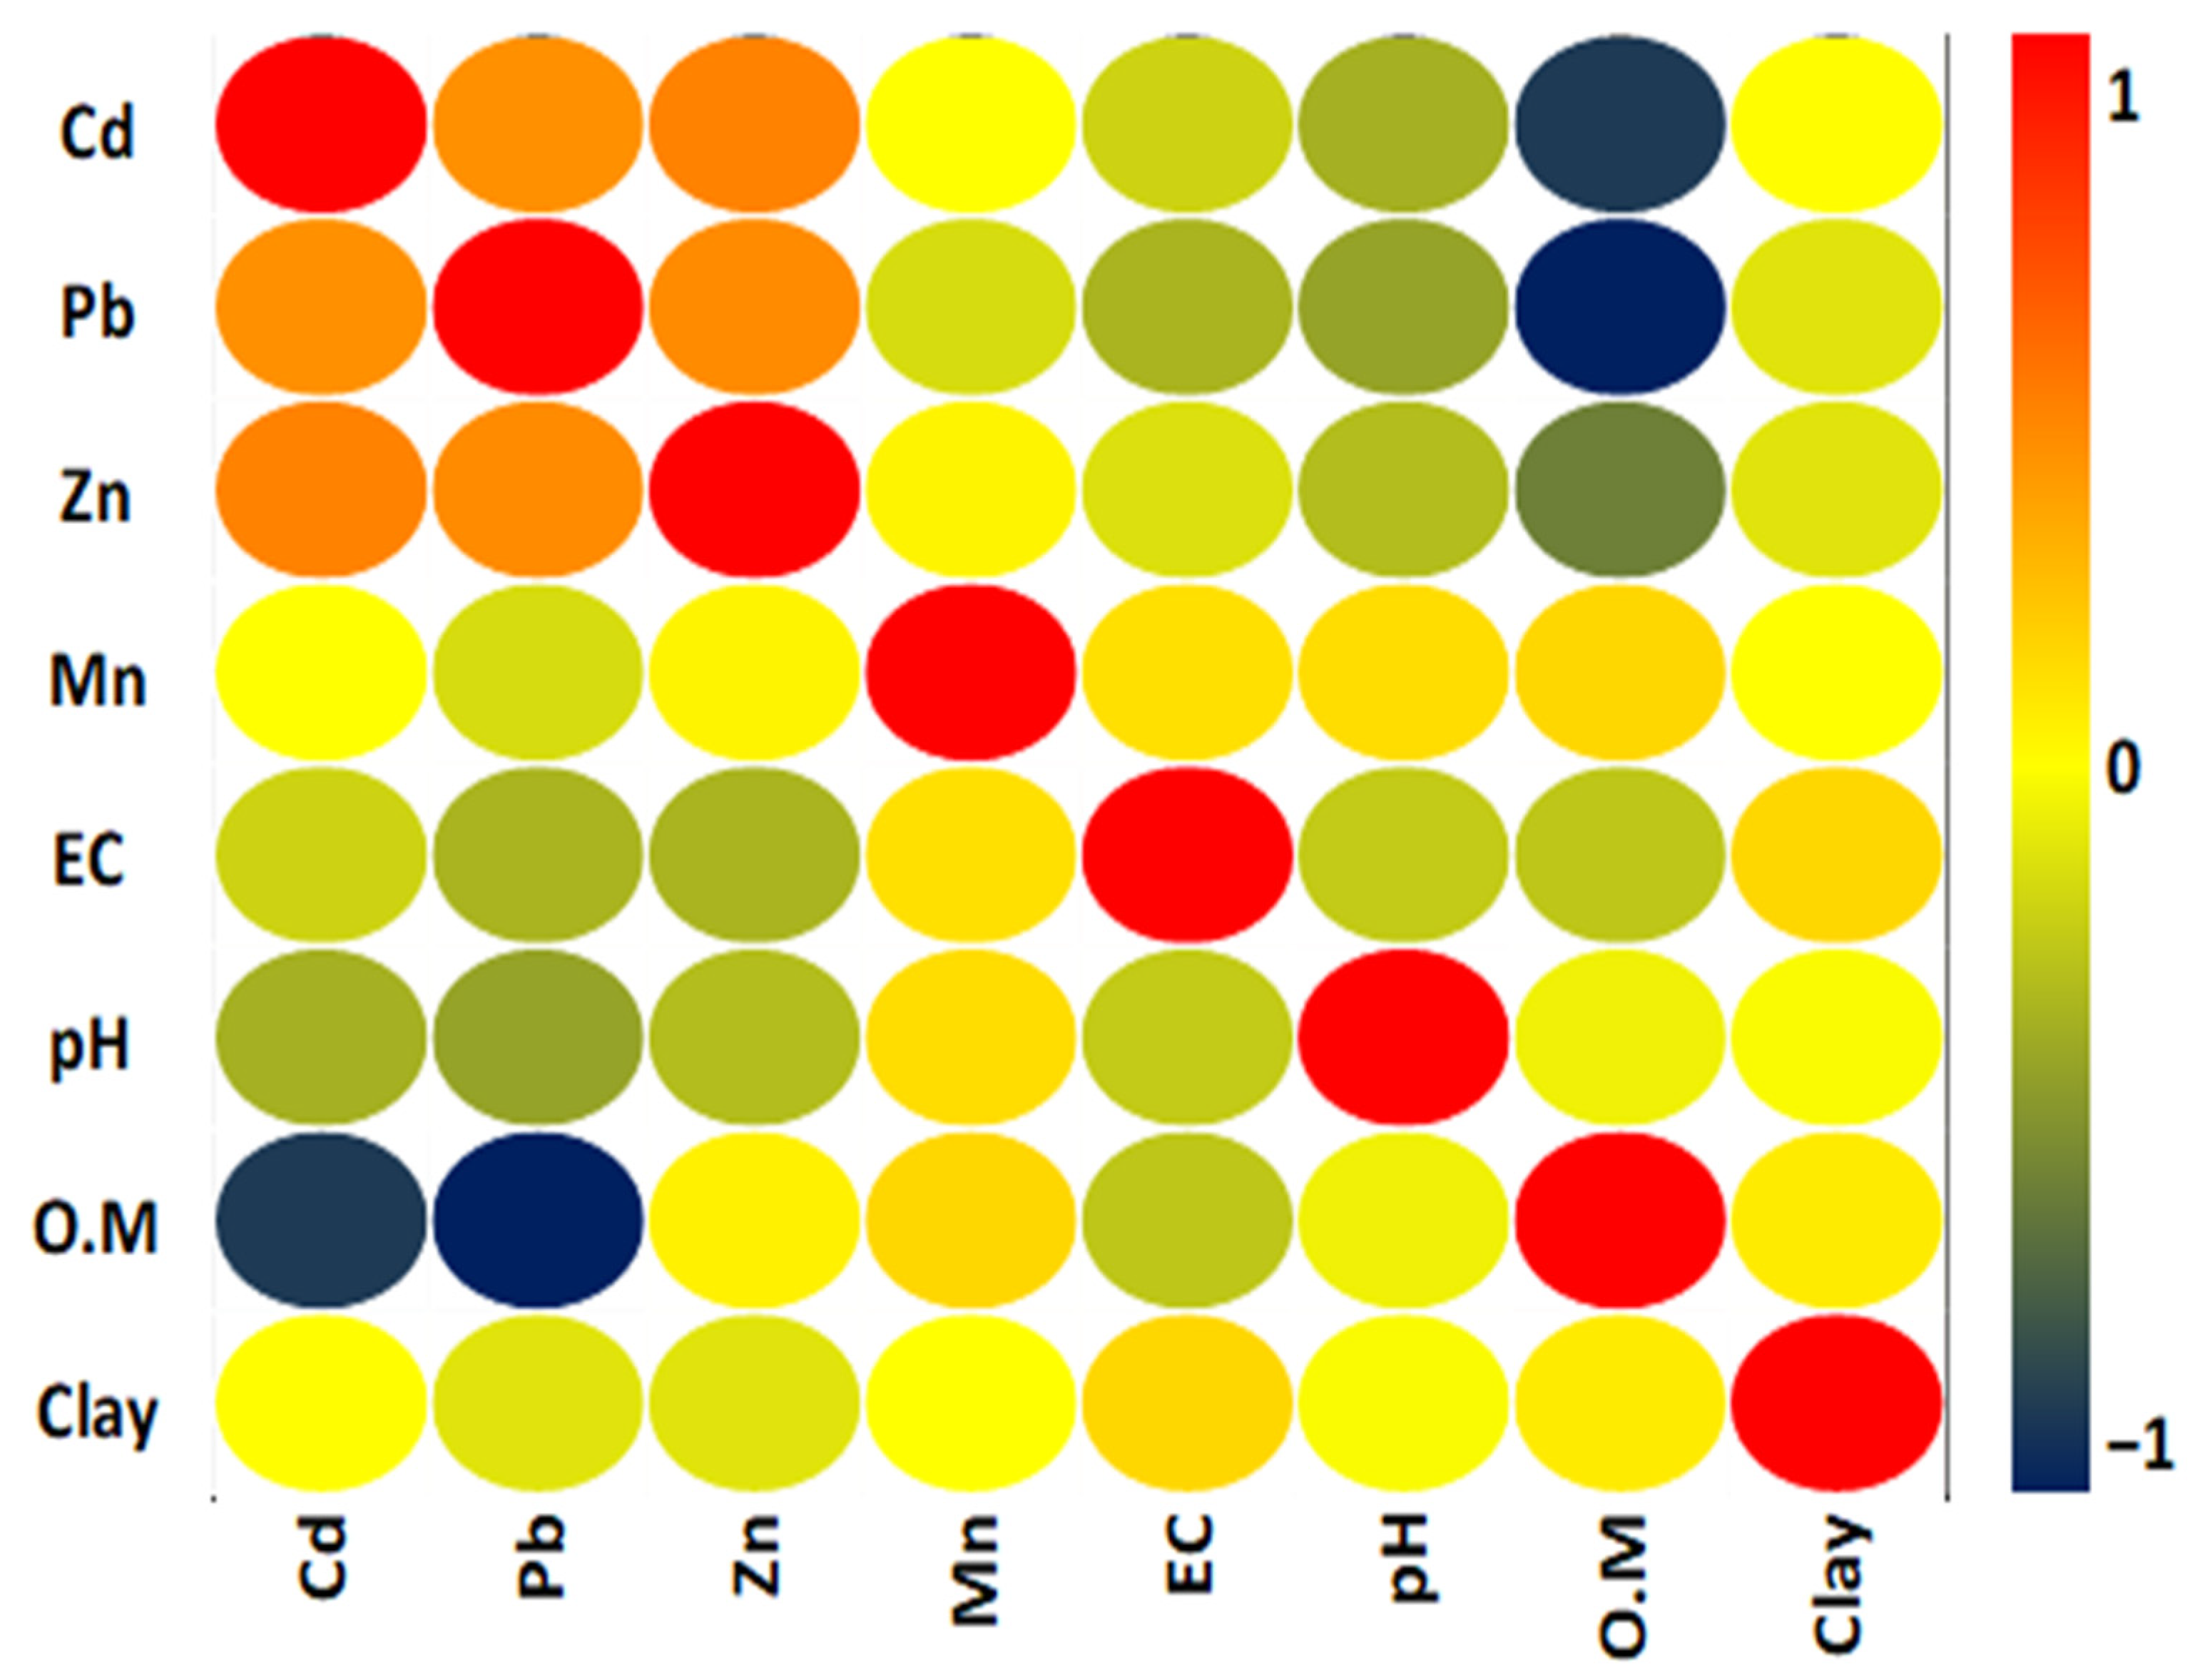
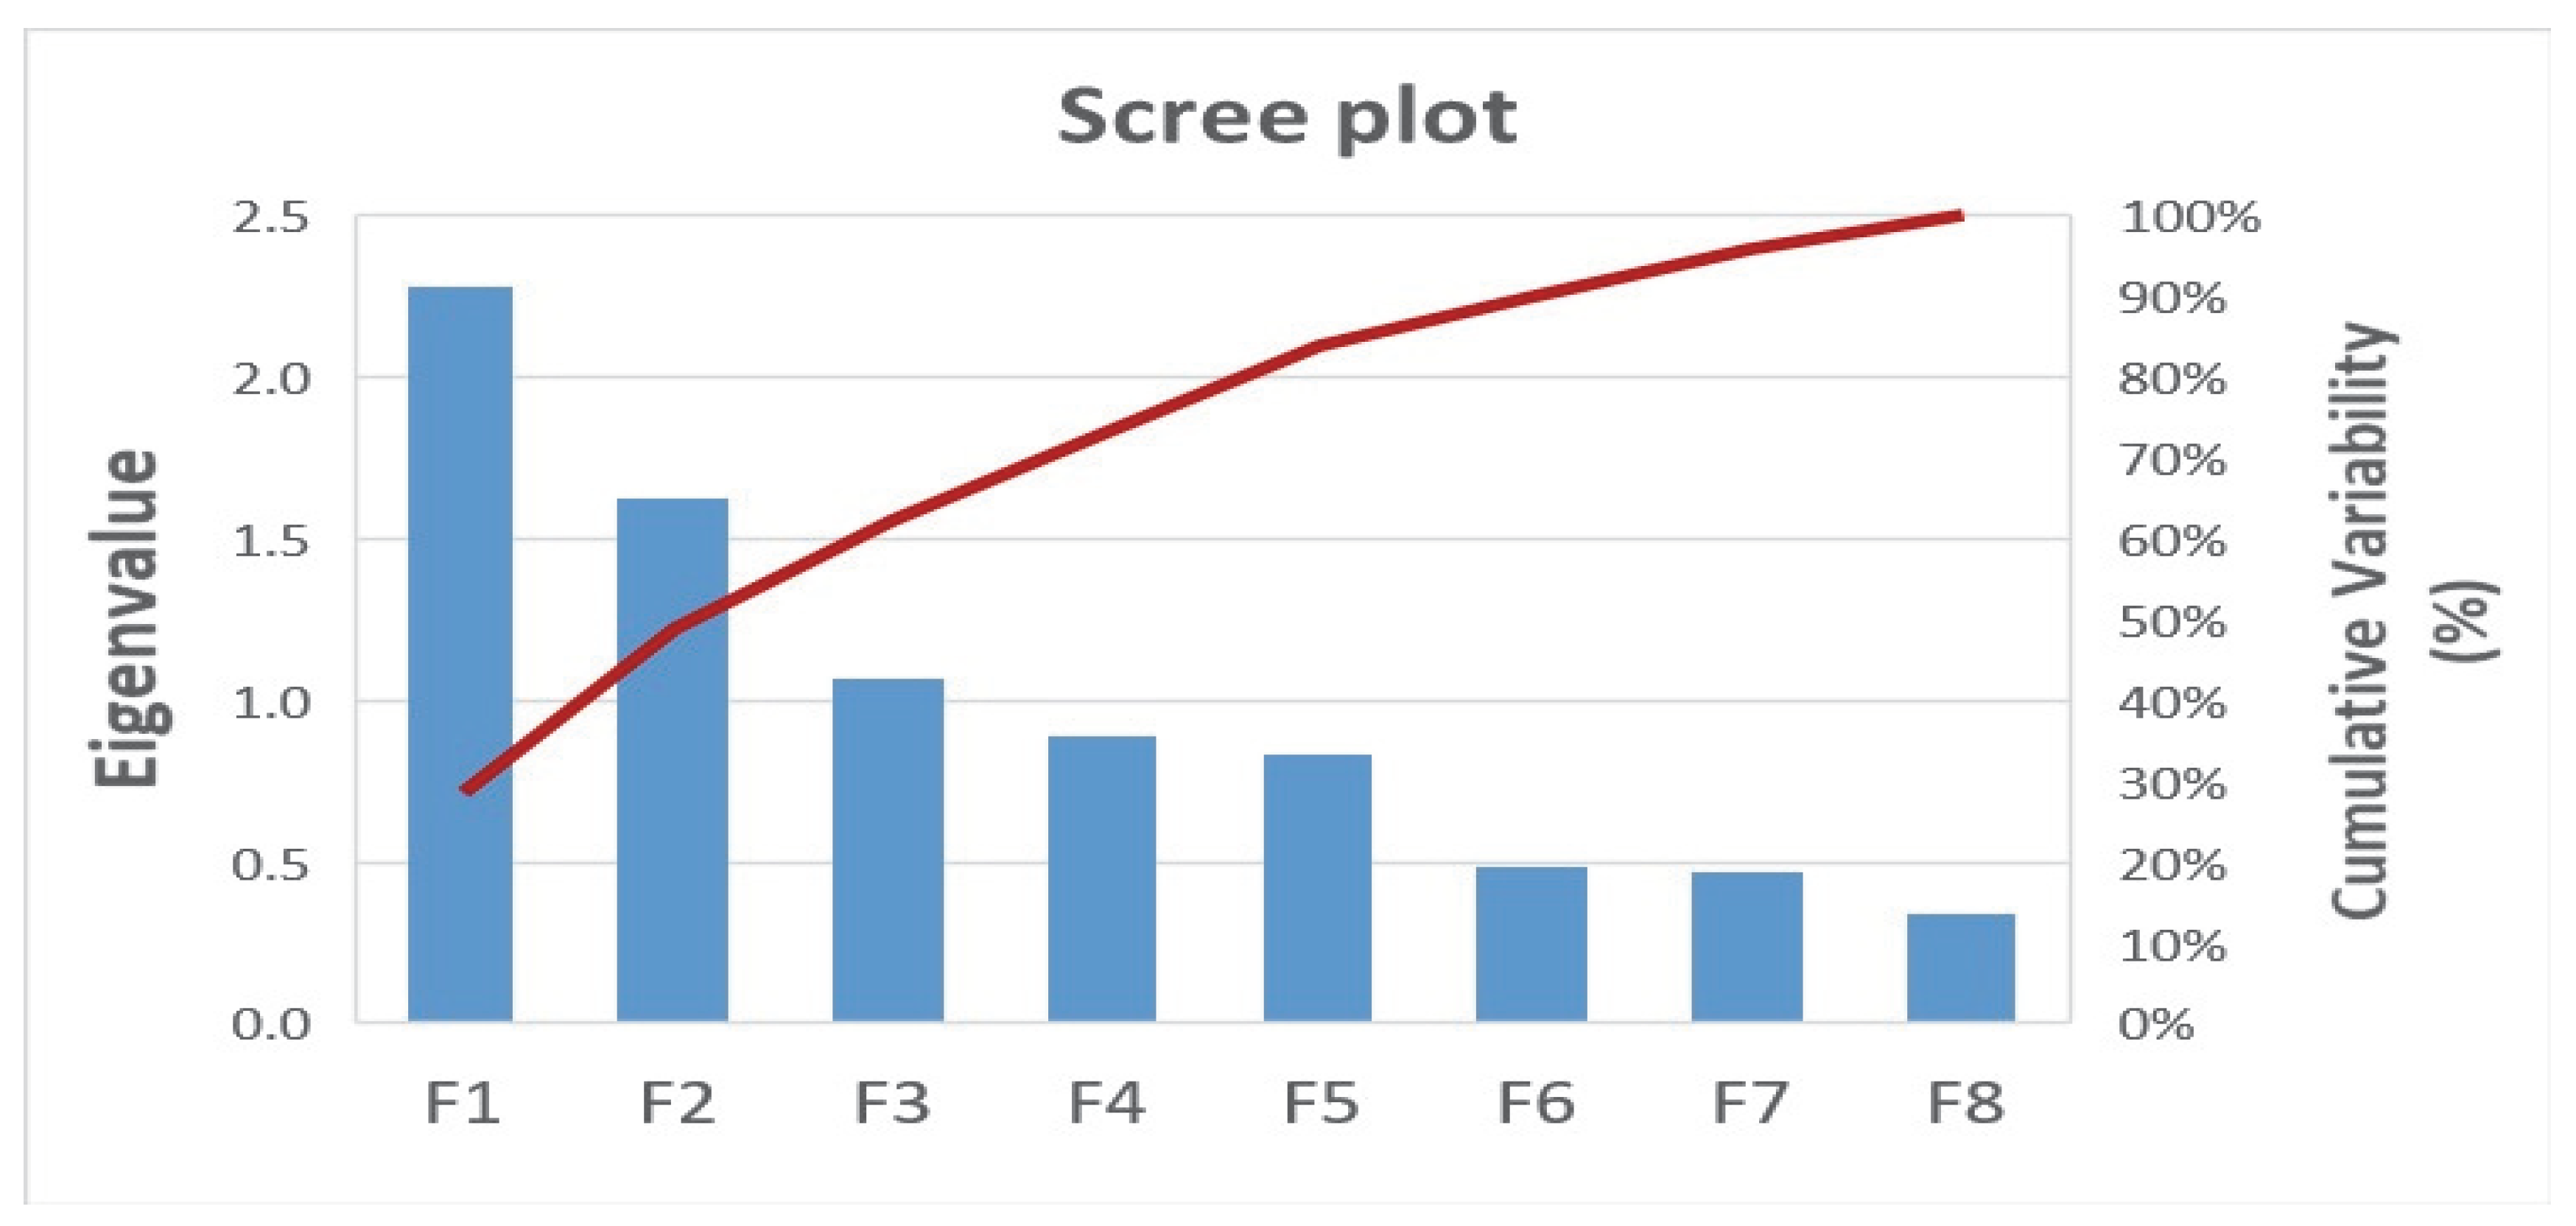
3.2. Principal Component Analysis (PCA)

The Pearson correlation coefficient was calculated at p < 0.01 or p < 0.05. Regardless of correlation significance, soil pH negatively correlated with Cd, Pb, and Zn, while there was a positive correlation between clay content and all variables. However, Cd and Pb content in the soil had a negative relationship with soil organic matter (SOM). A greater association was found between Cd, Pb, and Zn (Figure 4).
The principal component analysis (PCA) groups variables from the original data into factors or principal components [41,61]. In previous research, PCA was applied to evaluate soil contamination with several chosen heavy metals [24,62]. The KMO value was 0.59 (Table S4). PCs with eigenvalues greater than one were kept, while PCs with eigenvalues less than one were disregarded. The first three groups were chosen as a result because their eigenvalues were greater than 1. These three factors are illustrated in Table 3 and Figure 5 as they account for the cumulative variation of 62.10% of the variables under study, with the first component accounting for approximately 1.06%, the second 13.32%, and the third 62.10%.

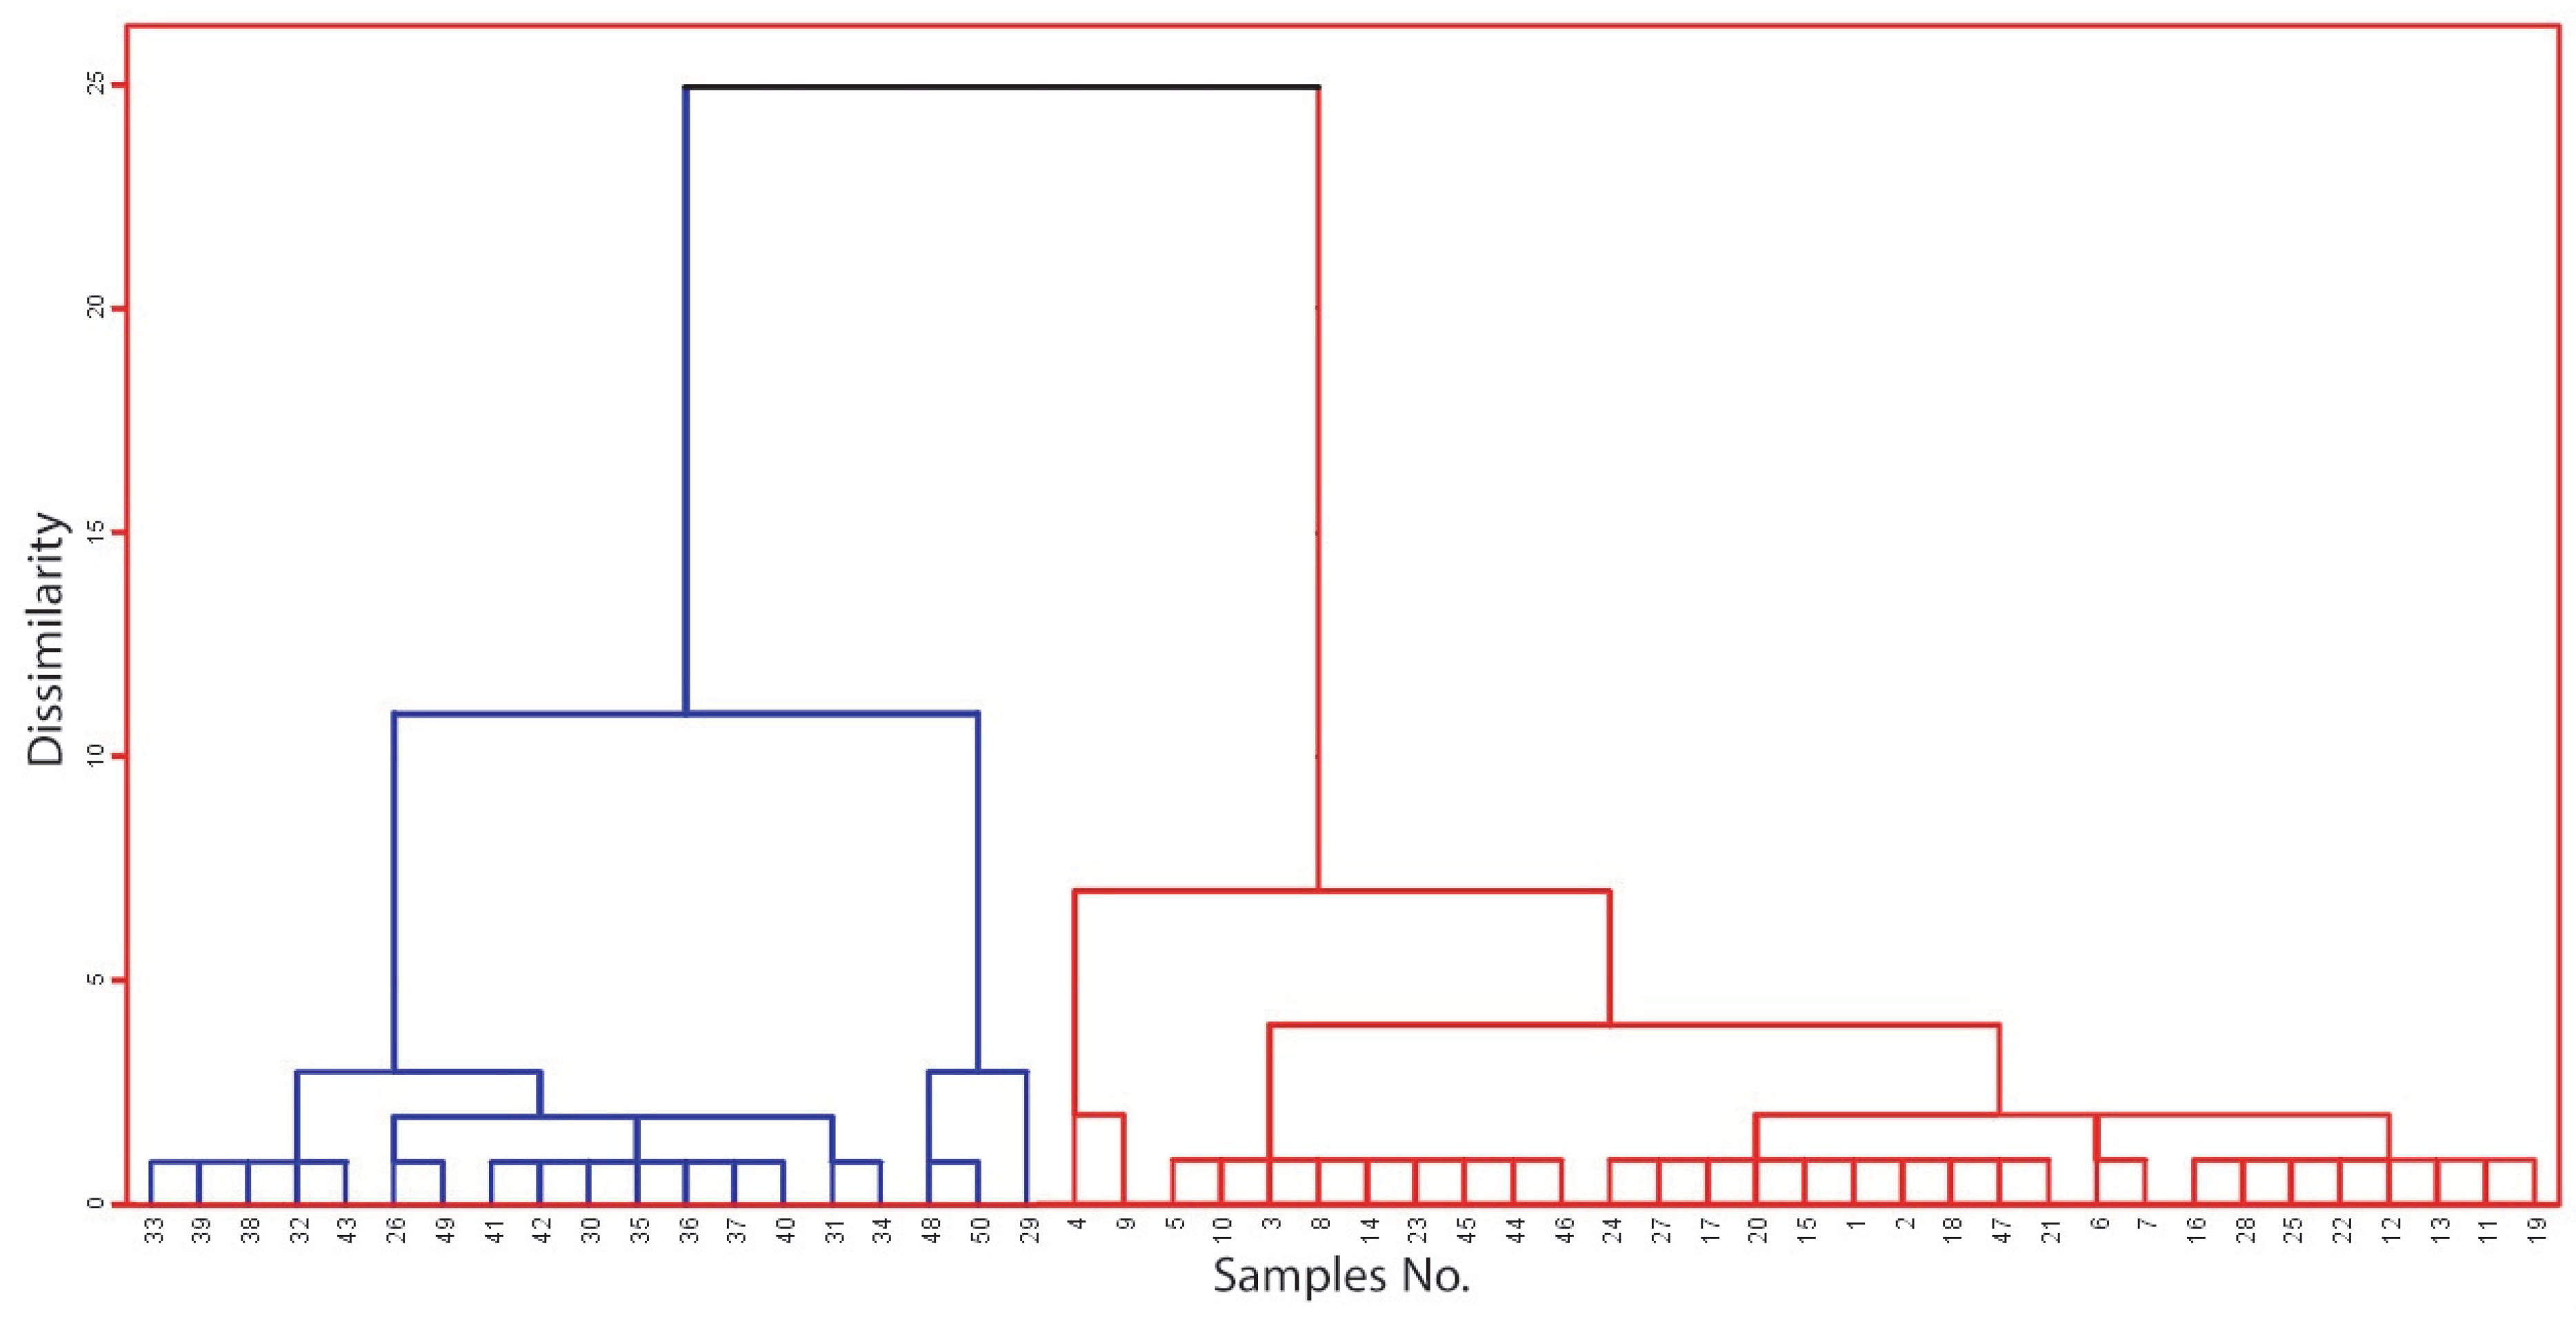
3.3. Based on PCA, Cluster Analysis

The PCA is applied to classify the variables under study into groups, whereas in utilizing cluster analysis, observations are classified. In comparison to other clusters, the cluster contains observations that are comparable to one another [63,64]. The cluster analysis was used widely in soil studies, soil capability, and soil quality [6,43,65]. Additionally, from 1991 to 2018, a clustering analysis was done on data from different types of heavy metal-contaminated soil in India [5]. The AHC divided the data in this investigation into two main categories (clusters). The dendrogram in Figure 6 illustrates how the two clusters differ from one another; each cluster has distinct features. The first cluster, which contains 19 observations, and the second, which has 31 observations, both have distinct ranges, means, and standard deviations (SD) for all variables, according to the descriptive statistics presented in Table 4 and Table 5. Figure 6 displays the position of each cluster observation. These two clusters were taken from the PCA-derived factors (F1, F2, and F3). The acquired results revealed considerable changes in, Pb, Mn, Zn, and EC. On the other hand, the total content of Cd, clay, and soil organic matter did not significantly differ between the two clusters. This might occur as a result of the low levels of organic matter in arid zones [65,66,67].

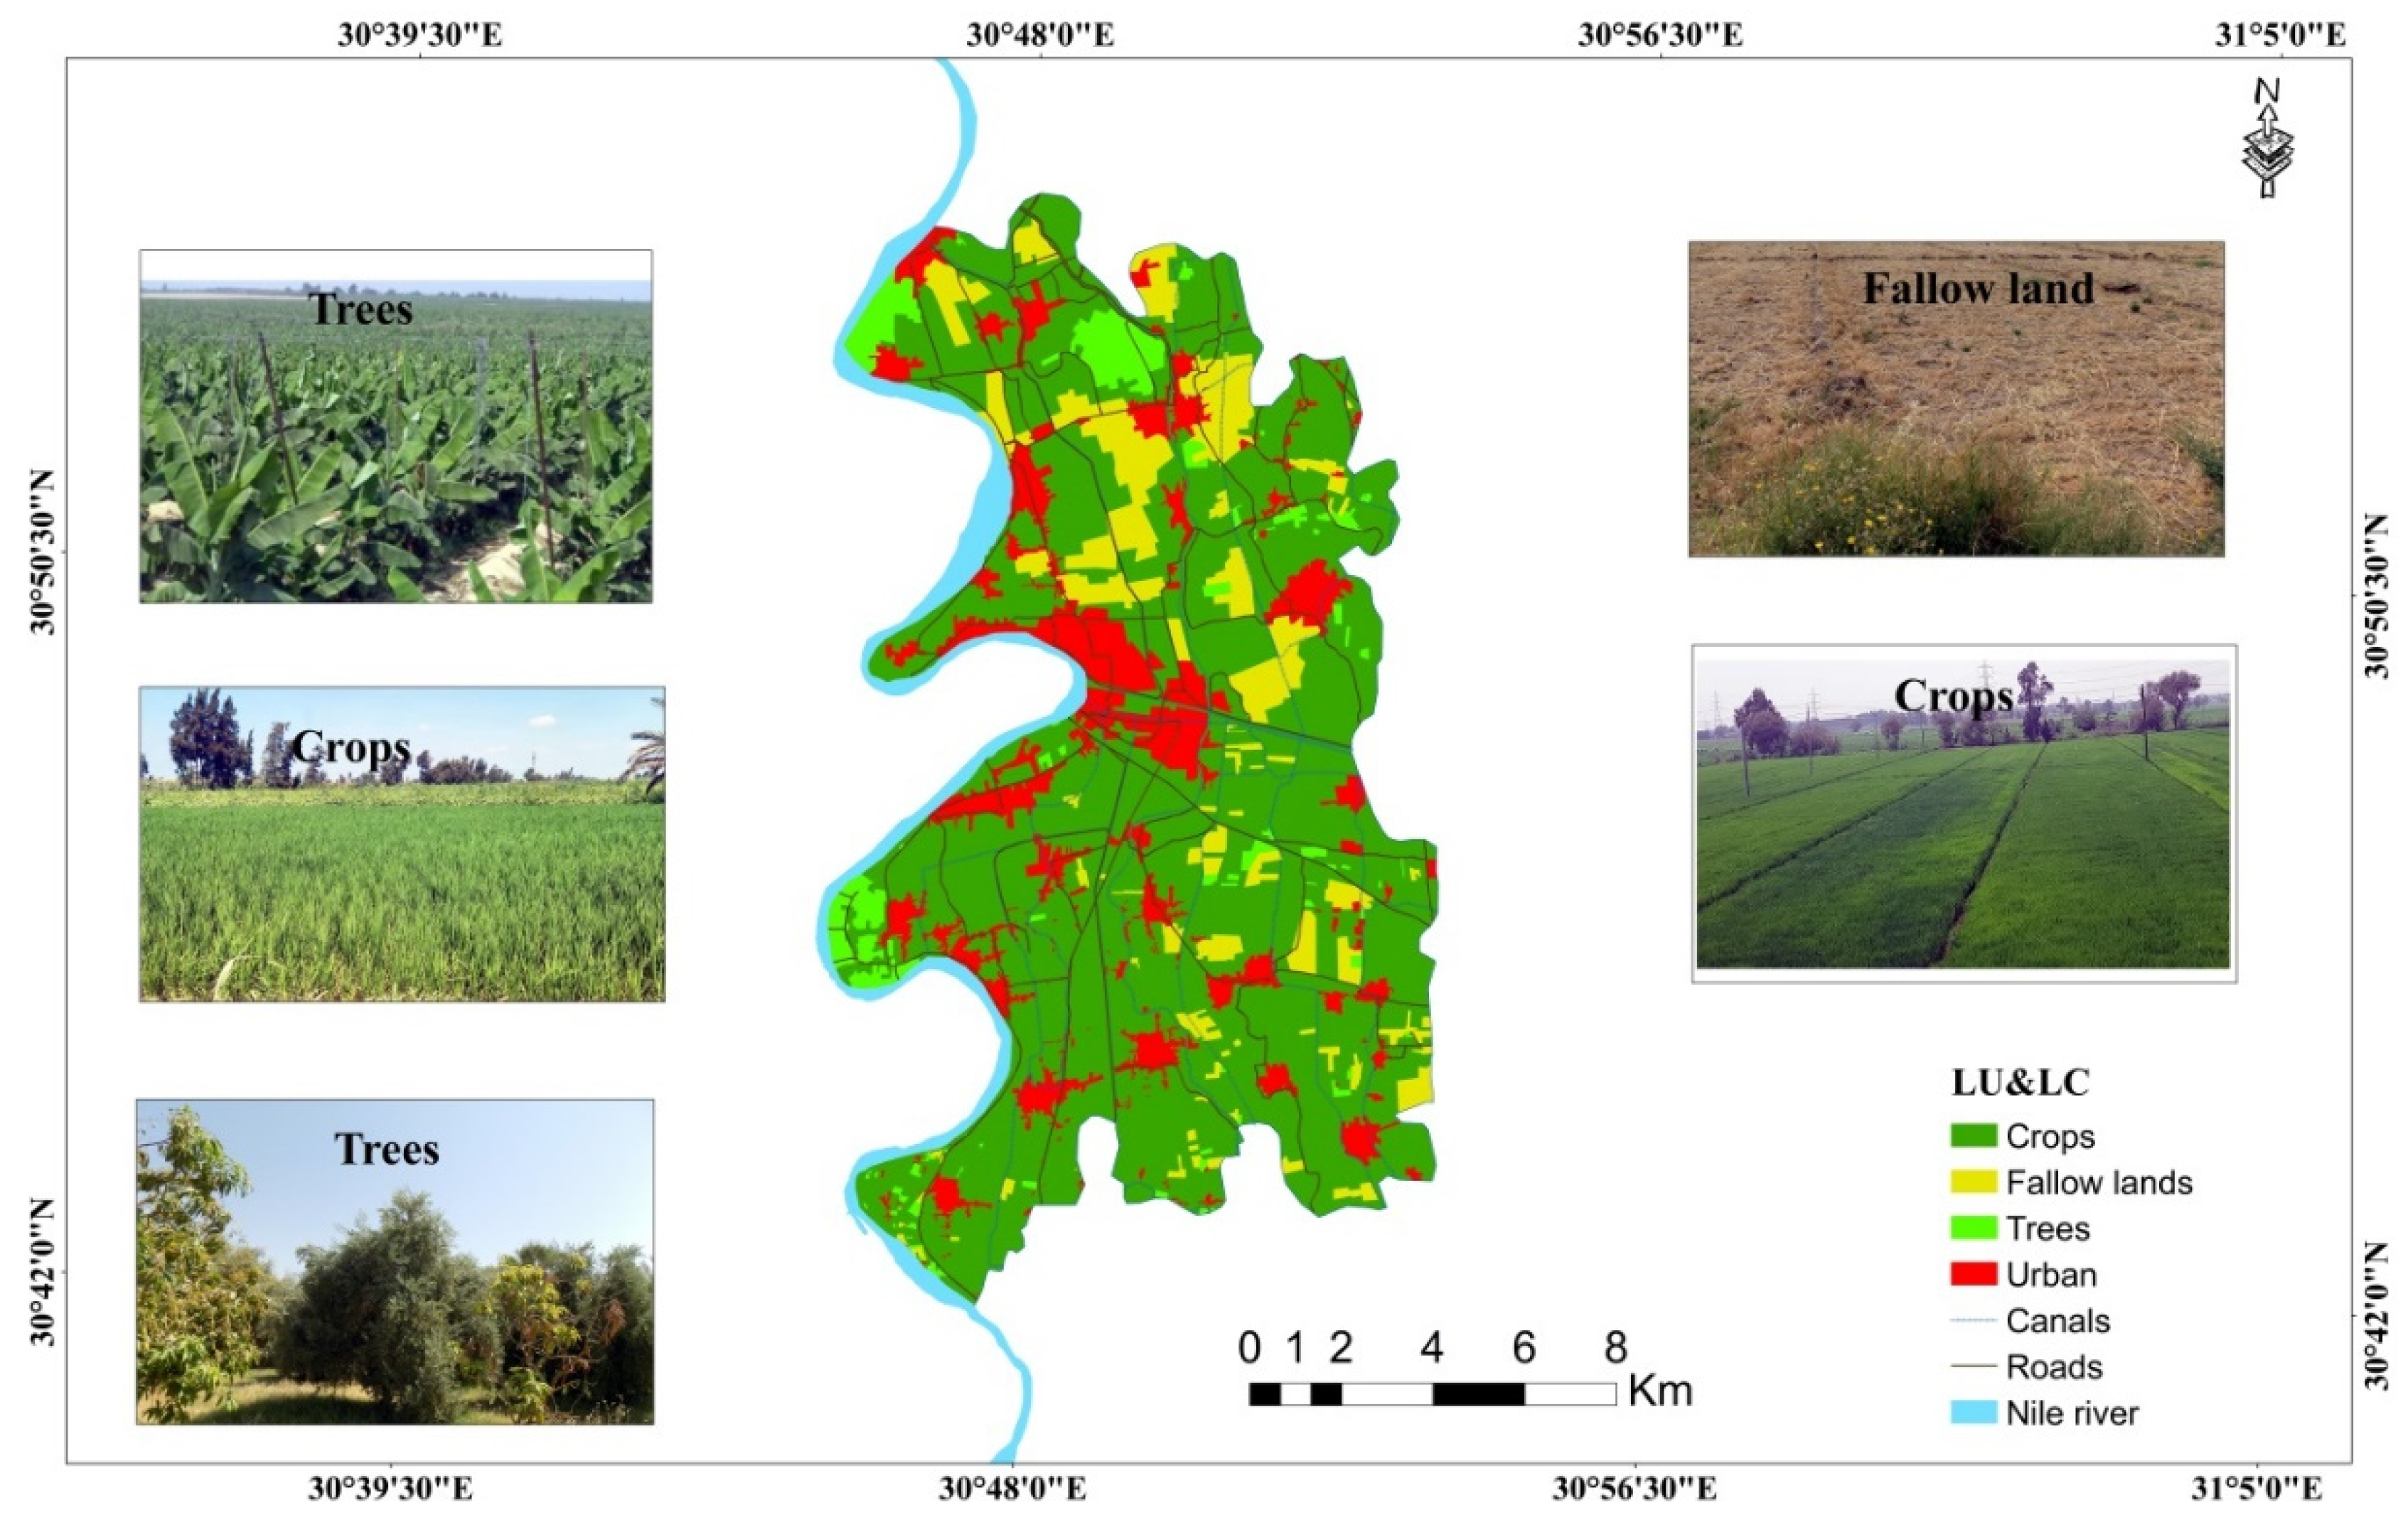
3.4. The Study Area’s Land Use

Figure 7 depicts the land use of the research area which was divided into four primary classes: crops (maize and rice), trees (Citrus, apple, and banana), fallow lands, and urban areas (industrial zones and residential constructions). These classes are the main classes in the Gharbia governorate, Egypt [68]. The dominant classes are agriculture field crops, which account for about 13,890.35 ha of the total area, and urban, which account for about 2754.77 ha of the entire area under study.

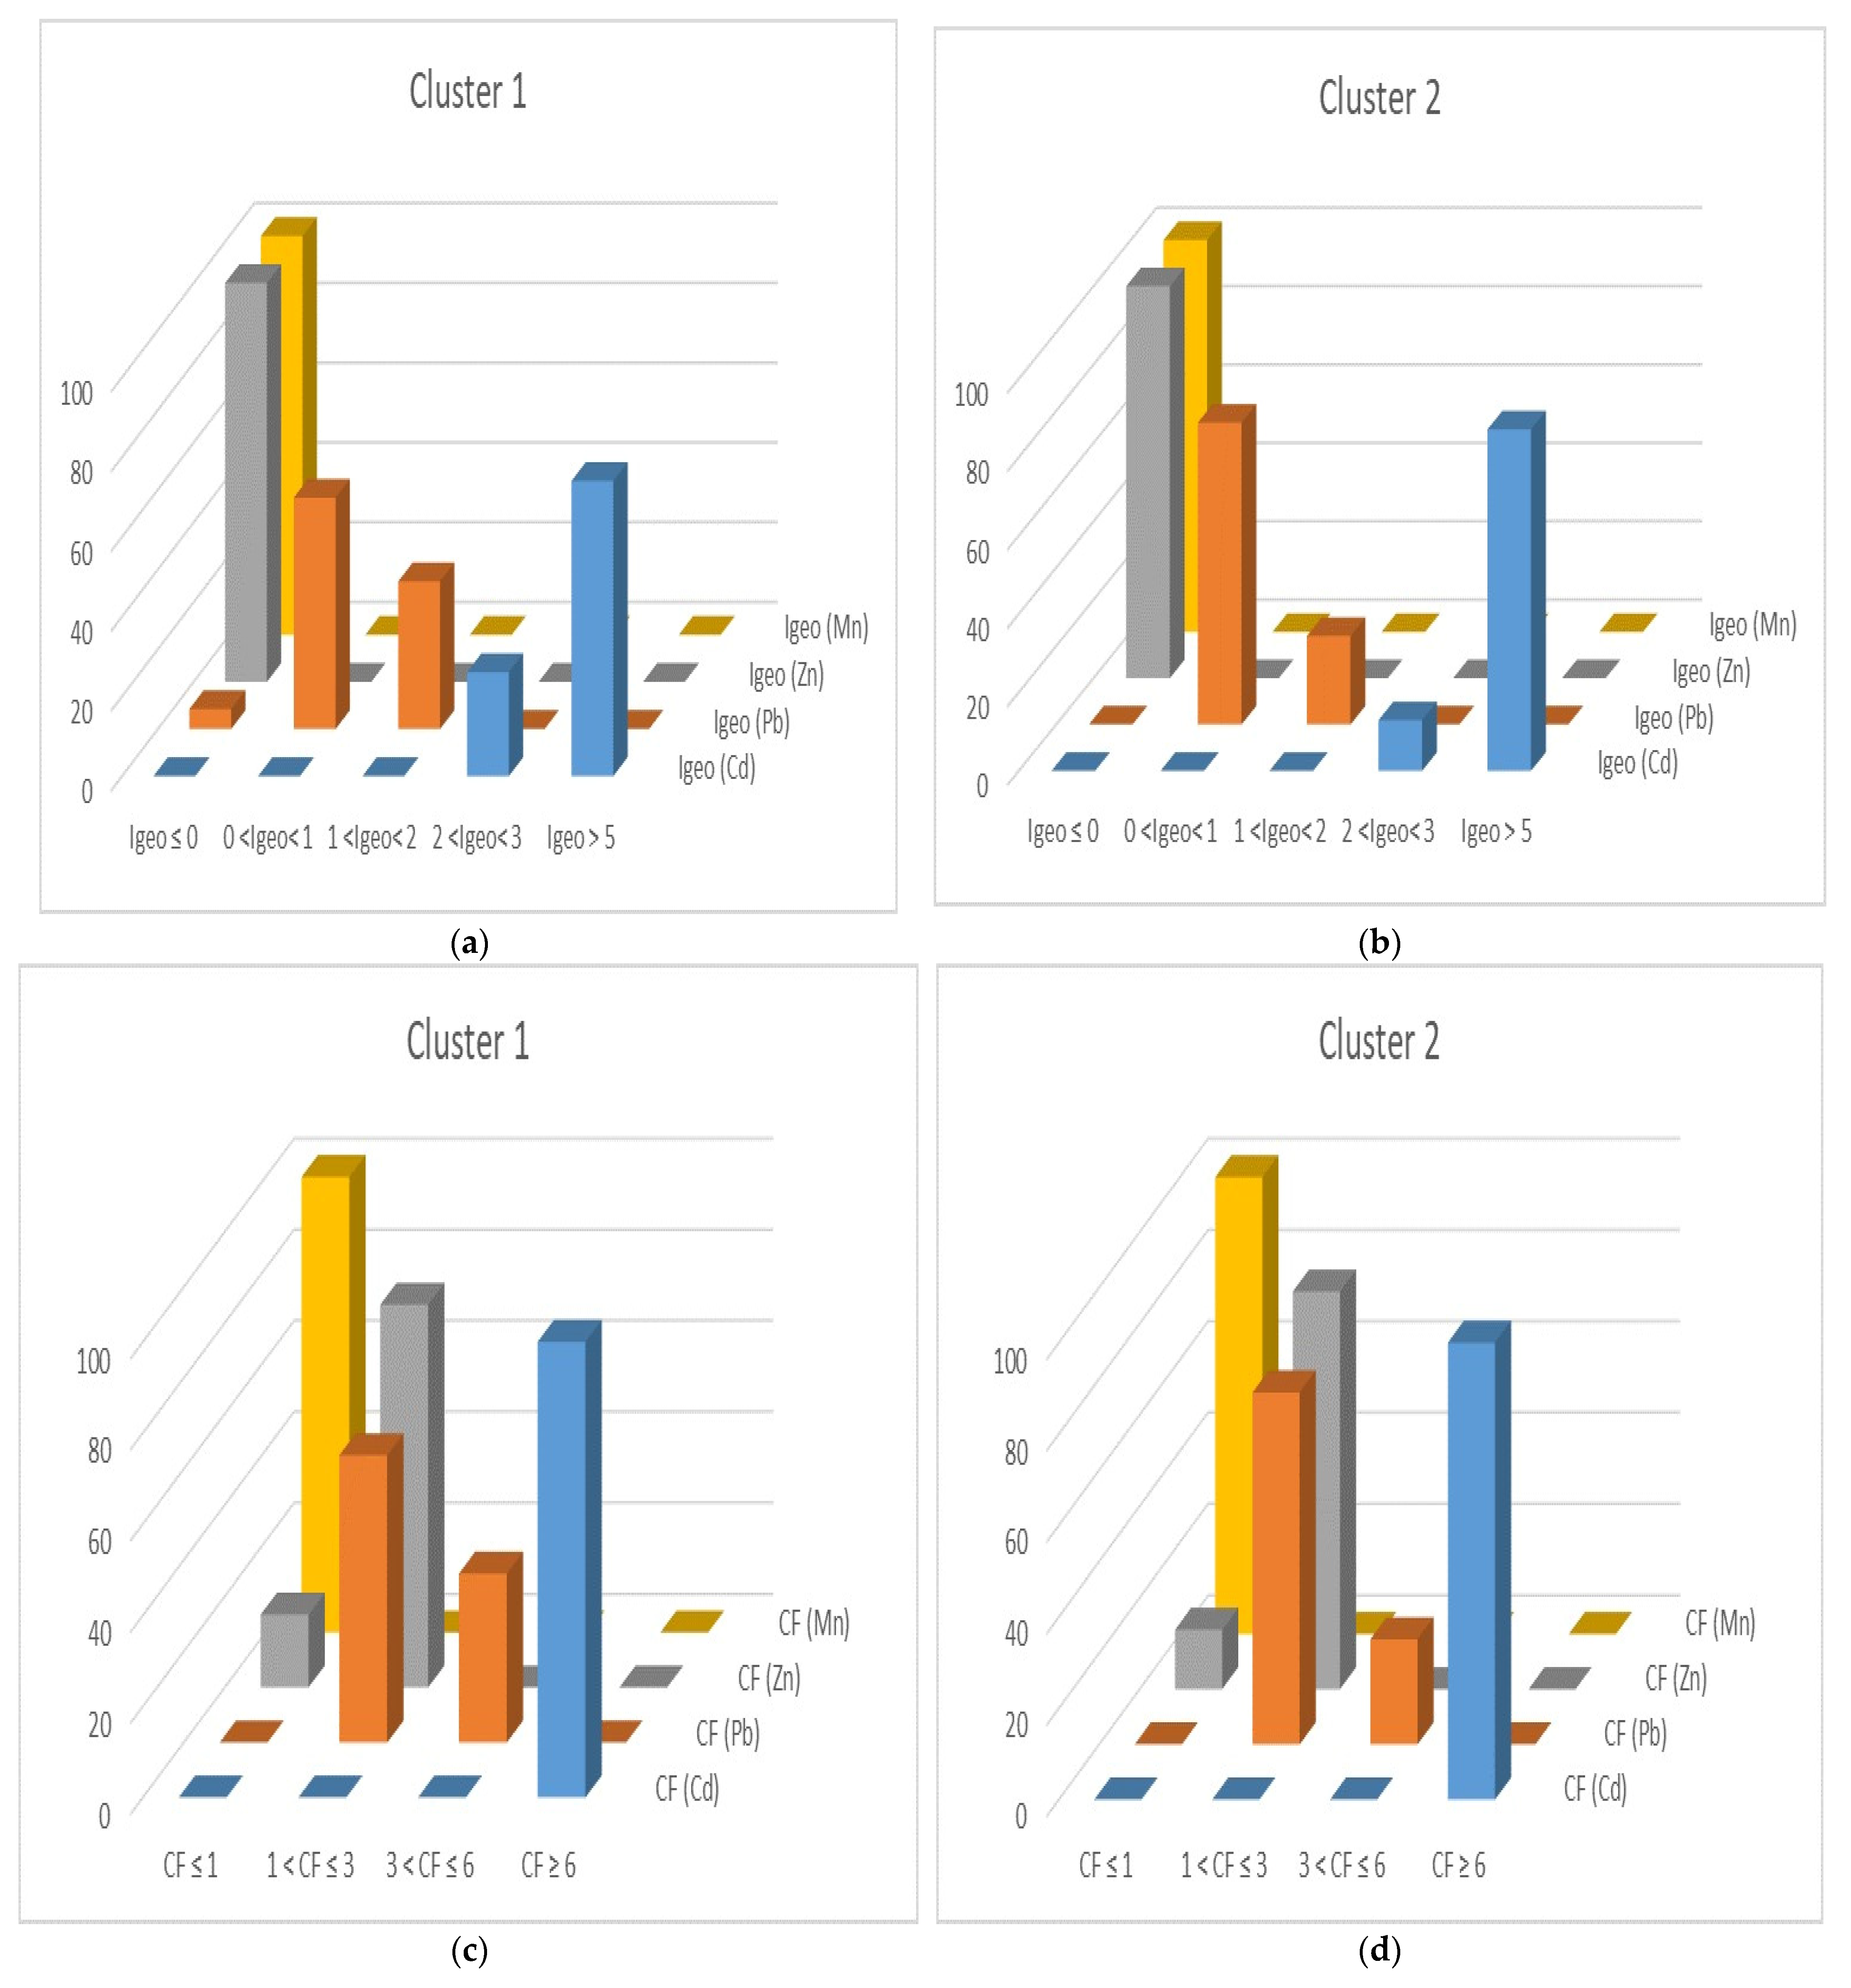
3.5. Geoaccumulation Index (I-Geo) and Contamination Factor (CF)
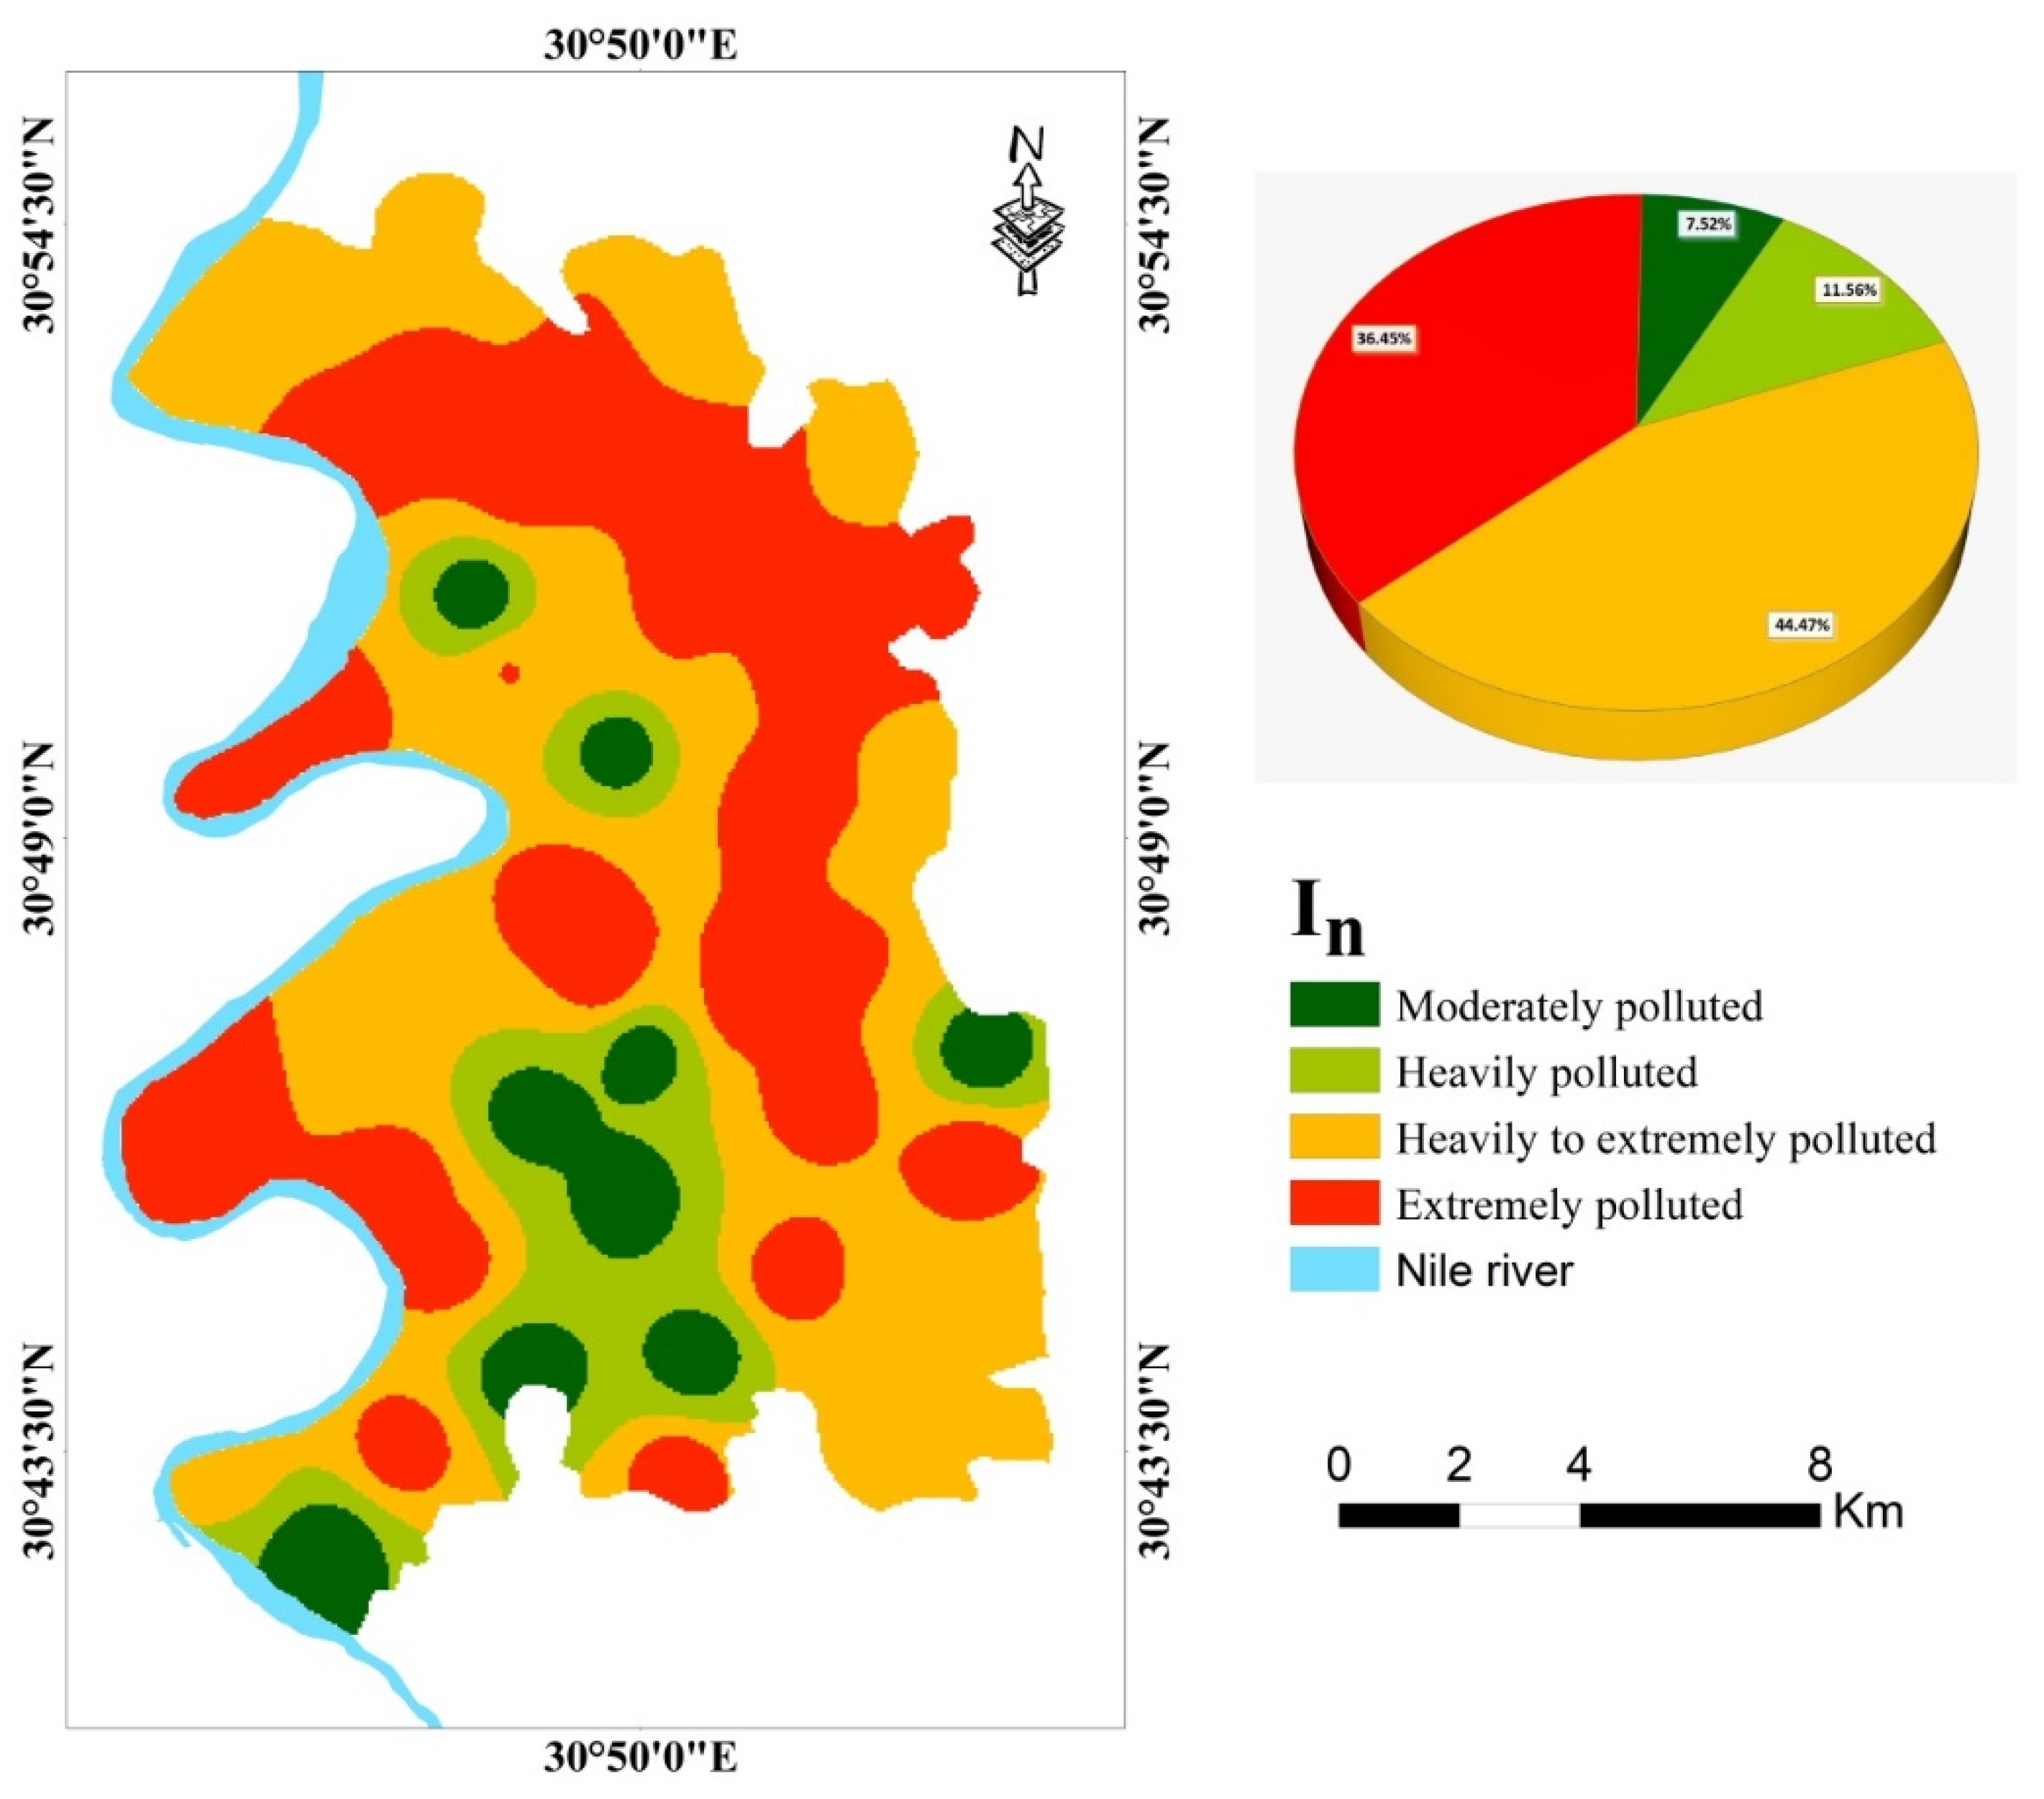
The extent of heavy metal contamination in soil may be determined with the help of PCA and I-Geo analysis combinations [30]. Regarding Mn and Zn, both clusters showed that I-Geo falls in class 0, meaning that no contamination from these metals was found in the samples that were being examined. According to the I-geo of Pb, cluster 1 is uncontaminated, uncontaminated/moderately contaminated, and moderately contaminated, with respective percentages of 5%, 58%, and 37% (Figure 8a). Additionally, cluster 2 had a relative proportion of 77% for uncontaminated/moderately contaminated and 23% for moderately contaminated (Figure 8b). Cluster 1 observed Cd I-Geo values of 26% moderately/strongly contaminated and 74% extremely contaminated, compared to 13 and 87% in cluster 2. The CF is widely used to track the level of elemental contamination, estimate the extent of anthropogenic influence, and differentiate between metal origins [69]. The results revealed that the CF of Mn in clusters 1 and 2 is 100% low contamination, while cluster 1 showed two different degrees of Zn contamination, with approximate percentages of 16% for low contamination and 84% for moderate contamination (Figure 8c,d). Cluster 2 recorded low Zn (CF) levels of 13% and moderate Zn (CF) values of 84%. According to Hakanson [38], the findings showed that the Pb contamination factor of cluster 1 indicated moderate contamination (63%) and considerable contamination (37%), while cluster 2 was characterized by 77% moderate contamination and 23% of soil samples had considerable contamination. The results revealed that all soil samples are highly contaminated by Cd in both clusters 1 and 2. These findings show that anthropogenic sources including industrial and agricultural activities have enriched the soil samples in the study area with potentially harmful metals [70].

3.6. Overview of In

The improved Nemerow index (In), which describes integrated contamination levels, was derived as the total of the four heavy metals to assess the soil heavy metal contamination in the research area. The In results for all sampling points indicate that the study area’s In value typically ranges from class 2 (moderately polluted) to class 6 (extremely polluted). The Ins are ordered in decreasing order as follows: heavily to extremely polluted, extremely polluted, heavily polluted, and moderately polluted with areas of 8767.02 (44.47%), 7187.52 (36.45%), 2278.53 (11.56%), and 1483.50 (7.52%) ha, respectively. The majority of the research area where the average concentration of heavy metals was 17.64 ± 2.44, 56.45 ± 8.88, 64.24 ± 8.12, and 343.78 ± 92.75 mg kg−1, was considered to be heavily to extremely polluted by Cd, Pb, Zn, and Mn, respectively, as shown in Table 6 and Figure 9. The extremely polluted class represents the northeast parts of the study area and small areas in the southwest of the study area, where local factories are situated. The distribution of local factors, mineral fertilizer in various amounts, and others brought on by human activities in the management of agriculture maybe the cause of the variation in the contamination indices in the two clusters [71].

4. Conclusions

The assessment of heavy metal contamination in the soil of the middle Nile Delta, which represents one of the most serious challenges to food security and sustainable development, is highlighted in the current study. The results revealed that GIS is a helpful tool for storing, retrieving, and manipulating a sizable amount of data required to map various heavy metal concentrations and soil properties. Additionally, the combination of PCA and HCA produced interesting classification findings, dividing the research area into two zones with distinctive heavy metal concentrations and patterns. The findings showed that all soil samples from clusters 1 and 2 have high levels of Cd contamination. According to the In data from each sampling location, the research region frequently falls into classes 2 (moderately polluted) through 6 (extremely contaminated). Most of the study region was declared to be heavily to extremely polluted by Cd, Pb, Zn, and Mn, with average heavy metal concentrations of 17.64 ± 2.44, 56.45 ± 8.88, 64.24 ± 8.12 and 343.78 ± 92.75, mg kg−1, respectively. It is a warning alarm for the current research ecosystems and the contamination levels may contribute to possible health problems for nearby populations. The large-scale application of mineral fertilizers and pesticides, as well as industrial activities, are responsible for the deterioration of the soil quality in this area. The study suggests the establishment of farm management laws to prevent human bad habits that worsen environmental degradation. Future research will also concentrate on methods for reducing the consequences of soil pollution.

Supplementary Materials

The following supporting information can be downloaded at: https://www.mdpi.com/article/10.3390/agronomy12123220/s1, Table S1: Geoaccumulation index-based standard for contamination levels (Igeo); Table S2: Pollution standards by contamination factor (CF); Table S3: Nemerow pollution index standard for pollution levels (In); Table S4: Sphericity test conducted by Bartlett and Kaiser–Meyer–Olkin (KMO).

Author Contributions

Conceptualization, M.S.S., M.A.A., R.A.E.B., H.H.A. and A.S.A.; methodology, M.S.S., M.A.A., R.A.E.B., H.H.A. and A.S.A.; software, M.S.S., M.A.A., R.A.E.B., H.H.A. and A.S.A.; validation, M.S.S., M.A.A., R.A.E.B., H.H.A. and A.S.A.; formal analysis, M.S.S., M.A.A., R.A.E.B., H.H.A. and A.S.A.; investigation, M.S.S., M.A.A., R.A.E.B., H.H.A. and A.S.A.; resources, M.S.S., M.A.A., R.A.E.B., H.H.A. and A.S.A.; data curation, M.S.S., M.A.A., R.A.E.B., H.H.A. and A.S.A.; writing—original draft preparation, M.S.S., M.A.A., R.A.E.B., H.H.A. and A.S.A.; writing—review and editing, M.S.S., M.A.A., R.A.E.B., H.H.A. and A.S.A.; visualization, M.S.S., M.A.A., R.A.E.B., H.H.A. and A.S.A.; supervision A.A.E.B., E.S.M., N.Y.R. and Z.D.; project administration, A.A.E.B., E.S.M., N.Y.R. and Z.D.; funding acquisition, No external funding. All authors have read and agreed to the published version of the manuscript.

Funding

This research received no external funding.

Institutional Review Board Statement

Not applicable.

Informed Consent Statement

Not applicable.

Data Availability Statement

Not applicable.

Acknowledgments

This paper was supported by the RUDN University Strategic Academic Leadership Program. The authors are grateful to the Senior Foreign Expert Project of China (Grant number G2021034008L). The authors would like to thank the Department of Soil and Water at Tanta University, Egypt, for the laboratory analysis.

Conflicts of Interest

The authors declare no conflict of interest.

References

  1. El Baroudy, A.A. Geomatics-Based Soil Mapping and Degradation Risk Assessment of Nile Delta Soils. Pol. J. Environ. Stud. 2010, 19, 1123–1131. [Google Scholar]
  2. El-Zeiny, A.M.; Abd El-Hamid, H.T. Environmental and human risk assessment of heavy metals at northern Nile Delta region using geostatistical analyses. Egypt. J. Remote Sens. Space Sci. 2022, 25, 21–35. [Google Scholar] [CrossRef]
  3. Hu, J.; Wu, F.; Wu, S.; Sun, X.; Lin, X.; Wong, M.H. Phytoavailability and phytovariety codetermine the bioaccumulation risk of heavy metal from soils, focusing on Cd-contaminated vegetable farms around the Pearl River Delta, China. Ecotoxicol. Environ. Saf. 2013, 91, 18–24. [Google Scholar] [CrossRef]
  4. Kumar, V.; Sharma, A.; Kaur, P.; Sidhu, G.P.S.; Bali, A.S.; Bhardwaj, R.; Thukral, A.K.; Cerda, A. Pollution assessment of heavy metals in soils of India and ecological risk assessment: A state-of-the-art. Chemosphere 2019, 216, 449–462. [Google Scholar] [CrossRef] [PubMed]
  5. Kumar, V.; Sharma, A.; Kaur, P.; Kumar, R.; Keshavarzi, A.; Bhardwaj, R.; Thukral, A.K. Assessment of soil properties from catchment areas of Ravi and Beas rivers: A review. Geol. Ecol. Landsc. 2019, 3, 149–157. [Google Scholar] [CrossRef]
  6. El Behairy, R.A.; El Baroudy, A.A.; Ibrahim, M.M.; Mohamed, E.S.; Rebouh, N.Y.; Shokr, M.S. Combination of GIS and Multivariate Analysis to Assess the Soil Heavy Metal Contamination in Some Arid Zones. Agronomy 2022, 12, 2871. [Google Scholar] [CrossRef]
  7. Ali, M.G.M.; Ahmed, M.; Ibrahin, M.M.; El Baroudy, A.A.; Ali, E.F.; Shokr, M.S.; Aldosari, A.A.; Majrashi, A.; Kheir, A.M.S. Optimizing sowing window, cultivar choice, and plant density to boost maize yield under RCP8.5 climate scenario of CMIP5. Int. J. Biometeorol. 2022, 66, 971–985. [Google Scholar] [CrossRef] [PubMed]
  8. Kayode, A.A.; Akram, M.; Laila, U.; Al-Khashman, O.A.; Kayode, O.T.; Elbossaty, W.F.M. Biological implications of atmospheric and pedospheric levels of heavy metals. Adv. Toxicol. Toxic Effects 2021, 5, 1–14. [Google Scholar]
  9. Li, C.; Zhou, K.; Qin, W.; Tian, C.; Qi, M.; Yan, X.; Han, W. A Review on Heavy Metals Contamination in Soil: Effects, Sources, and Remediation Techniques. Soil Sedim. Contam. 2019, 28, 380–394. [Google Scholar] [CrossRef]
  10. Kasam; Rahmawati, S.; Iresha, F.M.; Wacano, D.; Fauziah, I.F.; Amrullah, M.A. Evaluation of Heavy Metal Exposure to Soil and Paddy Plant around the Closed Municipal Solid Waste Landfill: Case Study at Gunung Tugel Landfill, Banyumas-Central Java. IOP Conf. Ser. Mater. Sci. Eng. 2018, 299, 8. [Google Scholar] [CrossRef]
  11. Srigirisetty, S.; Jayasri, T.; Netaji, C. Open dumping of municipal solid waste-Impact on groundwater and soil. Int. J. Curr. Eng. Sci. Res. 2017, 4, 26–33. [Google Scholar]
  12. El Baroudy, A.A.; Ali, A.M.; Mohamed, E.S.; Moghanm, F.S.; Shokr, M.S.; Savin, I.; Poddubsky, A.; Ding, Z.; Kheir, A.M.S.; Aldosari, A.A.; et al. Modeling Land Suitability for Rice Crop Using Remote Sensing and Soil Quality Indicators: The Case Study of the Nile Delta. Sustainability 2020, 12, 9653. [Google Scholar] [CrossRef]
  13. Abowaly, M.E.; Belal, A.-A.A.; Elkhalek, E.E.A.; Elsayed, S.; Samra, R.M.A.; Alshammari, A.S.; Moghanm, F.S.; Shaltout, K.H.; Alamri, S.A.M.; Eid, E.M. Assessment of Soil Pollution Levels in North Nile Delta, by Integrating Contamination Indices, GIS, and Multivariate Modeling. Sustainability 2021, 13, 8027. [Google Scholar] [CrossRef]
  14. El-Zeiny, A.M.; Effat, H.A. Environmental analysis of soil characteristics in El-Fayoum Governorate using geomatics approach. Environ. Monit. Assess. 2019, 191, 463. [Google Scholar] [CrossRef]
  15. Hammam, A.A.; Mohamed, E.S. Mapping soil salinity in the East Nile Delta using several methodological approaches of salinity assessment. Egypt. J. Remote Sens. Space Sci. 2020, 23, 125–131. [Google Scholar] [CrossRef]
  16. Alengebawy, A.; Abdelkhalek, S.T.; Qureshi, S.R.; Wang, M.Q. Heavy Metals and Pesticides Toxicity in Agricultural Soil and Plants: Ecological Risks and Human Health Implications. Toxics 2021, 9, 42. [Google Scholar] [CrossRef]
  17. Nagajyoti, P.C.; Lee, K.D.; Sreekanth, T.V.M. Heavy metals, occurrence and toxicity for plants: A review. Environ. Chem. Lett. 2010, 8, 199–216. [Google Scholar] [CrossRef]
  18. Wang, J.; Liu, G.; Liu, H.; Lam, P.K.S. Multivariate statistical evaluation of dissolved trace elements and a water quality assessment in the middle reaches of Huaihe River, Anhui, China. Sci. Total Environ. 2017, 583, 421–431. [Google Scholar] [CrossRef]
  19. Said, I.; Salman, S.A.; Elnazer, A.A. Multivariate statistics and contamination factor to identify trace elements pollution in soil around Gerga City, Egypt. Bull. Nat. Res. Cent. 2019, 43, 43. [Google Scholar] [CrossRef] [Green Version]
  20. El Nahry, A.H.; Mohamed, E.S. Potentiality of land and water resources in African Sahara: A case study of south Egypt. Environ. Earth Sci. 2011, 63, 1263–1275. [Google Scholar] [CrossRef]
  21. Mohamed, E.S.; Belal, A.; Shalaby, A. Impacts of soil sealing on potential agriculture in Egypt using remote sensing and GIS techniques. Eurasian Soil Sci. 2015, 48, 1159–1169. [Google Scholar] [CrossRef]
  22. Abuzaid, A.S.; El-Husseiny, A.M. Modeling crop suitability under micro irrigation using a hybrid AHP-GIS approach. Arab. J. Geosci. 2022, 15, 1217. [Google Scholar] [CrossRef]
  23. Khan, S.; Naushad, M.; Lima, E.C.; Zhang, S.; Shaheen, S.M.; Rinklebe, J. Global soil pollution by toxic elements: Current status and future perspectives on the risk assessment and remediation strategies—A review. J. Hazard. Mater. 2021, 417, 126039. [Google Scholar] [CrossRef]
  24. Abuzaid, A.S.; Bassouny, M.A. Total and DTPA-extractable forms of potentially toxic metals in soils of rice fields, north Nile Delta of Egypt. Environ. Technol. Innov. 2020, 18, 100717. [Google Scholar] [CrossRef]
  25. Yang, Y.; Christakos, G.; Guo, M.; Xiao, L.; Huang, W. Space-time quantitative source apportionment of soil heavy metal concentration increments. Environ. Pollut. 2017, 223, 560–566. [Google Scholar] [CrossRef] [PubMed]
  26. Yang, Y.; Yang, X.; He, M.; Christakos, G. Beyond mere pollution source identification: Determination of land covers emitting soil heavy metals by combining PCA/APCS, GeoDetector and GIS analysis. Catena 2020, 185, 104297. [Google Scholar] [CrossRef]
  27. Jahin, H.S.; Abuzaid, A.S.; Abdellatif, D.A. Using multivariate analysis to develop irrigation water quality index for surface water in Kafr El-Sheikh Governorate, Egypt. Environ. Technol. Innov. 2020, 17, 100532. [Google Scholar] [CrossRef]
  28. Abuzaid, A.S.; Jahin, H.S. Combinations of multivariate statistical analysis and analytical hierarchical process for indexing surface water quality under arid conditions. J. Contam. Hydrol. 2022, 248, 104005. [Google Scholar] [CrossRef]
  29. Irpino, A.; Verde, R.A. New Wasserstein Based Distance for the Hierarchical Clustering of Histogram Symbolic Data; Springer: Berlin/Heidelberg, Germany, 2006. [Google Scholar]
  30. Mazidah, Z.; Amalyn, A.; Shuhada, N.T.; Fuad, M.M.; Fikriah, F.; Izzuddin, M.A. Assessment of heavy metals and nutrients availability in oil palm plantation effected by bauxite mining using geostatistical and multivariate analyses. IOP Conf. Ser. Earth Environ. Sci. 2022, 1064, 012002. [Google Scholar] [CrossRef]
  31. Soil Survey Staff. Keys to Soil Taxonomy, 12th ed.; United States Department of Agriculture, Natural Resources Conservation Service: Washington, DC, USA, 2014.
  32. Abo Shelbaya, M.M.; Abd El-Azeim, M.M.; Menesi, A.M.; Abd El-Mageed, M.M. Heavy Metals and Microbial Activity in Alluvial Soils Affected by Different Land-Uses. J. Soil Sci. Agric. Eng. 2021, 12, 165–177. [Google Scholar] [CrossRef]
  33. Gee, G.W.; Or, D. Particle-size analysis. In Methods of Soil Analysis: Part 4—Physical Methods; Dane, J.H., Topp, C.G., Eds.; Soil Science Society of America, Inc.: Madison, WI, USA, 2002; pp. 255–293. [Google Scholar]
  34. Nelson, D.W.; Sommers, L.E. Total carbon, organic carbon, and organic matter. In Methods of Soil Analysis: Part 3-Chemical Methods; Sparks, D.L., Page, A.L., Helmke, P.A., Loeppert, R.H., Eds.; Soil Science Society of America, Inc.: Madison, WI, USA; American Society of Agronomy, Inc.: Madison, WI, USA, 1996; pp. 961–1010. [Google Scholar]
  35. U.S. EPA. Test methods for evaluating solid waste. In IA: Laboratory Manual Physical/Chemical Methods, SW 846, 3rd ed.; U.S. Gov. Print. Office: Washington, DC, USA, 1995. [Google Scholar]
  36. Wedepohl, H.K. The composition of the continental crust. Geochim. Cosmochim. Acta 1995, 59, 1217–1232. [Google Scholar] [CrossRef]
  37. Muller, G. Index of Geoaccumulation in Sediments of the Rhine River. J. Geol. 1979, 2, 108–118. [Google Scholar]
  38. Hakanson, L. An ecological risk index for aquatic pollution control. A sedimentological approach. Water Res. 1980, 14, 975–1001. [Google Scholar] [CrossRef]
  39. Guan, Y.; Shao, C.; Ju, M. Heavy metal contamination assessment and partition for industrial and mining gathering areas. Int. J. Environ. Res. Public Health 2014, 11, 7286–7303. [Google Scholar] [CrossRef]
  40. Said, M.E.S.; Ali, A.M.; Borin, M.; Abd-Elmabod, S.K.; Aldosari, A.A.; Khalil, M.M.N.; Abdel-Fattah, M.K. On the Use of Multivariate Analysis and Land Evaluation for Potential Agricultural Development of the Northwestern Coast of Egypt. Agronomy 2020, 10, 1318. [Google Scholar] [CrossRef]
  41. Jolliffe, I.T.; Cadima, J. Principal component analysis: A review and recent developments. Philos. Trans. A Math. Phys. Eng. Sci. 2016, 374, 20150202. [Google Scholar] [CrossRef] [Green Version]
  42. Abdel-Fattah, M.K.; Abd-Elmabod, S.K.; Aldosari, A.A.; Elrys, A.S.; Mohamed, E.S. Multivariate Analysis for Assessing Irrigation Water Quality: A Case Study of the Bahr Mouise Canal, Eastern Nile Delta. Water 2020, 12, 2537. [Google Scholar] [CrossRef]
  43. Abuzaid, A.S.; Abdel-Salam, M.A.; Ahmad, A.F.; Fathy, H.A.; Fadl, M.E.; Scopa, A. Effect of marginal-quality irrigation on accumulation of some heavy metals (Mn, Pb, and Zn) in Typic Torripsamment soils and food crops. Sustainability 2022, 14, 1067. [Google Scholar] [CrossRef]
  44. Azpúrua, M.; Dos Ramos, K. A comparison of spatial interpolation methods for estimation of average electromagnetic field magnitude. Prog. Electromagn. Res. 2010, 14, 135–145. [Google Scholar] [CrossRef] [Green Version]
  45. Lillesand, T.M.; Kiefer, R.W.; Chipman, J.W. Remote Sensing and Image Interpretation; John Wiley & Sons, Inc.: Hoboken, NJ, USA, 2015. [Google Scholar]
  46. Tóth, G.; Hermann, T.; Da Silva, M.R.; Montanarella, L. Heavy metals in agricultural soils of the European Union with implications for food safety. Environ. Int. 2016, 88, 299–309. [Google Scholar] [CrossRef]
  47. Abuzaid, A.S.; Bassouny, M.A.; Jahin, H.S.; Abdelhafez, A.A. Stabilization of lead and copper in a contaminated Typic Torripsament soil using humic substances. CLEAN—Soil Air Water 2019, 47, 1800309. [Google Scholar] [CrossRef]
  48. Swartjes, F.A. Introduction to Contaminated Site Management. In Dealing with Contaminated Sites: From Theory towards Practical Application; Swartjes, F.A., Ed.; Springer: Dordrecht, The Netherlands, 2011; pp. 3–89. [Google Scholar]
  49. Department of Environmental Affairs. National Norms and Standards for the Remediation of Contaminated Land and Soil Quality in the Republic of South Africa; Department of Environmental Affairs (DEA), National Environmental Management: Pretoria, South Africa, 2013.
  50. Abdelaal, S.M.S.; Moussa, K.F.; Ibrahin, A.H.; Mohamed, E.S.; Kucher, D.E.; Savin, I.; Abdel-Fattah, M.K. Mapping Spatial Management Zones of Salt-Affected Soils in Arid Region: A Case Study in the East of the Nile Delta, Egypt. Agronomy 2021, 11, 2510. [Google Scholar] [CrossRef]
  51. El Behairy, R.A.; El Baroudy, A.A.; Ibrahim, M.M.; Kheir, A.M.S.; Shokr, M.S. Modelling and Assessment of Irrigation Water Quality Index Using GIS in Semi-arid Region for Sustainable Agriculture. Water Air Soil Pollut. 2021, 232, 352. [Google Scholar] [CrossRef]
  52. Zouahri, A.; Dakak, H.; Douaik, A.; El Khadir, M.; Moussadek, R. Evaluation of groundwater suitability for irrigation in the Skhirat region, Northwest of Morocco. Environ. Monit. Assess. 2014, 187, 4184. [Google Scholar] [CrossRef]
  53. Ding, Z.; Kheir, A.M.S.; Ali, M.G.M.; Ali, O.A.M.; Abdelaal, A.I.N.; Lin, X.; Zhou, Z.; Wang, B.; Liu, B.; He, Z. The integrated effect of salinity, organic amendments, phosphorus fertilizers, and deficit irrigation on soil properties, phosphorus fractionation and wheat productivity. Sci. Rep. 2020, 10, 2736. [Google Scholar] [CrossRef] [Green Version]
  54. Ding, Z.; Koreim, M.A.; Ibrahim, S.M.; Antar, A.S.; Ewis, M.A.; He, Z.; Kheir, A.M.S. Seawater intrusion impacts on groundwater and soil quality in the northern part of the Nile Delta, Egypt. Environ. Earth Sci. 2020, 79, 313. [Google Scholar] [CrossRef]
  55. Houben, D.; Evrard, L.; Sonnet, P. Mobility, bioavailability and pH-dependent leaching of cadmium, zinc and lead in a contaminated soil amended with biochar. Chemosphere 2013, 92, 1450–1457. [Google Scholar] [CrossRef]
  56. El Baroudy, A.A. Monitoring land degradation using remote sensing and GIS techniques in an area of the middle Nile Delta, Egypt. Catena 2011, 87, 201–208. [Google Scholar] [CrossRef]
  57. Obalum, S.E.; Chibuike, G.U.; Peth, S.; Ouyang, Y. Soil organic matter as sole indicator of soil degradation. Environ. Monit. Assess. 2017, 189, 176. [Google Scholar] [CrossRef]
  58. Shokr, M.S.; Abdellatif, M.A.; El Baroudy, A.A.; Elnashar, A.; Ali, E.F.; Belal, A.A.; Attia, W.; Ahmed, M.; Aldosari, A.A.; Szantoi, Z.; et al. Development of a Spatial Model for Soil Quality Assessment under Arid and Semi-Arid Conditions. Sustainability 2021, 13, 2893. [Google Scholar] [CrossRef]
  59. Förstner, U.; Wittmann, G.T.W. Metal Pollution in the Aquatic Environment; Springer: Berlin/Heidelberg, Germany, 1981; p. 486. [Google Scholar]
  60. Abuzaid, A.S.; Jahin, H.S. Changes in alluvial soil quality under long-term irrigation with two marginal water sources in an arid environment. Egypt. J. Soil Sci. 2021, 61, 113–128. [Google Scholar] [CrossRef]
  61. Abdi, H.; Williams, L.J. Principal component analysis. WIREs Comput. Stat. 2010, 2, 433–459. [Google Scholar] [CrossRef]
  62. Abuzaid, A.S.; Jahin, H.S. Profile distribution and source identification of potentially toxic elements in north Nile Delta, Egypt. Soil Sedim. Contam. 2019, 28, 582–600. [Google Scholar] [CrossRef]
  63. Jain, A.K.; Dubes, R.C. Algorithms for Clustering Data; Prentice-Hall, Inc.: Hoboken, NJ, USA, 1988. [Google Scholar]
  64. Penkova, T.G. Principal component analysis and cluster analysis for evaluating the natural and anthropogenic territory safety. Procedia Comput. Sci. 2017, 112, 99–108. [Google Scholar] [CrossRef]
  65. Abuzaid, A.S.; Mazrou, Y.S.A.; El Baroudy, A.A.; Ding, Z.; Shokr, M.S. Multi-Indicator and geospatial based approaches for assessing variation of land quality in arid agroecosystems. Sustainability 2022, 14, 5840. [Google Scholar] [CrossRef]
  66. Shokr, M.S.; Mazrou, Y.S.A.; Abdellatif, M.A.; El Baroudy, A.A.; Mahmoud, E.K.; Saleh, A.M.; Balal, A.A.; Ding, Z. Integration of Geostatistical and Sentinal-2AMultispectral Satellite Image Analysis for Predicting Soil Fertility Condition in Drylands. ISPRS Int. J. Geo-Inf. 2022, 11, 353. [Google Scholar] [CrossRef]
  67. Abdellatif, M.A.; El Baroudy, A.A.; Arshad, M.; Mahmoud, E.K.; Saleh, A.M.; Moghanm, F.S.; Shaltout, K.H.; Eid, E.M.; Shokr, M.S. A GIS-Based Approach for the Quantitative Assessment of Soil Quality and Sustainable Agriculture. Sustainability 2021, 13, 13438. [Google Scholar] [CrossRef]
  68. Abu-hashim, M.; Mohamed, E.; Belal, A.-E. Identification of potential soil water retention using hydric numerical model at arid regions by land-use changes. Int. Soil Water Conserv. Res. 2015, 3, 305–315. [Google Scholar] [CrossRef] [Green Version]
  69. Feng, H.; Han, X.; Zhang, W.; Yu, L. A preliminary study of heavy metal contamination in Yangtze River intertidal zone due to urbanization. Mar. Pollut. Bull. 2004, 49, 910–915. [Google Scholar] [CrossRef]
  70. Nazzal, Y.H.; Al-Arifi, N.S.N.; Jafri, M.K.; Kishawy, H.; Ghrefat, H.A.; El-Waheidi, M.M.; Batayneh, A.T.; Zumlot, T.A. Multivariate statistical analysis of urban soil contamination by heavy metals at selected industrial locations in the Greater Toronto area, Canada. Geol. Croat. 2015, 68, 147–159. [Google Scholar] [CrossRef]
  71. Abd-Elmabod, S.K.; Mansour, H.; Hassein, A.A.E.; Zhang, Z.; Anaya-Romero, M.; de la Rosa, D.; Jordán, A. Influence of irrigation water quantity on the land capability classification. Plant Arch. 2019, 19, 2253–2261. [Google Scholar]
Figure 1. Experimental area location.
Agronomy 12 03220 g001
Figure 2. Samples sites in the investigated area.
Agronomy 12 03220 g002
Figure 3. Interpolation of selected soil properties total heavy metals concentrations (a) electric conductivity (EC: dS/m), (b) soil pH (c) calcium carbonate proportion (CaCO3%), (d) clay%, (e) soil organic matter proportion (SOM%), (f) Cd (mg kg−1), (g) Pb (mg kg−1), (h) Zn (mg kg−1) and (i) Mn (mg kg−1).
Agronomy 12 03220 g003aAgronomy 12 03220 g003b
Figure 4. Pearson correlation matrices for the analyzed variables.
Agronomy 12 03220 g004
Figure 5. The scree plot for the cumulative variability (%) and eigenvalues for the various principal components.
Agronomy 12 03220 g005
Figure 6. Dendrogram for agglomerative hierarchical clustering (AHC)-retrieved clusters.
Agronomy 12 03220 g006
Figure 7. Land use and land cover of the study area.
Agronomy 12 03220 g007
Figure 8. The I-geo and CF for each heavy metal under study in Cluster 1 and Cluster 2 (a) Igeo of cluster1, (b) Igeo of cluster2, (c) CF of cluster1, and (d) CF of cluster2.
Agronomy 12 03220 g008
Figure 9. Map of (In) in the study area.
Agronomy 12 03220 g009
Table 1. The quantitative descriptive statistics for the variables under investigation.
PropertiesMeasuring UnitsObserved
No.
Min.Max.MeanSDSkewnessKurtosis
Cdmg kg−1500.8221.8911.267.570.04−1.67
Pbmg kg−15030.0085.2554.1511.970.450.20
Znmg kg−15034.0081.4061.299.50−0.151.01
Mnmg kg−150115.25446.05330.0685.78−0.57−0.79
ECedS m−1501.4532.307.528.321.711.78
pH (−log H)-507.398.307.700.200.680.53
CaCO3%500.385.322.791.21−0.0790.66
O. M%501.302.401.640.271.040.59
Clay%5024.0043.5033.393.460.242.70
Min. = minimum, Max. = maximum and SD. = standard deviation.
Table 2. Recommended heavy metals contamination.
Recommended Values of Heavy Metals ConcentrationsCdPbZnMn
mg kg−1
Wedepohl [36]7.520240740
DEA [49]0.12052527
Table 3. Principal component analysis-extracted factors.
F1F2F3
Total2.2728.4728.47
% of Variance1.6220.3048.78
Cumulative %1.0613.3262.10
Cd (mg kg −1)0.820.13−0.005
Pb (mg kg −1)0.82−0.020.02
Zn (mg kg −1)0.770.160.20
Mn(mg kg −1)0.070.730.30
EC dS m−1−0.010.51−0.65
pH (1:2.5)−0.130.440.55
O. M%−0.550.450.20
Clay%0.070.61−0.39
For each variable, the values in bold correspond to the factor for which the squared cosine is highest.
Table 4. The descriptive statistics of the studied variables (quantitative data) for cluster 1.
PropertiesMeasuring UnitsObserved
No.
Min.Max.MeanSDSkewnessKurtosisIn
Level
Cluster 1
Cdmg kg−1190.8921.8911.70 a8.56−0.1−1.865Heavily contaminated
Pbmg kg−1193085.2556.40 a16.110.23−0.926
Znmg kg−1193481.2062.17 a12.75−0.600.157
Mnmg kg−119115.25279.27231.70 a42.098−1.402.053
ECdS m−1191.455.752.91 a1.480.74−0.911
pH (−log H)-197.48.197.64 a0.221.080.561
O. M%191.32.201.52 a0.222.094.27
Clay%1927.93733.16 a1.86−1.093.542
In-191.825.233.9 a1.34−0.780.52
A significant difference between two variables’ means is shown by their differing letter.
Table 5. The descriptive statistics of the studied variables (quantitative data) for cluster 2.
PropertiesMeasuring UnitsObserved
No.
Min.Max.MeanSDSkewnessKurtosisIn
Level
Cluster 2
Cdmg kg−1310.8220.9510.98 a7.030.126−1.67Heavily to extremely contaminated
Pbmg kg−13135.569.8552.76 b8.54−0.132−0.29
Znmg kg−13149.2581.460.74 b7.010.9051.52
Mnmg kg−131326.75446.05390.34 b32.76−0.232−0.97
EC dS/mdS m−1311.6532.310.35 b9.49−0.0289.14
pH (−log H)-317.398.37.73 a0.190.6361.65
O. M%311.32.41.71 a0.270.7760.50
Clay%312443.533.53 a4.170.2041.39
In-311.755.204.15 a1.04−1.190.42
A significant difference between two variables’ means is shown by their differing letter.
Table 6. Average levels of heavy metal pollution for each study area contamination level.
ClassElements
mg kg−1
Statistical Parameters
Min.Max.MeanSD.
Class 2Cd0.821.070.960.08
Pb30.0054.0044.208.22
Zn34.0061.0051.009.22
Mn115.25396.75277.51106.12
Class 4Cd6.257.006.620.26
Pb35.5064.2551.148.69
Zn49.7573.0060.575.38
Mn226.75402.25349.4460.93
Class 5Cd10.0019.0017.642.44
Pb44.7575.2556.458.88
Zn49.2581.4064.248.12
Mn210.40438.75343.7892.75
Class 6Cd18.8521.8920.311.05
Pb42.2585.2564.6814.11
Zn53.7581.2067.6510.09
Mn215.25446.05326.3588.70
Class 2 = unpolluted to moderately polluted, Class 4 = heavily polluted, Class 5 = heavily to extremely polluted, and Class 6 = extremely polluted.
Publisher’s Note: MDPI stays neutral with regard to jurisdictional claims in published maps and institutional affiliations.

