Article

Assessing the Suitability of Selection Approaches and Genetic Diversity Analysis for Early Detection of Salt Tolerance of Barley Genotypes

by
Muhammad Matloob Javed
1,
Abdullah A. Al-Doss
1,
Muhammad Usman Tahir
1,
Muhammad Altaf Khan
1 and
Salah El-Hendawy
1,2,*
1
Department of Plant Production, College of Food and Agriculture Sciences, King Saud University, Riyadh 11451, Saudi Arabia
2
Department of Agronomy, Faculty of Agriculture, Suez Canal University, Ismailia 41522, Egypt
*
Author to whom correspondence should be addressed.
Agronomy 2022, 12(12), 3217; https://doi.org/10.3390/agronomy12123217
Submission received: 22 November 2022 / Revised: 12 December 2022 / Accepted: 14 December 2022 / Published: 19 December 2022
(This article belongs to the Special Issue Crop Tolerance under Biotic and Abiotic Stresses)

Abstract

:
Assessment of the salt tolerance of a large genotype collection at the early growth stages may assist in the fast-tracking improvement of salt-tolerant barley genotypes in breeding programs. This study aimed to investigate the ability of traits related to seed germination ability and seedling growth performance with helping of nine sequence-related amplified polymorphism (SRAP) markers to detect the salt tolerance of 70 barley genotypes during the early growth stages. The different genotypes were exposed to three salt concentrations (0, 100, and 200 mM NaCl) and evaluated for salt tolerance by looking at germination percentage, germination index, and mean germination time during eight days as well as the lengths and weights of seedling shoot and root after 21 days from sowing. The results showed that genotypic variations in germination ability and seedling growth performance obviously appeared under 200 and 100 mM NaCl, respectively. The germination traits exhibited a strong correlation among themselves, whereas they had a poor correlation with seedling traits. A strong and positive correlation was only observed for shoot fresh weight with shoot length and root fresh weight under salinity conditions. Principal component analysis revealed that the first two components, which explained 53% of the total variability, succeeded to identify the genotypes with high salt tolerance during only one stage (germination or seedling stage) and both stages. Cluster analysis based on the stress tolerance index of germination and seedling traits grouped 70 genotypes into four key clusters, with genotypes grouped in cluster 1 and cluster 2 being salt tolerant during the germination stage and moderately tolerant during the seedling stage; the opposite was found with the genotypes grouped in cluster 4. According to Ward’s method, the salt tolerance of genotypes that ranked as most salt-tolerant (T) or salt-sensitive (S) remained almost unchanged during germination and seedling stages. In contrast, a change in salt tolerance with both stages was found for the genotypes that ranked as moderately salt-tolerant (MT) and salt-sensitive (MS) genotypes. The nine SRAP markers divided the tested genotypes into two distinct clusters, with clusters B had the most T and MT genotypes. Finally, using appropriate statistical methods presented in this study with SRAP markers will be useful for assessing the salt tolerance of a large number of barley genotypes and selecting the genotypes tolerant of and sensitive to salinity at the early growth stage.

1. Introduction

Among the abiotic stresses, salinity stress is the most concerning issue to crop production, particularly in arid and semi-arid regions. Approximately 20% (954 million ha) of all arable land is affected by salinity, and most of it is located in arid and semi-arid countries. Importantly, salt accumulation in the soil due to heavy application of chemical fertilizers, continuous irrigation with brackish water, intensive farming systems, and abrupt climatic changes converts 1.5 million ha of arable land to non-arable land annually. Therefore, it is expected that by 2050, the soil affected by salinity stress will account for 50% of the world’s agricultural land [1]. Moreover, the salinity problem in the agricultural sector causes up to US$ 31 billion of economic losses annually. Therefore, several integrated agronomic practices have been applied to overcome the negative impacts of salinity stress on crop growth and productivity. However, most of the agronomic practices, such as mixing a large amount of gypsum into the soil and leaching salts from the soil surface, are not sufficient to face the salinity problems in the agriculture sector; as well, they require particular skills in their application. Therefore, several studies have agreed that providing farmers with salt-tolerant genotypes is a practical approach to integrating with agronomic practices for sustaining crop production under salinity stress conditions [2]. Previous studies have reported a greater genetic diversity among genotypes for salt tolerance [3,4,5]. Therefore, the first and essential step in enhancing the salt tolerance of crop genotypes is to identify the suitable genetic donors that will introduce tolerance to salt stress into elite cultivars and prevalent genotypes. Evaluating the salt tolerance of a large number of genotypes is the first step to getting suitable genetic donors. Because evaluating the salt tolerance of large genotype collections based on grain yield is time-consuming and costly, evaluating the salt tolerance among genotypes during the early growth stages could therefore provide an economic and quick approach to accelerate barley breeding for salinity tolerance.
Germination is one of the most crucial stages in the plant life cycle because it directly determines the success or failure of subsequent growth and plant development [6]. In general, salinity stress can inhibit seed germination by preventing the seeds from their uptake of water due to osmotic stress and/or inhibit the dividing and expanding cells and alter the activity of some essential germination enzymes due to ion toxicity [7]. Therefore, former studies found that there are several traits related to the germination ability of seeds, such as germination index, mean germination time, and seedling vigor index, that showed high genetic variation among genotypes in different field crops [8,9,10]. Therefore, these traits can be used as effective screening criteria for evaluating the salt tolerance of barley genotypes during their early growth stages.
Previous studies reported that the characteristics of both parts of seedling plants (shoot and root) demonstrated substantial genotypic variation in the salt tolerance among genotypes in different field crops [11,12,13]. Furthermore, in the wheat crop, the ranking of genotypes based on seedling characteristics such as length and weight of shoot and root matched well with their ranking in terms of final grain yield [12]. This indicates that if screening of genotypes for salt tolerance is done during the seedling stage, this screening may be helpful in finding the salt-tolerant genotypes at the early growth stages. Therefore, the traits of shoot and root that reflect the seedling growth performance could be effective screening criteria for evaluating the salt tolerance of genotypes during early growth stages. Furthermore, because most crops are susceptible to salinity stress at their early growth stages, assessment of salt tolerance of genotypes at the early growth stages would save time and funds.
Barley (Hordeum vulgare L.), a member of the grass family, is a major cereal grain crop grown in temperate climates globally. It is one of the oldest cereal crops, having been cultivated for about 10,000 years in a region between the Nile (Egypt) and Tigris Rivers (Iraq), including Southern Turkey. This crop is one of the most important crops due to its multiple benefits for food, feed, and malting. It is also well-adapted to arid and semi-arid regions because of its high tolerance to abiotic stresses such as salinity and drought [13]. It is commonly used as a model to study mechanisms related to salinity adaptation in cereal crops due to its simpler genome [14,15]. Several studies reported that there are considerable genetic variations in barley genotypes in response to salinity stress during different growth stages [16,17,18,19]. Additionally, the temperate cereal crops such as barley showing higher sensitivity to salinity stress during the early growth stages [20,21,22,23,24,25].Therefore, assessment of the salt tolerance of barley genotypes at the germination and seedling growth stages seems to be necessary in the fast-tracking improvement of salt-tolerant genotypes in breeding programs.
Molecular markers are widely used as simple and fast tools for assessing genetic variability and evaluating genotypes for different environmental stresses in breeding programs. Plenty of molecular markers are available for genetic analysis based on the resources and applications. Sequence-related amplified polymorphism (SRAP) markers have emerged as valuable marker tools which can be used for different purposes including genetic diversity, linkage mapping, population structure gene tagging and cloning, and marker assisted selection as well as for prediction of heterosis [26,27,28,29]. Interestingly, this tool has a range of advantages including easy-to-use, cost-effectiveness, high reproducibility and polymorphism rate, and not biased to any environmental conditions [26]. Therefore, SRAP markers, in combination with morpho-agro-physiological traits, can be used for diversity analysis for screening different genotypes for their tolerance against salinity stress during breeding programs [27]. Many cereal crops, including barley, employ the SRAP marker for diversity analysis for selecting salinity-tolerant genotypes [28,29].
The reaction and sensitivity of genotypes to salinity and tolerance stress during germination and seedling growth stages seems necessary for identifying the traits that have potential as evaluating criteria for detecting salt tolerance in barley genotypes at early growth stages. Therefore, the main aim of this study was to evaluate a large number of barley genotypes for potential salt tolerance, based on traits of germination ability and seedling growth performance at the early growth stages. The specific objective was to assess the ability of SRAP markers and selection approaches, including simple correlation, principal components analysis, cluster analysis, and Ward’s method for early detection of salt tolerance of barley genotypes.

2. Materials and Methods

2.1. Plant Material and Growth Conditions

This investigation was conducted using seventy contrasting barley genotypes. These genotypes were obtained from the Cereal Research lab associated with the College of Food and Agriculture Sciences, King Saud University, Riyadh, Saudi Arabia. These genotypes included different varieties and advanced breeding lines. The full name and abbreviation of these genotypes are given in Table 1. Two experiments were designed and performed separately to evaluate the salt tolerance of these genotypes during germination and seedling growth stages. Both experiments were conducted in a controlled growth chamber (SanyoGallenkamp, Loughborough, United Kingdom) at 25/16 °C day/night temperature, relative humidity of 60%, and 12-h day length under a light intensity of 300 μmol m−2 s−1. In the germination experiment, the Petri dishes were kept under dark conditions for the first three days.

2.2. Germination Experiment and Their Traits Measurements

Factorial experiment was conducted to assess the effects of different salt concentrations on germination indices of 70 barley genotypes. The experiment was carried out in a randomized complete block design with two factors and three replicates. The main factor was genotype and the second factor was salinity with three concentrations (0, 100, and 200 mM NaCl). First, the seeds of different genotypes were surface sterilized by 6% sodium hypochlorite/H2O solution for 5 min and then rinsed five times with distilled water. Thereafter, twenty surface sterilized seeds from each genotype were selected for each replicate and placed on a two layers Whatman No. 2 filter paper in Petri dishes of 7 cm diameter and saturated with distilled water for control treatment or respective saline solutions for salinity treatments. To avoid moisture loss by evaporation, the petri dishes were sealed with parafilm and transferred into the growth chamber. Germination data were collected every 24 h for 8 days. The Seeds were counted as germinated seeds when their coleoptile or root was at least 2 mm long. Germination percentage (G%), mean germination time (MGT), and germination rate index (GRI) were calculated using the following formula described by [30]:
G % = N u m b e r   o f   n o r m a l l y   g e r m i n a t e d   s e e d s T o t a l   n u m b e r   o f   s e e d s   i n   P e t r i   d i s h × 100 MGT = Σ Fx Σ F
where F is the number of germinated seeds in x days and Σ F is the number of total germinated seeds
GI = ( G i / T i )
where Gi is the number of germinated seeds on day i and Ti is the number of days.

2.3. Seedling Experiment and Their Traits Measurements

The seedling experiment was carried out in a randomized complete block design with two factors and three replicates. The main factor was genotype and the second factor was salinity with three concentrations (0, 100, and 200 mM NaCl). This experiment was carried out in plastic trays containing 120 cells (2.25 inch deep, 1.5 and 2.0 inch bottom and upper diameter per cell). Each cell was filled with sandy soil and the three surface sterilized seeds with sodium hypochlorite/H2O solution for 5 min and rinsed with distilled water five times were manually sown in each cell at a depth of about 1.25”. After seed germination, the seedling was thinned to a single plant in each cell. Each cell was saturated with distilled water for control treatment or respective saline solutions for salinity treatments. After allowing the seedlings to grow for 21 days, different traits related to seedling growth performance, namely shoot length (SL), root length (RL), shoot fresh weight (SFW), and root fresh weight (RFW) were measured. The SFW and RFW were measured using a digital balance apparatus with an accuracy of ±0.001 g.

2.4. Stress Tolerance Index

The data of germination and seedling traits measured under control and salinity conditions were applied to the following equation described by [31] to calculate the stress tolerance index (STI):
STI = ( X C × X S ) / ( X ¯ C ) 2
where Xc and Xs are the values of a trait measured under control and salinity conditions, respectively, while X ¯ C is the average value of all genotypes of a trait measured under control condition.

2.5. DNA Extraction and PCR Amplification

A leaf sample from each genotype was collected and stored at −80 °C until further use. Approximately 1 g of each sample was used for DNA extraction following the Cetrimonium bromide, Cetyl Trimethyl Ammonium Bromide CTAB method described by [32]. DNA concentration was measured on Nano spectrometer Genway Nano (Jenway, Stone, Staffs, UK). Fifteen SRAP markers were tested, while 9 SRAP markers were selected based on polymorphism information to analyze the genetic diversity of subjected samples (Table 2). PCR amplification was achieved by preparing a 20 microliter reaction containing 40 ng DNA, 10 pM of each primer (forward and Reverse), and GoTaq® Green Master Mix by (Promega, Madison, WI, USA). PCR was carried out as one cycle at 95 °C for 5 min., then 35 cycles were performed as follows: 1 min at 95 °C for denaturation, 45 s At 55 °C for annealing, and 30 s at 72 °C for extension, then incubated at 72 °C for 7 min. Amplicons were separated using 2.5% agarose gel according to the method proposed in [33] in 1 x TAE buffer against 100 bp DNA Ladder as a size marker. Fragments were detected with ethidium bromide staining, documented on Gel Documentation GelDoc-It TS-310 imaging system (UVP, Upland, CA, USA), and scored as binary data 1 for present and 0 for absent.

2.6. Statistical Analysis

Data of the germination and seedling were subjected to ANOVA analysis appropriate to randomized complete block design as a factorial arranged with the genotypes and salt concentrations described as factor A and factor B, respectively. The significance of the interrelationships of all possible pairs of germination and seedling traits measured under control and salinity conditions was determined based on Pearson’s correlation coefficient. Principal component analysis (PCA) was performed for germination and seedling traits of all genotypes under both salinity and control conditions. Cluster analysis based on Ward’s method was performed to group the tested genotypes according to the level of salt tolerance using the value of STI of different traits of germination and seedling. The distance between the two clusters was expressed as squared Euclidian distance. The ranking of genotypes for salt tolerance at individual growth stage and across two growth stages was performed according to the methods proposed in [34]. ANOVA for both experiments and SRAP calling was analyzed using PAST 4.0 (Natural Museum of history, University of Oslo) [35]. Correlation and principal component analysis data visualization was achieved by using RStudio 1.3.959 (RStudio Team 2020) [36], with the following packages: Dendextend [37], Performance Analytics [38], Facto MineR [39], Devtool [40], ggplot2 [41], and ggpubr [42].

3. Results

3.1. Germination Traits

In general, the average value, G% of all genotypes under control treatment, reached 88.7%, while it went down to 80.2% and 68.4% under moderate (100 mM NaCl) and high (200 mM NaCl) salt concentrations, respectively (Figure 1). Additionally, about 81% of tested genotypes attained more than 85% final G% under control treatment, while 53% (37 genotypes) and only 24% (17 genotypes) of tested genotypes recorded this percentage for germination under 100 and 200 mM NaCl, respectively. Furthermore, about 34% (24 genotypes) of tested genotypes attained less than 60% final G% under 200 mM NaCl, while only 10% of tested genotypes recorded less than 60% final G% under 100 mM NaCl (Figure 1). There are three genotypes (G62, G68, and G70) attained a very low G% under 100 mM NaCl (40.0%, 35.0%, and 40.0%) and 200 mM NaCl (40.0%, 26.7%, and 16.7%), respectively. The genotypes G1, G2, G3, G4, G5, G7, G9, G10, G11, and G12 attained more than 90% final G% under 100 mM NaCl and even under 200 mM NaCl (Figure 1).
The GI also showed a reduction with increasing the concentration of salinity, and it ranged across all genotypes between 6.7 to 20.0, 2.7 to 18.3, and 1.1 to 16.9, with average values of 16.0, 11.9, and 8.3 under control, 100, and 200 mM NaCl, respectively (Figure 1). The GI of G3, G4, G5, and G7 was not significantly affected by increasing salt concentrations, and the values of GI for these genotypes ranged between 18.7 to 20.0, 16.9 to 17.8, and 16.2 to 16.9 under control, 100, and 200 mM NaCl, respectively. The highest decrease in GI under both salt concentrations was observed in G62, G68, and G70, and the values of GI for these genotypes were decreased by 40.0–61.9% and 61.4–80.0% under 100 and 200 mM NaCl, respectively, when compared with their values under control treatment (Figure 1)
As shown in Figure 1, the MGT was the most germination trait affected by high salt concentration. The seeds of all genotypes germinated satisfactorily within 2 and 3 days under control and 100 mM NaCl, respectively, while they germinated within 12–16 days under 200 mM NaCl. Hence, germination of seeds retarded by >10 days at high salt concentration compared to control and moderate salt concentration. Importantly, under different salt concentrations, there were little differences between genotypes in terms of MGT, where the values of MGT ranged from 1.0 to 2.1 days, 1.1 to 3.3 days, and 12.1 to 15.7 days under control, 100, and 200 mM NaCl, respectively (Figure 1).

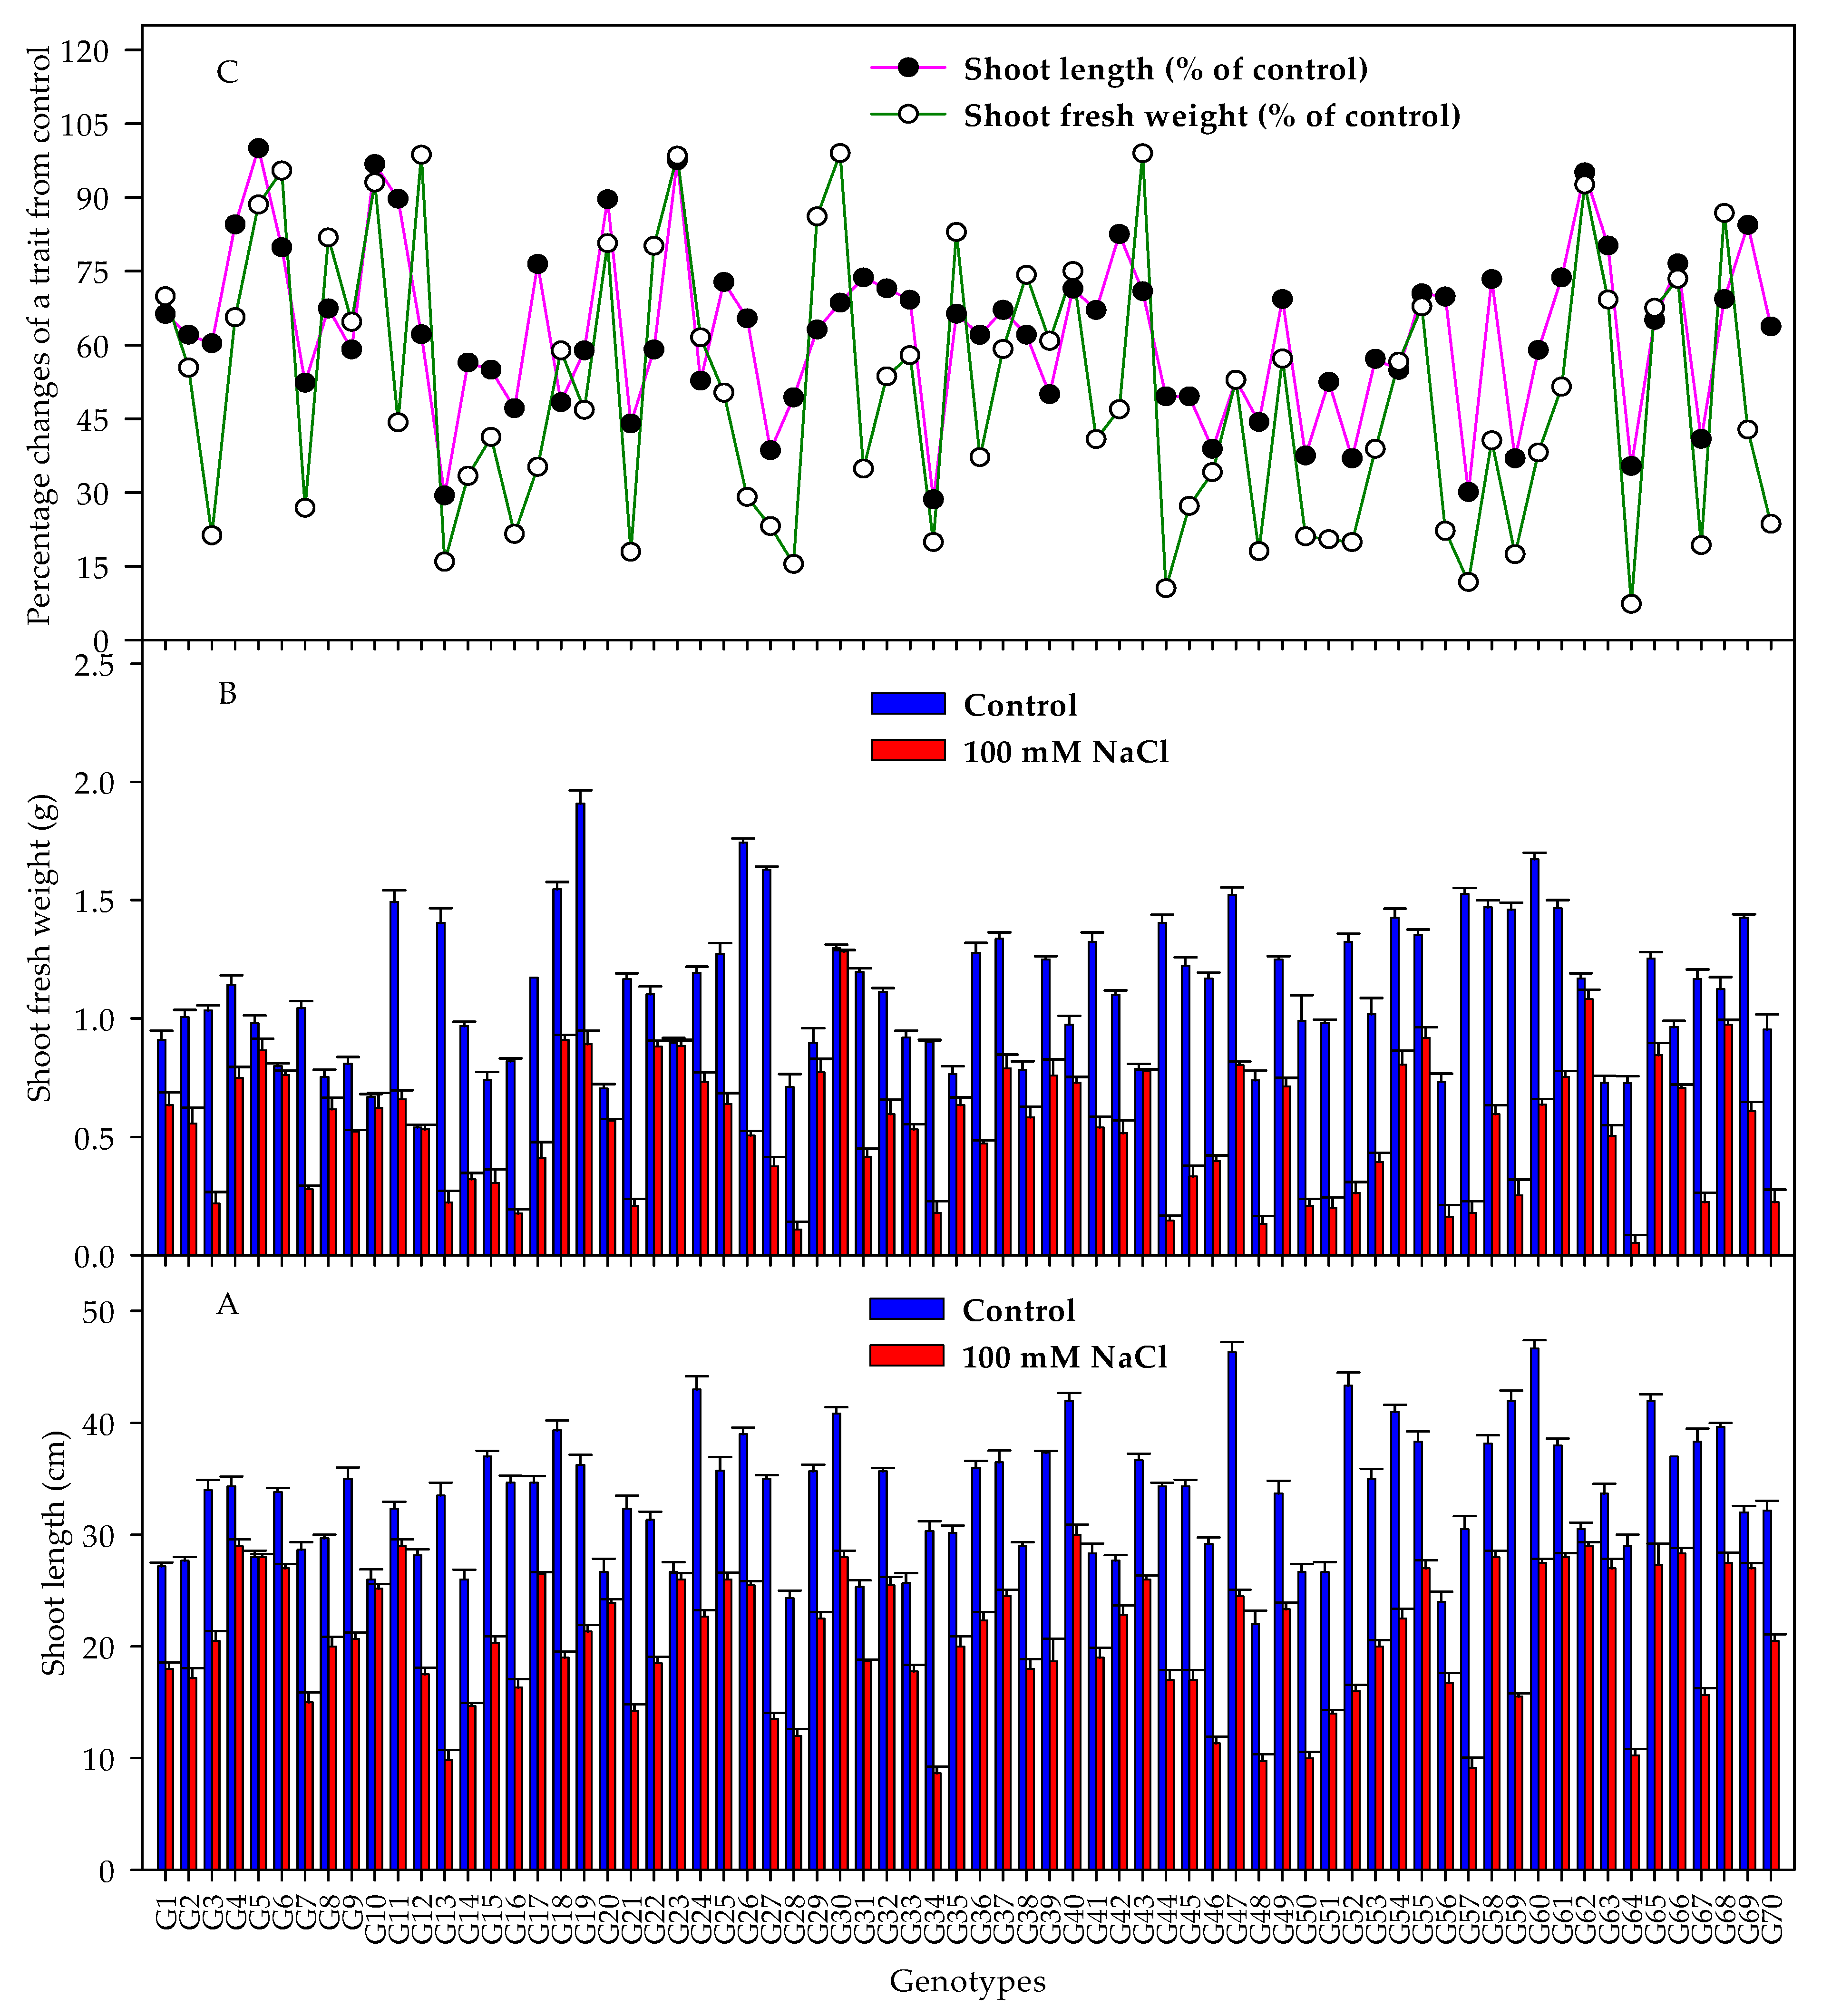
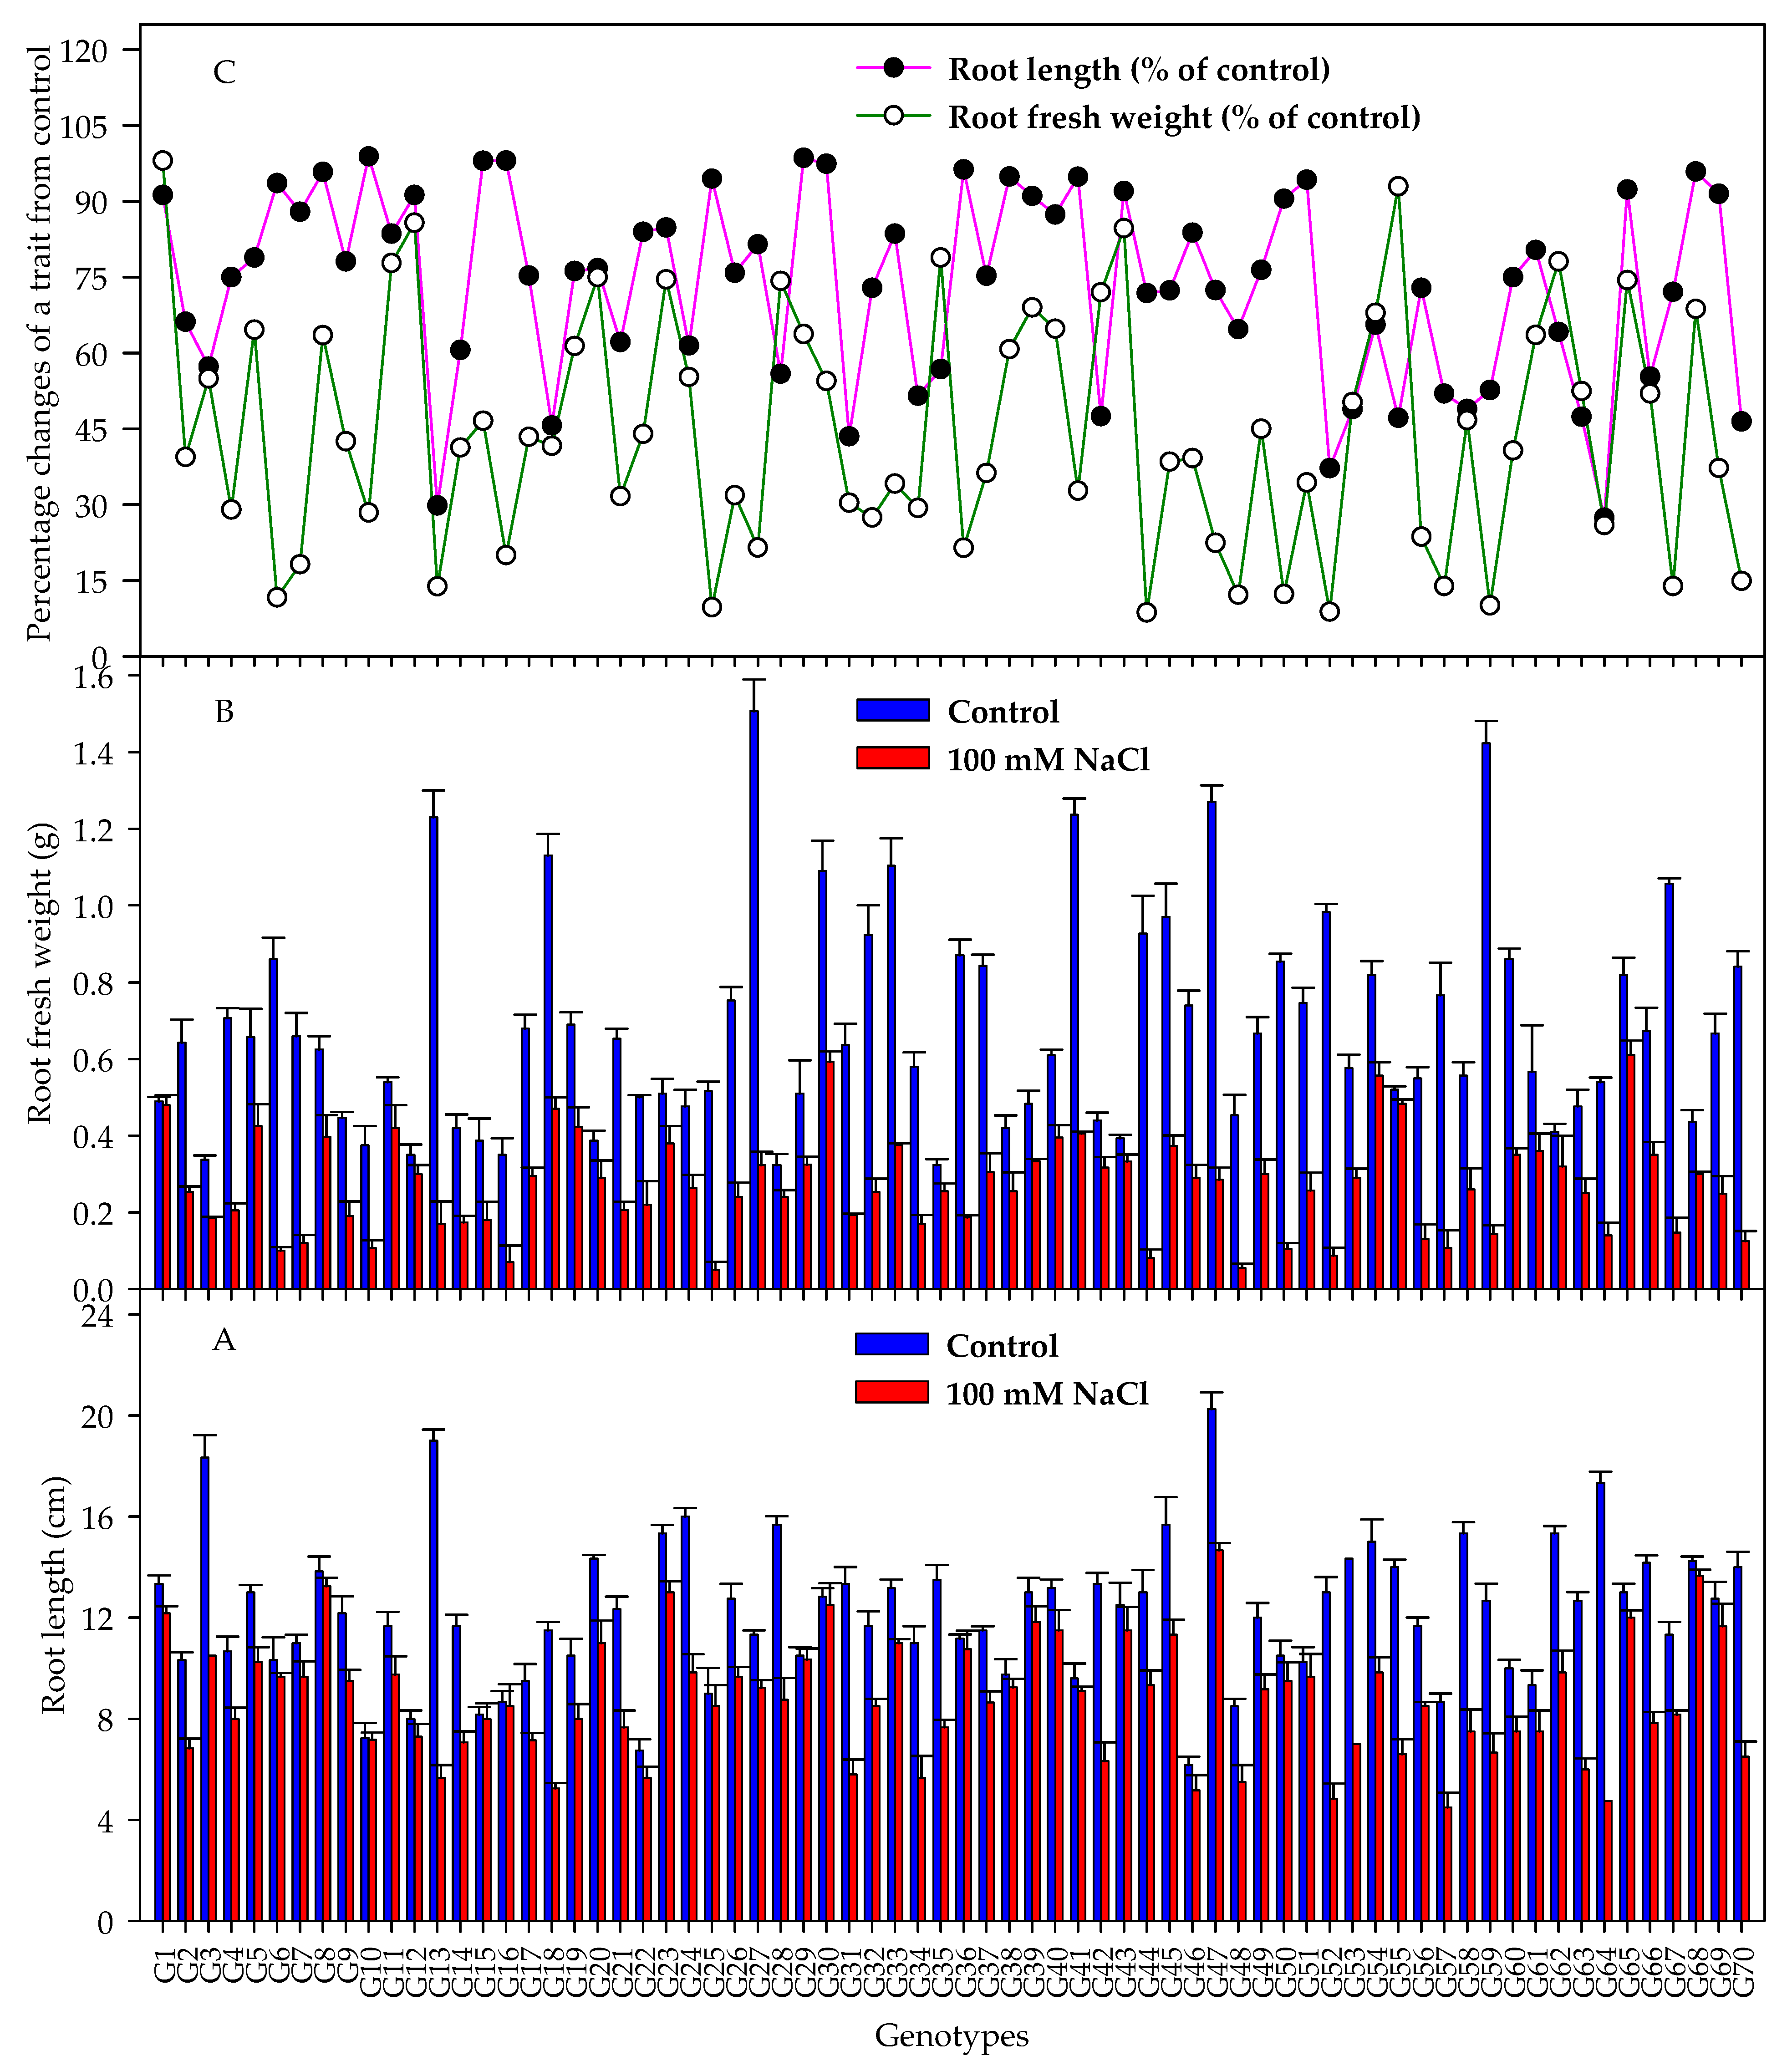
3.2. Seedling Traits

Although all genotypes were evaluated during seedling growth stage under two salt concentrations with control, the data of seedling traits were recorded only for control and 100 mM NaCl because the seedling of all genotypes were died under high salinity 200 mM NaCl. Table 3 reveals a highly significant effect (p ≤ 0.0001) of the main factor (genotype and salinity) as well as their interaction on seedling growth traits in terms of SL, RL, SFW, and RFW.
Overall, all genotypes illustrated a significant decrease in different seedling traits under 100 mM NaCl compared to the control treatment. Across all genotypes, decreases in SL, RL, SFW, and RFW for 100 mM NaCl relative to control treatment were 38.1%, 28.6%, 51.6%, and 60.5%, respectively (Figure 2 and Figure 3). Interestingly, the tested genotypes demonstrated significant variation in four seedling traits under both control and salinity conditions. Nearly a two- and five-fold variation was found in the four seedling traits among the genotypes under control treatment, with SL, RL, SFW, and RFW values ranged from 22.0 to 46.67 cm, 6.17 to 20.25 cm, 0.54 to 1.91 g plant−1, and 0.32 to 1.51 g plant−1, respectively (Figure 2 and Figure 3). Nearly a fourfold variation was found in the SL and RL among the genotypes under 100 mM NaCl treatment, with SL values ranging from 8.67 to 30.0 cm and RL values ranging from 4.50 to 14.66 cm. The genotypes showed substantial variation in SFW and RFW under 100 mM NaCl, with about twenty-five-fold and twelve-fold variation found in SFW and RFW among genotypes, respectively. The values of SFW and RFW ranged from 0.05 to 1.28 g plant−1 and 0.05 to 0.61 g plant−1 under 100 mM NaCl, respectively (Figure 2 and Figure 3).
Additionally, the tested genotypes also showed a substantial variation in relative changes (the percentage decrease in a trait of salt-affected plants relative to control treatment). The relative change values of SL, RL, SFW, and RFW of tested genotypes ranged from 28.6 to 100.0%, 27.4 to 98.9%, 7.3 to 99.0%, and 8.6 to 98.0%, respectively (Figure 2 and Figure 3). About 43% and 49% of tested genotypes recorded more than 60% reduction in SFW and RFW under 100 mM NaCl relative to control, respectively, while only 14% and 6% of tested genotypes recorded these reduction values for SL and RL, respectively. About 6%, 29%, 10%, and 3% of tested genotypes recoded less than 10% reduction in SL, RL, SFW, and RFW under 100 mM NaCl relative to control, respectively (Figure 2 and Figure 3).
G5, G10, G11, G23, and G62 recorded the lowest reduction in SL, whereas G13, G34, G46, G57, and G64 recorded the highest reduction in their SL under salinity conditions. SFW followed the same pattern as SL, and G6, G12, G23, G30, and G43 recorded the lowest reduction in SFW. In contrast, G13, G28, G44, G57, and G64 recorded the highest reduction in their SFW under salinity conditions (Figure 2). G10, G15, G16, G29, G30, and G36 are the genotypes that recorded less than 10% reduction in their RL under salinity conditions, whereas genotypes G13, G18, G31, G52, and G64 recorded more than 60% reduction in their RL under salinity conditions (Figure 3). G1, G12, G35, G43, and G55 recorded more than 78% of RFW of the control under salinity conditions, whereas G6, G25, G44, G52, and G59 recorded more than 90% reduction in their RFW under salinity condition relative to control treatment (Figure 3).

3.3. Correlation Analysis

Pearson’s correlation revealed that the three germination traits (G%, GI, and MGT), measured under control or salinity conditions, showed moderate to strong correlations with each other (r = −0.25–0.86). No correlation was observed between germination traits and seedling traits measured under either control or salinity conditions, with the exception of the correlation between G% measured under control and moderate salt concentration, which showed moderate and negative correlation with SL measured under control and salinity conditions and RL measured under control conditions, (Table 4). Strong and positive correlations were found between SL and SFW measured under control (r = 0.57) and salinity (r = 0.75) conditions and between SFW and RFW measured under control (r = 0.57) and salinity (r = 0.69) conditions. Moderate and positive correlations were found between SL measured under control and SL (r = 0.44) and SFW (r= 0.37) measured under salinity, RFW measured under control (r = 0.36), and RFW measured under salinity (r = 0.27). Moderate and positive correlations were found also between SL measured under salinity and RL (r = 0.42) and RFW (r= 0.44) measured under salinity. The RL measured under salinity showed moderate and positive correlations with SFW (r = 0.44) and RFW (r = 0.42) measured also under salinity condition (Table 4).

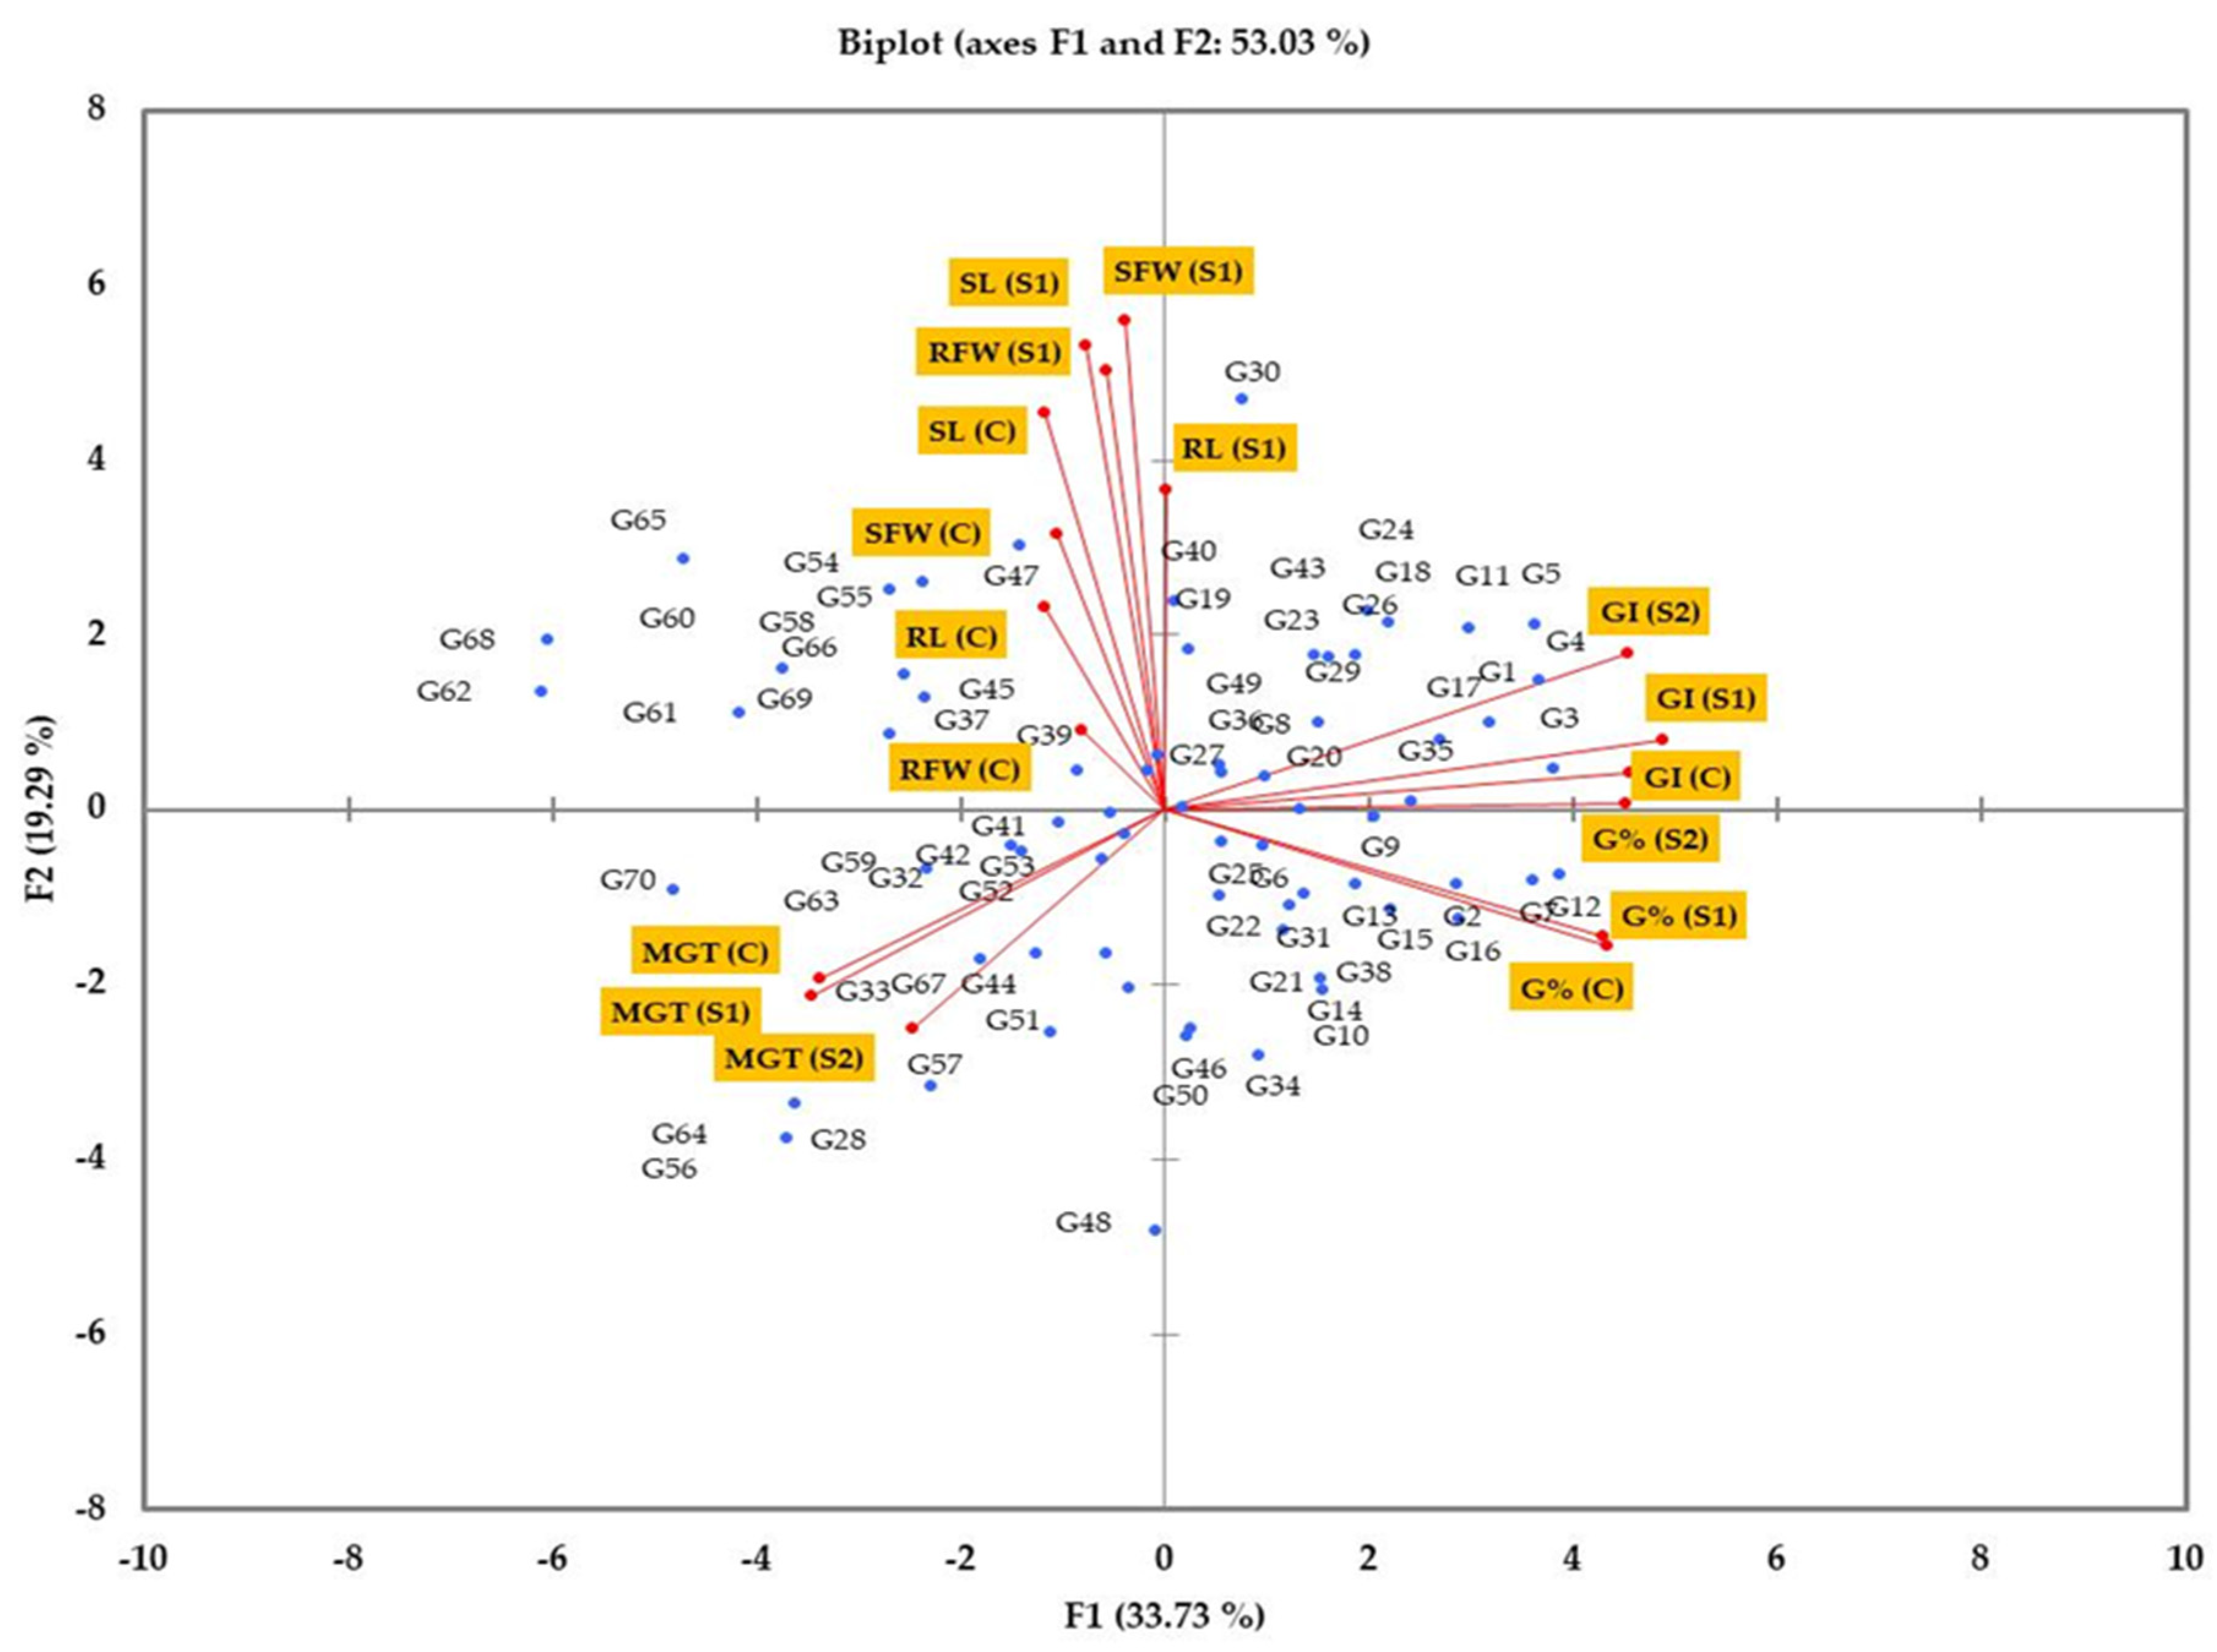
3.4. Principal Component Analysis

Five principal components (PCs) from a total of 17 obtained had eigenvalues >1. These first five PCs explained 79.3% of the total genotypic variability, with the first two PCs explaining a total variability of about 53% (Table 5 and Figure 4). The first component (PC1) explained 33.73% of the total variability and had a positive and strong correlation with G% and GI measured under control and both salt concentrations and a negative and strong correlation with MGT measured under control and 100 mM NaCl. The second component (PC2) explained 19.29% of the total variability and had a positive and strong correlation with SL measured under control and salinity and RL, SFW, and RFW measured under salinity conditions (Table 5 and Figure 4). The third component (PC3) explained 10.54% of the total variability and was mainly influenced by SFW and RFW measured under control conditions. The last two components (PC4 and PC5) explained 8.86% and 6.91% of the total variability, respectively. PC4 showed strong and positive correlation with MGT measured under 200 mM NaCl, while PC5 was mainly associated with RL measured under control conditions (Table 5). According to PCA-biplot, the different genotypes were scattered in the four quarters of biplot, which indicate the high level of genetic variation among the tested genotypes (Figure 4).

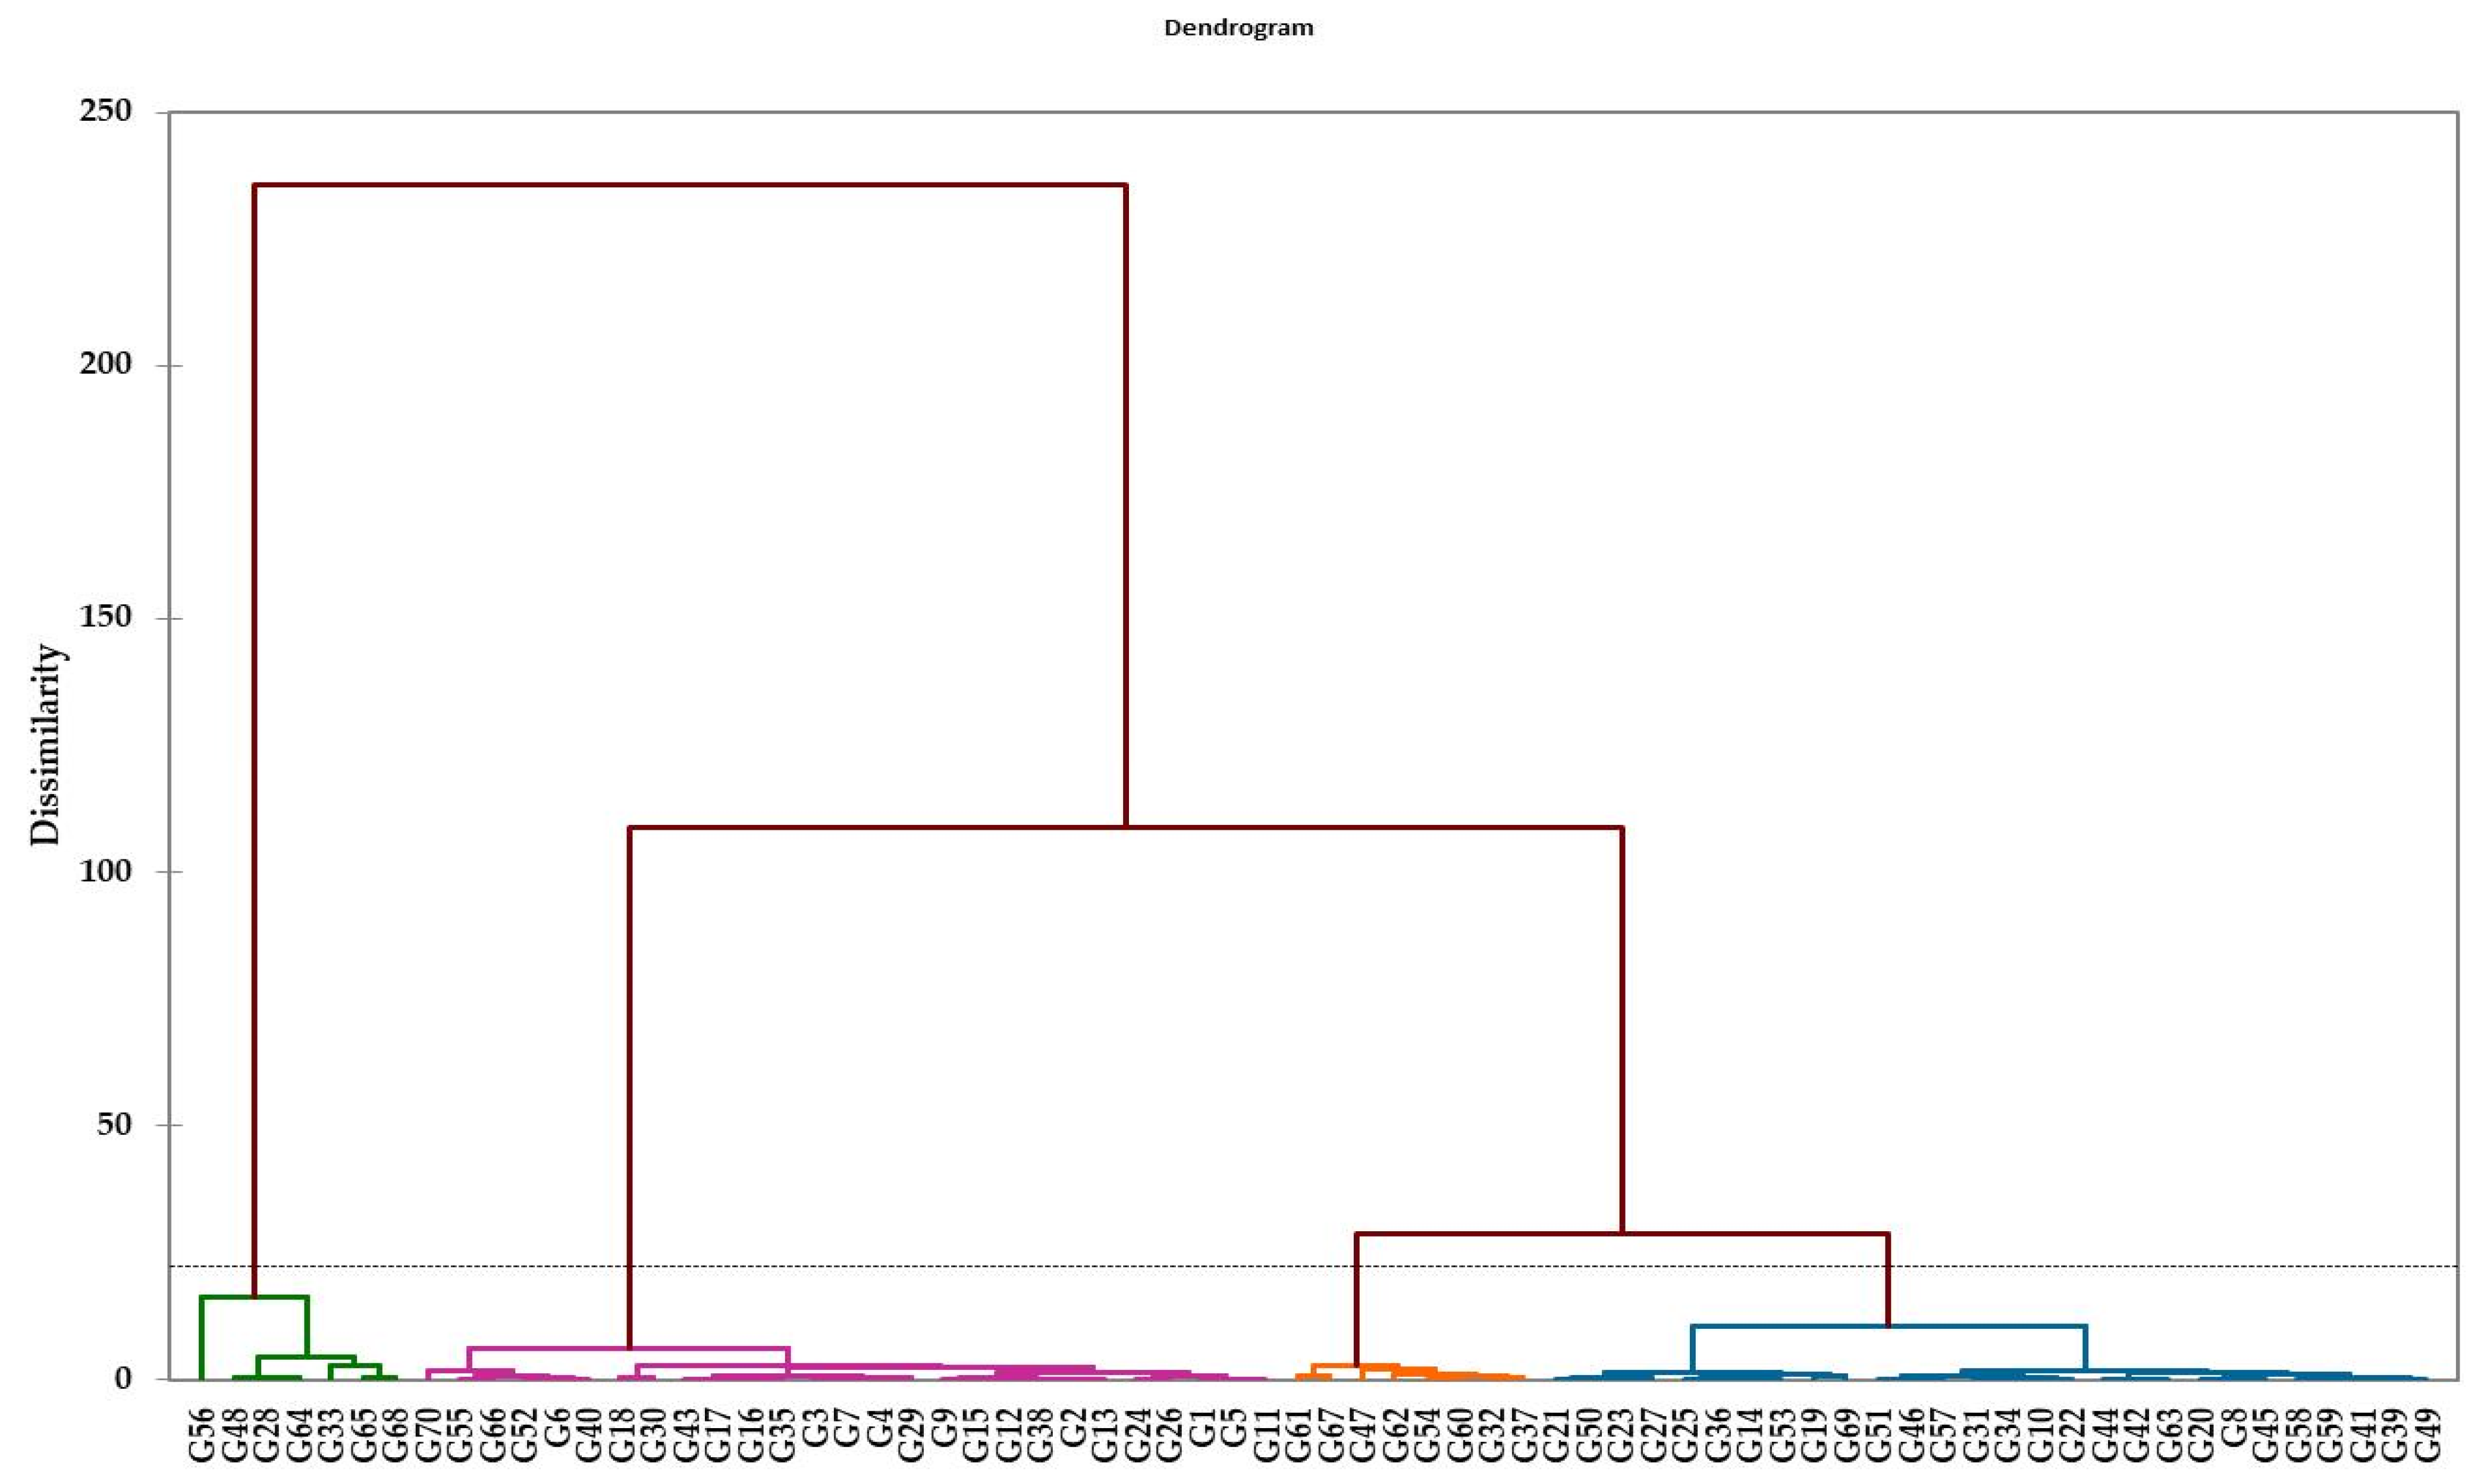
3.5. Stress Tolerance Index and Cluster Analysis

The tested genotypes showed substantial variation in STI for different germination and seedling traits (Table 6). The STI for G%, GI, and GMT ranged from 0.27 to 1.25, 0.07 to 1.37, and 0.78 to 3.52 at 100 mM NaCl, and 0.14 to 1.19, 0.03 to 1.27, and 8.24 to 20.12 at 200 mM NaCl among genotypes, respectively. For seedling traits, the STI for SL, RL, SFW, and RFW ranged from 0.19 to 1.15, 0.21 to 1.98, 0.03 to 1.36, and 0.05 to 1.38 at 100 mM NaCl among genotypes, respectively (Table 6).
Cluster analysis was performed based on STI calculated for the three germination and four seedling traits (Figure 5). The dendrogram of cluster grouped the tested genotypes into four main clusters. Clusters 1 and 2 contained the highest number of tested genotypes (27 and 28 genotypes, respectively) followed by cluster 4 (8 genotypes) and cluster 3 (7 genotypes (Figure 5).
The genotypes formed cluster 1 attained the highest STI values for G% and GI and lowest values for MGT under two salt concentrations followed by the genotypes in cluster 2; the opposite was true for the genotypes in cluster 3 and 4 (Table 7). The highest STIs for length and weight seedling shoots and roots under salinity were observed for the genotypes formed cluster 4, whereas the lowest STI values for shoot (SL and SFW) and root (RL and RFW) was recorded for the genotypes formed cluster 3 and cluster 2, respectively (Table 7).

3.6. Ranking of Genotypes for their Relative Salt Tolerance at Two Growth Stages
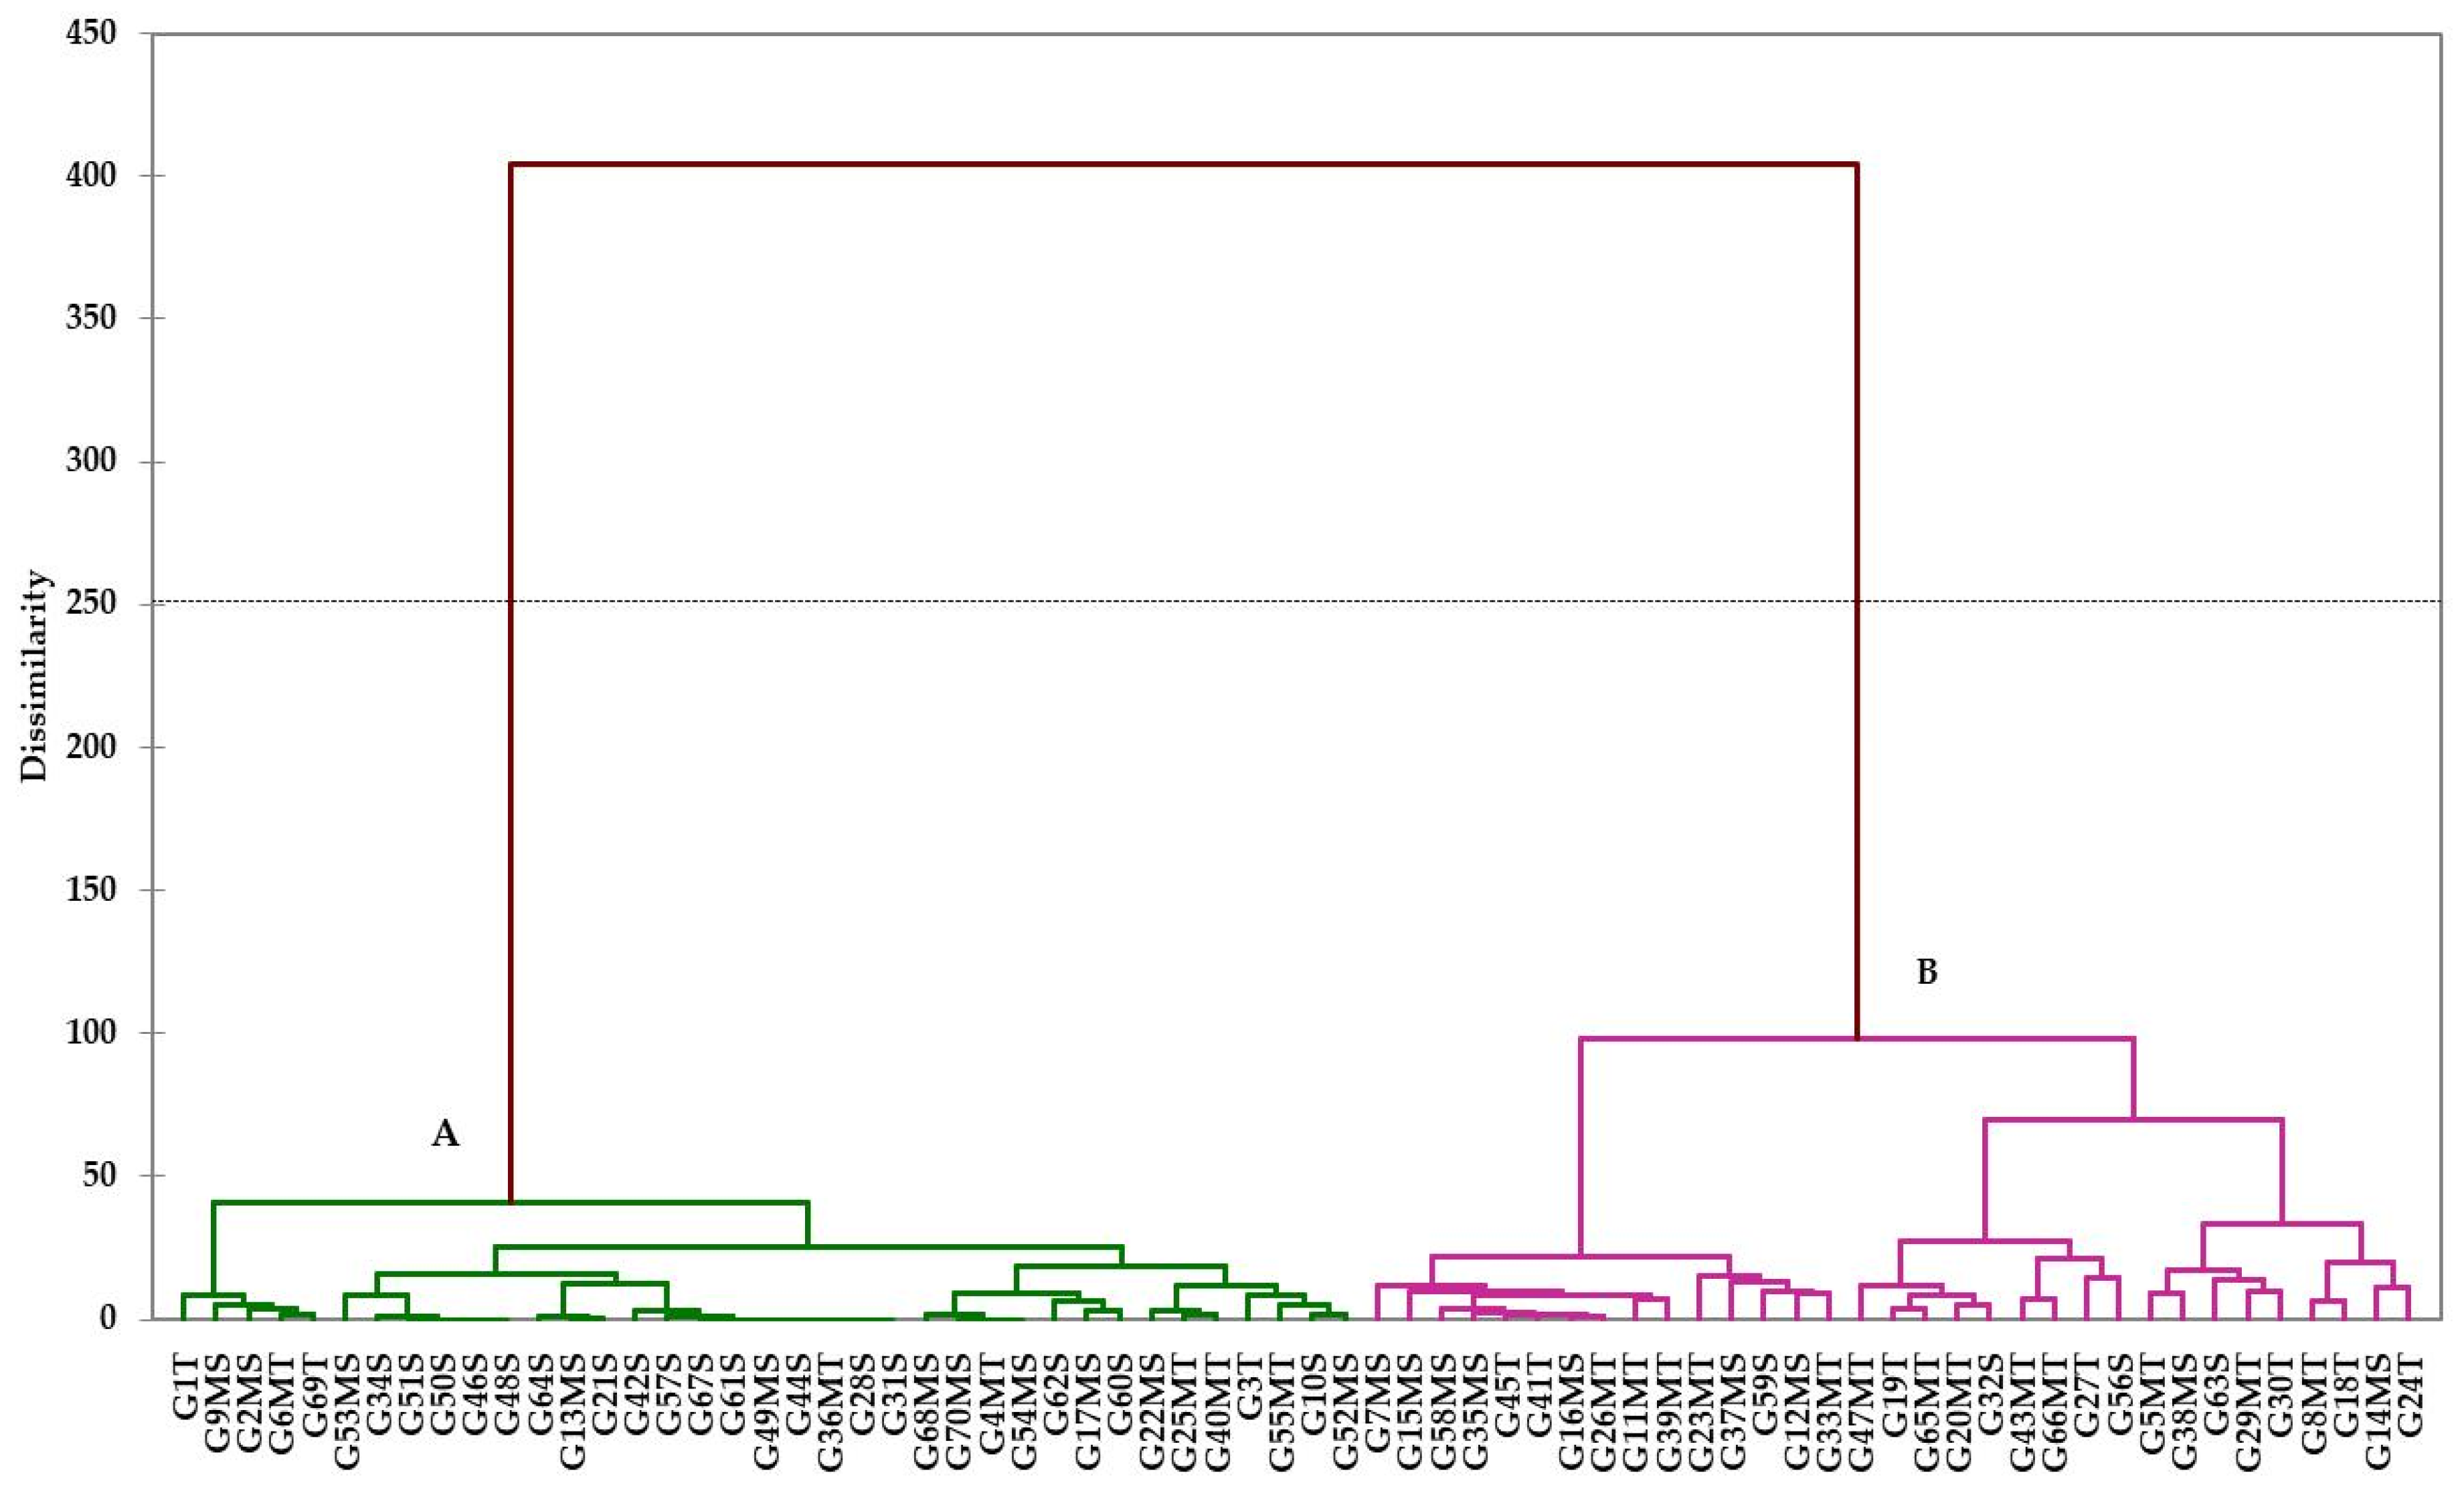
Based on STI for germination and seedling traits, the genotypes were grouped into four main clusters at each growth stage. Based on the sum ranking of genotypes for their salt tolerance for both growth stages, the genotypes re-ranked into also four categories, namely salt-tolerant (T), moderately salt-tolerant (MT), moderately salt-sensitive (MS), and salt-sensitive genotypes (S) (Table 8).
The results in Table 8 and Table 9 show that the genotypes in T category, containing 10 genotypes, attained higher values for G% and GI measured under both control and salinity conditions, as well as RL and SFW measured under control conditions, and RFW measured under both conditions and lower values for MGT measured under both conditions; however, the opposite was true for the genotypes in S category, consisting of 21 genotypes and attaining lower values for G% and GI measured under both control and salinity conditions as well as lengths of shoot and root measured under both conditions and weights of shoot and root measured under salinity conditions and lower values for MGT measured under both conditions (Table 8 and Table 9). Categories MT and MS included 19 and 20 genotypes, respectively (Table 8). The average values of germination traits measured under both conditions of the genotypes in MT and MS categories were occasionally comparable to those the genotypes in T category, whereas the genotypes of the MT possessed higher SL, RL, and SFW under salinity conditions compared with the genotypes in T category and the genotypes of the MS possessed lower SFW and RFW under control conditions compared with the genotypes in S category (Table 9).

3.7. SRAP Analysis

We used nine SRAP combinations, which showed highly polymorphic bands with good resolution on the gel to be scored. Seventy-one bands were amplified by the primer combinations, averaging 7.89 bands per primer. Out of 71, there were 65 polymorphic bands, with an average polymorphism of 7.44 for a single primer (Table 10). The number of polymorphic bands varied from three to eleven, where three were produced by combination three, while eleven bands arose from combination eight. Polymorphic information content (PIC) for most primers was more than 0.8, where the lowest was 0.4 for 9th combination and the highest for combination four. The clustering dendrogram was constructed based on the similarity matrix data using the unweighted pair-group method with arithmetic averages (UPGMA). The 70 genotypes were divided into two distinct clusters, with clusters A and B consisting of 37 and 33 genotypes, 28 and 20 of which, respectively, were sensitive and moderately sensitive genotypes, and tolerant and moderately tolerant genotypes (Figure 6)

4. Discussion

Germination and seedling are the two important stages in the life cycle of any crop, where the growth and production of the plants in the subsequent growth stages are closely associated with their performance at both stages. Importantly, the success or failure of a plant stand to reach full maturity depends on seed germination percentage and seedling establishment at the early stages. Therefore, germination and seedling stages in plant growth toward salinity stress are very important. This is because screening salt tolerance during both stages seems to be valuable in evaluating the salt tolerance of a large number of genotypes rapidly and cost-effectively. Therefore, we hypothesized in this study that if the genotypic differences in the germination ability and seedling performance occur during germination and/or seedling stages, identification of salt-tolerant genotypes at the early growth stage, which takes only about three weeks in different genotypes, can be possible.

4.1. Ability of Evaluating Salt Tolerance of Barley Genotypes at Early Stage Based on Germination Indices

Various researchers have reported the significant effects of salinity stress on germination ability [43,44]. However, conflicting results have been reported in the literature regarding genotypic differences in salt tolerance based on germination indices [45]. Some studies have reported relatively few variations in salt tolerance among genotypes during germination [46], while other studies successfully identify significant variations in salt tolerance among genotypes during this stage [46]. This discrepancy has been attributed to differences in plant species and the concentrations of salinity stress used in the evaluation of genotypes. According to previous studies, 150 mM NaCl concentration or higher was effective for detecting the salt tolerance variations among genotypes during germination [45,47,48,49]. In this study, with an increasing concentration of salinity stress, G% and GI significantly decreased, while MGT increased (Figure 1). However, the genotypic variation in these traits emerged more clearly under 200 mM NaCl, which indicates that it is possible to detect genotypic differences in salt tolerance among barley genotypes during the germination stage, but the concentration of salinity plays an important role in achieving this target. This finding is also consistent with the results reported for wheat [47,49], oat [45], and sorghum [9,50,51], they reported the efficiency of 160 mM concentration of NaCl or higher in differentiating salt tolerance among genotypes during the germination, with this degree of salt stress decreased the G% and increased the duration of germination of genotypes. In fact, high concentrations of NaCl can influence germination ability by directly altering seed water absorption due to the increased osmotic potential of germination media, which subsequently limits water uptake and thus reduces germination [7,52,53]. Moreover, allowing the toxic ions (Na+ and Cl) to enter the cells of seeds and concentrate to a high level would contribute to a disturbance in several biochemical reactions that regulate the different metabolisms involved in seed germination such as nucleic and protein metabolism, nutrient and hormone balances, energy production, and respiration [54,55,56]. Additionally, the toxic ions increase phenolic compounds [57] and reduce the use of seed reserves [58,59,60]. As a result, high salt concentrations result in seed germination inhibition and cause seed germination to be delayed. These findings were confirmed through the strong and positive correlation between G% and GI measured under both control and salinity conditions as well as moderate to strong negative correlations between both traits and MGT (Table 4). These findings indicate that, due to a higher correlation between germination traits, these traits can be used as good selection criteria for salt tolerance of barley genotyped at the early growth stage.

4.2. Ability of Evaluating Salt Tolerance of Barley Genotypes at Early Stage Based on Seedling Traits

Previous studies reported that the seedling stage plays a vital role in the growth of plants toward salinity and other abiotic stresses [49,61,62,63]. This is because the seedling shoots of most genotypes could fail to form when the specific stress regime exceeds the salinity tolerance threshold of crops, which is 200 mM NaCl for almost all crops belonging to glycophytes in general and barley in particular. As expected, the seedling growth of all genotypes, as measured by SL, RL, SFW, and RFW, was significantly decreased with the increasing salt concentrations, and at 200 mM NaCl, all genotypes failed to form shoots and roots. At 100 mM NaCl, SL, RL, SFW, and RFW were decreased by 38.1%, 28.6%, 51.6%, and 60.5%, respectively, when compared with the control treatment (Figure 2 and Figure 3). Interestingly, there were several genotypes for which the range of values in shoot and root traits, particularly, SFW and RFW, were less than two to four times the average values achieved by the highest-ranking genotypes (Figure 2 and Figure 3), which shows evidence for variability in the performance of the 70 genotypes under salinity conditions during the seedling stage. About 43% and 49% of tested genotypes recorded more than 60% reduction in SFW and RFW under 100 mM NaCl relative to control, respectively, while only 14% and 6% of tested genotypes recorded these reduction values for SL and RL, respectively. About 6%, 29%, 10%, and 3% of tested genotypes recoded less than 10% reduction in SL, RL, SFW, and RFW under 100 mM NaCl relative to control, respectively (Figure 2 and Figure 3). These results indicate that the traits of seedling shoots and roots were affected almost to the same degree by salinity, while the weights of the shoot and root were more drastically affected than their lengths. These findings also indicate that genetic variation exists within the genotypes in terms of seedling shoots and roots traits, and therefore detecting the salt tolerance of barley genotypes at the seedling stage can be possible. The decrease in length and weight of seedling shoot and root with increasing salt concentrations observed in this study for barley genotypes is in agreement with previous studies conducted for different field crops such as wheat, oat, rice, sorghum, faba bean, and lentil [63,64,65,66,67,68,69]. All of these results reported a significant reduction in lengths and weights of seedling shoot and/or root under different salinity treatments. These further confirm that the reduction of seedling roots and shoots is a common phenomenon in many crops under salinity stress conditions, with the existence of wide genetic variation for seedling traits among the genotypes. Most importantly, these findings reflect that variability in the salt stress response may be readily explored during the seedling phase, thus allowing experimentation for reliable selection of salt-tolerant genotypes at early growth stages. The reduction in lengths and weights of seedling shoots and roots could be due to the high NaCl concentration in the seedling growth media causing osmotic potential that resulted in inadequate water and essential nutrients uptake, and in addition, the toxicity effects of specific ions due to accumulation of excess Na+ and Cl ions in the shoots and roots. These negative impacts of salinity contribute to disruption in several physiological and biochemical processes that are essential for seedling growth such as limiting elongation and division of cells, reducing intercellular CO2 concentration, protein synthesis, photosynthetic pigments, leaf area, and then photosynthesis rate, and increasing the generation of reactive oxygen species. All of these negative impacts of salinity stress ultimately inhibit seedling growth and biomass accumulation [7,70,71,72,73,74].

4.3. Relationship between the Salt Tolerance during Germination and Seedling Stages

The correlation analysis can be used to define the relative importance of traits used in the evaluation as well as the degree of association between one growth stage to another. Based on the correlation results between any pairs of germination and seedling traits (Table 4) we found that (1) strong significant correlation was found between germination traits measured under control conditions with those measured under salinity conditions; (2) no significant correlation was found between traits of germination and seedling, with few exceptions; (3) weak or no correlation was found between seedling traits measured under control conditions with those measured under salinity conditions; and (4) strong positive correlation was observed between SFW and RFW when they were measured under the same conditions. These results revealed that salt tolerance during the germination and seedling stages was not correlated, suggesting that it is essential to evaluate the salt tolerance of most genotypes during both germination and seedling stages to establish an effective evaluation method. Genotypes that have better performance for germination ability under control conditions do indicate also a better performance of germination indices under salinity conditions. In contrast, the genotypes that show good performance for seedling growth under control conditions were not necessarily able to tolerate salinity stress. The close relationship between shoot and root characteristics indicates that both the seedling shoots and roots are equally sensitive to salinity stress and when roots become sensitive to salinity stress, the shoot growth is also restricted.

4.4. Detecting the Salt Tolerance of Genotypes Using Multivariate Analysis

Because the salt tolerance mechanism of plants is very complicated, particularly when evaluating a large number of genotypes at different growth stages and salinity levels, fully and accurately evaluating salt tolerance based on a single trait is difficult. Therefore, it is important to evaluate the salt tolerance of genotypes and identify the superior one based on multiple and various traits [34]. To achieve this objective, an appropriate statistical method is urgently needed. In this study, we used multivariate analyses such as principal component analysis (PCA) and cluster analysis to detect and facilitate the evaluation of salt tolerance of tested genotypes using all germination and seedling traits. The main advantages of using the multivariate analysis in the evaluation of salt tolerance are to facilitate ranking genotypes for salt tolerance even when genotypes are evaluated at different growth stages and salinity levels, allow ranking genotypes using simple numbers, detect complex relationships among genotypes, treatments, and traits in a more understandable way, and reduce a large number and wide variety of associated traits into a small number of representative variables called PCs [34,75,76,77,78,79,80]. In this study, the PCA was used to investigate the ability of all germination and seedling traits measured under control and salinity conditions for detecting the salt tolerance of genotypes at the early growth stage as well as following the performance of genotypes during germination and/or seedling stage. According to (Table 5), the PC1, which accounts 33.73% of the total variation, had a positive and strong correlation with G% and GI measured under control and salinity conditions and a negative and strong correlation with MGT measured under control and moderate salinity conditions, whereas the PC2, which accounts for 19.29% of the total variation, had a positive and strong correlation with length and weight of seedling shoots and roots measured under salinity conditions. These results reflect that selection based on the PC1 can cause the selection of genotypes with a high ability of germination and germination speed under both control and salinity conditions, whereas the selection based on PC2 can cause the selection of genotypes with a high length and weight of seedling shoots and roots under salinity conditions. Therefore, the first PC can be considered a germination ability component and the second PC can be called a seedling performance under salinity conditions component. The third PC, which accounts 10.54% of the total variation, can be considered a seedling performance under control conditions component because this PC had high and positive correlation with weight of seedling shoots and roots measured under control conditions (Table 5). Therefore, based on the first two PCs and scatter PCA-biplot (Figure 4), the genotypes located in the quarter with the highest PC1 and lowest PC2 (eighteen out of 70 genotypes) can be considered as tolerant to salinity stress only during the germination stage, whereas the genotypes located in the opposite quarter (fourteen out of 70 genotypes) can be regarded as tolerant to salinity stress only during the seedling stage. The genotypes located in the quarter with the highest PC1 and PC2 (twenty-one out of 70 genotypes) can be considered as tolerant to salinity stress during both germination and seedling stages, whereas the genotypes located in the opposite quarter (seventeen out of 70 genotypes) can be considered as sensitive to salinity stress during both stages (Figure 4). Therefore, these results confirmed the importance of using PCA for evaluating and classifying the salt tolerance of genotypes at the early growth stage using multiple traits. The use of PCA to differentiate genotypes for salt tolerance during germination and seedling stage has also been confirmed by other researchers in different crops [63,75,81,82].
Because the performance of genotypes may change across the stress and non-stress conditions, different stress tolerance indices have been proposed to understand the growth and production performance of genotypes across contrasting growth conditions [31,49,83,84]. In fact, STI is an appropriate index to identify the genotypes that have good growth performance under both stress and non-stress conditions with high tolerance to stress, therefore this index is the best discriminator of sensitive and tolerant genotypes at the seedling stage [85,86]. In this study, cluster analysis (Ward’s method) based on STI of germination and seedling traits also succeeded in classifying genotypes based on their salt tolerance and growth performance during germination and seedling growth stages. The genotypes that formed cluster 1 can be considered as tolerant to salinity stress only during the germination stage and moderately tolerant to salinity stress during the seedling stage because these genotypes had the highest STI for G% and GI, lowest STI values for MGT, and medium STI value for length and weight of seedling shoots and roots; the opposite was true for the genotypes that formed cluster 4 (Table 7). The STI values of germination traits and STI values of seedling root traits (SL and RFW) of the genotypes formed cluster 2 were comparable with those of the genotypes in cluster 1 and cluster 4, respectively, which indicate that these genotypes have the ability to tolerate to salinity stress during germination stage and have good performance for root characteristics under salinity conditions. Therefore, these results confirm that cluster analysis with STI also succeeded in identifying the genotypes differing in tolerance/sensitivity to salinity stress during germination and seedling growth stages. These findings were consistent with the results of Dehnavi et al. [9], Alam et al. [87], and Mohi-Ud-Din et al. [88], who reported that cluster analysis had been successful in defining the dissimilarity and grouping of the genotypes based on different stress tolerance indices.
Another advantage of cluster analysis (Ward’s method) is the ability to rank genotypes when the salt tolerance of plants is changed from one growth stage to another, as observed with some genotypes tested in this study. By this method, the genotypes were ranked at each growth stage by adding the numbers in cluster group ranking at each growth stage, while the genotypes were finally ranked based on the sum of these numbers with the smallest and largest sums ranked as salt-tolerant and salt-sensitive genotypes, respectively [34]. Based on this method, the genotypes were finally ranked across germination and seedling growth stages into four distinct groups (Table 8). The genotypes in group 1 attained a higher value for G% and GI measured under control and salinity conditions, RL, SFW, and RFW measured under control conditions, RFW measured under salinity conditions, and the lowest value for MGT under both conditions; however, the opposite was observed with the genotypes in group 4 (Table 9). The genotypes in group 2 attained a comparable value for germination traits with those of group 1 and a high value for SL, RL, and SFW measured under salinity conditions (Table 9). The germination ability of genotypes in group 3 was less affected by salinity stress as compared to group 4, whereas their seedling traits were affected by salinity stress as it the case with group 4 (Table 9). Therefore, the genotypes of group 1, group 2, group 3, and group 4 were considered salt-tolerant (T), moderately salt-tolerant (MT), moderately salt-sensitive (MS), and salt-sensitive (S) genotypes, respectively. As shown in Table 8, a similar salt tolerance during both stages was observed in the genotypes in group 1 as well as in the bottom 8 genotypes in group 4, whereas other genotypes were ranked as having high salt-tolerant or intermediate salt tolerance during the germination stage, but they were ranked as having poor salt tolerance during the seedling stage (Table 8). All the above-mentioned results indicate that the numbers of Ward’s method are the simplest way to differentiate genotypes for salinity stress at different growth stages. Additionally, the salt tolerance of genotypes that ranked as having strong and poor salt tolerance can be detected at the early growth stage, whereas the salt tolerance of genotypes that ranked as having intermediate salt tolerance should be evaluated at different growth stages.

4.5. Detecting the Salt Tolerance of Genotypes Based on SRAP

Different molecular markers have been developed and widely used to analyze the genetic diversity in several crops. Previous studies on different crops reported the efficiency of SRAP in diversity evaluation studies due its affordability, reproducibility, and do not require any genome related information [89,90,91]. In this study, the high PIC values illustrate the power of SRAP for this analysis (Table 10). In a Dendogram based on SRAP (Figure 6) we tagged our genotypes with their relative classification from the rank based on the numbers of Ward’s method presented in Table 8 to display their genetic relatedness. From the analysis, it is evident that most of the genotypes cluster with similar phenotypic classification of genotypes, although there are some discrepancies that could be settled down by increasing the number of primers for genetic analysis. We are not claiming that SRAP can identify the salt tolerance of genotypes but in our case, it followed the classification based on other criteria. SRAP will be useful for the selection of genotypes from the same cluster to reduce the genetic over-representation of the same germplasm as tolerant stock.

5. Conclusions

Genetic diversity is considered a valuable source in a breeding program designed for improving the salt tolerance of genotypes and/or identifying the desired traits related to salt stress tolerance. This study confirms the existence of a wide range of genotypic variability in salt tolerance among barley genotypes during the early growth stages. However, concentration of salinity is one of the most important factors for evaluating the salt tolerance of genotypes during germination and seedling stages. Results showed that barley can be considered as a salt-tolerant and moderately salt-tolerant crop during germination and seedling stages, respectively, where the seeds can withstand up to 200 mM NaCl, whereas the seedling shoots of most genotypes failed to form at this level of salinity. Germination indices and seedling traits can be used as an effective and simple tool for detecting the salt tolerance of barley genotypes at the early growth stages. However, a poor correlation between germination indices and seedling traits indicates that the salt tolerance of genotypes may change during germination and seedling stages as well as the subsequent growth stages. Therefore, multivariate analysis together with germination and seedling traits simultaneously are helpful to accurate and facilitate ranking genotypes for salt tolerance when they are evaluated across different growth stages. Based on PCA and cluster analysis, we identified the genotypes that perform well during the germination and seedling stages separately or both stages together. Cluster analysis (Ward’s method) with different germination and seedling traits simultaneously facilitates the rankings of genotypes based on their salt tolerance at each growth stage and across both stages. The variability in salt tolerance of the groups of genotypes determined by Ward’s method was verified to some extent by the SRAP markers tool. Finally, this study confirmed the usefulness of multivariate analysis as a suitable tool in barley-breeding programs for studying complex relationships among genotypes, treatments, and traits in a more understandable way and detecting the salt tolerance of genotypes at the early growth stages.

Author Contributions

Conceptualization, M.M.J., A.A.A.-D. and S.E.-H.; methodology, M.M.J., A.A.A.-D., M.U.T., S.E.-H. and M.A.K.; software, M.M.J., M.U.T. and M.A.K.; validation, M.M.J., A.A.A.-D. and S.E.-H.; formal analysis, M.M.J. and S.E.-H.; investigation, S.E.-H. and M.M.J.; resources, M.M.J. and A.A.A.-D.; data curation, M.M.J., M.A.K. and M.U.T.; writing—original draft preparation, M.M.J. and S.E.-H. writing—review and editing, S.E.-H. and M.M.J.; visualization, S.E.-H. and M.M.J.; supervision, A.A.A.-D. and S.E.-H.; project administration, M.M.J. and A.A.A.-D.; funding acquisition, A.A.A.-D. and S.E.-H. All authors have read and agreed to the published version of the manuscript.

Funding

This research was funded by the Deputyship for Research & Innovation, Ministry of Education in Saudi Arabia, grant number IFKSURG-2-609.

Institutional Review Board Statement

Not applicable.

Informed Consent Statement

Not applicable.

Data Availability Statement

All data are presented within the article.

Acknowledgments

The authors extend their appreciation to the Deputyship for Research & Innovation, Ministry of Education in Saudi Arabia for funding this research work through the project no. (IFKSURG-2-609).

Conflicts of Interest

The authors declare no conflict of interest.

References

  1. Butcher, K.; Wick, A.F.; DeSutter, T.; Chatterjee, A.; Harmon, J. Soil salinity: A threat to global food security. Agron. J. 2016, 108, 2189–2200. [Google Scholar] [CrossRef]
  2. Mansour, E.; Moustafa, E.S.; Desoky, E.-S.M.; Ali, M.M.; Yasin, M.A.; Attia, A.; Alsuhaibani, N.; Tahir, M.U.; El-Hendawy, S. Multidimensional evaluation for detecting salt tolerance of bread wheat genotypes under actual saline field growing conditions. Plants 2020, 9, 1324. [Google Scholar] [CrossRef] [PubMed]
  3. Munns, R.; James, R.A. Screening methods for salinity tolerance: A case study with tetraploid wheat. Plant Soil 2003, 253, 201–218. [Google Scholar] [CrossRef]
  4. Lei, Y.; Liu, Q.; Hettenhausen, C.; Cao, G.; Tan, Q.; Zhao, W.; Lin, H.; Wu, J. Salt-tolerant and-sensitive alfalfa (Medicago sativa) cultivars have large variations in defense responses to the lepidopteran insect Spodoptera litura under normal and salt stress condition. PLoS ONE 2017, 12, e0181589. [Google Scholar] [CrossRef] [PubMed] [Green Version]
  5. Tigabu, E.; Tesfaye, K. Response of sorghum (Sorghum bicolor (L.) Moench) genotypes to NaCl levels at early growth stages. Afr. J. Agric. Res. 2012, 7, 5711–5718. [Google Scholar]
  6. UÇARLI, C. Physiological and molecular effects of exogenous gibberellin (GA3) treatment on germination of barley seeds under salt stress. Adıyaman Univ. J. Sci. 2021, 11, 227–243. [Google Scholar] [CrossRef]
  7. El-Hendawy, S.; Elshafei, A.; Al-Suhaibani, N.; Alotabi, M.; Hassan, W.; Dewir, Y.H.; Abdella, K. Assessment of the salt tolerance of wheat genotypes during the germination stage based on germination ability parameters and associated SSR markers. J. Plant Interact. 2019, 14, 151–163. [Google Scholar] [CrossRef] [Green Version]
  8. Hakim, M.; Juraimi, A.S.; Hanafi, M.; Selamat, A.; Ismail, M.R.; Karim, S.R. Studies on seed germination and growth in weed species of rice field under salinity stress. J. Environ. Biol. 2011, 32, 529. [Google Scholar]
  9. Dehnavi, A.R.; Zahedi, M.; Ludwiczak, A.; Perez, S.C.; Piernik, A. Effect of salinity on seed germination and seedling development of sorghum (Sorghum bicolor (L.) Moench) genotypes. Agronomy 2020, 10, 859. [Google Scholar] [CrossRef]
  10. Biabani, A.; Heidari, H.; Vafaie-Tabar, M. Salinity effect of stress on germination of wheat cultivars. Int. J. Agric. Food Sci. Sci. Technol. Technol. 2013, 4, 263–268. [Google Scholar]
  11. Kano, M.; Inukai, Y.; Kitano, H.; Yamauchi, A. Root plasticity as the key root trait for adaptation to various intensities of drought stress in rice. Plant Soil 2011, 342, 117–128. [Google Scholar] [CrossRef]
  12. EL Hendawy, S.; Hu, Y.; Sakagami, J.-I.; Schmidhalter, U. Screening Egyptian wheat genotypes for salt tolerance at early growth stages. Int. J. Plant Prod. 2011, 5, 283–298. [Google Scholar]
  13. Colmer, T.; Munns, R.; Flowers, T. Improving salt tolerance of wheat and barley: Future prospects. Aust. J. Exp. Agric. 2005, 45, 1425–1443. [Google Scholar] [CrossRef]
  14. Chen, Z.; Pottosin, I.I.; Cuin, T.A.; Fuglsang, A.T.; Tester, M.; Jha, D.; Zepeda-Jazo, I.; Zhou, M.; Palmgren, M.G.; Newman, I.A.; et al. Root plasma membrane transporters controlling K+/Na+ homeostasis in salt-stressed barley. Plant Physiol. 2007, 145, 1714–1725. [Google Scholar] [CrossRef]
  15. Wu, D.; Qiu, L.; Xu, L.; Ye, L.; Chen, M.; Sun, D.; Chen, Z.; Zhang, H.; Jin, X.; Dai, F. Genetic variation of HvCBF genes and their association with salinity tolerance in Tibetan annual wild barley. PLoS ONE 2011, 6, e22938. [Google Scholar] [CrossRef] [Green Version]
  16. Witzel, K.; Weidner, A.; Surabhi, G.K.; Börner, A.; Mock, H.P. Salt stress-induced alterations in the root proteome of barley genotypes with contrasting response towards salinity. J. Exp. Bot. 2009, 60, 3545–3557. [Google Scholar] [CrossRef] [Green Version]
  17. Mano, Y.; Nakazumi, H.; Takeda, K. Varietal variation in and effects of some major genes on salt tolerance at the germination stage in barley. Jpn. J. Breed. 1996, 46, 227–233. [Google Scholar] [CrossRef] [Green Version]
  18. Mano, Y.; Takeda, K. Mapping quantitative trait loci for salt tolerance at germination and the seedling stage in barley (Hordeum vulgare L.). Euphytica 1997, 94, 263–272. [Google Scholar] [CrossRef]
  19. Xue, D.; Huang, Y.; Zhang, X.; Wei, K.; Westcott, S.; Li, C.; Chen, M.; Zhang, G.; Lance, R. Identification of QTLs associated with salinity tolerance at late growth stage in barley. Euphytica 2009, 169, 187–196. [Google Scholar] [CrossRef]
  20. Shelden, M.C.; Roessner, U.; Sharp, R.E.; Tester, M.; Bacic, A. Genetic variation in the root growth response of barley genotypes to salinity stress. Funct. Plant Biol. 2013, 40, 516–530. [Google Scholar] [CrossRef]
  21. Gupta, S.; Rupasinghe, T.; Callahan, D.L.; Natera, S.H.; Smith, P.; Hill, C.B.; Roessner, U.; Boughton, B.A. Spatio-temporal metabolite and elemental profiling of salt stressed barley seeds during initial stages of germination by MALDI-MSI and µ-XRF spectrometry. Front. Plant Sci. 2019, 10, 1139. [Google Scholar] [CrossRef] [Green Version]
  22. Shelden, M.C.; Dias, D.A.; Jayasinghe, N.S.; Bacic, A.; Roessner, U. Root spatial metabolite profiling of two genotypes of barley (Hordeum vulgare L.) reveals differences in response to short-term salt stress. J. Exp. Bot. 2016, 67, 3731–3745. [Google Scholar] [CrossRef] [PubMed] [Green Version]
  23. Ghoulam, C.; Fares, K. Effect of salinity on seed germination and early seedling growth of sugar beet (Beta vulgaris L.). Seed Sci. Technol. 2001, 29, 357–364. [Google Scholar]
  24. Punia, H.; Tokas, J.; Malik, A.; Singh, S.; Phogat, D.S.; Bhuker, A.; Mor, V.S.; Rani, A.; Sheokand, R.N. Discerning morpho-physiological and quality traits contributing to salinity tolerance acquisition in sorghum [Sorghum bicolor (L.) Moench]. S. Afr. J. Bot. 2021, 140, 409–418. [Google Scholar] [CrossRef]
  25. El-Hamamsy, S.; Behairy, R. Effect of salinity stress on seedling vigor and biochemical characters of Egyptian barley landraces (Hordeum vulgare L.). Midle East J. Appl. 2015, 5, 786–796. [Google Scholar]
  26. Garland, S.H.; Lewin, L.; Abedinia, M.; Henry, R.; Blakeney, A.J.E. The use of microsatellite polymorphisms for the identification of Australian breeding lines of rice (Oryza sativa L.). Euphytica 1999, 108, 53–63. [Google Scholar] [CrossRef]
  27. Abdel-Hamid, A.M. Physiological and molecular markers for salt tolerance in four barley cultivars. Eur. Sci. J. 2014, 10, 252–272. [Google Scholar]
  28. Yang, P.; Liu, X.; Yang, W.; Feng, Z. Diversity analysis of the developed qingke (hulless barley) cultivars representing different growing regions of the Qinghai-Tibet Plateau in China using sequencerelated amplified polymorphism (SRAP) markers. Afr. J. Biotechnol. 2010, 9, 8530–8538. [Google Scholar]
  29. Mariey, S. Genetic diversity study of Egyptian barley cultivars using sequence-related amplified polymorphism (SRAP) analysis for water stress tolerance. J. Sustain. Agric. Sci. 2018, 44, 21–37. [Google Scholar] [CrossRef]
  30. Al-Mudaris, M. Notes on various parameters recording the speed of seed germination. Der Trop.-J. Agric. Trop. Subtrop. 1998, 99, 147–154. [Google Scholar]
  31. Fernandez, G.C. Effective selection criteria for assessing plant stress tolerance. In Proceedings of the International Symposium on Adaptation of Vegetables and Other Food Crops in Temperature and Water Stress, Shanhua, Taiwan, 13–16 August 1992; pp. 257–270. [Google Scholar]
  32. Doyle, J. DNA protocols for plants. In Molecular Techniques in Taxonomy; Springer: Berlin/Heidelberg, Germany, 1991; pp. 283–293. [Google Scholar]
  33. Naceur, A.B.; Chaabane, R.; El-Faleh, M.; Abdelly, C.; Ramla, D.; Nada, A.; Sakr, M. Genetic diversity analysis of North Africa’s barley using SSR markers. J. Genet. Eng. Biotechnol. 2012, 10, 13–21. [Google Scholar] [CrossRef] [Green Version]
  34. El-Hendawy, S.E.; Hu, Y.; Yakout, G.M.; Awad, A.M.; Hafiz, S.E.; Schmidhalter, U. Evaluating salt tolerance of wheat genotypes using multiple parameters. Eur. J. Agron. 2005, 22, 243–253. [Google Scholar] [CrossRef]
  35. Hammer, Ø.; Harper, D.A.; Ryan, P.D. PAST: Paleontological statistics software package for education and data analysis. Palaeontol. Electron. 2001, 4, 1–9. [Google Scholar]
  36. Team, R. RStudio: Integrated Development for R. RStudio. Available online: http://www.rstudio.com/ (accessed on 22 January 2021).
  37. Galili, T. dendextend: An R package for visualizing, adjusting and comparing trees of hierarchical clustering. Bioinformatics 2015, 31, 3718–3720. [Google Scholar] [CrossRef] [Green Version]
  38. Beattie, K.A. Worldwide Bayesian Causal Impact Analysis of Vaccine Administration on Deaths and Cases Associated with COVID-19: A BigData Analysis of 145 Countries. ResearchGate 2021. Available online: https://www.datascienceassn.org/content/worldwide-bayesian-causal-impact-analysis-vaccine-administration-deaths-and-cases-associated (accessed on 13 December 2022).
  39. Peterson, B.G.; Carl, P.; Boudt, K.; Bennett, R.; Ulrich, J.; Zivot, E.; Lestel, M.; Balkissoon, K.; Wuertz, D.; Peterson, M.B.G. Performance Analytics: Econometric Tools for Performance and Risk Analysis. R Package Version 1. Available online: https://cran.r-project.org/web/packages/PerformanceAnalytics/index.html (accessed on 15 August 2021).
  40. Wickham, H.; Hester, J.; Chang, W. Devtools: Tools to Make Developing R Packages Easier. R Package Version 2.3.1. 2020. Available online: https://CRAN.R-project.org/package=devtools (accessed on 13 December 2020).
  41. Wickham, H.; Chang, W.; Henry, L.; Pedersen, T.L.; Takahashi, K.; Wilke, C.; Woo, K.; Yutani, H.; Dunnington, D. ggplot2: Create Elegant Data Visualisations Using the Grammar of Graphics. R package Version 3.3.2. 2020. Available online: https://CRAN.R-project.org/package=ggplot2 (accessed on 13 December 2021).
  42. Kassambara, A.; Kassambara, M.A. Package ‘ggpubr’. R Package Version 0.3.5; R Foundation for Statistical Computing: Vienna, Austria, 2012. [Google Scholar]
  43. Qiu, L.; Wu, D.; Ali, S.; Cai, S.; Dai, F.; Jin, X.; Wu, F.; Zhang, G. Evaluation of salinity tolerance and analysis of allelic function of HvHKT1 and HvHKT2 in Tibetan wild barley. Theor. Appl. Genet. 2011, 122, 695–703. [Google Scholar] [CrossRef]
  44. Gul, B.; Ansari, R.; Flowers, T.J.; Khan, M.A. Germination strategies of halophyte seeds under salinity. Environ. Exp. Bot. 2013, 92, 4–18. [Google Scholar] [CrossRef]
  45. Bai, Q.; Wang, X.; Chen, X.; Shi, G.; Liu, Z.; Guo, C.; Xiao, K. Wheat miRNA TaemiR408 acts as an essential mediator in plant tolerance to Pi deprivation and salt stress via modulating stress-associated physiological processes. Front. Plant Sci. 2018, 9, 499. [Google Scholar] [CrossRef]
  46. Mwando, E.; Angessa, T.T.; Han, Y.; Li, C. Salinity tolerance in barley during germination—Homologs and potential genes. J. Zhejiang Univ.-Sci. B. 2020, 21, 93–121. [Google Scholar] [CrossRef]
  47. Wahid, A.; Perveen, M.; Gelani, S.; Basra, S.M. Pretreatment of seed with H2O2 improves salt tolerance of wheat seedlings by alleviation of oxidative damage and expression of stress proteins. J. Plant Physiol. 2007, 164, 283–294. [Google Scholar] [CrossRef]
  48. Oyiga, B.C.; Sharma, R.; Shen, J.; Baum, M.; Ogbonnaya, F.; Léon, J.; Ballvora, A. Identification and characterization of salt tolerance of wheat germplasm using a multivariable screening approach. J. Agron. Crop Sci. 2016, 202, 472–485. [Google Scholar] [CrossRef]
  49. Tao, R.; Ding, J.; Li, C.; Zhu, X.; Guo, W.; Zhu, M. Evaluating and screening of agro-physiological indices for salinity stress tolerance in wheat at the seedling stage. Front. Plant Sci. 2021, 12, 646175. [Google Scholar] [CrossRef]
  50. Almodares, A.; Hadi, M.; Dosti, B. Effects of salt stress on germination percentage and seedling growth in sweet sorghum cultivars. J. Biol. Sci. 2007, 7, 1492–1495. [Google Scholar] [CrossRef] [Green Version]
  51. Kinfemichael, G.A.; Melkamu, G.W. Response of some lowland growing sorghum (Sorghum bicolor L. Moench) accessions to salt stress during germination and seedling growth. Afr. J. Agric. Res. 2008, 3, 044–048. [Google Scholar]
  52. Jamil, M.; Lee, D.B.; Jung, K.Y.; Ashraf, M.; Lee, S.C.; Rha, E.S. Effect of salt (NaCl) stress on germination and early seedling growth of four vegetable species. J. Cent. Eur. Agric. 2006, 7, 273–282. [Google Scholar]
  53. Khan, M.A.; Khan, M.A.; Weber, D.J. Ecophysiology of High Salinity Tolerant Plants; Springer Science & Business Media: Berlin/Heidelberg, Germany, 2006; Volume 40. [Google Scholar]
  54. Gomes-Filho, E.; Lima, C.R.F.M.; Costa, J.H.; da Silva, A.C.M.; da Guia Silva Lima, M.; de Lacerda, C.F.; Prisco, J.T. Cowpea ribonuclease: Properties and effect of NaCl-salinity on its activation during seed germination and seedling establishment. Plant Cell Rep. 2008, 27, 147–157. [Google Scholar] [CrossRef]
  55. Kazemi, K.; Eskandari, H. Effects of salt stress on germination and early seedling growth of rice (Oryza sativa) cultivars in Iran. Afr. J. Biotechnol. 2011, 10, 17789–17792. [Google Scholar] [CrossRef]
  56. Malik, J.A.; AlQarawi, A.A.; AlZain, M.N.; Dar, B.A.; Habib, M.M.; Ibrahim, S.N.S. Effect of salinity and temperature on the seed germination and seedling growth of desert forage grass Lasiurus scindicus Henr. Sustainability 2022, 14, 8387. [Google Scholar] [CrossRef]
  57. Ayaz, F.; Kadioglu, A.; Turgut, R. Water stress effects on the content of low molecular weight carbohydrates and phenolic acids in Ctenanthe setosa (Rosc.) Eichler. Can. J. Plant Sci. 2000, 80, 373–378. [Google Scholar] [CrossRef]
  58. Promila, K.; Kumar, S. Vigna radiata seed germination under salinity. Biol. Plant. 2000, 43, 423–426. [Google Scholar] [CrossRef]
  59. Othman, Y.; Al-Karaki, G.; Al-Tawaha, A.; Al-Horani, A. Variation in germination and ion uptake in barley genotypes under salinity conditions. World J. Agric. Sci. 2006, 2, 11–15. [Google Scholar]
  60. Aflaki, F.; Sedghi, M.; Pazuki, A.; Pessarakli, M. Investigation of seed germination indices for early selection of salinity tolerant genotypes: A case study in wheat. Emir. J. Food Agric. 2017, 29, 222–226. [Google Scholar] [CrossRef] [Green Version]
  61. Khan, W.D.; Tanveer, M.; Shaukat, R.; Ali, M.; Pirdad, F. An overview of salinity tolerance mechanism in plants. In Salt and Drought Stress Tolerance in Plants; Tanveer, M., Hasanuzzaman, M., Eds.; Springer: Cham, Switzerland, 2020; pp. 1–16. [Google Scholar]
  62. Shah, A.N.; Tanveer, M.; Abbas, A.; Fahad, S.; Baloch, M.S.; Ahmad, M.I.; Saud, S.; Song, Y. Targeting salt stress coping mechanisms for stress tolerance in Brassica: A research perspective. Plant Physiol. Biochem. 2021, 158, 53–64. [Google Scholar] [CrossRef] [PubMed]
  63. Uzair, M.; Ali, M.; Fiaz, S.; Attia, K.; Khan, N.; Al-Doss, A.A.; Khan, M.R.; Ali, Z. The characterization of wheat genotypes for salinity tolerance using morpho-physiological indices under hydroponic conditions. Saudi J. Biol. Sci. 2022, 29, 103299. [Google Scholar] [CrossRef] [PubMed]
  64. Shuba, A.; Patil, S.S.; Rajeshwari, M. Seed priming with endophytes: A novel approach for future prospects. J. Pharmacogn. Phytochem. 2019, 8, 1442–1446. [Google Scholar]
  65. El-Hendawy, S.; Ruan, Y.; Hu, Y.; Schmidhalter, U. A comparison of screening criteria for salt tolerance in wheat under field and controlled environmental conditions. J. Agron. Crop Sci. 2009, 195, 356–367. [Google Scholar] [CrossRef]
  66. Bai, J.; Yan, W.; Wang, Y.; Yin, Q.; Liu, J.; Wight, C.; Ma, B. Screening oat genotypes for tolerance to salinity and alkalinity. Front. Plant Sci. 2018, 9, 1302. [Google Scholar] [CrossRef]
  67. Rasel, M.; Tahjib-Ul-Arif, M.; Hossain, M.; Sayed, M.; Hassan, L. Discerning of rice landraces (Oryza sativa L.) for morpho-physiological, antioxidant enzyme activity, and molecular markers’ responses to induced salt stress at the seedling stage. J. Plant Growth Regul. 2020, 39, 41–59. [Google Scholar] [CrossRef]
  68. El-Bastawisy, Z.M.; El-Katony, T.M.; Abd El-Fatah, S.N. Genotypic variability in salt tolerance of Vicia faba during germination and early seedling growth. J. King Saud Univ. Sci. 2018, 30, 270–277. [Google Scholar] [CrossRef]
  69. Foti, C.; Khah, E.; Pavli, O. Germination profiling of lentil genotypes subjected to salinity stress. Plant Biol. 2019, 21, 480–486. [Google Scholar] [CrossRef] [Green Version]
  70. Ashraf, M.A.; Ashraf, M. Salt-induced variation in some potential physiochemical attributes of two genetically diverse spring wheat (Triticum aestivum L.) cultivars: Photosynthesis and photosystem II efficiency. Pak. J. Bot. 2012, 44, 53–64. [Google Scholar]
  71. Radi, A.A.; Farghaly, F.A.; Hamada, A.M. Physiological and biochemical responses of salt-tolerant and salt-sensitive wheat and bean cultivars to salinity. J. Biol. Earth Sci. 2013, 3, 72–88. [Google Scholar]
  72. Taïbi, K.; Taïbi, F.; Abderrahim, L.A.; Ennajah, A.; Belkhodja, M.; Mulet, J.M. Effect of salt stress on growth, chlorophyll content, lipid peroxidation and antioxidant defence systems in Phaseolus vulgaris L. S. Afr. J. Bot. 2016, 105, 306–312. [Google Scholar] [CrossRef]
  73. Acosta-Motos, J.R.; Ortuño, M.F.; Bernal-Vicente, A.; Diaz-Vivancos, P.; Sanchez-Blanco, M.J.; Hernandez, J.A. Plant responses to salt stress: Adaptive mechanisms. Agronomy 2017, 7, 18. [Google Scholar] [CrossRef] [Green Version]
  74. Shoukat, E.; Ahmed, M.Z.; Abideen, Z.; Azeem, M.; Ibrahim, M.; Gul, B.; Khan, M.A. Short and long term salinity induced differences in growth and tissue specific ion regulation of Phragmites karka. Flora 2020, 263, 151550. [Google Scholar] [CrossRef]
  75. Pour-Aboughadareh, A.; Sanjani, S.; Nikkhah-Chamanabad, H.; Mehrvar, M.R.; Asadi, A.; Amini, A. Identification of salt-tolerant barley genotypes using multiple-traits index and yield performance at the early growth and maturity stages. Bull. Natl. Res. Cent. 2021, 45, 117. [Google Scholar] [CrossRef]
  76. Jadidi, O.; Etminan, A.; Azizi-Nezhad, R.; Ebrahimi, A.; Pour-Aboughadareh, A. Physiological and molecular responses of barley genotypes to salinity stress. Genes 2022, 13, 2040. [Google Scholar] [CrossRef] [PubMed]
  77. Al-Dakheel, A.J.; Hussain, M.I. Genotypic variation for salinity tolerance in Cenchrus ciliaris L. Front. Plant Sci. 2016, 7, 1090. [Google Scholar] [CrossRef] [Green Version]
  78. Aslam, M.; Maqbool, M.A.; Zaman, Q.U.; Shahid, M.; Akhtar, M.A.; Rana, A.S. Comparison of different tolerance indices and PCA biplot analysis for assessment of salinity tolerance in lentil (Lens culinaris) genotypes. Int. J. Agric. Biol. 2017, 19, 470–478. [Google Scholar] [CrossRef]
  79. Magudeeswari, P.; Sastry, E.V.; Devi, T.R. Principal component (PCA) and cluster analyses for plant nutrient traits in baby corn (Zea mays L.). Indian J. Agric. Res. 2019, 3, 353–357. [Google Scholar] [CrossRef] [Green Version]
  80. Alam, M.S.; Hossain, S.; Ali, M.A.; Hossain, M.G.; Islam, M.F. Assessment of genetic divergence in tomato (Solanum lycopersicum L.) through clustering and principal component analysis. J. Agric. Sci. Eng. Innov. 2020, 1, 10–14. [Google Scholar]
  81. Ahmadi, J.; Pour-Aboughadareh, A.; Fabriki-Ourang, S.; Mehrabi, A.A.; Siddique, K.H.M. Screening wild progenitors of wheat for salinity stress at early stages of plant growth: Insight into potential sources of variability for salinity adaptation in wheat. Crop Pasture Sci. 2018, 69, 649–658. [Google Scholar] [CrossRef]
  82. Pour-Aboughadareh, A.; Poczai, P. A dataset on multi-trait selection approaches for screening desirable wild relatives of wheat. Data Brief 2021, 39, 107541. [Google Scholar] [CrossRef] [PubMed]
  83. Singh, S.; Sengar, R.S.; Kulshreshtha, N.; Datta, D.; Tomar, R.S.; Rao, V.P.; Garg, D.; Ojha, A. Assessment of multiple tolerance indices for salinity stress in bread wheat (Triticum aestivum L.). J. Agric. Sci. Eng. Innov. 2015, 7, 49–57. [Google Scholar] [CrossRef]
  84. El-Hendawy, S.; Al-Suhaibani, N.; Mubushar, M.; Tahir, M.U.; Refay, Y.; Tola, E. Potential Use of hyperspectral reflectance as a high-throughput nondestructive phenotyping tool for assessing salt tolerance in advanced spring wheat lines under field conditions. Plants 2021, 10, 2512. [Google Scholar] [CrossRef]
  85. Ahmadi, J.; Pour-Aboughadareh, A.; Fabriki Ourang, S.; Khalili, P.; Poczai, P. Unraveling salinity stress responses in ancestral and neglected wheat species at early growth stage: A baseline for utilization in future wheat improvement programs. Physiol. Mol. Biol. Plants 2020, 26, 537–549. [Google Scholar] [CrossRef]
  86. Pour-Aboughadareh, A.; Ahmadi, J.; Mehrabi, A.A.; Etminan, A.; Moghaddam, M.; Siddique, K.H. Physiological responses to drought stress in wild relatives of wheat: Implications for wheat improvement. Acta Physiol. Plant. 2017, 39, 106. [Google Scholar] [CrossRef]
  87. Alam, M.S.; Tester, M.; Fiene, G.; Mousa, M.A.A. Early growth stage characterization and the biochemical responses for salinity stress in tomato. Plants 2021, 10, 712. [Google Scholar] [CrossRef]
  88. Mohi-Ud-Din, M.; Hossain, M.A.; Rohman, M.M.; Uddin, M.N.; Haque, M.S.; Ahmed, J.U.; Hossain, A.; Hassan, M.M.; Mostofa, M.G. Multivariate analysis of morpho-physiological traits reveals differential drought tolerance potential of bread wheat genotypes at the seedling stage. Plants 2021, 10, 879. [Google Scholar] [CrossRef]
  89. Zaefizadeh, M.; Goliev, R. Diversity and relationships among durum wheat landraces (subconvars) by SRAP and phenotypic marker polymorphism. Res. J. Biol. Sci. 2009, 4, 960–966. [Google Scholar]
  90. El-Rawy, M.A.E.; Youssef, M. Evaluation of drought and heat tolerance in wheat based on seedling traits and molecular analysis. J. Crop Sci. Biotechnol. 2014, 17, 183–189. [Google Scholar] [CrossRef]
  91. Abulela, H.A.; El Shafee, E.; Farag, H.M.; Yacoub, I.H.; Elarabi, N.I. Evaluation of the morpho-physiological traits and the genetic diversity of some Egyptian bread wheat cultivars under salt stress conditions. Cereal Res. Commun. 2022, 50, 733–753. [Google Scholar] [CrossRef]
Figure 1. Effects of different salt concentrations on germination percentage (A), germination index (B), and mean germination time (C) of 70 barley genotypes under control, 100 mM NaCl, and 200 mM NaCl. Data are means ± SE (n = 3). The full names of the different abbreviations of genotypes are listed in Table 1.
Agronomy 12 03217 g001
Figure 2. Shoot length (A), shoot fresh weight (B), and percentage changes of both traits from control (C) of 70 barley genotypes under control and 100 mM NaCl conditions. Values are means ± SE (n = 3). The full names of the different abbreviations of genotypes are listed in Table 1.
Agronomy 12 03217 g002
Figure 3. Root length (A), root fresh weight (B), and percentage changes of both traits from control (C) of 70 barley genotypes under control and 100 mM NaCl conditions. Values are means ± SE (n = 3). The full names of the different abbreviations of genotypes are listed in Table 1.
Agronomy 12 03217 g003
Figure 4. Biplot of principal component analysis between different germination and seedling traits of all barley genotypes evaluated under control and salinity conditions. The vectorial arrows from the origin of scattered biplot indicate positive and negative correlation among traits. G%, GI, MGT, SL, RL, SFW, and RFW indicate germination percentage, germination index, mean germination time, shoot length, root length, shoot fresh weight, and root fresh weight, respectively, under control (C), 100 mM NaCl (S1), and 200 mM NaCl (S2).
Agronomy 12 03217 g004
Figure 5. Hierarchical cluster derived by Ward’s methods of 70 barley genotypes based on salt tolerance indices of germination and seedling shoots and roots traits measured under control and salinity conditions. The full names of genotypes are listed in Table 1.
Agronomy 12 03217 g005
Figure 6. Dendogram from cluster analysis (UPGMA) based on genetic similarity as revealed by SRAP markers analysis. UPGMA indicates unweighted pair group method of arithmetic means.
Agronomy 12 03217 g006
Table 1. Full name, abbreviation (Abb.), and source of the different barley genotypes used in this study.
Genotype NameAbb.SourceGenotype NameAbb.Source
Giza121G1EgyptGiza121/Local/12-1G36Saudi Arabia
BeecherG2ICARDAGiza123/Local/2G37Saudi Arabia
Lignee/Local/174-29-8-3G3Saudi ArabiaER/ApmG38ICARDA
BegonaG4ICARDAGiza121/Local/1-10-5-5G39Saudi Arabia
CarboG5ICARDAArar/h.spont.19-12G40ICARDA
LigneeG6CIMMYTC.C.89/Giza124G41Saudi Arabia
Giza123/Local/1G7Saudi ArabiaGustoe/Local/4G42Saudi Arabia
Wl2291G8ICARDASahrawy/Local/4G43Saudi Arabia
Giza134G9EgyptGiza121/Local/4G44Saudi Arabia
TadmorG10ICARDAGustoeG45Commercial
Dd-21G11ICARDAGiza126G46Egypt
Lignee/Local/4G12Saudi ArabiaJusto/Local/5G47Saudi Arabia
SahrawyG13EgyptGiza121/Justo-3G48Saudi Arabia
Justo/Local/88-29-10G14Saudi ArabiaGustoe/Local/2G49Saudi Arabia
Barley GpG15PakistanC.C.89/Giza123G50Saudi Arabia
Sahrawy/Local/1G16Saudi ArabiaGiza123/Justo-4G51Saudi Arabia
Giza123/Local/4G17Saudi ArabiaGiza121/Local/5G52Saudi Arabia
WaveneyG18ICARDARehaneG53CIMMYT
Giza127G19ARC-EgyptLignee/Local/182-30-9-4G54Saudi Arabia
GranadoG20ICARDAGiza123/Local/24-8-1G55Saudi Arabia
Local (Assir)G21Saudi ArabiaGiza123/Local/40-18-4G56Saudi Arabia
Carina/moroc9-75G22ICARDAGustoe/Local/1G57Saudi Arabia
Justo/Local/59-13G23Saudi ArabiaGiza123/Local/30-11-3G58Saudi Arabia
Giza121/Local/3G24Saudi ArabiaRihana/LigneeG59ICARDA
316-80G25ICARDALignee/Local/5G60Saudi Arabia
Justo/Local/80-28-9G26Saudi ArabiaSahrawy/Local/5G61Saudi Arabia
Giza123G27EgyptGiza123/Local/3G62Saudi Arabia
Assala-04G28ICARDAGp No. 5G63Pakistan
Giza 133G29EgyptGiza123/Local/30-7G64Saudi Arabia
Giza123/Local/15-14-7-7G30Saudi ArabiaJusto/Local/56-12G65Saudi Arabia
Lignee/Local/3G31Saudi ArabiaILBAG66CIMMYT
ArmelleG32ICARDAGustoe/Local/3G67Saudi Arabia
Giza124G33EgyptLignee/Local/1G68Saudi Arabia
Giza126-1G34EgyptGiza2000G69Egypt
Giza121/Local/1G35Saudi ArabiaSLb42-046G70ICARDA
Table 2. SRAP combination and their sequences used in this study.
CombinationForward Primer SequenceReverse Primer Sequence
1TGAGTCCAAACCGGATAGACTGCGTACGAATTAAT
2TGAGTCCAAACCGGATAGACTGCGTACGAATTTGC
3TGAGTCCAAACCGGATAGACTGCGTACGAATTGAC
4TGAGTCCAAACCGGAGCGACTGCGTACGAATTAAT
5TGAGTCCAAACCGGAGCGACTGCGTACGAATTTGC
6TGAGTCCAAACCGGAGCGACTGCGTACGAATTGAC
7GAGTCCAAACCGGAAGGACTGCGTACGAATTAAT
8GAGTCCAAACCGGAAGGACTGCGTACGAATTTGC
9GAGTCCAAACCGGAAGGACTGCGTACGAATTGAC
Table 3. Analysis of variance (F and p values) for the effects of genotypes, salinity, and their interaction on shoot length (SL), root length (RL), shoot fresh weight (SFW), and root fresh weight (RFW) of seedling after 21 days from sowing.
Traits SourceF Valuep Value
SLGenotypes (G)19.480.000 ***
Salinity (S)2395.830.000 ***
G×S8.260.000 ***
RLGenotypes (G)5.680.000 ***
Salinity (S)143.450.000 ***
G×S5.560.000 ***
SFWGenotypes (G)4.970.000 ***
Salinity (S) 476.520.000 ***
G×S4.170.000 ***
RFWGenotypes (G)2.660.000 ***
Salinity (S)322.760.000 ***
G×S3.070.000 ***
*** indicate significance at p ≤ 0.001 probability level, respectively.
Table 4. Pearson’s correlation matrix (lower left) and their significant levels (upper right) between germination and seedling traits of all barley genotypes evaluated under control and salinity conditions.
TraitsG% (C)G% (S1)G% (S2)GI (C)GI (S1)GI (S2)MGT (C)MGT (S1)MGT (S2)SL (C)SL (S1)RL (C)RL (S1)SFW (C)SFW (S1)RFW (C)RFW (S1)
G% *******************ns******nsnsnsnsns
G% (S1)0.79 ****************ns******nsnsnsnsns
G% (S2)0.720.79 *****************nsnsnsnsnsnsns
GI (C)0.860.680.69 **************nsnsnsnsnsnsnsns
GI (S1)0.680.810.750.78 ***********nsnsnsnsnsnsnsns
GI (S2)0.560.590.790.650.81 *********nsnsnsnsnsnsnsns
MGT(C)−0.41−0.29−0.44−0.71−0.55−0.52 *****nsnsnsnsnsnsnsns
MGT(S1)−0.28−0.36−0.41−0.46−0.77−0.660.50 ***nsnsnsnsnsnsnsns
MGT(S2)−0.13−0.10−0.29−0.25−0.41−0.720.440.55 nsnsnsnsnsnsnsns
SL (C)−0.25−0.34−0.26−0.03−0.13−0.05−0.13−0.06−0.12 **nsns*********
SL (S1)−0.26−0.27−0.10−0.07−0.100.07−0.110.02−0.210.44 ns**ns***ns***
RL (C)−0.28−0.24−0.17−0.16−0.11−0.020.12−0.02−0.110.220.12 **nsnsnsns
RL (S1)0.020.020.080.050.090.060.01−0.070.100.180.420.35 ns**ns***
SFW (C)−0.23−0.18−0.18−0.08−0.08−0.09−0.04−0.060.000.570.160.10−0.02 ns*****
SFW (S1)−0.18−0.180.040.01−0.010.08−0.13−0.05−0.080.370.750.060.440.22 ns***
RFW (C)0.06−0.08−0.150.04−0.09−0.190.030.090.210.36−0.160.120.020.57−0.05 ns
RFW (S1)−0.19−0.180.00−0.07−0.010.060.02−0.13−0.090.270.450.200.420.260.690.11
G%, GI, MGT, SL, RL, SFW, and RFW indicate germination percentage, germination index, mean germination time, shoot length, root length, shoot fresh weight, and root fresh weight, respectively, under control (C), 100 mM NaCl (S1), and 200 mM NaCl (S2). The bold values in the table and ** and *** indicate significant correlation at the 0.05, 0.01, and 0.001 probability levels, respectively.
Table 5. Eigen value, cumulative variability, and factor loadings of the first five principal components (PCs) for different germination and seedling traits measured under control and salinity conditions of all barley genotypes.
TraitsPC1PC2PC3PC4PC5
G% (C)0.817−0.2100.1450.352−0.030
G% (S1)0.825−0.2250.0380.3190.086
G% (S2)0.8620.010−0.0940.2150.033
GI (C)0.8700.0620.2030.199−0.167
GI (S1)0.9300.1140.0570.0020.133
GI (S2)0.8650.257−0.102−0.2250.100
MGT (C)−0.642−0.278−0.1620.2070.267
MGT (S1)−0.659−0.306−0.0560.366−0.189
MGT (S2)−0.471−0.3600.1340.677−0.040
SL (C)−0.2240.6540.447−0.129−0.102
SL (S1)−0.1470.766−0.3240.059−0.292
RL (C)−0.2260.334−0.035−0.1330.797
RL (S1)0.0030.527−0.2620.5210.387
SFW (C)−0.2030.4530.712−0.052−0.062
SFW (S1)−0.0740.807−0.2470.271−0.289
RFW (C)−0.1560.1310.8360.2420.168
RFW (S1)−0.1070.724−0.1310.2550.060
Eigenvalue5.733.281.791.511.17
Variability (%)33.7319.2910.548.866.91
Cumulative %33.7353.0363.5772.4379.33
G%, GI, MGT, SL, RL, SFW, and RFW indicate germination percentage, germination index, mean germination time, shoot length, root length, shoot fresh weight, and root fresh weight, respectively, under control (C), 100 mM NaCl (S1), and 200 mM NaCl (S2). Values in bold denote traits for the suggested factor name.
Table 6. Salt tolerance indices for different germination and seedling traits of 70 barley genotypes (Gen.) under 100 (S1) and 200 (S2) mM NaCl.
Gen.G%
(S1)
G%
(S2)
GI
(S1)
GI
(S2)
MGT
(S1)
MGT
(S2)
SL
(S1)
RL
(S1)
SFW
(S1)
RFW
(S1)
Gen.G%
(S1)
G%
(S2)
GI
(S1)
GI
(S2)
MGT
(S1)
MGT
(S2)
SL
(S1)
RL
(S1)
SFW
(S1)
RFW
(S1)
G11.191.191.230.960.989.170.441.080.460.50G360.950.890.760.701.6410.490.720.800.480.35
G21.191.191.180.781.049.480.420.470.450.35G371.010.840.710.402.2712.590.800.660.840.55
G31.251.171.371.250.938.600.621.280.180.13G381.030.851.060.441.029.750.470.600.370.23
G41.191.171.341.270.928.240.890.570.680.31G391.090.850.770.381.5911.880.621.020.760.34
G51.211.171.321.240.948.980.700.890.680.60G400.880.810.780.651.619.321.131.010.570.52
G61.151.150.800.591.849.560.820.670.490.18G410.880.760.690.351.4611.950.480.580.571.07
G71.131.091.231.231.048.540.380.710.230.17G420.680.650.490.511.8812.110.560.560.450.30
G81.071.050.850.621.7411.150.531.220.370.53G430.940.781.050.670.858.980.850.960.490.28
G91.031.031.100.731.189.300.650.770.340.18G441.030.790.710.402.2512.160.520.810.170.16
G101.191.120.990.491.6311.760.580.350.330.09G450.920.740.820.481.5211.520.521.180.330.78
G111.231.121.261.051.058.850.840.760.790.49G461.130.780.750.371.7711.320.300.210.370.46
G121.171.091.301.090.869.400.440.390.230.22G470.940.660.750.351.6112.461.011.980.980.78
G131.111.071.090.731.069.700.290.720.250.45G481.150.740.700.412.8215.540.190.310.080.05
G141.031.010.870.691.5810.140.340.550.250.16G491.150.720.970.521.7611.690.700.730.710.43
G151.121.100.990.861.349.120.670.440.180.15G500.930.710.740.421.3210.810.240.660.160.19
G160.990.971.081.000.978.900.510.490.120.05G510.890.690.730.371.6311.110.330.660.160.41
G171.050.971.190.940.838.900.820.450.390.43G520.730.660.600.601.549.410.620.420.280.18
G181.061.041.131.000.988.940.670.401.121.14G530.860.650.700.491.669.980.630.670.320.36
G190.960.900.760.521.389.840.690.561.360.63G540.640.500.480.301.9912.980.820.980.920.98
G201.030.970.920.651.4211.560.571.050.320.24G550.460.460.460.331.239.190.920.620.990.54
G211.010.950.950.561.2210.700.410.630.190.29G560.840.550.190.083.5220.120.360.660.100.15
G220.990.950.810.431.6111.470.520.250.780.24G570.780.510.590.361.9111.440.250.260.220.18
G231.030.950.990.711.1510.680.621.330.640.41G580.570.400.440.331.7111.840.950.770.700.31
G240.970.951.041.040.999.420.871.050.700.27G590.770.510.690.311.4511.640.580.560.300.44
G251.070.940.710.591.8410.320.830.510.650.06G600.530.400.400.202.1013.131.150.500.850.64
G261.050.951.160.840.939.770.890.820.710.39G610.580.340.170.112.2114.020.950.470.880.44
G270.930.930.840.511.3510.760.420.700.491.04G620.310.310.070.073.0812.710.791.001.010.28
G280.890.860.190.172.8815.170.260.910.060.17G630.750.380.460.232.1712.080.810.510.290.26
G290.980.980.960.801.498.500.720.720.560.35G640.590.330.330.142.5714.950.270.550.030.16
G300.860.850.910.801.059.411.021.071.331.38G650.440.360.210.202.5915.901.031.040.851.07
G310.960.920.830.811.3511.490.420.520.400.26G660.530.400.410.341.799.130.940.740.540.50
G320.920.920.490.422.8613.040.810.660.530.50G671.070.380.780.181.9913.970.540.620.210.33
G331.110.890.550.303.5217.150.410.960.390.89G680.270.200.170.072.1016.360.971.300.870.28
G341.010.890.880.441.2611.470.230.420.130.21G690.650.180.630.061.3210.130.770.990.690.35
G351.010.871.170.790.788.690.540.690.390.18G700.340.140.070.031.478.380.590.610.170.22
G%, GI, MGT, SL, RL, SFW, and RFW indicate germination percentage, germination index, mean germination time, shoot length, root length, shoot fresh weight, and root fresh weight, respectively, under control (C), 100 mM NaCl (S1), and 200 mM NaCl (S2). The full names of genotypes are listed in Table 1.
Table 7. Mean values of stress tolerance index for different germination and seedling traits under different salt concentrations of the four clusters of 70 barley genotypes.
TraitsCluster 1Cluster 2Cluster 3Cluster 4
Genotypes No.272878
G% (S1)0.990.940.750.75
G% (S2)0.930.780.560.54
GI (S1)1.010.760.340.48
GI (S2)0.820.480.200.25
MGT (S1)1.141.592.862.26
MGT (S2)9.1011.2016.4513.11
SL (S1)0.690.540.500.86
RL (S1)0.720.680.820.86
SFW (S1)0.510.450.340.78
RFW (S1)0.390.380.400.56
G%, GI, MGT, SL, RL, SFW, and RFW indicate germination percentage, germination index, mean germination time, shoot length, root length, shoot fresh weight, and root fresh weight, respectively, under 100 mM NaCl (S1), and 200 mM NaCl (S2).
Table 8. Final ranking of genotypes (Gen.) for their relative salt tolerance at the germination stage (GS) and seedling stage (SS) based on the stress tolerance index of the traits of each stage in cluster analysis (Ward’s minimum variance analysis).
Gen.GSSSSumRankFTDGen.GSSSSumRankFTD
G181121TG151453MS
G191121TG161453MS
G301121TG171453MS
G11231TG222353MS
G31231TG351453MS
G241231TG372353MS
G272131TG381453MS
G412131TG492353MS
G452131TG521453MS
G691231TG531453MS
G41342MTG544153MS
G51342MTG582353MS
G61342MTG683253MS
G82242MTG701453MS
G111342MTG102464S
G202242MTG212464S
G232242MTG312464S
G251342MTG342464S
G261342MTG422464S
G291342MTG442464S
G333142MTG462464S
G361342MTG502464S
G392242MTG512464S
G401342MTG572464S
G431342MTG592464S
G472242MTG624264S
G551342MTG632464S
G653142MTG283474S
G661342MTG324374S
G21453MSG483474S
G71453MSG563474S
G91453MSG604374S
G121453MSG614374S
G131453MSG643474S
G141453MSG674484S
T, MT, MS, and S indicate salt-tolerant, moderately salt-tolerant, moderately salt-sensitive, and salt-sensitive genotypes, respectively. FTD indicates final tolerance degree.
Table 9. Mean values of different germination and seedling traits measured under different salt concentrations of the four categories of salt tolerance of genotypes.
TraitsTMTMSS
G% (C)90.1791.6787.5886.23
G% (S1)83.8381.7580.6776.78
G% (S2)74.6773.6070.8358.33
GI (C)17.2417.1116.2214.17
GI (S1)13.7812.3412.849.78
GI (S2)10.019.359.225.75
MGT (C)1.111.171.151.37
MGT (S1)1.591.941.762.22
MGT (S2)13.2313.2913.2013.90
SL (C)35.0334.9133.7731.10
SL (S1)20.6025.2019.8417.52
RL (C)13.1912.9411.9011.52
RL (S1)9.9610.587.977.26
SFW (C)1.351.101.051.09
SFW (S1)0.650.720.510.36
RFW (C)0.860.670.610.68
RFW (S1)0.380.330.240.20
G%, GI, MGT, SL, RL, SFW, and RFW indicate germination percentage, germination index, mean germination time, shoot length, root length, shoot fresh weight, and root fresh weight, respectively, under control (C), 100 mM NaCl (S1), and 200 mM NaCl (S2).
Table 10. PCR amplicons obtained from SRAP markers.
Primer Comb.ANPBNP%TPDP%PIC
18810035211.940.82
27710032410.450.80
373434224.480.80
41187358211.940.90
513118533616.420.86
6661002798.960.81
77710035010.450.84
861118326316.420.80
9661003038.960.40
Total716788432111007.11
Avg/Primer7.897.4498356.7811.110.79
AN, PBN, P%, TP, DP% and PIC indicate amplicon numbers, polymorphic bands numbers, polymorphism percentage, total bands, discrimination power, and polymorphic information content, respectively.
Publisher’s Note: MDPI stays neutral with regard to jurisdictional claims in published maps and institutional affiliations.

