Article

Genotype × Environment Interaction Influence Secondary Metabolite in Cowpea Infested by Flower Bud Thrips

by
Hellen Wairimu Gitonga
1,2,
Samuel Kyamanywa
1,
Perpetua Arusei
1,2,3,
Musondolya Mathe Lukanda
1,2,4,
Richard Edema
1,2 and
Isaac O. Dramadri
1,2,*
1
Department of Agricultural Production, Makerere University, Kampala Uganda, Kampala P.O. Box 7062, Uganda
2
Makerere University Regional Centre of Crop Improvement, College of Agricultural and Environmental Sciences, Makerere University, Kampala P.O. Box 7062, Uganda
3
Department of Biological Sciences, Moi University, Eldoret P.O. Box 3900-30100, Kenya
4
Faculté des Sciences Agronomiques, Université Catholique du Graben, Butembo P.O. Box 29, Nord Kivu, Democratic Republic of the Congo
*
Author to whom correspondence should be addressed.
Agronomy 2022, 12(12), 3210; https://doi.org/10.3390/agronomy12123210
Submission received: 20 September 2022 / Revised: 18 October 2022 / Accepted: 20 October 2022 / Published: 18 December 2022

Abstract

:
Secondary metabolites are among the major contributors of host-plant resistance. Cowpea produces secondary metabolites that are known to enhance resistance to insect pests including flower bud thrips. However, environmental conditions tend to affect the production of secondary metabolites, thereby affecting the response of the host plants to insect pest. The objective of this study was to determine the effect of the genotype × environment interaction on the production of secondary metabolites and flower bud thrips resistance in cowpea. Six cowpea genotypes were evaluated for flower bud thrips damage and the contents of flavonoids, antioxidants, phenolics, proteins, lignin, tannins and reducing sugars in four environments with varying temperatures and rainfall patterns. The data collected were subjected to the analysis of variance and genotype and genotype × environment (GGE) analysis. Flower thrips damage, and the contents of flavonoids, antioxidants, lignin, tannins and reducing sugars varied significantly (p < 0.001) among genotypes. Genotype Sanzi produced high levels of antioxidants, while TVU-9820 led in phenolic concentrations respectively. Metabolite contents were significantly (p < 0.001) different among environments, with the long rain season of field experiments led to increased production of flavonoids, proteins, lignin and tannins. A resistant genotype, TVU-3804, produced relatively stable contents of flavonoids, antioxidants, phenolics, proteins and reducing sugars across environments. In this study, the environment influenced the concentration of the metabolites, which in turn affected the cowpea’s resistance to flower bud thrips.

1. Introduction

Cowpea (Vigna unguiculata), one of the most important legume crops in Uganda, is cultivated in over an area of 15 million ha worldwide [1]. The productivity is, however, low, owing to several challenges that affects cowpea production that include a combination of insect pests, diseases and abiotic factors [2]. Among the insect pests of economic importance in cowpea is flower bud thrips (Megalurothrips sjostedti), which infest the crop during the flowering stage, causing the browning of stipules and flower bud abscission. In severe infestation, flower thrips can cause 100% yield loss [3]. For effective control of thrips, combining different control strategies is necessary. An important and environmentally friendly strategy in controlling thrips is the use of resistant genotypes. In recent studies, several genotypes have been identified as resistant to flower bud thrips [4,5,6,7]. The resistance to thrips in cowpea is contributed by genes that trigger immune responses. It was further reported that production of secondary metabolites contributes significantly to resistance of cowpea to flower bud thrips as defense mechanisms at various stages of insect pest attack [8,9]. Resistance to flower bud thrips can be influenced by the environment, as observed with genotype Sanzi, which was found to be resistant in Nigeria [10] and Ghana [6], but moderately resistant in Uganda [4]. In addition, the variations in resistance are an indication that the secondary metabolites produced as a defense mechanism are also influenced by the environment. However, the extent of the environmental effect on production of secondary metabolites associated with the resistance of cowpea to flower bud thrips remains unknown. Environmental conditions as well as pest infestation such as thrips affect biochemical and physiological plant defensive mechanisms [11], and these processes may have an effect on plant–pest interaction [12]. Plant responses to attacks have been found to be complex, hence, it is important to understand the environment–plant–insect interaction [13].
In recent decades, there has been rapid environmental changes globally which affect the plant–insect interaction [12]. For instance, reports indicate that temperature and rainfall have an effect on flower bud thrips population densities [14]. The environmental factors affect pest fecundity, mortality and emigration [9]. Consequently, the presence of crop (host), pest and a favorable environment (often known as disease/pest triangle), determines whether the crop is susceptible or resistant to the pest. Nevertheless, plants in different environments have co-evolved with specific biotic and abiotic conditions, and have developed some mechanisms of resistance which have enabled successful growth and reproduction [15].
Stresses, both biotic and abiotic, induce plants to produce secondary metabolites and volatile organic compounds, such as flavonoids, antioxidants, tannins, ethylene, terpenes, phenolics among others, depending on different pathways [2,16]. As a result of their adaptive capacities, plants have incorporated signals into their developmental pathways which enable the production of the metabolites [17]. However, variations in the production and quantity of metabolites are not predictable, especially under the varying environments conditions and pest infestations [9]. Furthermore, studies on the plasticity of the metabolites in varying environmental conditions are limited. For a successful cowpea improvement program, understanding the plant–insect–metabolites–environment interaction is important. Flavonoids, tannins, antioxidants, reducing sugars, total phenolics, among others, are some of the secondary metabolites reported to influence resistance of cowpea to flower bud thrips [8]. Changes in the concentration of phenolics, for example, result in changes in the lipid packing order and decrease the flexible nature of the plant membrane [18]. This limits the nutrient availability to insects as a result of protein denaturation [19], hence, reducing the survival rate of insects. Changes in temperature and moisture affect the plant cell water potential due to the pressure exerted in xylem [20]. In addition, moisture and temperature affect the plant’s antioxidative capacity [21]. Modifications that occur in the content of tannins and other phenolics may reduce the palatability and improve the defense of plants to pests [19].
Numerous statistical methods have been suggested to determine the stability of genotypes. Among them are the Linn and Binn superiority index, Shukla’s stability variance, Finlay and Wilkinson stability, additive main effects and multiplicative interactions (AMMI) and genotype and genotype by environment interaction (GGE), among others [22,23,24]. The choice of the method depends on the type of data and the expected output. AMMI and GGE have been used to determine the genotype × environment interaction for multivariate analysis in different traits [4,25,26,27,28,29]. Although both are powerful tools to study the stability of genotypes, the GGE biplot was found to be superior to AMMI because it explains more genotype plus genotype by environment, and has the inner property of the biplot [30]. In cowpea, genotype × environment studies have been carried out for different traits. For instance, significant genotype × environment interactions for yield were reported among cowpea genotypes in Ethiopia, Nigeria and Ghana respectively [31,32,33]. In addition, significant genotype × environment interaction for the secondary metabolites has been found in cassava (Manihot esculenta) under the influence of whitefly (Bemisia tabaci) [34]. However, the influence of environmental factors on the production of secondary metabolites that contributes to flower bud thrips resistance in cowpea remains unknown. The objective of this study was to determine the genotype × environment interaction of secondary metabolites on cowpea resistance to flower bud thrips. This information is important in breeding for cowpea resistance to flower bud thrips and deployment of resistant genotypes to a wide range of environments.

2. Materials and Methods

2.1. Plant Material, Sites and Experimental Procedure

Six genotypes, Lori Niebe, TVU-201, TVU-9820, TVU-3804, TVU-7647 and Sanzi were selected from previous screening, based on their level of resistance to flower bud thrips. Genotypes, TVU-3804 and TVU-7647, were resistant, Lori Niebe and Sanzi were moderately resistant, while TVU-201 and TVU-9820 were susceptible to flower bud thrips (unpublished data). The experiment was carried out in 2021 at Makerere University Agricultural Research Institute Kabanyolo (MUARIK) in the field and in screen house (SH) during the long rain season, herein referred to as MUARIK_21a and SH_21a, respectively, and during the short rain season, herein referred to as MUARIK_21b and SH_21b, respectively. MUARIK lies at 0°28′ N, 32°37′ E, 1200 m above sea level and the soils are sandy-clay-loam [35]. To ensure a sufficient population of thrips, a susceptible genotype WC36 was planted around the experiment area as well as between blocks, 2 weeks before the establishment of the experiment. The six genotypes were planted in a randomized complete block design with 3 replications. Three seeds were planted per hole and the seedlings were thinned to two plants per stand, 10 days after sprouting. The plots measured 3 × 3 m with spacing of 0.75 m and an intra-row space of 0.25 m. In the screen house, 3 seeds were planted per pot. Four pots represented a plot. There was no fertilizer application at any point of the crop growth. Weeding was carried out manually with a hoe. In addition, there was no application of pesticide nor fungicide during the cropping seasons.

2.2. Data Collection

Data were collected on thrips damage scores from ten plants selected randomly within the plot, on a scale of 1–9, at 50, 65 and 80 days after planting (DAP). Scores were defined as: 1–3 = resistant, 4–6 = moderately resistant and 7–9 = susceptible. Rating was based on a combination of varying intensities of thrips-induced browning of the stipules and flower buds, non-elongation of peduncles, and flower bud abscission, as shown in Table 1.
The maximum and minimum temperature was measured in a thermometer, and the rainfall amount was measured on rain gauges from meteorological stations at the study sites. The recordings were carried out monthly, and the readings are shown in Table 2.
Sixty days after planting, the terminal leaves, racemes, floral buds and flowers of the six genotypes were collected for secondary metabolite determination at the National Crops Resources Research Institute (NaCRRI)’s biochemistry laboratory, Namulonge, in Uganda.

2.2.1. Determination of Total Flavonoid Content

The sample preparation was carried out by weighing 1 g of fresh leaves and a floral sample using a weigh balance. Using motor and pestle, the sample was crushed, and 0.6 mL of 80% methanol was added. The mixture was vortexed and shaken in an orbital shaker for 30 min. This was followed by centrifugation at 6000 rpm at 4 °C for 10 min. The flavonoids were then estimated by the aluminum chloride (AlCl3) method [37]. One milliliter of the methanolic supernatant was transferred into an empty 50 mL falcon tube. Four milliliters of distilled water were added to the extract, followed by 0.3 mL of 5% sodium nitrate solution. The mixture was vortexed and incubated in the dark for 5 min, after which 3 mL of 10% aluminum chloride was added. Incubation in the dark was repeated for 6 min. Two milliliters of 1 M of sodium hydroxide were added and the volume was made up to 10 mL using distilled water. The solution was vortexed and incubated in the dark for 10 min. The absorbance was recorded at 510 nm using a UV–visible spectrophotometer. The total flavonoid content was calculated as a quercetin acid equivalent (mg/g) from the calibration curve Y = 0.002x + 6 × 10⁻⁵, R2 = 0.9781.

2.2.2. Determination of Total Phenolic Content

The determination of the total phenolic content was carried out following the method described by [38]. The sample preparation was similar to that of flavonoids, as described in Section 2.2.1. One milliliter of clear supernatant was transferred into an empty 50 mL falcon tube. To this, 5 mL of distilled water was added followed by 0.5 mL of Folin–Ciocalteu’s reagent. A total of 1.5 mL of 20% sodium carbonate was added to the sample, filled to 10 mL with distilled water and vortexed. The mixture was incubated in water bath at 40 °C for 30 min. Absorbance readings were carried out at 750 nm using a spectrophotometer. The total phenolic content was calculated as a gallic acid equivalent (mg/g) from the calibration curve Y = 0.764x − 0.0152, R2 = 0.9952.

2.2.3. Determination of Proteins

A total of 0.5 g of fresh sample was weighed, and the extraction was carried out using 5 mL of ionic stress buffer (50 mM Tris.HCL and 200 mM NaCl, PH 8.5) [39]. The mixture was vortexed and shaken on an orbital shaker for 30 min for maximum protein extraction. The mixture was centrifuged at 6000 rpm at 4 °C for 10 min. One milliliter of the supernatant was transferred to an empty 50 mL falcon tube; 3 mL of biuret solution was added then vortexed. The absorbance readings were carried out at 540 nm. The calibration of percentage proteins was carried out using the standard equation Y = 5.2858x − 0.1041, R2 = 0.9942.

2.2.4. Determination of Total Reducing Sugars

Sample preparation was performed as described in Section 2.2.1. To determine the content of total reducing sugars, 0.5 mL of the methanolic extract supernatant was transferred to an empty 50 mL falcon tube and diluted with 1 mL distilled water [40]. This was followed by the addition of 1 mL of concentrated sulfuric acid (H2SO4) to dehydrate the solution. Half milliliter of 5% phenol was added for the formation of the colored complex compound (mild gold color complex) of the reducing sugars. Quantification of reducing sugars was carried out at 490 nm using spectrophotometer. Calibration of the reducing sugars (%) was carried out using the standard equation Y = 5.785x − 0.0015, R2 = 0.9987.

2.2.5. Determination of Total Tannins

Sample preparation was carried out as described in Section 2.2.1. The total tannins were determined using the modification of Harbourne method [39]. One milliliter of the extract was transferred into an empty 50 mL falcon tube. Half milliliter of 5% ascorbic acid solution was added to dissolve the precipitants. The mixture was vortexed and shaken on an orbital shaker for 30 min for efficient mixing. Half milliliter of petroleum ether containing 1% acetic acid was added followed by 0.3 mL distilled water, vortexed and centrifuged at 6000 rpm at 4 °C for 10 min. The organic supernatant was transferred into an empty 50 mL falcon tube, 2.4 mL of the 5% HCL-butanol added, vortexed, and 0.5 mL of Folin–Ciocalteu’s reagent added. Two and half of 20% sodium carbonate solution was added and vortexed. The resultant mixture was incubated for 30 min at 80 °C and cooled in a cold-water bath at 25 °C. A spectrophotometric absorbance reading was carried out at 550 nm and total tannins was calibrated using the standard curve Y = 0.0279x + 0.0001, R2 = 0.9844.

2.2.6. Determination of Total Antioxidants

Preparation of the sample was similar to that of flavonoids in Section 2.2.1. Determination of total antioxidants was carried out according to the method described by [41]. Half milliliter of the supernatant was picked and transferred into an empty 50 mL falcon tube where 2.5 mL of 0.2 M sodium sulphate buffer was added, followed by additional 2.5 mL of potassium phosphate fericyanide. The mixture was vortexed and incubated in a water bath at 50 °C for 20 min. After cooling, 2.5 mL of tricholoroacetic acid was added into the solution and was mixed well by shaking. The mixture was centrifuged at 6000 rpm at 4 °C for 10 min. From the clear supernatant, 5 mL was transferred into a clean empty 50 mL falcon tube and 5 mL of distilled water was added. One milliliter of 0.1% ferric chloride was added and the solution was mixed well by shaking. The absorbance readings were carried out at 700 nm using a spectrophotometer, and calibration was performed using the standard equation Y = 0.0022x + 3 × 10⁻⁵, R2 = 0.9642.

2.2.7. Determination of Lignin Content

Acid insoluble lignin, also known as Klason lignin, was determined by the Klason method [42] through subjecting lignin to an acid hydrolysis process. The acidic hydrolysis was carried out by adding 3.75 mL of sulfuric acid (72%) to 0.375 g of lignin powder in digestion tubes (50 mL falcon tubes), and the uniform mixture was generated by stirring. The mixture was left for 1 h at 30 °C in the water bath and the resultant mixture was diluted with 36.25 mL of distilled water and incubated at 100 °C for 3 h in a water bath. The mixture was cooled in a cold-water bath for 15 min and then filtered under vacuum. The resulting solid, which was the insoluble lignin, was calculated as follows:
Acid   Insoluble   Lignin = B A C × 100
where A is the weight of the empty 50 mL falcon tube (g), B is the weight of the 50 mL falcon tube plus dried lignin residue (g) and C is the initial weight of the lignin sample (g). Acid soluble lignin (ASL) was determined spectrophotometrically (UV absorption at 280 nm). The filtrate was diluted with 1 M H2SO4 until the absorbance reached between 0.1 to 0.8 cm−1. The acid-soluble lignin was calculated as follows:
Acid   Soluble   Lignin ASL = A × B × C D × E × 100
where A is the absorbance at 280 nm, B is dilution factor, C is filtrate volume (L), D is extinction coefficient of lignin (110 g·L−1·cm−1) and E is the initial lignin weight (g). The percentage of total lignin content was thereafter determined by the sum of the insoluble and soluble lignin, and was expressed as the percentage of the total weight of powder analyzed.

2.3. Statistical Analysis

A combined analysis of variance was carried out on flower bud thrips damage and secondary metabolites across 4 environments using the Restricted Maximum Likelihood (REML) procedure in R software. The following model was used for analysis:
y i j k = μ + g i + e j + b k + g e i j + ε i j k
where yijk is the observed trait value for the ith genotype from jth environment in the kth block; µ is the overall mean effect, gi is the ith genotype effect, ej is the jth environment effect, bk is the effect of kth block, geij is the interaction effect of ith genotype and jth environment, ɛijk is the experimental error.
Genotype and Genotype × Environment (GGE) biplots were used to visualize the stability of genotypes, and the ranking of genotypes was based on the ideal genotype, comparing the test environments based on the secondary metabolites and thrips damage. The GGE biplots were generated using Genstat version 18. The model for GGE is as shown:
Y h i j = u + ϵ h + g i + g ϵ h i + β j h + ε h i j
where u is the population mean, ϵ h is the effect of the hth environment, g i is the effect of the ith genotype, g ϵ h i is the interaction effect between genotype and environment, β j h is the effect of the block, while ε h i j is the random error.
To assess the degree of association between traits, Pearson’s correlation analysis on mean trait values within each genotype was performed using the R package.

3. Results

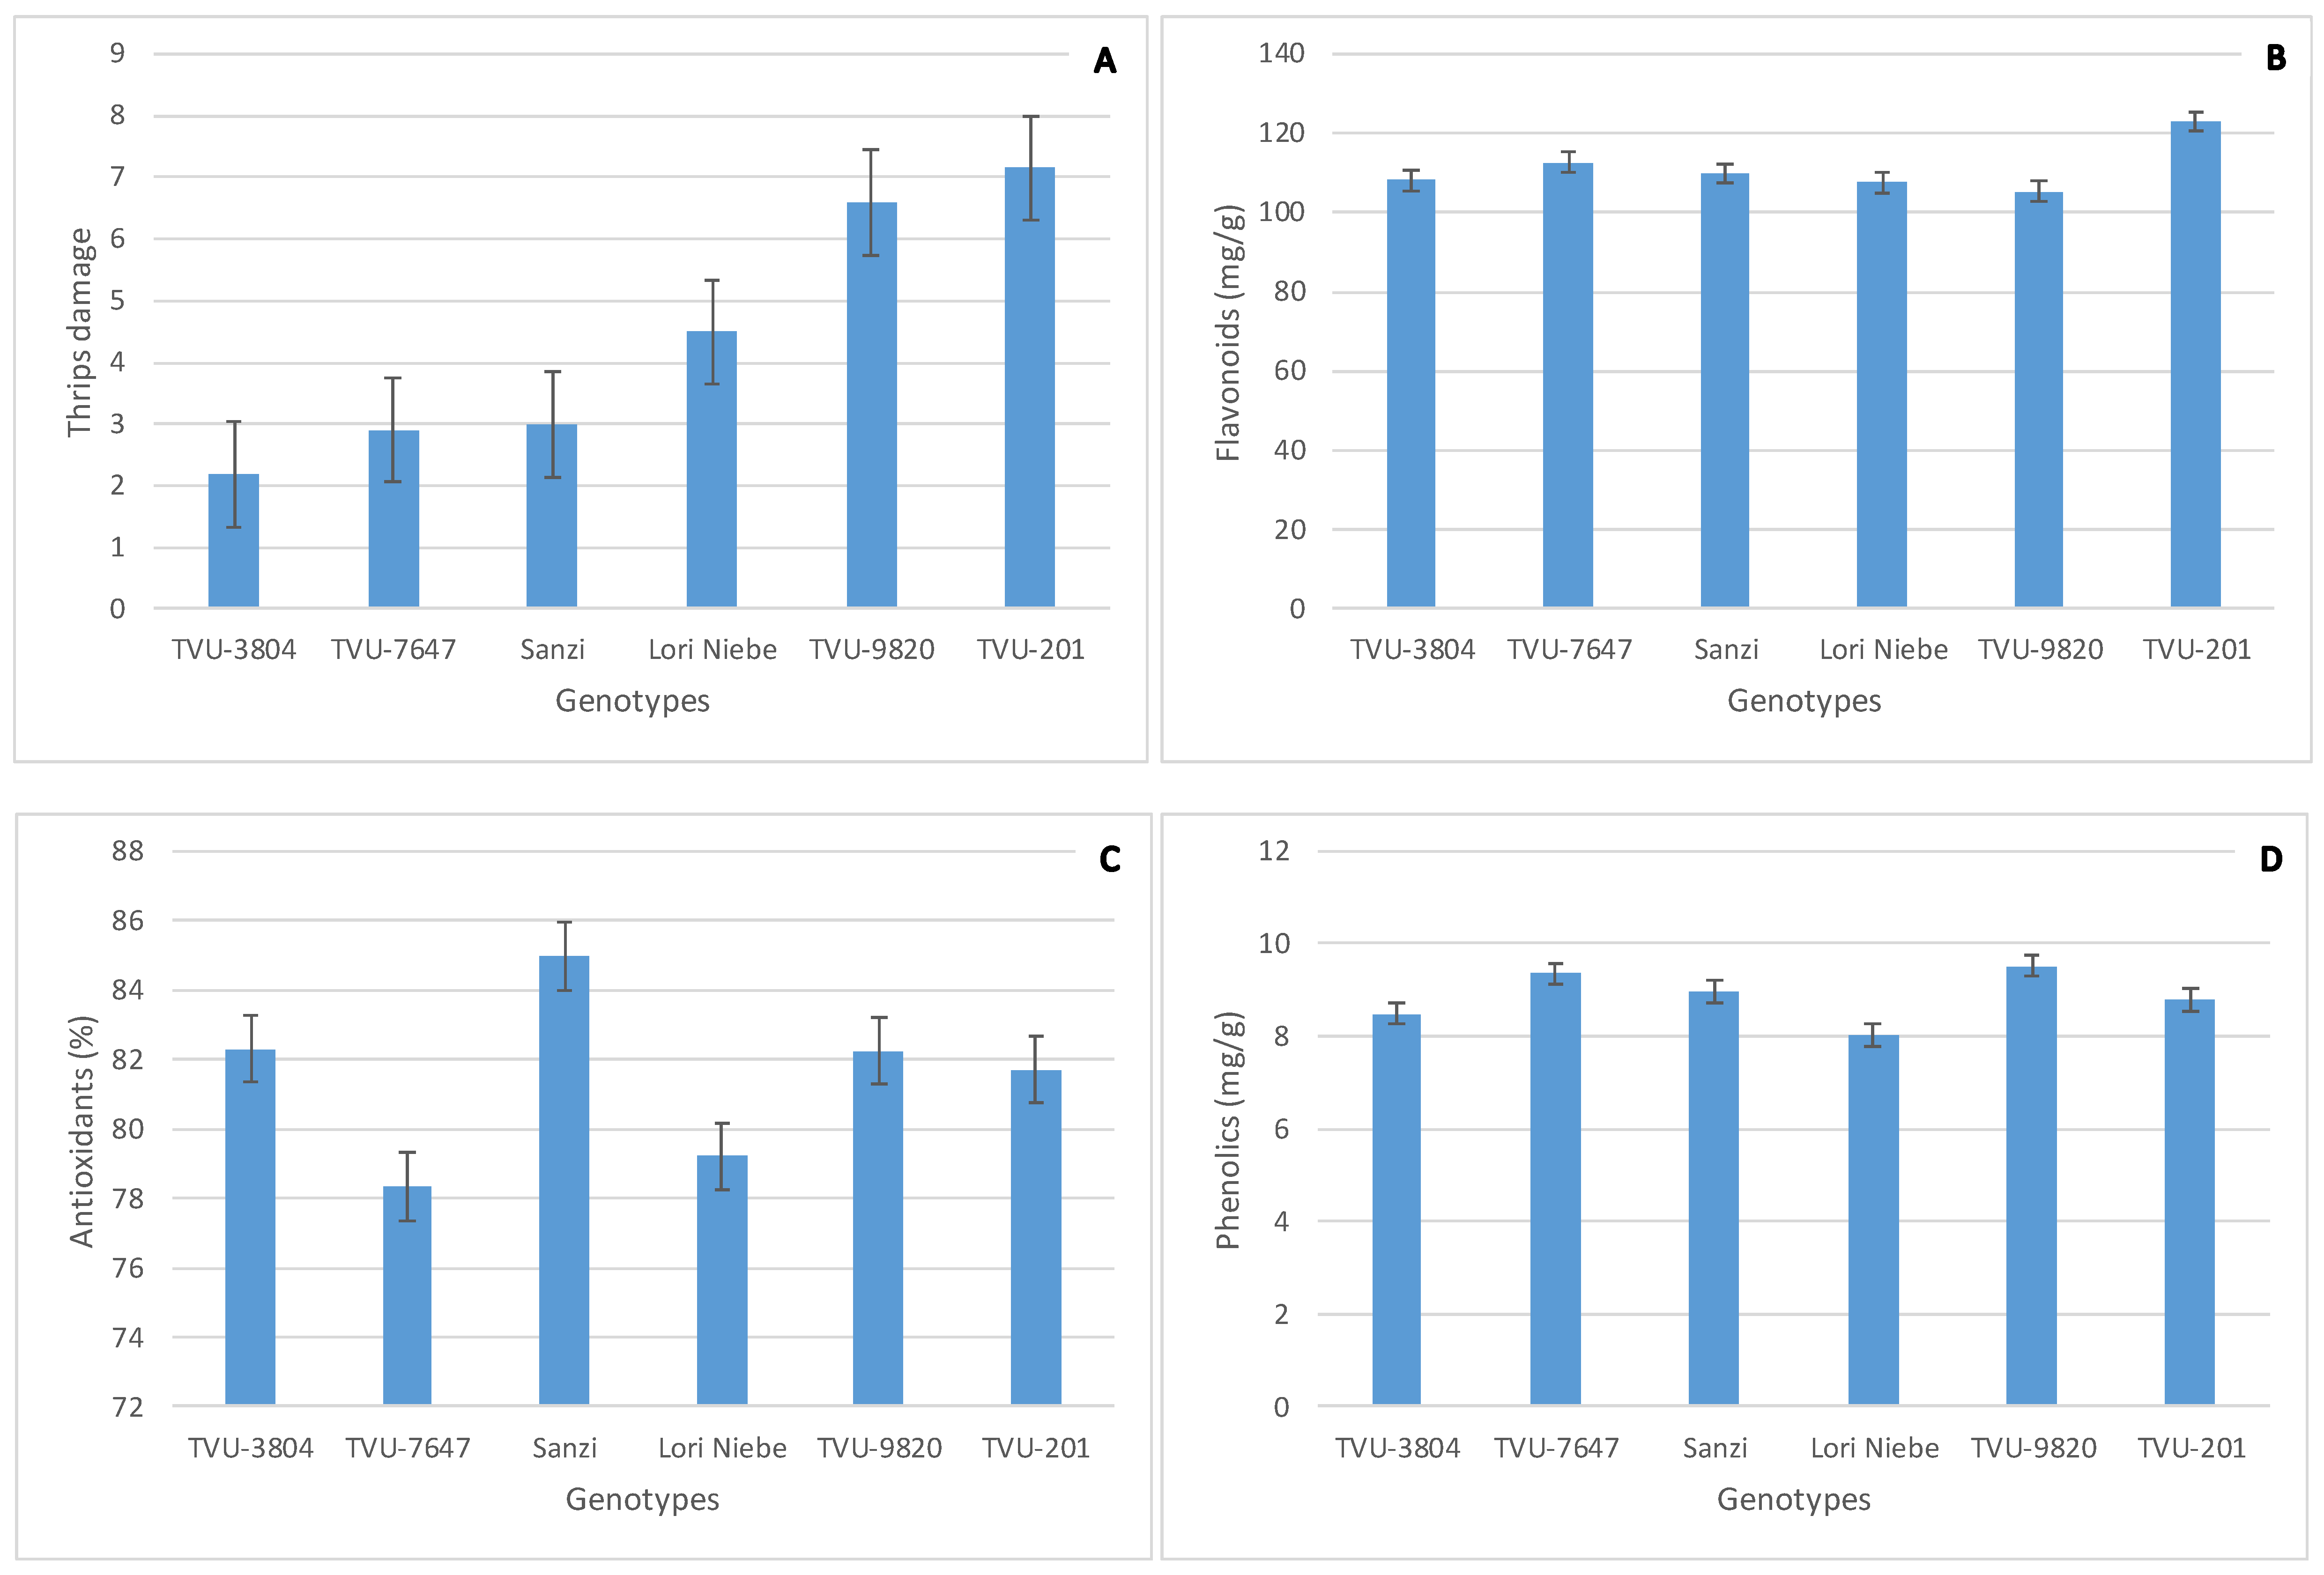
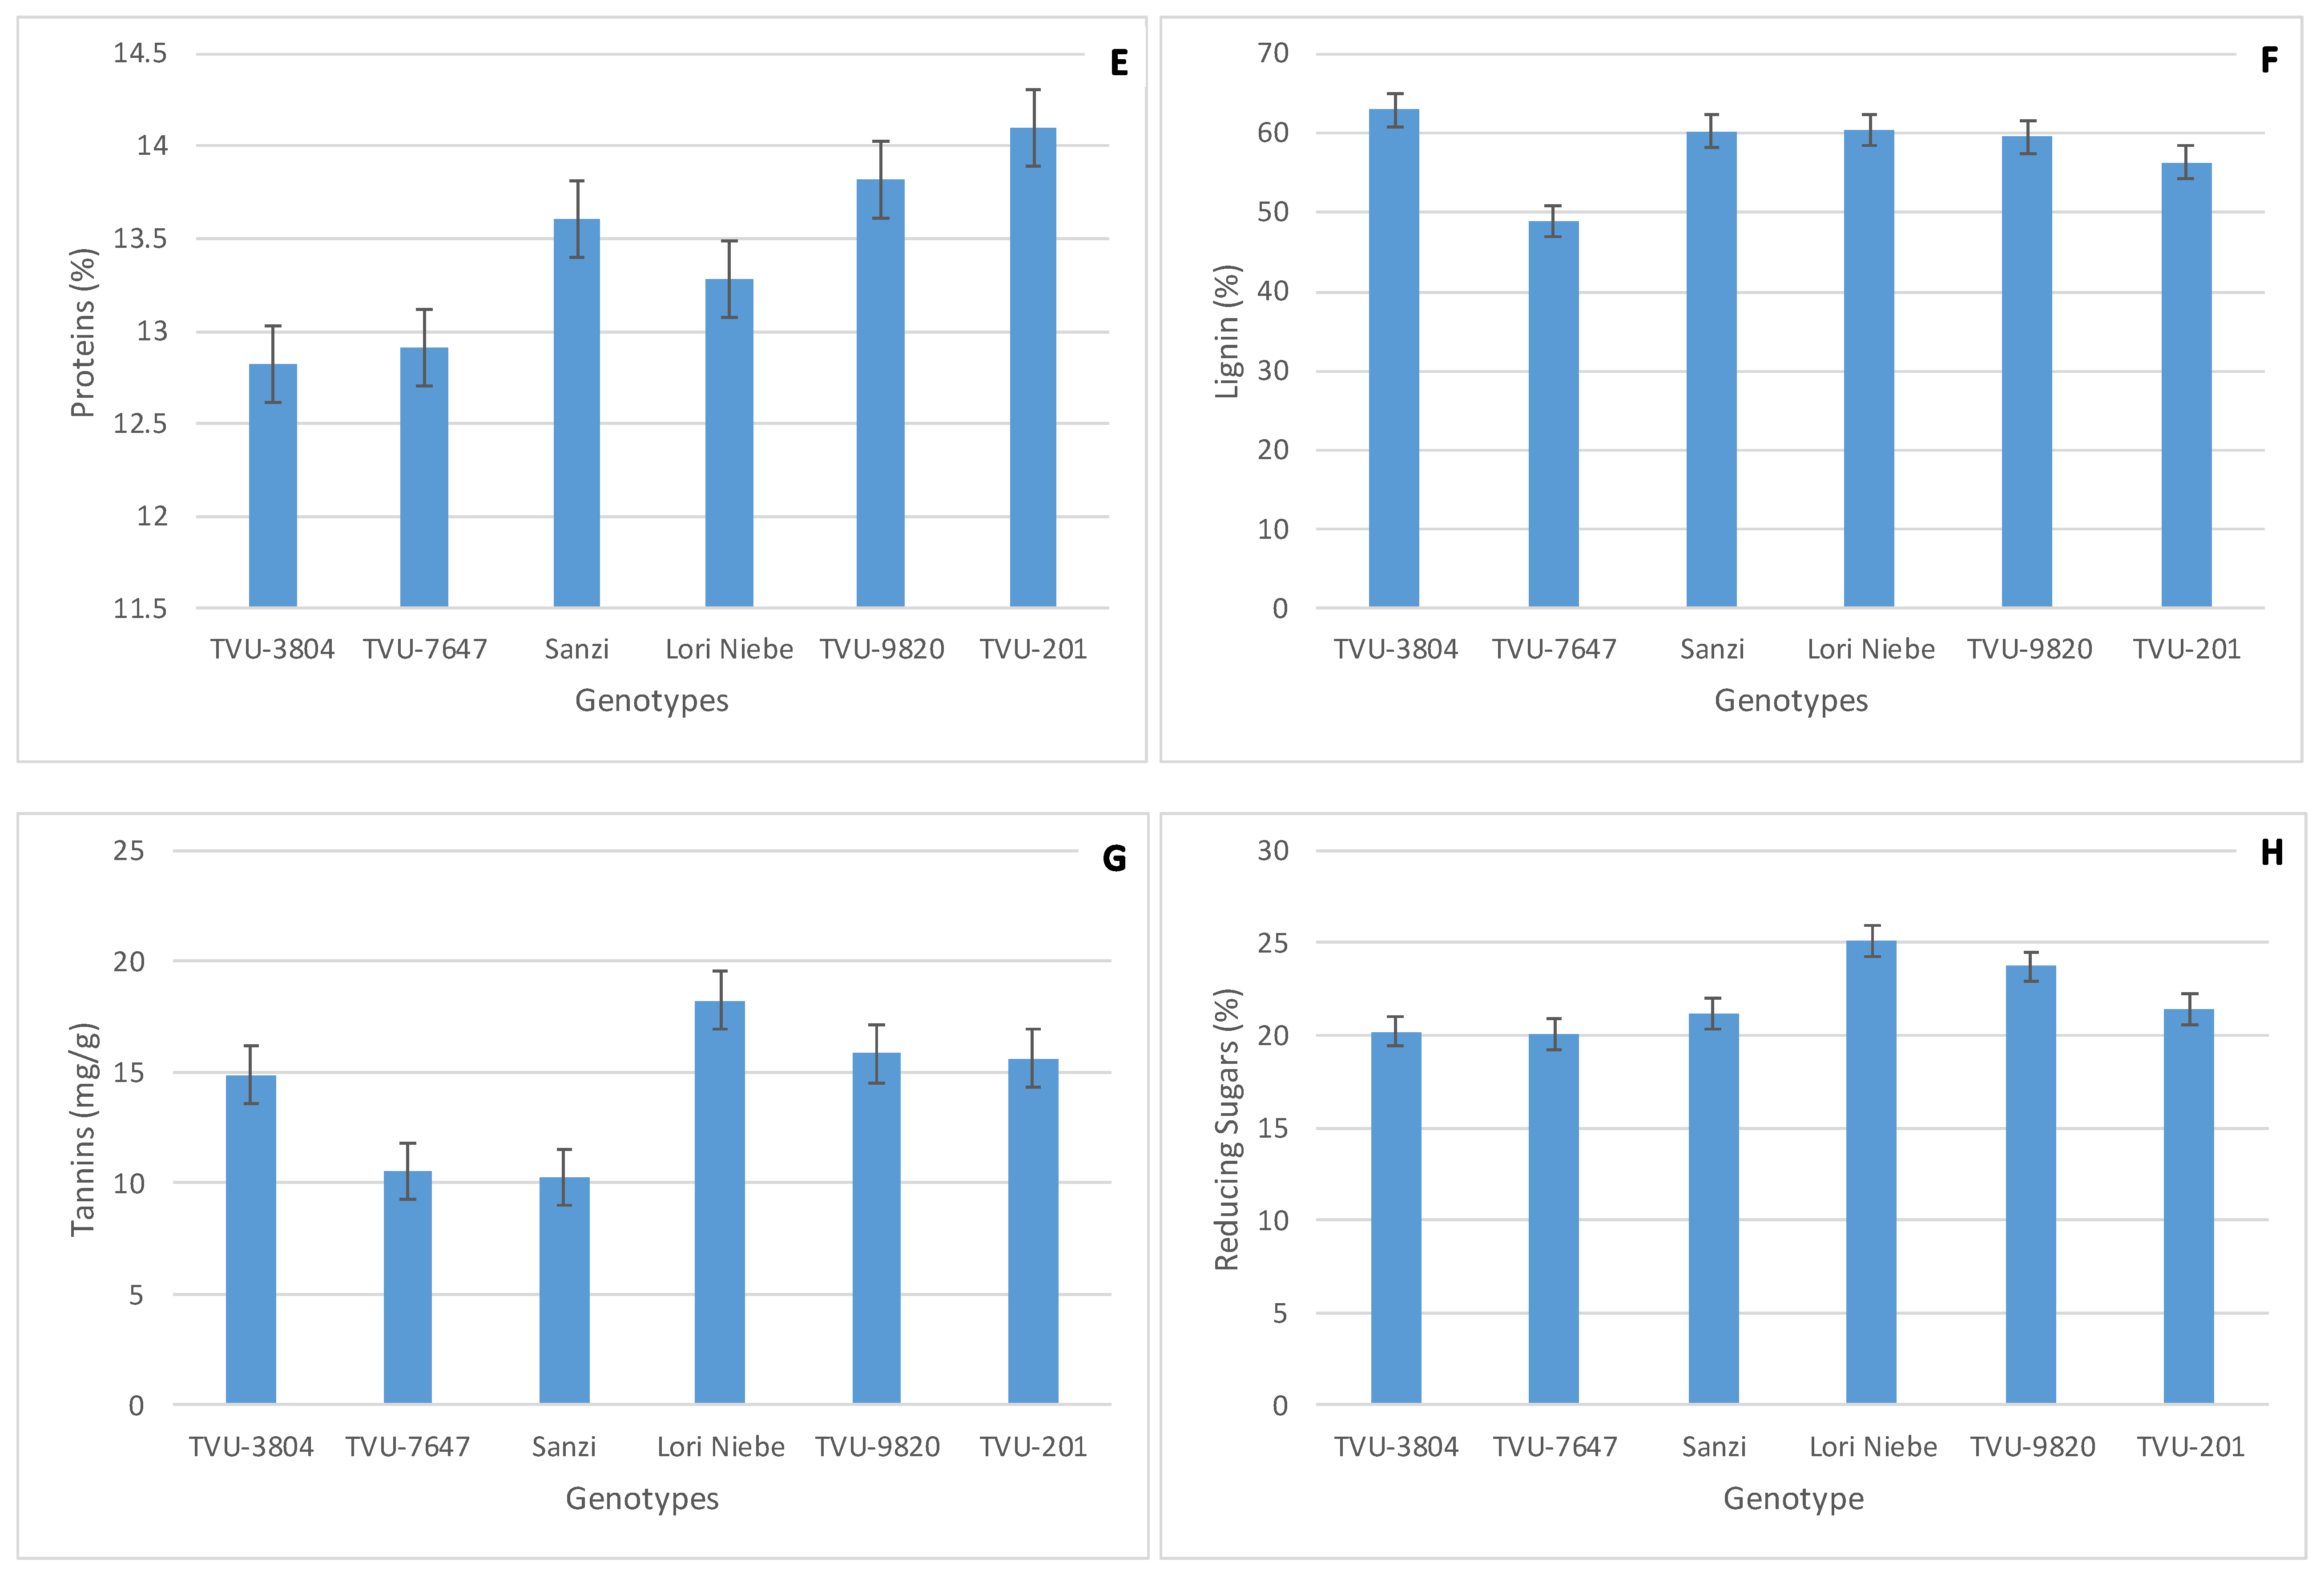
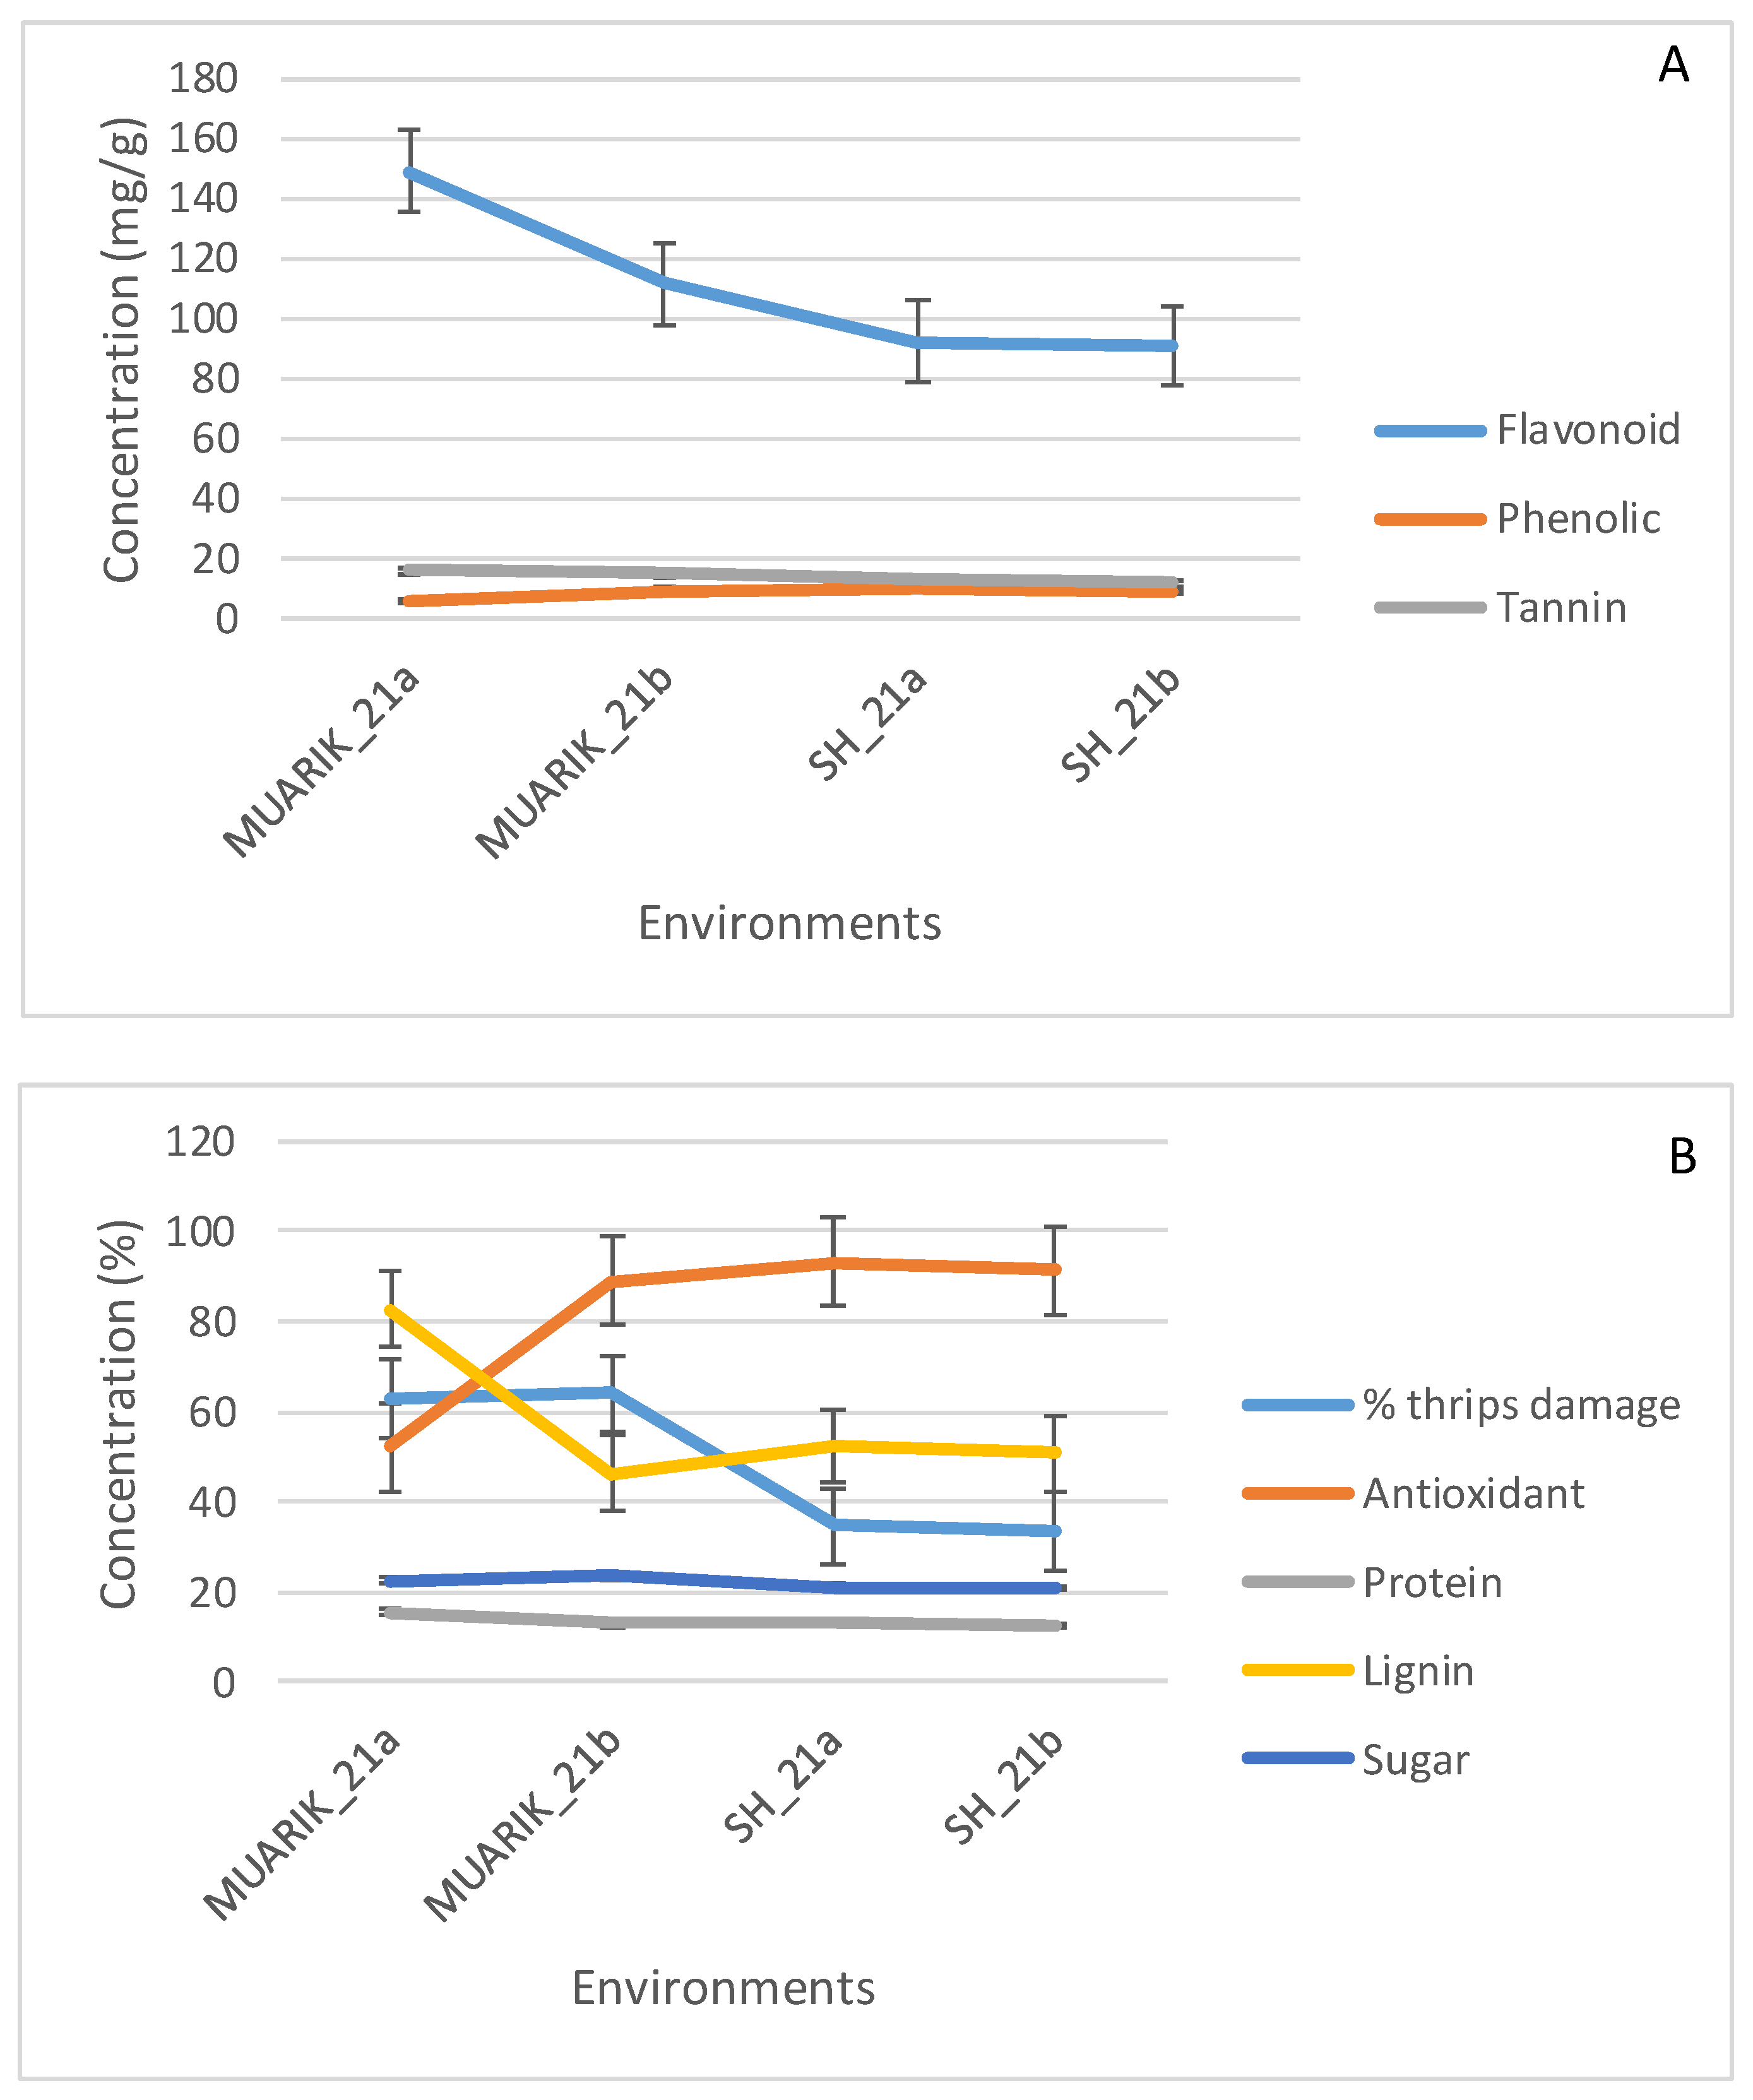
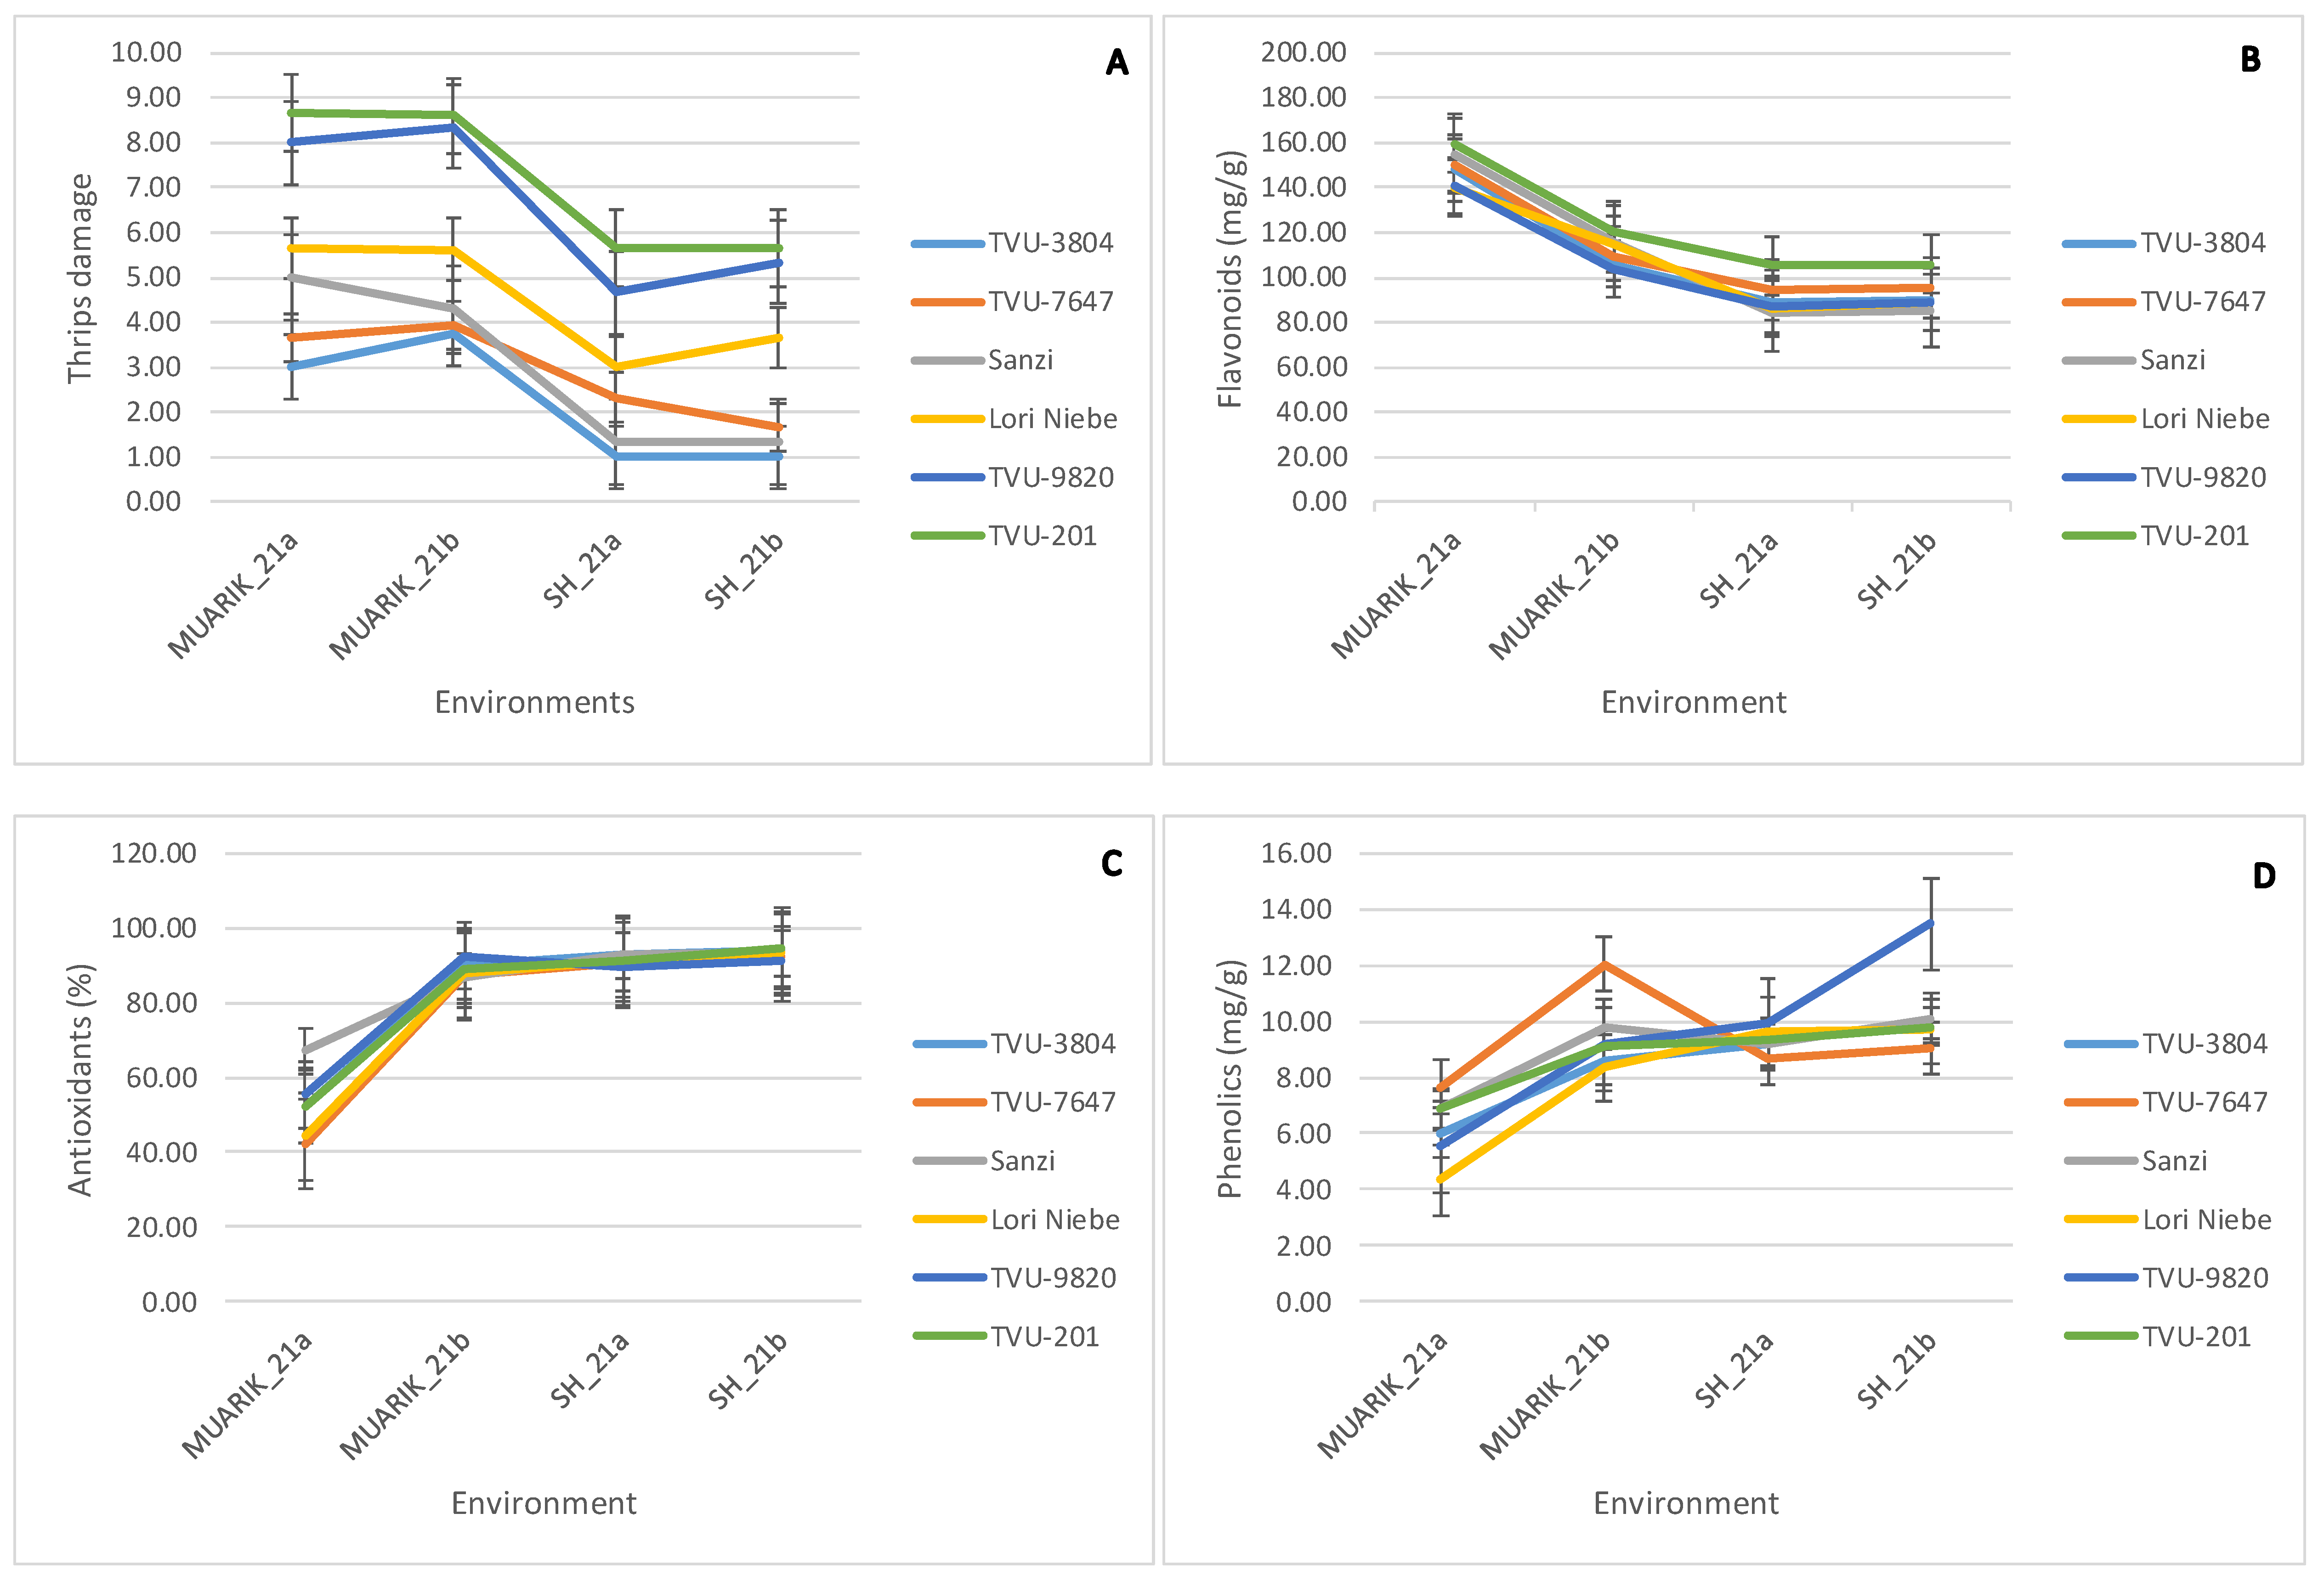
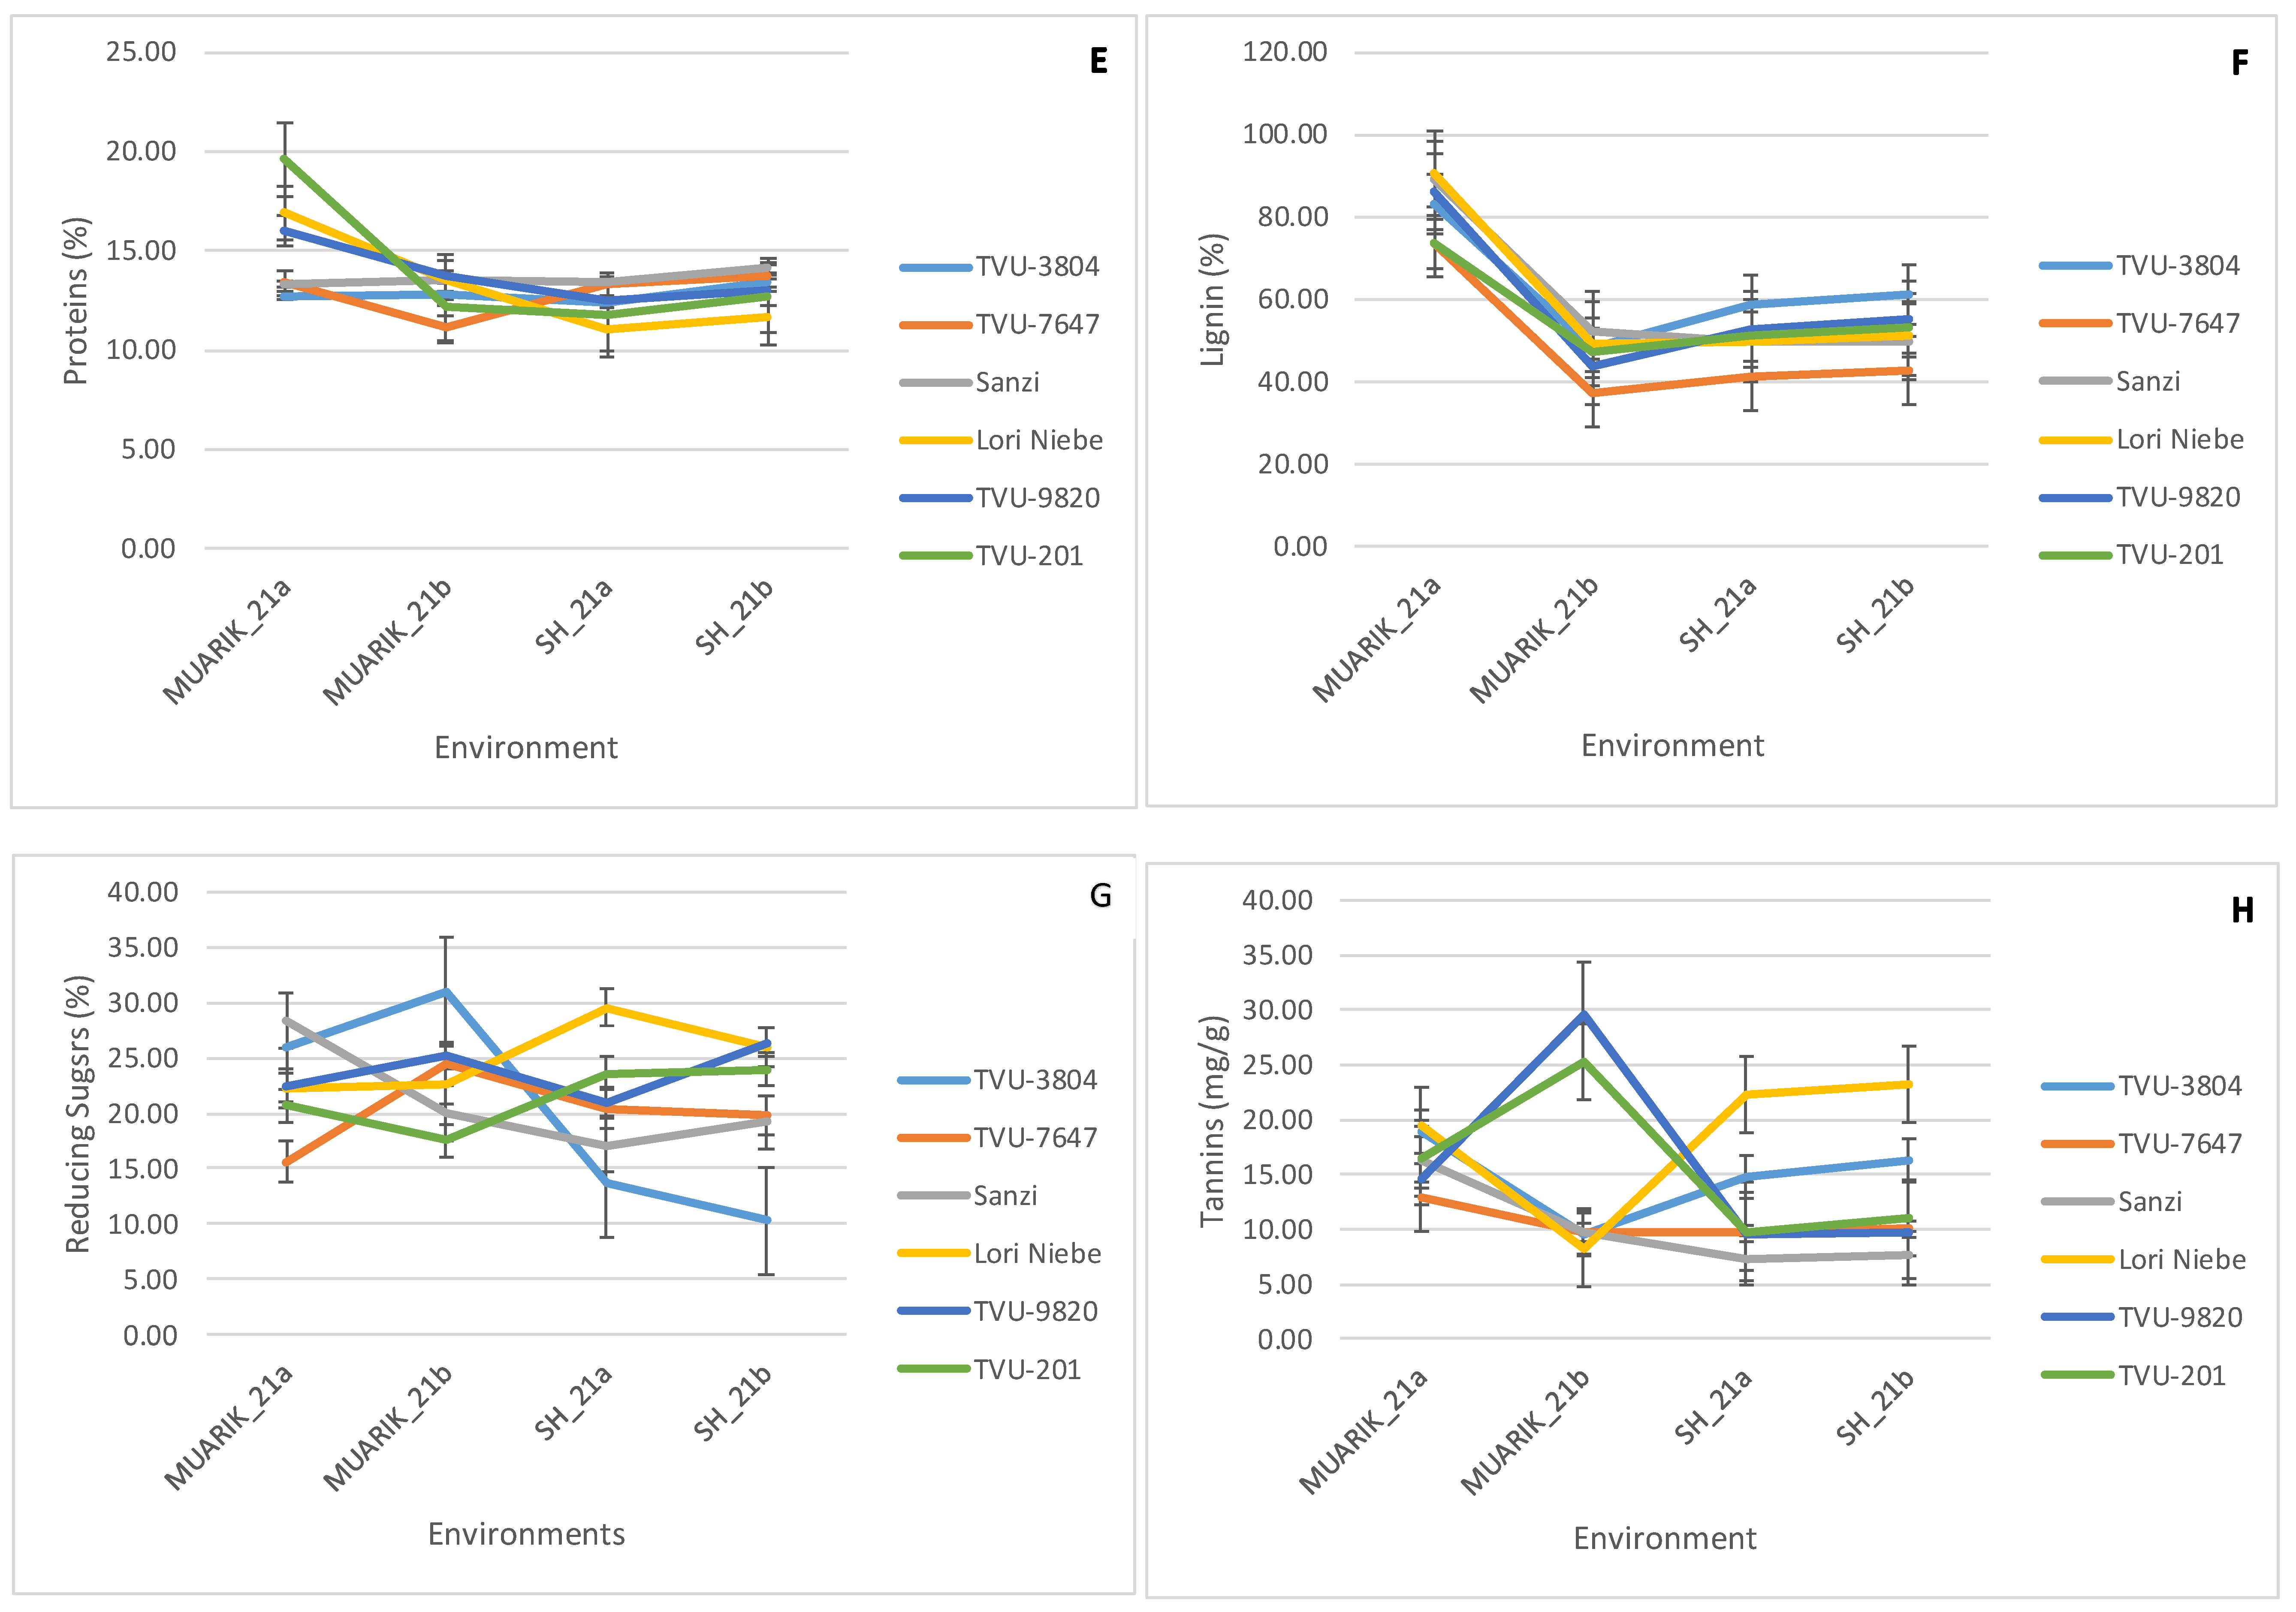
3.1. Performance of Cowpea Secondary Metabolites and Flower Thrips Damage across Environments

There was significant (p < 0.001) variation for flower thrips damage, flavonoids, antioxidants, lignin, tannins and reducing sugars, and non-significant difference for phenolics and proteins among the tested genotypes (Table 3). Genotype TVU-3804 had the lowest thrips damage of 2.19, while TVU-201 had the highest damage of 7.15 (Figure 1). Genotype Lori Niebe, which was moderately resistant, had the highest concentrations of tannins (18.23 mg/g) and reducing sugars (25.08%), while TVU-201 had the highest concentrations of flavonoids (122.92 mg/g) and proteins (14.09%). On the other hand, genotypes Sanzi, TVU-9820 and TVU-3804 had the highest concentrations of antioxidants, phenolics and lignin of 84.97%, 9.52 mg/g and 62.90%, respectively. Genotype TVU-7647 had the lowest concentrations of antioxidants, lignin, tannins and reducing sugars of 78.34%, 48.88%, 10.56 mg/g and 20.09%, respectively. Genotypes TVU-9820, Lori Niebe and TVU-3804 had the lowest flavonoid, phenolic and protein concentrations of 105.28 mg/g, 8.02 mg/g, 12.81%, respectively.
A significant (p < 0.001) difference was observed on flower thrips damage, flavonoids, antioxidants, phenolics, proteins, lignin, tannins and (p < 0.05) reducing sugars among the environments (Table 3). MUARIK_21a recorded the highest concentrations of flavonoids, proteins, lignin and tannins; SH_21a had the highest antioxidant and phenolic content, while MUARIK_21b had the highest thrips damage and reducing sugar content (Figure 2). On the other hand, SH_21b recorded the lowest concentrations of flavonoids, antioxidants, proteins, tannins and reducing sugars. SH_21b, MUARIK_21a and MUARIK_21b had the lowest thrips damage, phenolics and lignin, respectively. The interaction between genotype and environment significantly (p < 0.001) influenced flower thrips damage, flavonoid, antioxidant, protein, lignin, tannin, reducing sugar and (p < 0.05) phenolic concentrations (Table 3). Generally, for all genotypes, flavonoid and protein concentrations were high in the field and low in screen house experiments (Figure 3B,E). For reducing sugars, genotypes showed interactions in the four environments (Figure 3G). For tannins, interactions were observed in the field experiment, but no interaction in the two screen house seasons (Figure 3H). Overall, there was no interaction between the environments for flavonoids, phenolics, tannins, reducing sugars and proteins (Figure 2). However, an interaction was observed in environments for flower thrips damage, antioxidants and lignin.

3.2. Correlation of Traits

The correlation coefficient is presented in Table 4 where few traits showed a significant correlation. A significant correlation was observed between flower thrips damage and reducing sugars, and between flower thrips damage and the minimum temperature. In addition, flower thrips damage was significantly positively correlated with tannins. Flavonoids were significantly negatively correlated with antioxidants, significantly negatively correlated with phenolics and significantly positively correlated with tannins. Antioxidants were significantly positively correlated with phenolics, and significantly negatively correlated with proteins and lignin. In addition, reducing sugars were significantly negatively correlated with minimum temperature, while proteins were significantly positively correlated with lignin.

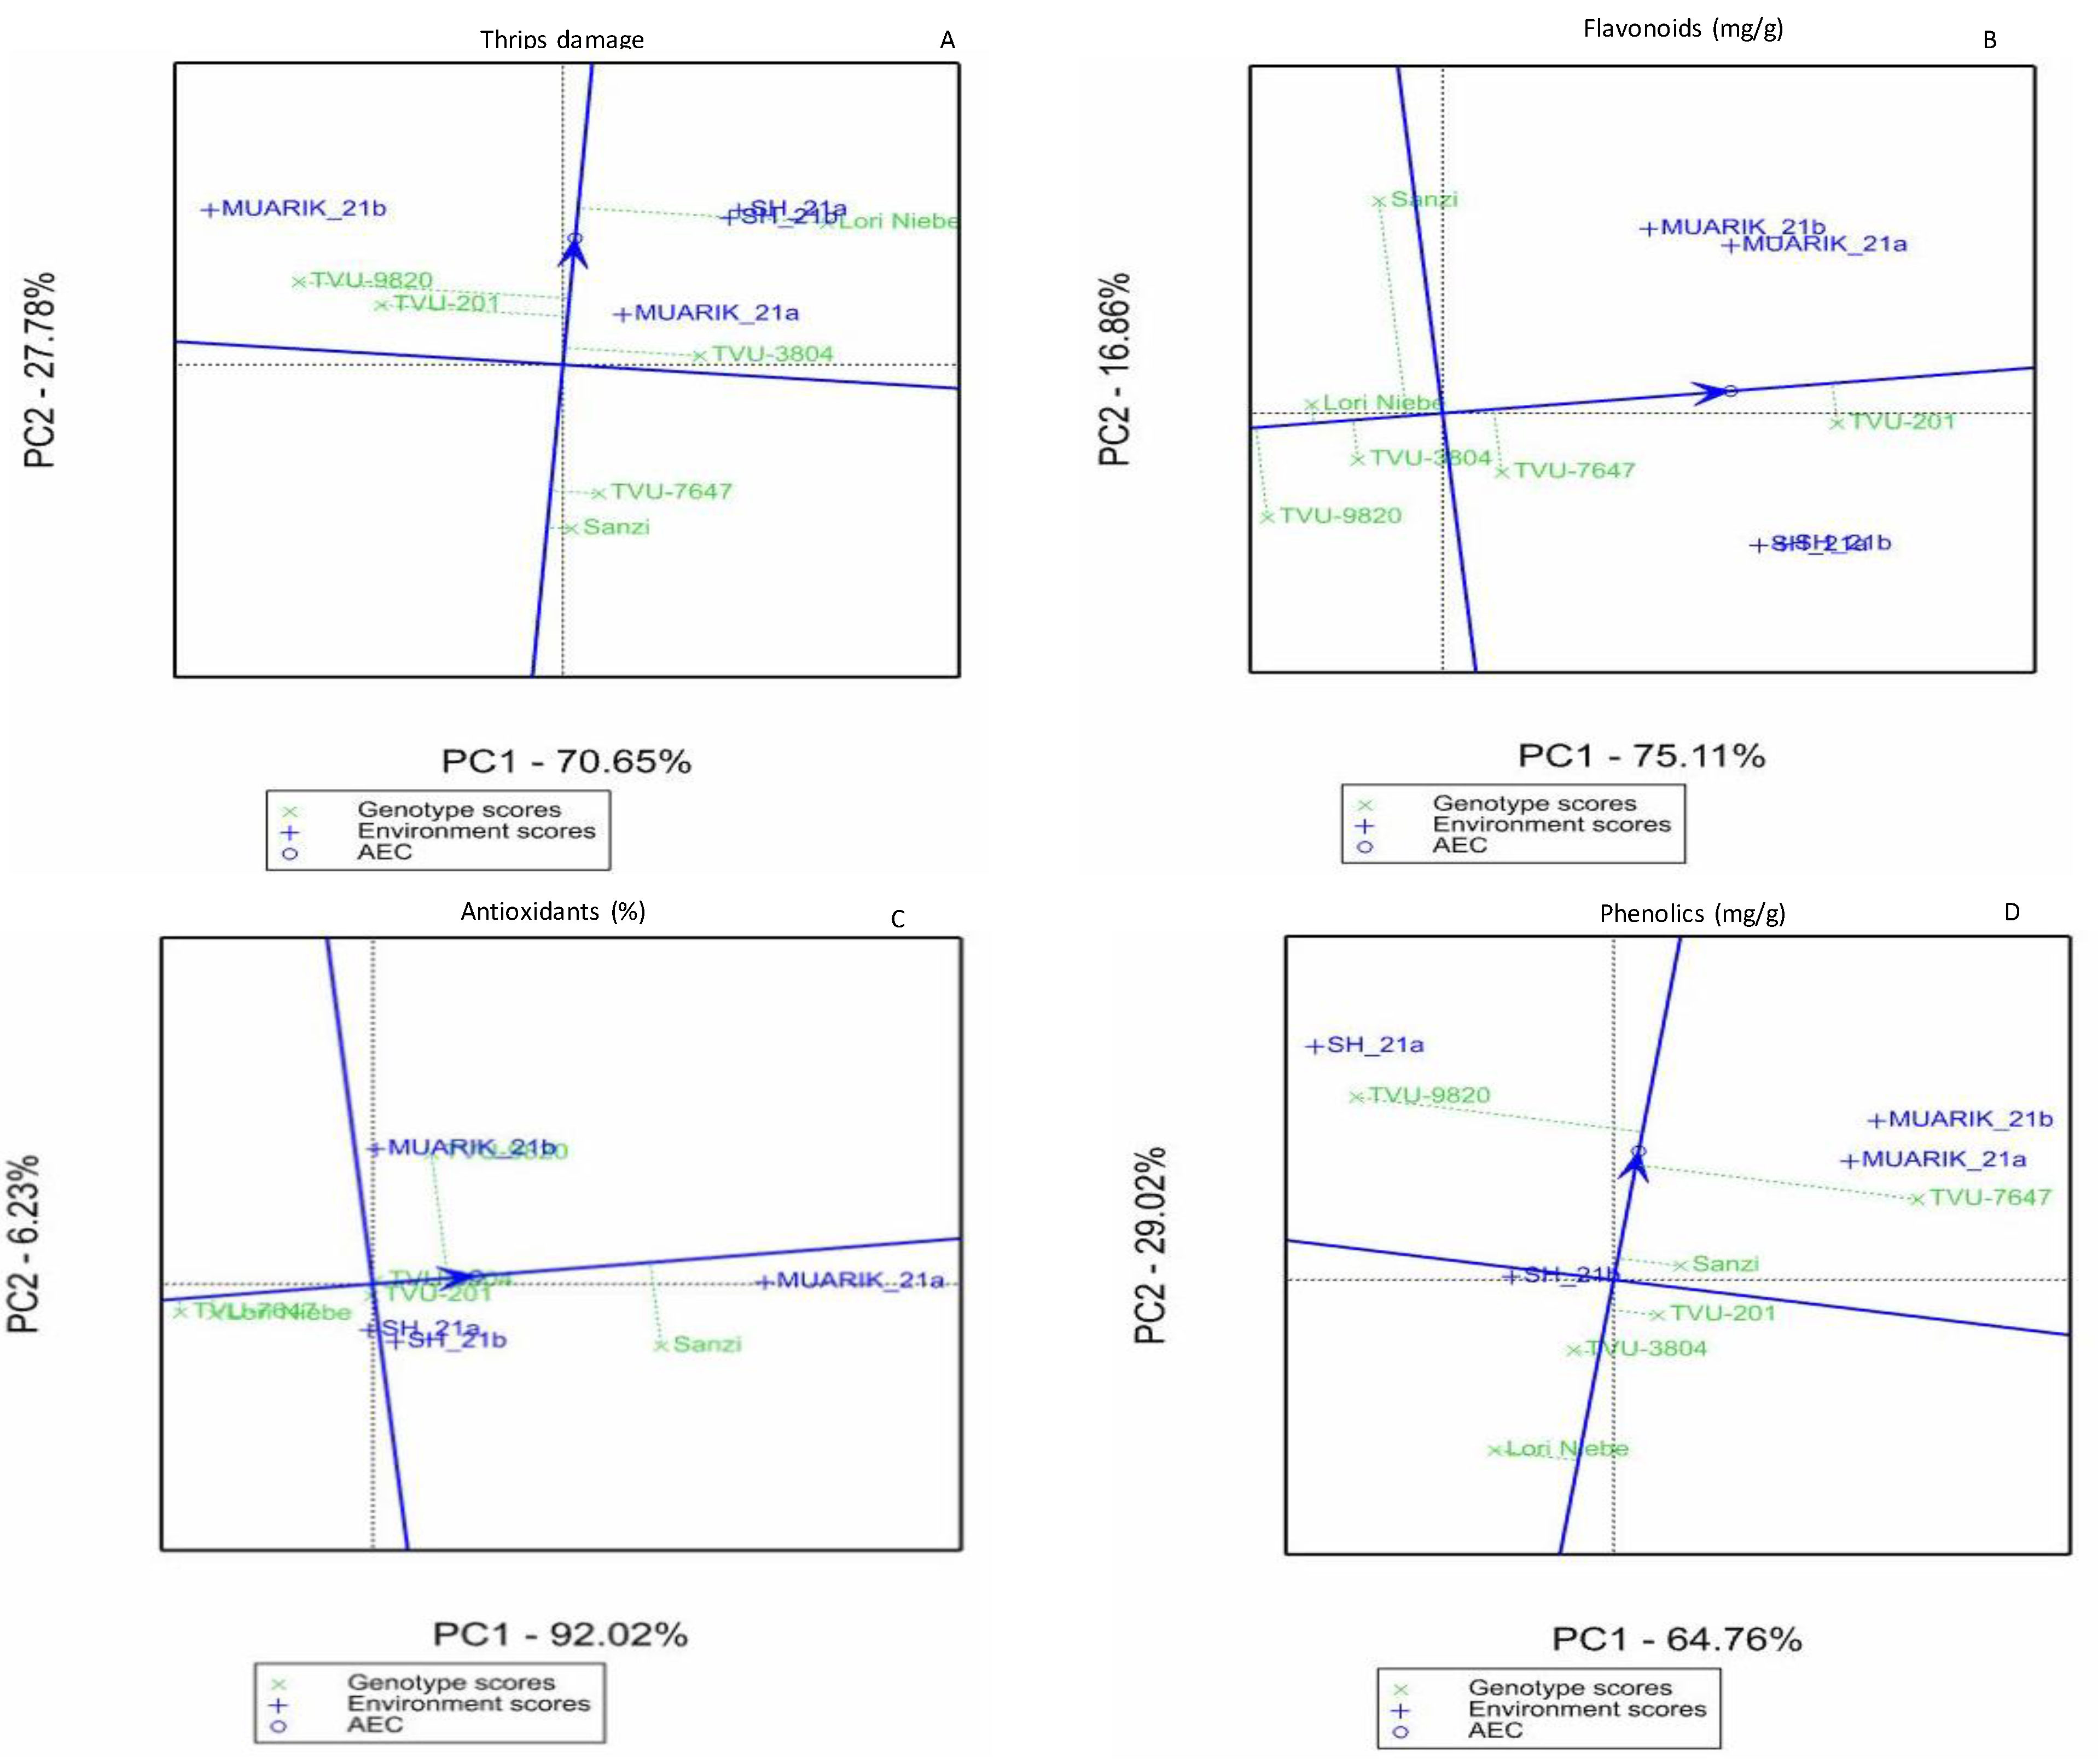
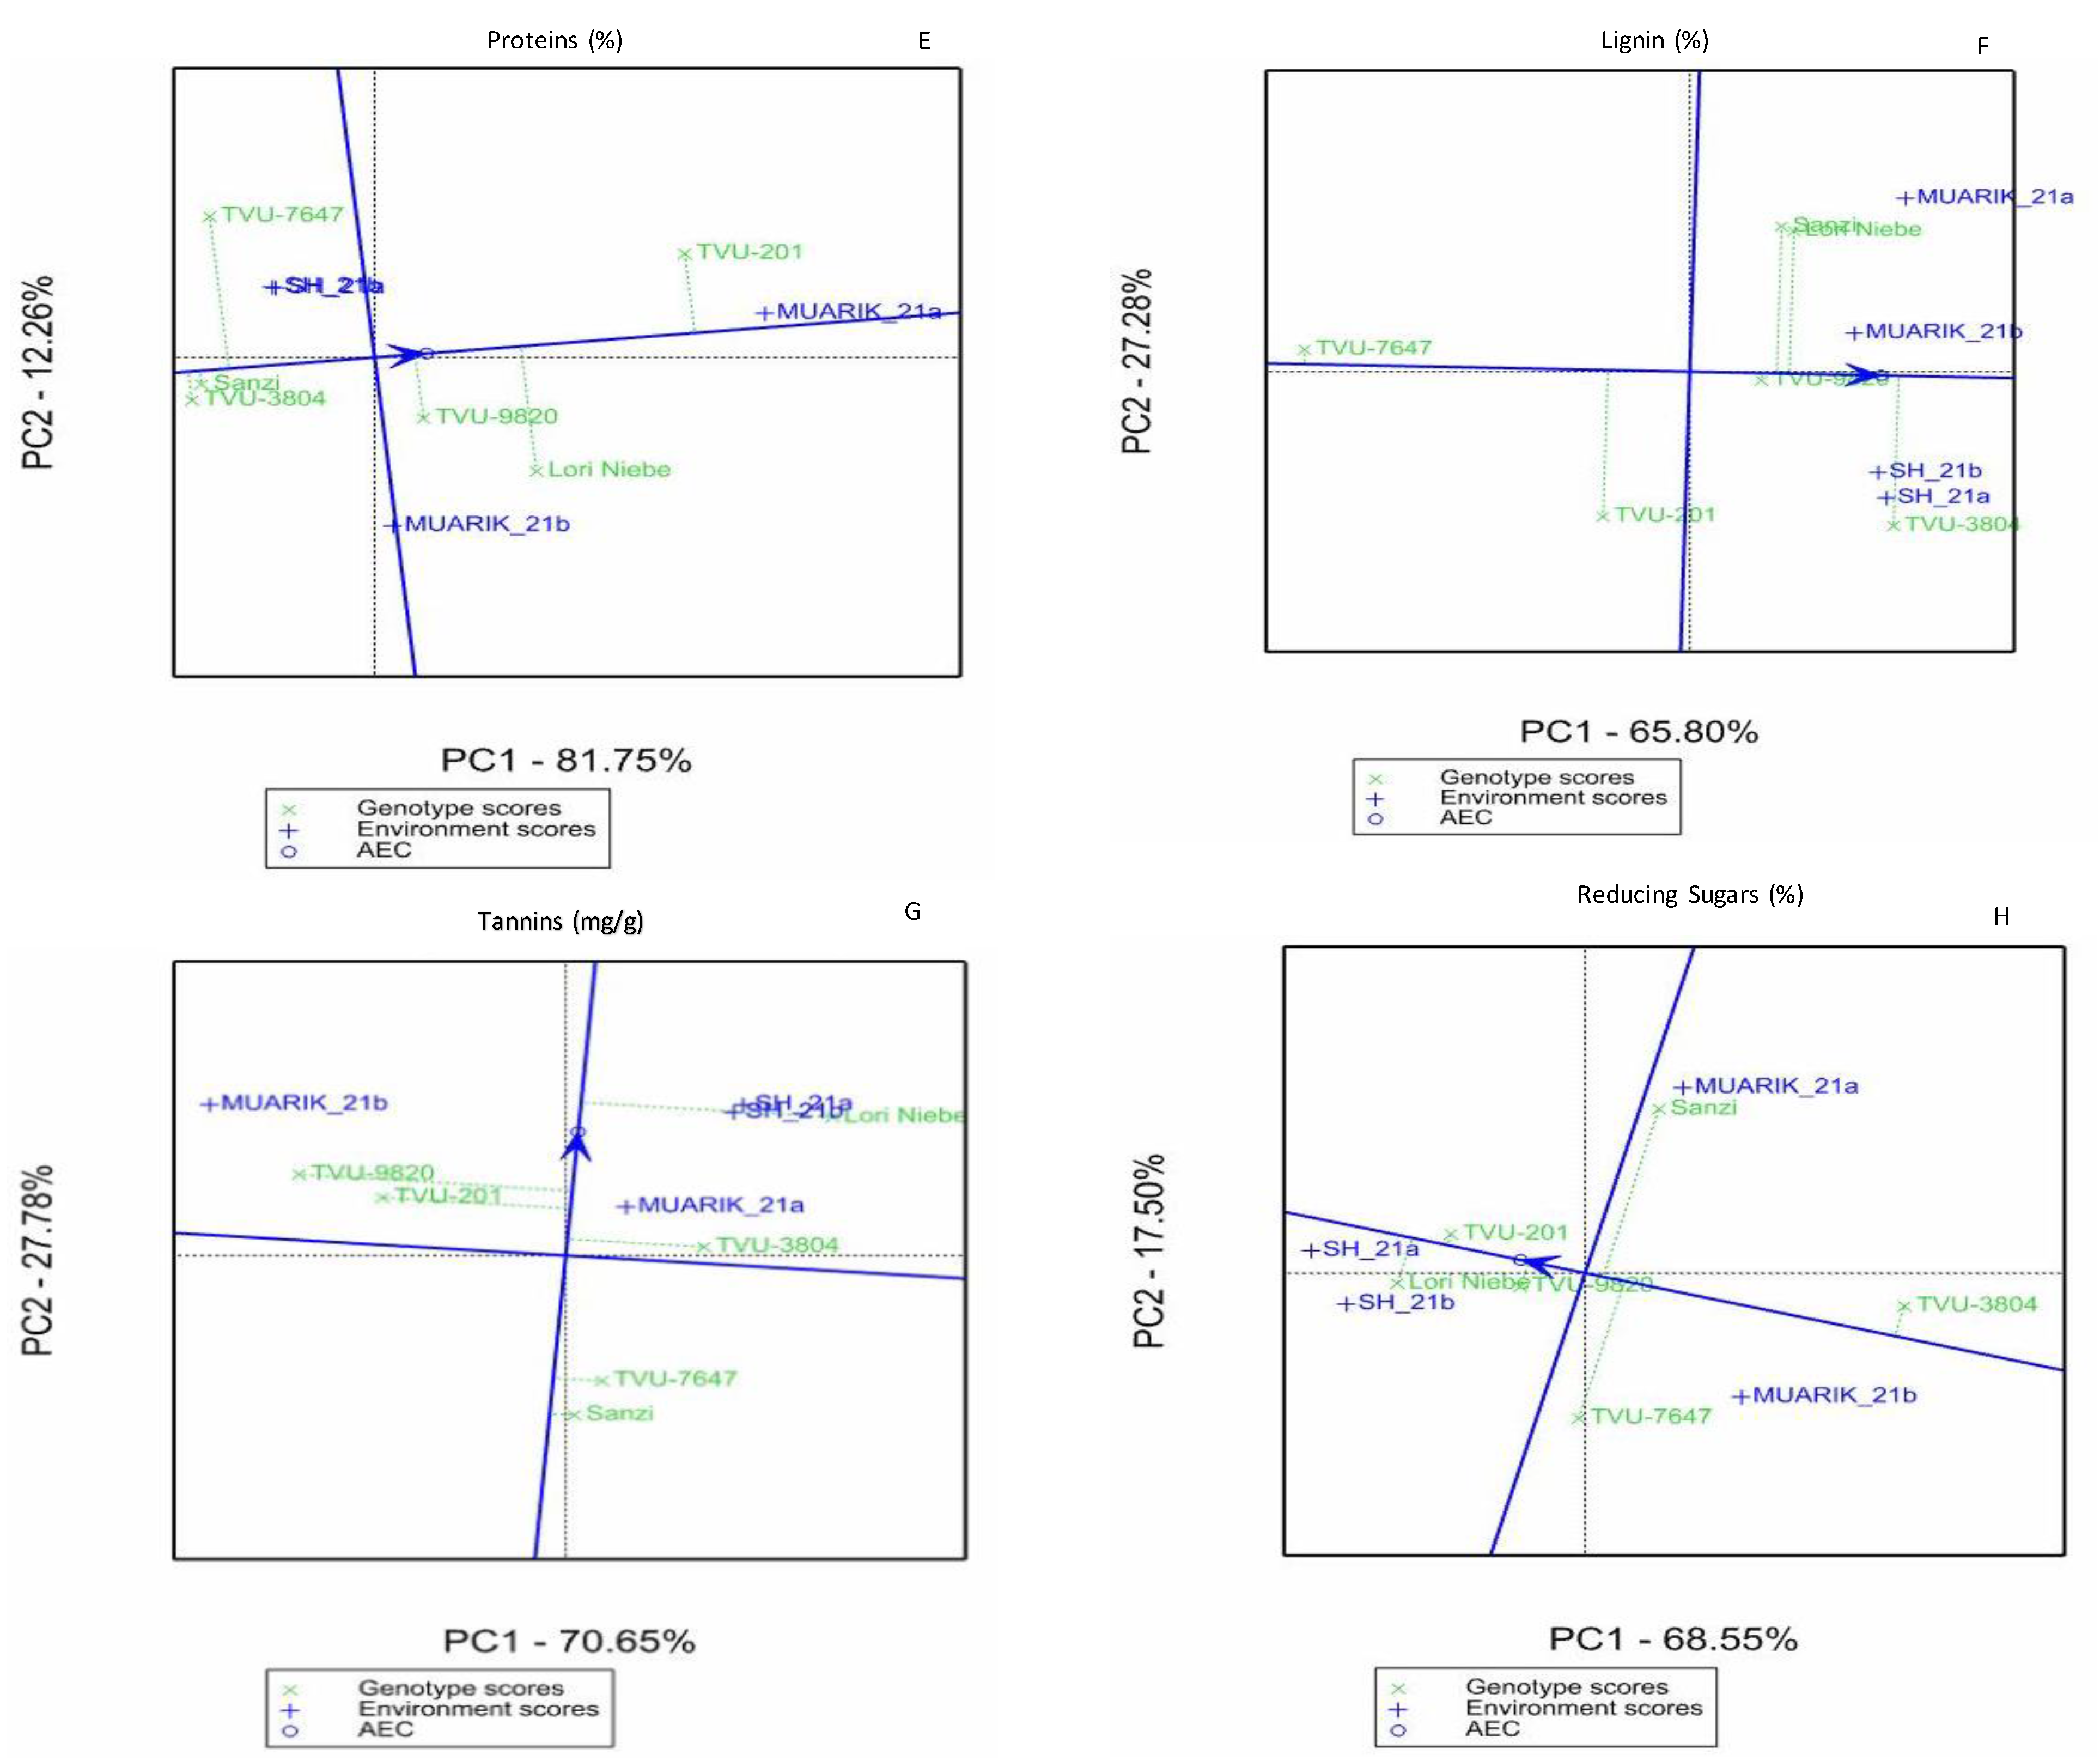
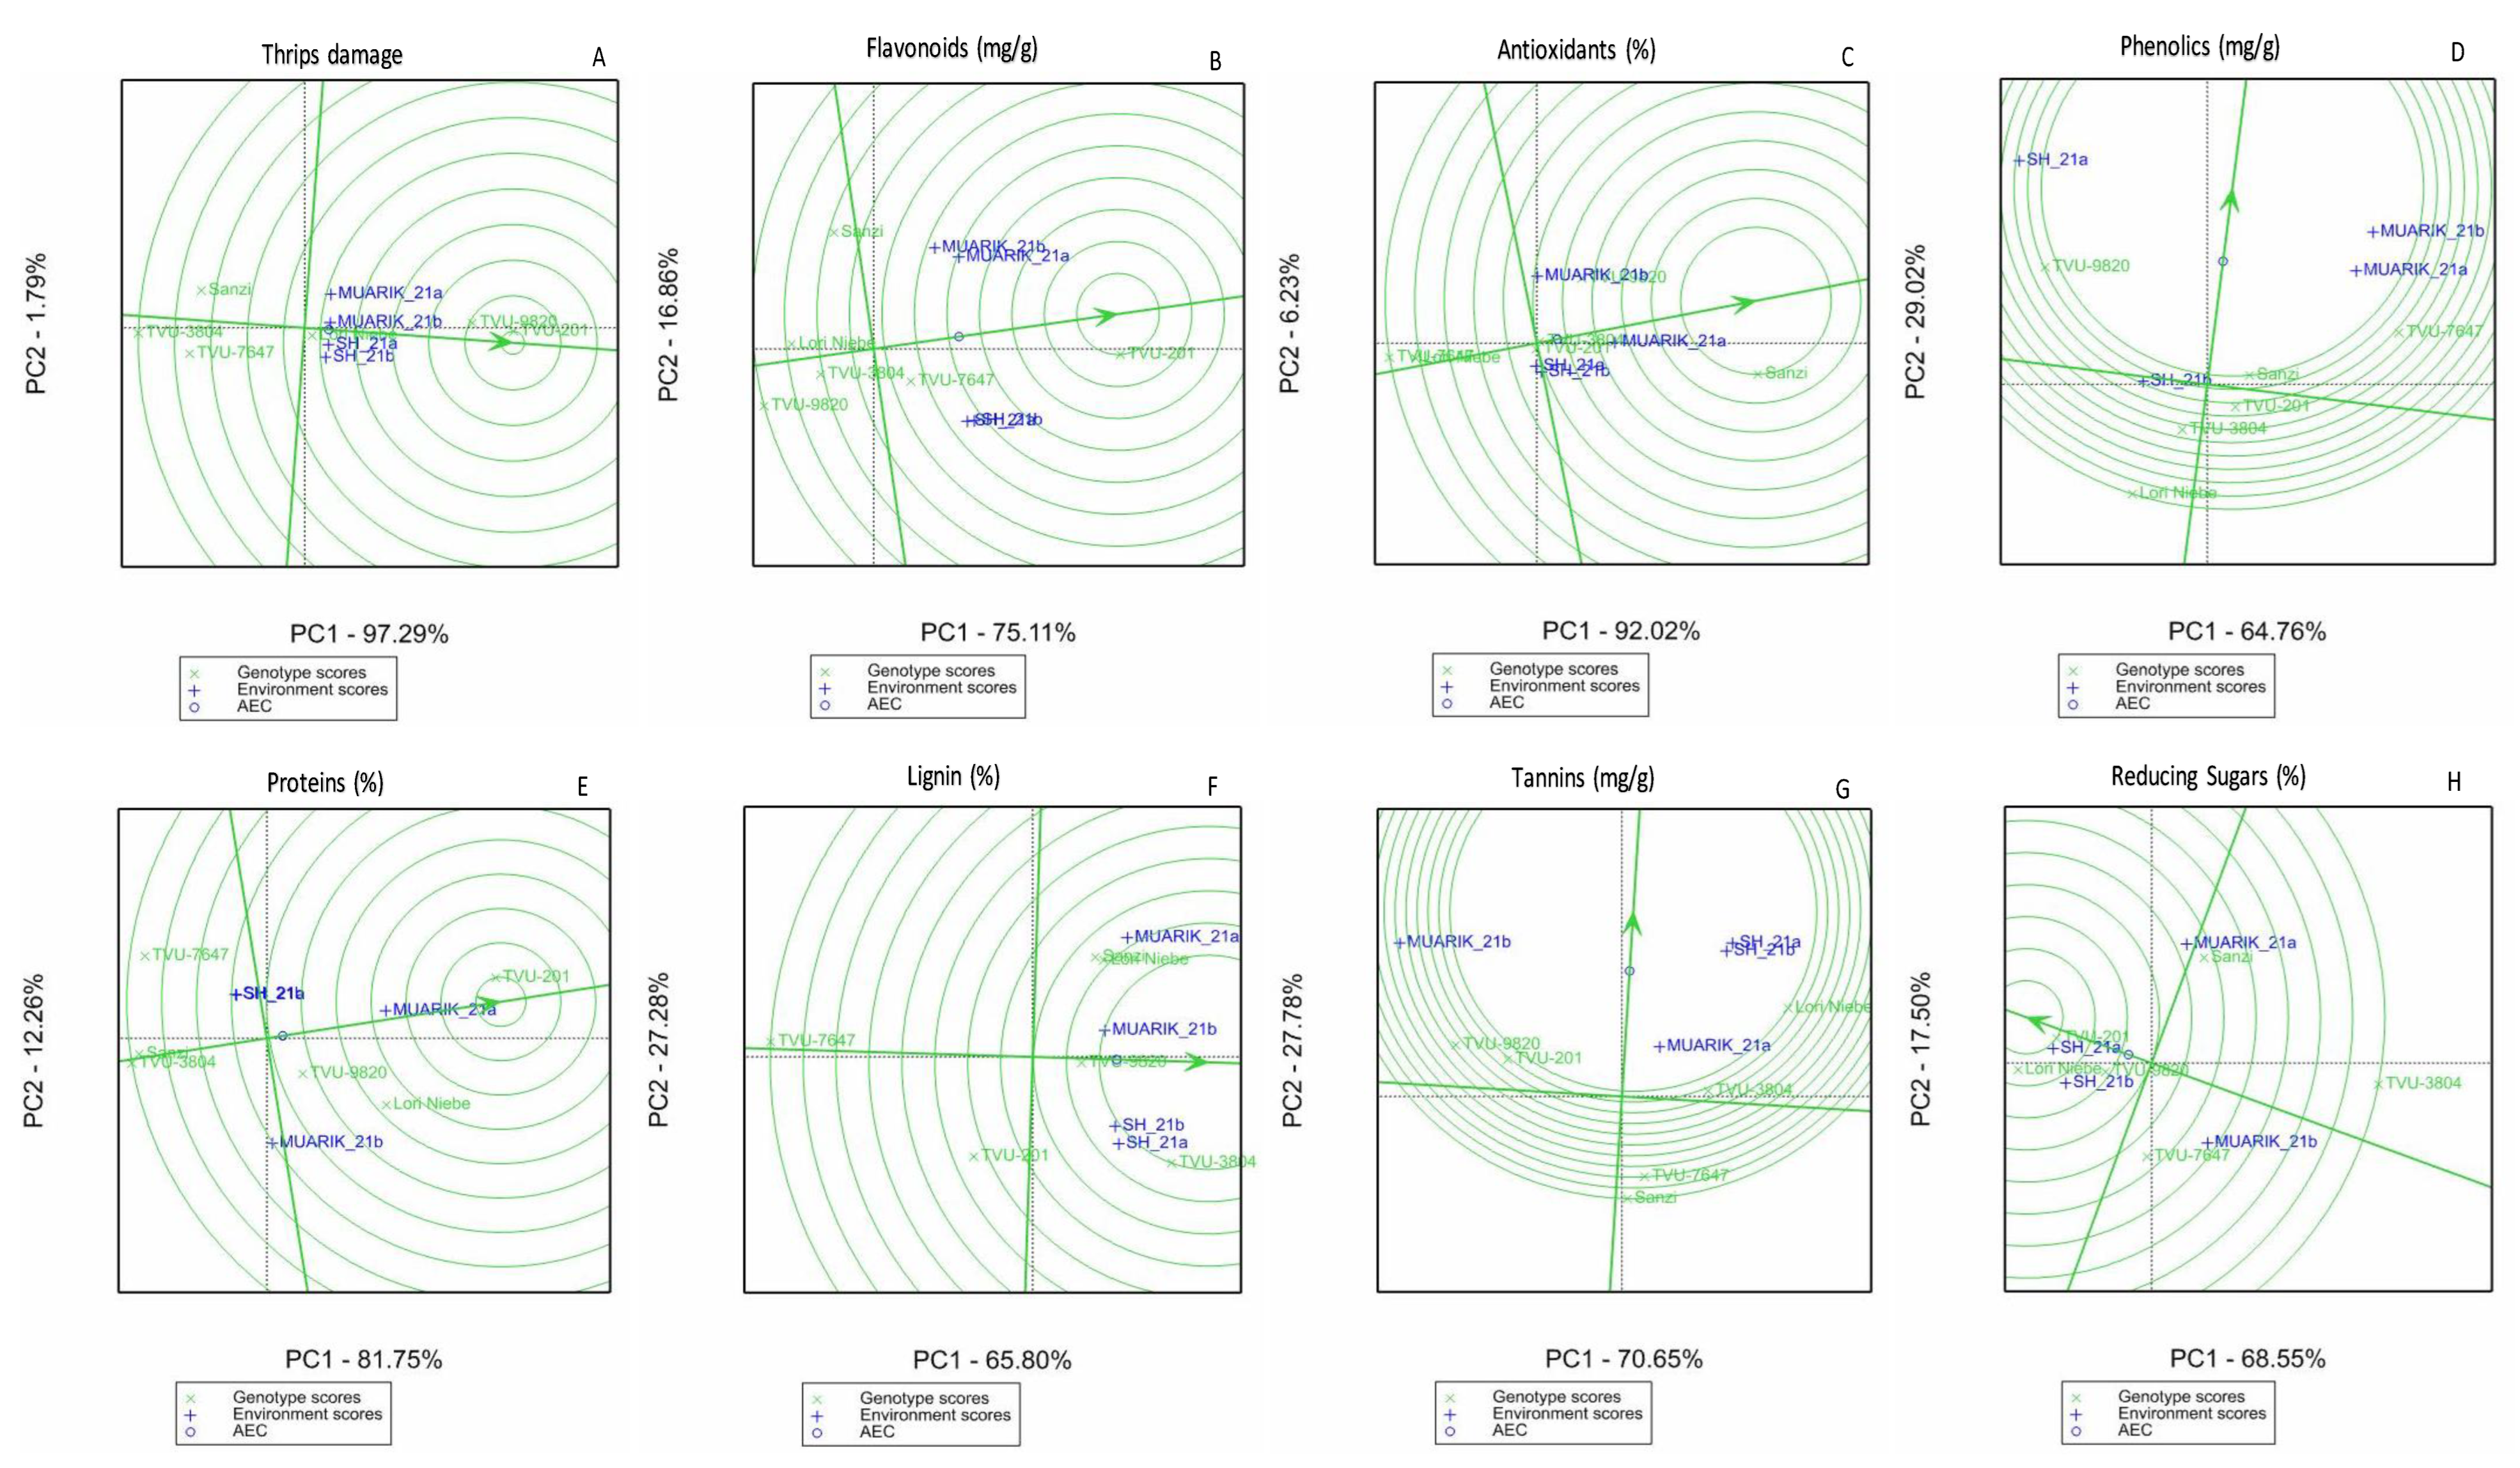
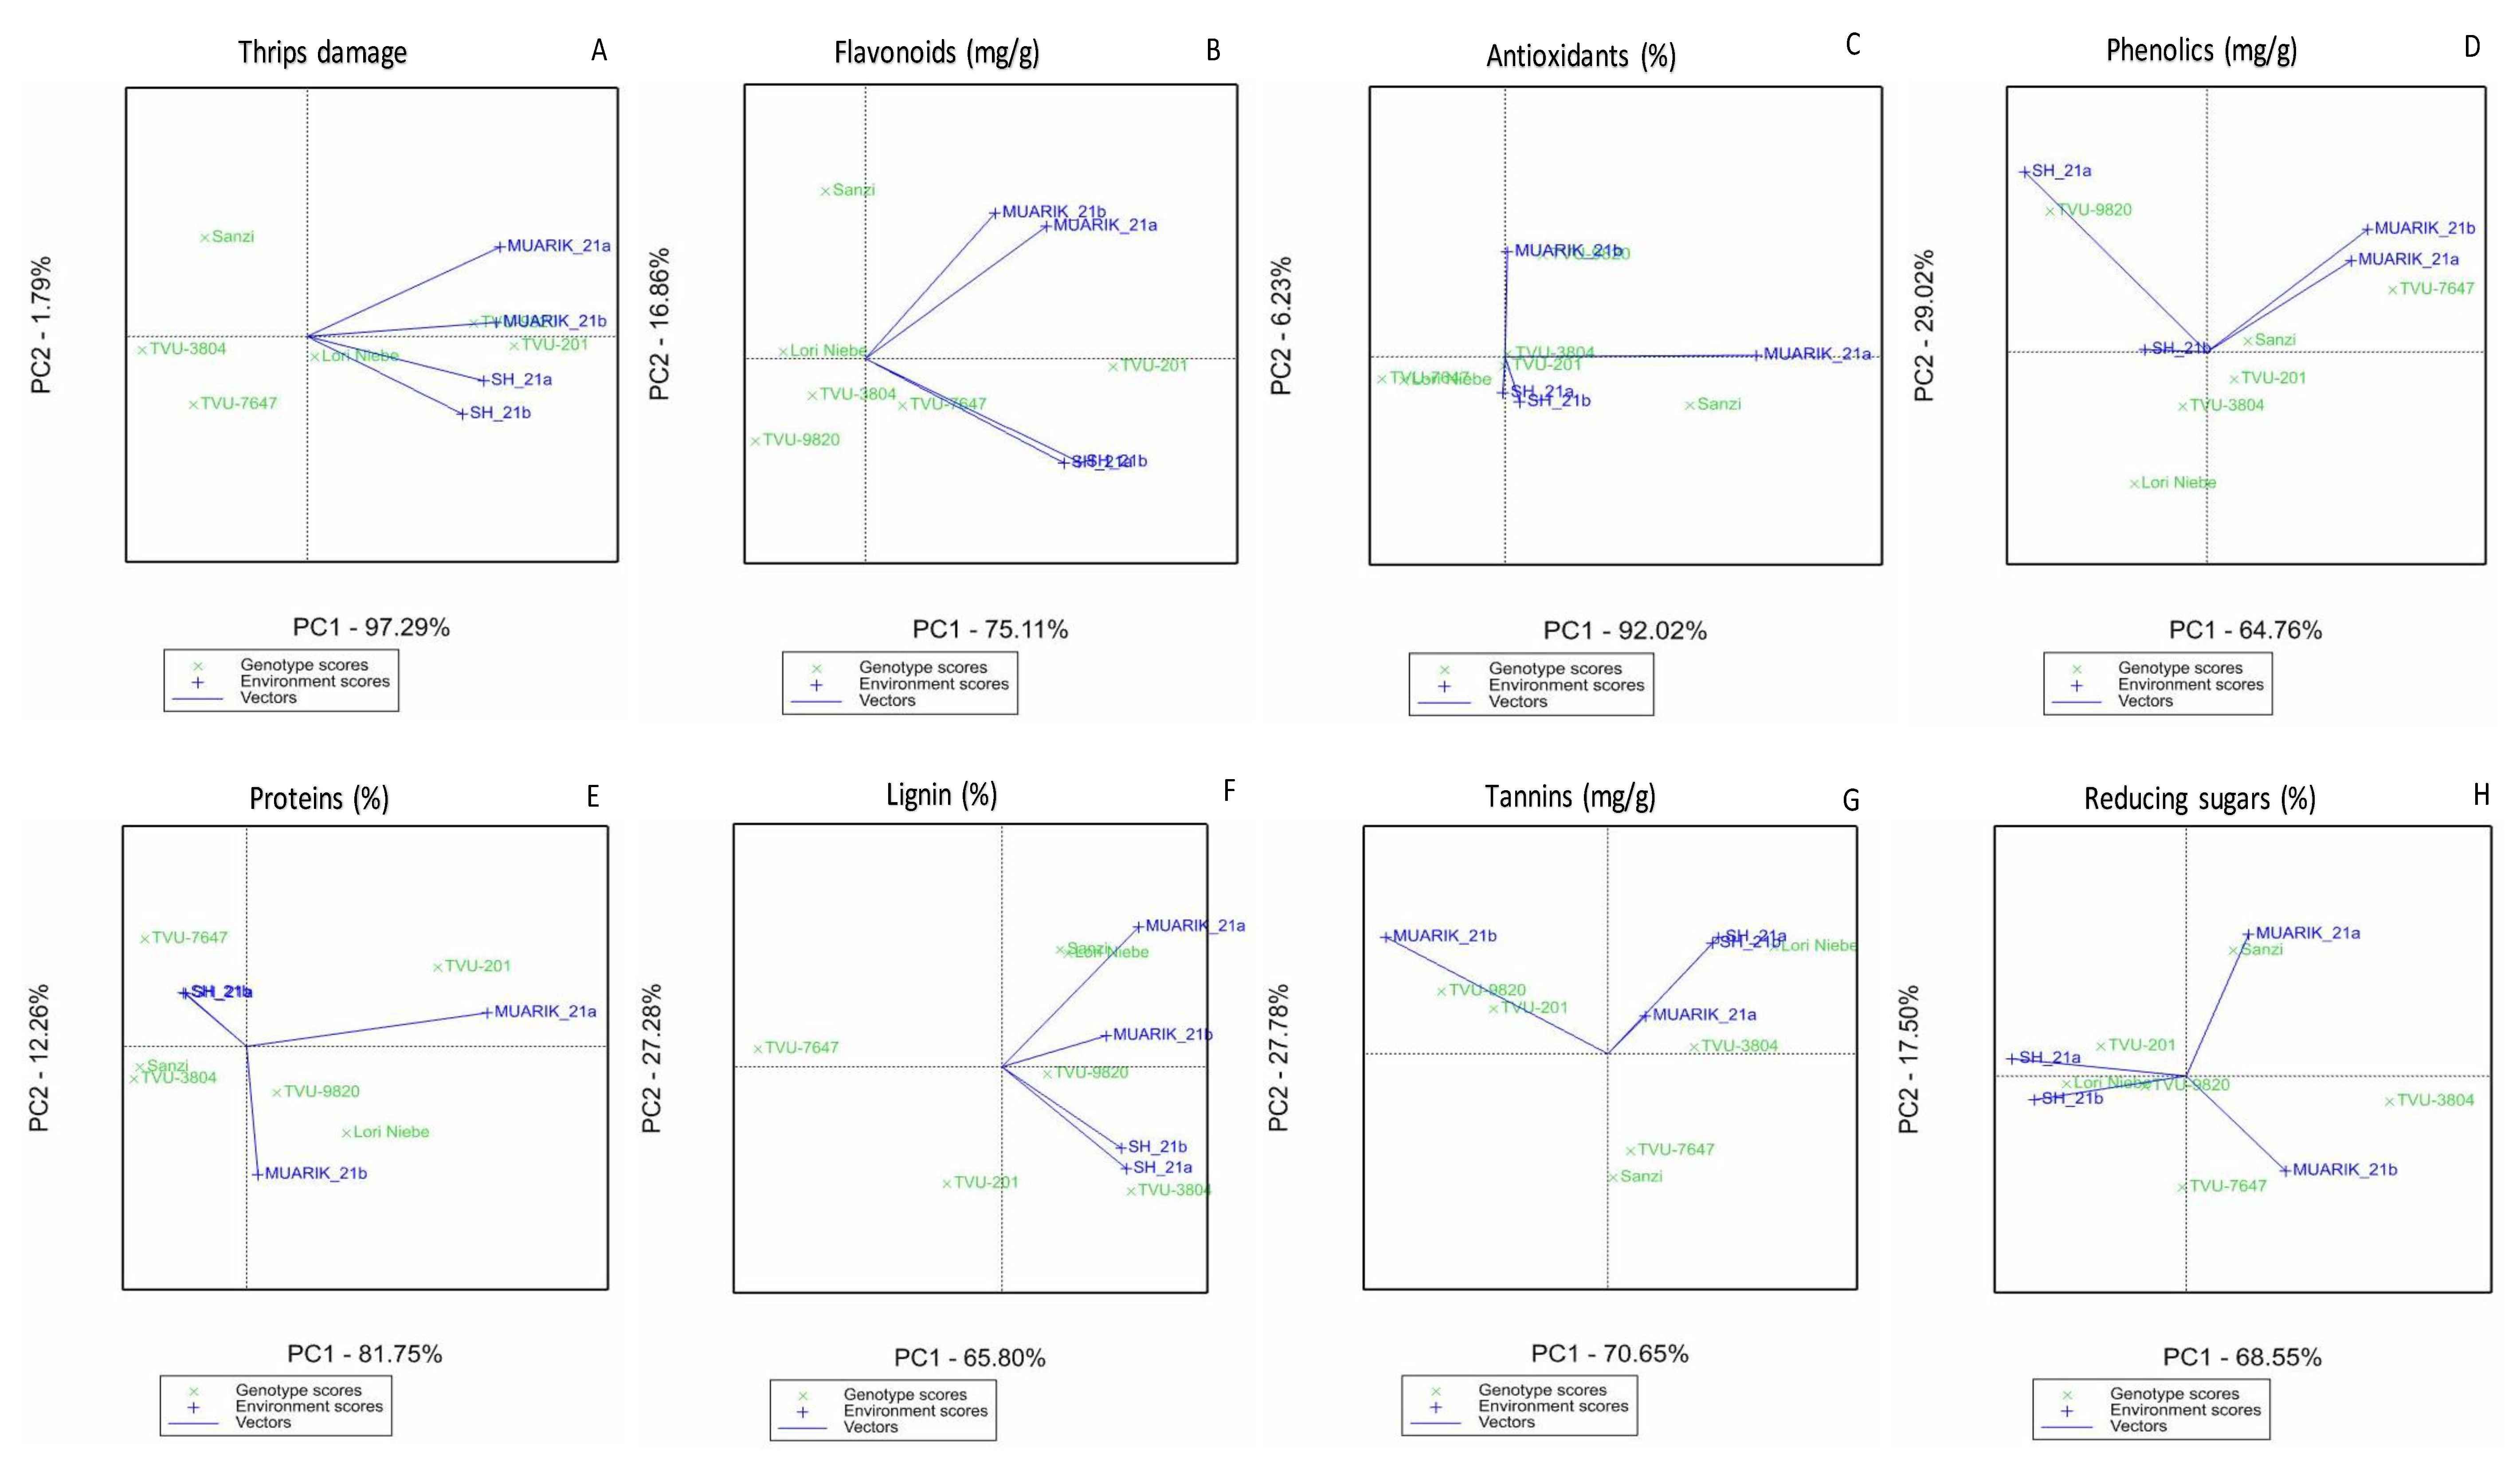
3.3. Stability of Secondary Metabolites across Environments

GGE biplots for the experiment are presented in Figure 4, Figure 5 and Figure 6. The values for first and second principal components (PC) were estimated to generate the GGE biplots. Genotypes that are closer to the average environment coordinate (AEC) are more stable. Accordingly, genotypes TVU-7647 and Sanzi were stable for flower thrips damage; Lori Niebe, TVU-201 and TVU-3804 were stable for flavonoids; TVU-3804 was stable for phenolics; Sanzi and TVU-3804 were stable for proteins; TVU-9820 and TVU-7647 were stable for lignin; Sanzi and TVU-7647 were stable for tannins; and TVU-201, TVU-9820 and TVU-3804 were stable for reducing sugars (Figure 4). Except Sanzi and TVU-9820, the rest of the genotypes were stable for antioxidants.
Genotype TVU-3804 was resistant to flower bud thrips and produced high lignin; TVU-201 was ideal for flavonoids, proteins and reducing sugars; Sanzi was ideal for antioxidants and phenolics, while Lori Niebe was ideal for tannins (Figure 5). A comparison between the test environments is shown in Figure 6 with the vectors connecting each environment to the origin of the biplot. Genotypes with an acute angle between them are similar, while those with an obtuse angle are different. For flower thrips damage, all the four environments were similar. For all the traits under investigation, the SH_21a and SH_21b were similar. In a similar manner, MUARIK_21a and MUARIK_21b were similar for flower thrips damage, flavonoids, phenolics and lignin, but different for antioxidants, proteins, tannins and sugars. The environment with the longest vector from the origin of the biplot indicates that it had the largest variation, hence, the ideal environment for the evaluation of a particular trait. Consequently, MUARIK_21a had the largest projection for flower thrips damage, flavonoids, antioxidants, proteins, lignin and reducing sugars; MUARIK_21b had the largest projection for tannins; while SH_21a had the largest projection for phenolics.

4. Discussion

Cowpea flower bud thrips infest the crop during the flowering stage where they feed on the raceme, flowers and flower buds, causing abscission. Targeting these parts in the investigation of secondary metabolites is necessary since they are the feeding spots and assessing metabolites contents in the targeted parts would play a significant role in the development of resistant genotypes. Previous studies used these floral structures to study the role of secondary metabolites in the resistance of cowpea to flower thrips [8,15]
The concentrations of different secondary metabolites varied among genotypes and environments, with significant interactions observed between genotypes and environments. The variation observed in genotypes is a result of the genetic differences among the genotypes, while the significant variation observed in environments is a result of changes in temperature, humidity and rainfall during the growing seasons. Genotypes respond differently to varied environments and stress levels. In this experiment, there was non-significant differences among genotypes for phenolics and proteins, which is consistent with previous finding by [8], who observed a similar level of phenolics and proteins in another six cowpea genotypes that were evaluated for their resistance to flower bud thrips. This shows the production of proteins and phenolics by these genotypes is similar under different environments. In addition, the significant interaction is an indication that environmental conditions affect flower bud thrips population and thus production of secondary metabolites by cowpea genotypes is due to varied genes controlling the trait [12]. In this study, resistant genotypes were observed to have low flower thrips damage, thus, confirming the presence of genes for host resistance. Furthermore, higher concentrations of some metabolites could contribute to resistance. Generally, the resistant genotypes had higher concentrations of antioxidants, phenolics, proteins, tannins and reducing sugars, which could be contributing to resistance (Figure 1). It is expected that resistant genotypes have a high concentration of flavonoids and phenolics, while susceptible genotypes have low concentrations [8,15]. However, surprisingly, susceptible genotypes, TVU-201 and TVU-9820, had the highest flavonoid and phenolic concentrations, respectively. Nevertheless, this information should not be discarded because flavonoids and phenolics are a structurally diverse class of phytochemicals, and it should not be inferred that all flavonoids or phenolics have a similar influence on insects [43].
The environment had a significant effect on the production of secondary metabolites. For instance, antioxidants and phenolics were highest in the SH_21a and SH_21b, where the temperatures were highest (Figure 2). A raised temperature activates the catalytic enzymes which are a part of the phenolic and antioxidative capacity pathway, thereby leading to an increased production of plant metabolites [11]. At every 10 °C increase in temperature, there is twice the increase in the average rate of enzymatic reactions involved in antioxidant capacity [34]. Contrary, the flavonoid concentration was highest at MUARIK_21a and MUARIK_21b compared to SH_21a and SH_21b where the temperature was highest (Table 2), which is confirmed by the negative correlation between flavonoids and temperature. These variations explain the different responses of metabolites influenced by different factors. Secondary metabolites are influenced by stresses on the plant, either biotic or abiotic. As a result, diverse factors—both in the field and in the screenhouse experiments—contributed to the variations in the concentrations of the metabolites [9]. The non-significant correlation among most of the metabolites and flower thrips damage is an indication that the environment affects traits differently, and therefore, various traits need to be looked at independently. From the literature, low temperature reduces flower thrips activity due to reduced cellular metabolism, elevated plant antioxidants causing further limitation of insect movement, feeding and reproduction [15]. The low thrips population indicated by low flower thrips damage in the screenhouse is a result of increased secondary metabolites.
The significant negative correlation between antioxidants, phenolics and flower thrips damage was an indication that an increase in these metabolites reduced the feeding, oviposition and survival of thrips, thereby reducing their population. This finding was consistent with previous studies [34], that reported that an increase in phenolics reduced the whitefly population in cassava. Phenolics can inhibit digestive enzymes or provoke damages to the gut epithelial membrane, thus, leading to an impairment of nutrient digestion and absorption [44]. In addition, phenolics were highly associated with antioxidants, thus, signifying the contribution of phenolics to the antioxidative activities [45]. On the other hand, once the plant tissue is injured by pests, protein complexes accumulate in the cytosol at the wound site to seal the sieve element lesion [9]. This explains the positive correlation between proteins and thrips damage [20]. The negative correlation observed between rainfall and traits, except for proteins and lignin, is a clear indication of how plants respond to stress. The reduction in soil water causes stress to plants, which leads to an increased production of secondary metabolites [46].
The stability of traits is very important when developing cultivars for farmers. The prospect of picking genotypes that are stable within an extensive assortment of environments owes to genotypes promptly responding by selectively regulating the expression of genes in response to environmental deviations [47]. Stable genotypes across environments are preferred since they can be grown in diverse environments compared to the specific ones which can only be grown in specific environments. The biplot graph could be used to interpret the relationships among varieties, characters, and groups of traits [25]. The GGE biplots have been used to elucidate the genotype by environment interactions in different traits for various crops such as yam (Dioscorea spp.) [28] and wheat (Triticum aestivum) [27], among others. In this study, resistant genotypes were found to be more stable across environments as compared to susceptible genotypes. Genotype TVU-3804, which had the lowest thrips damage, was stable for flavonoids, antioxidants, phenolics, proteins and reducing sugars. This is an indication that the production of these metabolites is nearly uniform across environments, hence, the least affected by variations in temperature and rainfall. Genotype Sanzi, although it was moderately resistant to flower thrips, was found to be highly influenced by the environment in the production of flavonoids and reducing sugars, but stable for antioxidants, phenolics, proteins and tannins. This observation was similar to previous observations where Sanzi was observed to have high levels of phenolics when screened under flower thrips infestation [15]. Perhaps the stable concentrations of antioxidants, phenolics, proteins and tannins contributed to Sanzi’s stable resistance to flower thrips which has been observed in different countries [6,48]. From the results, the genotypes had different productions of various secondary metabolites. The GGE biplot enabled us to view the ranking of genotypes on various metabolites across environments (Figure 5). Genotypes that are in the inner concentric circle represent the ideal genotype. Consequently, genotype TVU-201 was ideal for flavonoids, proteins and sugars; TVU-3804 was ideal for flower thrips damage and lignin; while Sanzi was ideal for antioxidants and phenolics. The ranking of genotypes is from the largest to the smallest value. Therefore, in case of thrips damage, our interest is on genotypes with the lowest value, hence, TVU-3804, was the best performing genotype.
We compared the test environments based on the flower thrips damage and the concentrations of the secondary metabolites. Similarity was observed in MUARIK_21a and MUARIK_21b for flower thrips damage, flavonoids, phenolics and lignin. This means that while conducting an experiment on these traits, either of the environment could be considered. Similarly, either SH_21a and SH_21b would be considered for all the traits under investigation, in case of limited resources for conducting an experiment. For flower thrips damage, all the environments were similar, hence, any environment is ideal for screening. This similarity is an indication that the thrips population increased uniformly in different environments. According to GGE biplots, the vector connecting each environment to the origin of the biplot indicates the variation contributed to a trait in that environment [25]. Consequently, MUARIK_21a is an ideal environment to carry out studies on flavonoids, antioxidants, proteins, lignin and reducing sugars; MUARIK_21b is ideal for tannins; while SH_21a is the best for phenolics related experiments. In addition, TVU-9820 was associated with SH_21a, hence, was the best genotype for phenolics studies under the screen house environment. A high temperature was found to be positively correlated with phenolics, and similar observation was reported for blackcurrant (Ribes nigrum) [49].

5. Conclusions

A high genetic variability was observed among cowpea genotypes for flower thrips damage, flavonoids, antioxidants, lignin, tannins and reducing sugars, an indication that the selection of genotypes based on these traits would be beneficial in a cowpea improvement program. Environmental conditions such as temperature and rainfall highly influence the production of secondary metabolites and thrips population. Genotypes TVU-3804, TVU-7647 and Sanzi had low thrips damage and were relatively stable for secondary metabolites across environments.

Author Contributions

Conceptualization, H.W.G., S.K. and I.O.D.; Methodology, H.W.G., P.A. and M.M.L.; Analysis, H.W.G. and I.O.D.; Supervision, S.K. and I.O.D.; Writing—original draft preparation, H.W.G.; Writing—Review editing, H.W.G., S.K., P.A., M.M.L., R.E. and I.O.D. All authors have read and agreed to the published version of the manuscript.

Funding

This research was funded by German Academic Exchange Service (DAAD) (grant number 2018), Mawazo Institute (grant number 2022-0-03), and Makerere University Regional Center for Crop Improvement (MaRCCI).

Acknowledgments

The cowpea seed was provided by the International Institute of Tropical Agriculture (IITA). The field evaluation was supported by Makerere University Regional Center for Crop Improvement (MaRCCI) while the laboratory work was supported by the German Academic Exchange Service (DAAD) through the Regional Universities Forum for Capacity Building in Agriculture (RUFORUM) and the Mawazo Institute. The quantification of the secondary metabolites was carried out at the National Crops Resources Research Institute (NaCRRI).

Conflicts of Interest

The authors declare no conflict of interest.

References

  1. FAOSTAT Food and Agriculture Organization of the United Nations Statistical Information. Available online: https://www.fao.org/faostat/en/#data/QCL (accessed on 20 September 2022).
  2. Santamaria, M.E.; Martínez, M.; Cambra, I.; Grbic, V.; Diaz, I. Understanding Plant Defence Responses against Herbivore Attacks: An Essential First Step towards the Development of Sustainable Resistance against Pests. Transgenic Res. 2013, 22, 697–708. [Google Scholar] [CrossRef] [PubMed]
  3. Muchero, W.; Diop, N.N.; Bhat, P.R.; Fenton, R.D.; Wanamaker, S.; Pottorff, M.; Hearne, S.; Cisse, N.; Fatokun, C.; Ehlers, J.D.; et al. A Consensus Genetic Map of Cowpea [Vigna Unguiculata (L) Walp.] and Synteny Based on EST-Derived SNPs. Proc. Natl. Acad. Sci. USA 2009, 106, 18159–18164. [Google Scholar] [CrossRef] [PubMed] [Green Version]
  4. Agbahoungba, S.; Karungi, J.; Odong, T.L.; Badji, A.; Sadik, K.; Rubaihayo, P.R. Stability and Extent of Resistance of Cowpea Line to Flower Bud Thrips in Uganda. Afr. Crop. Sci. J. 2019, 3, 15–30. [Google Scholar] [CrossRef] [Green Version]
  5. Alabi, A.; Omoloye, A.A.; Omoloye, A.A. Preliminary Evaluation of Selected Cowpea Varieties for Resistance to Cowpea Preliminary Evaluation of Selected Cowpea Varieties for Resistance to Cowpea Aphid, Aphis Craccivora. Niger. J. Ecol. 2012, 12, 45–55. [Google Scholar]
  6. Abudulai, M.; Salifu, A.B.; Haruna, M. Screening of Cowpea for Resistance to the Flower Bud Thrips, Megalurothrips Sjostedti Trybom (Thysanoptera’Thripidae). J. Appl. Sci. 2006, 6, 1621–1624. [Google Scholar] [CrossRef] [Green Version]
  7. Togola, A.; Boukar, O.; Chamarthi, S.; Belko, N.; Tamò, M.; Oigiangbe, N.; Ojo, J.; Ibikunle, M.; Fatokun, C. Evaluation of Cowpea Mini Core Accessions for Resistance to Flower Bud Thrips Megalurothrips Sjostedti Trybom (Thysanoptera: Thripidae). J. Appl. Entomol. 2019, 143, 683–692. [Google Scholar] [CrossRef] [Green Version]
  8. Agbahoungba, S.; Karungi, J.; Odong, T.L.; Badji, A.; Kumi, F.; Mwila, N.; Rubaihayo, P.R. Biochemical Constituents Influencing the Resistance to Flower Bud Thrips in Cowpea [Vigna Unguiculata (L.) Walp] Germplasm. J. Anim. Plant Sci. 2018, 28, 128–137. [Google Scholar]
  9. Erb, M.; Reymond, P. Molecular Interactions between Plants and Insect Herbivores. Annu. Rev. Plant Biol. 2019, 70, 527–557. [Google Scholar] [CrossRef] [PubMed] [Green Version]
  10. Alabi, O.Y.; Odebiyi, J.A.; Jackai, L.E.N. Field Evaluation of Cowpea Cultivars (Vigna Unguiculata [L.] Walp.) for Resistance to Flower Bud Thrips (Megalurothrips Sjostedti Trybom) (Thysanoptera:Thripidae). Int. J. Pest. Manag. ISSN 2010, 4, 287–291. [Google Scholar] [CrossRef]
  11. Kant, M.R.; Jonckheere, W.; Knegt, B.; Lemos, F.; Liu, J.; Schimmel, B.C.J.; Villarroel, C.A.; Ataide, L.M.S.; Dermauw, W.; Glas, J.J.; et al. Mechanisms and Ecological Consequences of Plant Defence Induction and Suppression in Herbivore Communities. Ann. Bot. 2015, 115, 1015–1051. [Google Scholar] [CrossRef] [PubMed]
  12. Jamieson, M.A.; Burkle, L.A.; Manson, J.S.; Runyon, J.B.; Trowbridge, A.M.; Zientek, J. Global Change Effects on Plant–Insect Interactions: The Role of Phytochemistry. Curr. Opin. Insect. Sci. 2017, 23, 70–80. [Google Scholar] [CrossRef] [PubMed]
  13. Barah, P.; Bones, A.M. Multidimensional Approaches for Studying Plant Defence against Insects: From Ecology to Omics and Synthetic Biology. J. Exp. Bot. 2015, 66, 479–493. [Google Scholar] [CrossRef] [PubMed]
  14. Agbahoungba, S.; Karungi, J.; Odong, T.L.; Badji, A.; Sadik, K.; Rubaihayo, P.R.; Zonal, A. Stability and Extent of Resistance of Cowpea Lines to Flower Thrips. Afr. Crop. Sci. J. 2017, 25, 1–24. [Google Scholar] [CrossRef] [Green Version]
  15. Alabi, O.Y.; Odebiyi, J.A.; Tamo, M.; Omoloye, A.A. The Roles of Plant Secondary Metabolites from Cowpea Floral Structures in Resistance to the Flower Bud Thrips. J. Agric. Sci. Technol. 2011, 262–269. [Google Scholar]
  16. Shrivastava, G.; Rogers, M.; Wszelaki, A.; Panthee, D.R.; Chen, F. Plant Volatiles-Based Insect Pest Management in Organic Farming. CRC Crit. Rev. Plant Sci. 2010, 29, 123–133. [Google Scholar] [CrossRef]
  17. Howe, G.A.; Jander, G. Plant Immunity to Insect Herbivores. Annu. Rev. Plant Biol. 2008, 59, 41–66. [Google Scholar] [CrossRef] [PubMed] [Green Version]
  18. Mazid, M.; Khan, T.A.; Mohammad, F. Role of Secondary Metabolites in Defense Mechanisms of Plants. Biol. Med. 2011, 3, 232–249. [Google Scholar]
  19. Stevens, M.T.; Waller, D.M.; Lindroth, R.L. Resistance and Tolerance in Populus Tremuloides: Genetic Variation, Costs, and Environmental Dependency. Evol. Ecol. 2007, 21, 829–847. [Google Scholar] [CrossRef]
  20. Ncube, B.; Finnie, J.F.; van Staden, J. Quality from the Field: The Impact of Environmental Factors as Quality Determinants in Medicinal Plants. S. Afr. J. Bot. 2012, 82, 11–20. [Google Scholar] [CrossRef] [Green Version]
  21. Lemoine, N.P.; Burkepile, D.E.; Parker, J.D. Variable Effects of Temperature on Insect Herbivory. PeerJ 2014, 2014, 1–18. [Google Scholar] [CrossRef] [Green Version]
  22. Shukla, G.K. Some Statistical Aspects of Partitioning Genotype-Environmental Components of Variability. Heredity 1972, 29, 237–245. [Google Scholar] [CrossRef]
  23. Finlay, K.; Wilkinson, G. The Analysis of Adaptation in a Plant-Breeding Programme. Aust J. Agric. Res. 1963, 14, 742. [Google Scholar] [CrossRef] [Green Version]
  24. Lin, C.S.; Binns, M.R. A Superiority Measure of Cultivar Performance for Cultivar × Location Data. Can. J. Plant Sci. 1988, 68, 193–198. [Google Scholar] [CrossRef]
  25. Ruswandi, D.; Syafii, M.; Maulana, H.; Ariyanti, M.; Indriani, N.P.; Yuwariah, Y. GGE Biplot Analysis for Stability and Adaptability of Maize Hybrids in Western Region of Indonesia. Int. J. Agron. 2021, 2021. [Google Scholar] [CrossRef]
  26. Horn, L.; Shimelis, H.; Sarsu, F.; Mwadzingeni, L.; Laing, M.D. Genotype-by-Environment Interaction for Grain Yield among Novel Cowpea (Vigna Unguiculata L.) Selections Derived by Gamma Irradiation. Crop. J. 2018, 6, 306–313. [Google Scholar] [CrossRef]
  27. Gitonga, W.H.; Ojwang, P.O.P.; Macharia, K.G.; Njau, N.P. Evaluation of Advanced Bread Wheat Genotypes for Resistance to Stem Rust and Yield Stability. Afr. J. Plant Sci. 2016, 10, 111–120. [Google Scholar] [CrossRef] [Green Version]
  28. Adjei, E.A.; Esuma, W.; Alicai, T.; Chamba, E.B.; Edema, R.; Dramadri, I.O.; Ozimati, A.A.; Agaba, R.; Odong, T.L. Genotype-by-Environment Interaction of Yam (Dioscorea Species) for Yam Mosaic Virus Resistance, Dry Matter Content and Yield in Uganda. Agronomy 2022, 12, 1984. [Google Scholar] [CrossRef]
  29. Mbeyagala, E.K.; Ariko, J.B.; Atimango, A.O.; Amuge, E.S. Yield Stability among Cowpea Genotypes Evaluated in Different Environments in Uganda. Cogent Food Agric. 2021, 7, 1914368. [Google Scholar] [CrossRef]
  30. Yan, W.; Kang, M.S.; Ma, B.; Woods, S.; Cornelius, P.L. GGE Biplot vs. AMMI Analysis of Genotype-by-Environment Data. Crop. Sci. 2007, 47, 643–653. [Google Scholar] [CrossRef] [Green Version]
  31. Odeseye, A.O.; Amusa, N.A.; Ijagbone, I.F.; Aladele, S.E.; Ogunkanmi, L.A. Genotype by Environment Interactions of Twenty Accessions of Cowpea [Vigna Unguiculata (L.) Walp.] across Two Locations in Nigeria. Ann. Agrar. Sci. 2018, 16, 481–489. [Google Scholar] [CrossRef]
  32. Simion, T.; Mohammed, W.; Amsalu, B. Genotype by Environment Interaction and Stability Analysis of Cowpea (Vigna Unguiculata (L) Walp) Genotypes for Yield in Ethiopia. J. Plant Breed Crop. Sci. 2018, 10, 249–257. [Google Scholar]
  33. Padi, F.K. Genotype × Environment Interaction and Yield Stability in a Cowpea-Based Cropping System. Euphytica 2007, 158, 11–25. [Google Scholar] [CrossRef]
  34. Mwila, N.; Nuwamanya, E.; Odong, T.L.; Badji, A.; Agbahoungba, S.; Ibanda, P.A.; Mwala, M.; Sohati, P.; Kyamanywa, S.; Rubaihayo, P.R. Genotype by Environment Interaction Unravels Influence on Secondary Metabolite Quality in Cassava Infested by Bemisia Tabaci. J. Agric. Sci. 2018, 10, 192. [Google Scholar] [CrossRef] [Green Version]
  35. Sserumaga, J.P.; Oikeh, S.O.; Mugo, S.; Otim, G.A.M.; Beyene, Y.; Abalo, G.; Kikafunda, J. Genotype by Environment Interactions and Agronomic Performance of Doubled Haploids Testcross Maize (Zea Mays L.) Hybrids. Euphytica 2015, 205, 1–15. [Google Scholar]
  36. Jackai, L.E.N.; Adalla, C.B. Pest Management Practices in Cowpea: A Review; IITA: Ibadan, Nigeria, 1997; pp. 240–258. [Google Scholar]
  37. Michalska, A.; Ceglinska, A.; Amarowicz, R.; Piskula, M.K.; Szawara-Nowak, D.; Zielinski, H. Antioxidant Contents and Antioxidative Properties of Traditional Rye Breads. J. Agric. Food Chem 2007, 55, 734–740. [Google Scholar] [CrossRef] [PubMed]
  38. Mwila, N.; Rubaihayo, S.; Kyamanywa, S.; Odong, T.L.; Nuwamanya, E.; Mwala, M.; Agbahoungba, S.; Badji, A. Biochemical Factors Associated with Cassava Resistance to Whitefly Infestation. Afr Crop. Sci J. 2017, 25, 365. [Google Scholar] [CrossRef]
  39. Harbourne, J.B. A Guide to Modern Techniques of Plant Analysis; Kluwer Academic Publishers: Norwell, MA, USA, 1998. [Google Scholar]
  40. Kandakoor, S.B.; Khan, H.K.; Chakravarthy, A.K.; Kumar, C.T.A.; Venkataravana, P. Biochemical Constituents Influencing Thrips Resistance in Groundnut Germplasm. J. Environ. Biol. 2014, 35, 675–681. [Google Scholar] [PubMed]
  41. Ahmed, D.; Khan, M.; Saeed, R. Comparative Analysis of Phenolics, Flavonoids, and Antioxidant and Antibacterial Potential of Methanolic, Hexanic and Aqueous Extracts from Adiantum Caudatum Leaves. Antioxidants 2015, 4, 394–409. [Google Scholar] [CrossRef] [PubMed]
  42. Moreira-Vilar, F.C.; Siqueira-Soares, R.D.C.; Finger-Teixeira, A.; de Oliveira, D.M.; Ferro, A.P.; da Rocha, G.J.; Ferrarese, M.D.L.L.; dos Santos, W.D.; Ferrarese-Filho, O. The Acetyl Bromide Method Is Faster, Simpler and Presents Best Recovery of Lignin in Different Herbaceous Tissues than Klason and Thioglycolic Acid Methods. PLoS ONE 2014, 9, e110000. [Google Scholar] [CrossRef] [Green Version]
  43. Bi, J.L.; Felton, G.W.; Murphy, J.B.; Howles, P.A.; Dixon, R.A.; Lamb, C.J. Do Plant Phenolics Confer Resistance to Specialist and Generalist Insect Herbivores? J. Agric. Food Chem. 1997, 45, 4500–4504. [Google Scholar] [CrossRef]
  44. Lone, R.; Shuab, R.; Kamili, A.N. (Eds.) Plant Phenolics in Sustainable Agriculture; Springer: Singapore, 2020; ISBN 978-981-15-4889-5. [Google Scholar]
  45. Oomah, B.D.; Cardador-Martínez, A.; Loarca-Piña, G. Phenolics and Antioxidative Activities in Common Beans (Phaseolus Vulgaris L.). J. Sci. Food Agric. 2005, 85, 935–942. [Google Scholar] [CrossRef]
  46. Yang, L.; Wen, K.S.; Ruan, X.; Zhao, Y.X.; Wei, F.; Wang, Q. Response of Plant Secondary Metabolites to Environmental Factors. Molecules 2018, 23, 1–26. [Google Scholar] [CrossRef] [Green Version]
  47. Okoth, S.; Rose, L.J.; Ouko, A.; Netshifhefhe, N.E.I.; Sila, H.; Viljoen, A. Assessing Genotype-by-Environment Interactions in Aspergillus Ear Rot and Pre-Harvest Aflatoxin Accumulation in Maize Inbred Lines. Agronomy 2017, 7, 86. [Google Scholar] [CrossRef] [Green Version]
  48. Omo-ikerodah, E.; Fatokun, C.; Fawole, I. Genetic Analysis of Resistance to Flower Bud Thrips (Megalurothrips Sjostedti) Genetic Analysis of Resistance to Flower Bud Thrips (Megalurothrips Sjostedti) in Cowpea (Vigna Unguiculata L.] Walp.). Euphytica 2009, 165, 145–154. [Google Scholar] [CrossRef] [Green Version]
  49. Zheng, J.; Yang, B.; Ruusunen, V.; Laaksonen, O.; Tahvonen, R.; Hellsten, J.; Kallio, H. Compositional Differences of Phenolic Compounds between Black Currant (Ribes Nigrum L.) Cultivars and Their Response to Latitude and Weather Conditions. J. Agric. Food Chem. 2012, 60, 6581–6593. [Google Scholar] [CrossRef] [PubMed]
Figure 1. Means for flower thrips damage (A), flavonoids (B), antioxidants (C), phenolics (D), proteins (E), lignin (F), tannins (G) and reducing sugars (H) on Cowpea evaluated across 4 environments.
Agronomy 12 03210 g001aAgronomy 12 03210 g001b
Figure 2. The trends in secondary metabolite concentrations (A,B) and thrips damage (B) in cowpea evaluated in the field (MUARIK) and screen house (SH) experiments.
Agronomy 12 03210 g002
Figure 3. Performance of six cowpea genotypes for thrips damage (A), flavonoids (B), antioxidants (C), phenolics (D), proteins (E), lignin (F), reducing sugars (G) and tannins (H) evaluated in the field (MUARIK) and screen house (SH) experiments for short and long rain seasons.
Agronomy 12 03210 g003aAgronomy 12 03210 g003b
Figure 4. GGE biplot showing the stability of flower thrips damage (A), flavonoids (B), antioxidants (C), phenolics (D), proteins (E), lignin (F), tannins (G) and reducing sugars (H) in the cowpea genotypes tested in four environments in Uganda.
Agronomy 12 03210 g004aAgronomy 12 03210 g004b
Figure 5. GGE biplot showing the ranking of genotypes based on the ideal genotype for flower bud thrips damage (A), flavonoids (B), antioxidants (C), phenolics (D), proteins (E), lignin (F), tannins (G) and reducing sugars (H) tested in cowpea across four environments in Uganda.
Agronomy 12 03210 g005
Figure 6. GGE biplot showing the relationship among the four environments in relation to flower thrips damage (A), flavonoids (B), antioxidants (C), phenolics (D), proteins (E), lignin (F), tannins (G) and reducing sugars (H) among six cowpea genotypes.
Agronomy 12 03210 g006
Table 1. Scale for rating the flower bud thrips damage in cowpea.
RatingAppearance
1No browning/drying of stipules, leaves or flower buds; no bud abscission.
3Initiation of browning of stipules, leaves or flower buds; no bud abscission.
5Distinct browning/drying of stipules and leaves or flower buds; some bud abscission.
7Serious bud abscission accompanied by browning/drying of stipules and buds; non-elongation of peduncles.
9Very severe bud abscission, heavy browning, drying of stipules and buds; distinct non-elongation of (most or all) peduncles.
Source: [36]
Table 2. Average monthly temperature (°C) and rainfall (mm) during the experiment seasons.
EnvironmentTemp. Max (°C)Temp. Min (°C)Rainfall (mm)
MUARIK_21a29.9516.2894.98
MUARIK_21b27.1915.4138.85
SH_21a33.9221.3499.56
SH_21b31.0320.5499.56
Temp. Max = maximum temperature, Temp. Min = Minimum temperature.
Table 3. Mean squares for secondary metabolites and flower thrips damage in cowpea genotypes across environments.
SOVdfFT DamageFlavonoids (mg/g)Antioxidants (%)Phenolics (mg/g)Proteins (%)Lignin (%)Tannins (mg/g)Reducing Sugars (%)
Rep20.184.007.008.504.844.004.400.80
Geno551.58 ***474.00 ***68.00 ***3.70 ns3.11 ns295.00 ***120.42 ***48.64 ***
Env342.45 ***13164.00 ***6864.00 ***59.71 ***30.69 ***5013.00 ***70.38 ***28.35 *
Geno × Env150.59 ***58.00 ***62.00 ***4.57 *8.85 ***52.00 ***119.51 ***90.93 ***
Residuals460.3317.0013.002.071.444.002.567.52
CV 13.003.724.4916.228.933.5911.2312.49
LSD 0.473.403.011.180.981.711.312.25
*, *** = significant at 0.05, 0.001 probability levels respectively, ns= not significant, SOV = source of variation, df = Degrees of freedom, FT = flower thrips, Rep = Replication, Geno = Genotype, Env = Environment, CV = Coefficient of variation, LSD = Least Significant Difference.
Table 4. Correlation coefficients for the cowpea genotypes screened for secondary metabolites and flower thrips across four environments.
FT DamageFlavonoids (mg/g)Antioxidants (%)Phenolics (mg/g)Proteins (%)Lignin (%)Tannins (mg/g)Sugars (%)Temp.max (°C)Temp.min (°C)Rainfall (mm)
FT damage-
Flavonoids (mg/g)0.81-
Antioxidants (%)−0.62−0.96 **-
Phenolics (mg/g)−0.60−0.93 **0.98 **-
Proteins (%)0.570.93 *−0.97 **−0.90 *-
Lignin (%)0.430.88−0.97 **−0.93 *0.97 **-
Tannins (mg/g)0.96 **0.92 *−0.78−0.730.770.64-
Sugars (%)0.96 **0.62−0.39−0.380.330.170.86-
Temp.max (°C)−0.81−0.430.230.31−0.060.01−0.62−0.89-
Temp.min (°C)−0.99 **−0.740.550.56−0.46−0.34−0.91 *−0.98 *0.89 *-
Rainfall (mm)−0.65−0.09−0.18−0.170.230.40−0.44−0.840.830.72-
*, ** = significant at 0.05, 0.01 probability levels respectively, FT = flower thrips, Temp = temperature, max = maximum, min = minimum.
Publisher’s Note: MDPI stays neutral with regard to jurisdictional claims in published maps and institutional affiliations.

