Article

A Comparative Study on the Nutrients, Mineral Elements, and Antioxidant Compounds in Different Types of Cruciferous Vegetables

1
College of Horticulture, Gansu Agriculture University, Lanzhou 730070, China
2
Key Laboratory of Crop Science in Arid Environment of Gansu Province, Lanzhou 730070, China
*
Authors to whom correspondence should be addressed.
Agronomy 2022, 12(12), 3121; https://doi.org/10.3390/agronomy12123121
Submission received: 29 October 2022 / Revised: 2 December 2022 / Accepted: 6 December 2022 / Published: 8 December 2022

Abstract

:
Studies on the diversity within and among cabbage (Brassica oleracea L. var. capitata L.), cauliflower (Brassica oleracea var. botrytis), and Chinese cabbage (Brassica rapa L. ssp. pekinensis) variants are essential for the development of healthy diets. However, most studies on them have been limited to a single species, with little integrated analysis between them. In this study, the diversity within and among these species and varieties is assessed by determining the contents of 15 major characteristic nutrients, antioxidants, and minerals in 12 varieties of cabbage, 9 varieties of cauliflower, and 12 varieties of Chinese cabbage cultivated under the same conditions. The results show that there are significant differences in the compositional distributions of cabbage, cauliflower, and Chinese cabbage. Cabbage has the highest contents of soluble sugars (27.73 mg·kg−1 FW), flavonoids (5.90 mg·g−1 FW), and Fe (46.90 mg·kg−1 DW). Cauliflower is an ideal source of soluble protein (603.04 mg·kg−1 FW), polyphenols (1.53 mg·g−1 FW), glucosinolates (25.27 μmol·g−1 FW), and Cu (4.25 mg·kg−1 DW). Chinese cabbage is rich in vitamin C (0.45 mg·g−1 FW) and minerals (K, Ca, Mg, P, Mn, and Zn, at 9206.67 mg·kg−1 DW, 3297.00 mg·kg−1 DW, 3322.79 mg·kg−1 DW, 5614.78 mg·kg−1 DW, 15.36 mg·kg−1 DW, and 21.87 mg·kg−1 DW, respectively). There is a correlation between the quality, antioxidant properties, and minerals of the three species. In principal component analysis, a wide distribution of cabbage varieties and a high degree of overlap with the confidence ellipse of cauliflower are observed, indicating that certain cabbage varieties share compositional characteristics with cauliflower. These findings provide a reference for selecting varieties with higher nutritional value and antioxidant properties, as well as breeding new varieties.

1. Introduction

As some of the most important leafy vegetables, cruciferous species are widely cultivated and consumed throughout the world. Most cruciferous vegetables can be eaten fresh or cooked; the leaves can be used as animal feed; and the seeds can be used to produce edible oils [1]. They are important components of a healthy diet, supplying a multitude of health-related micronutrients and phytochemicals [2,3]. Furthermore, with increasing attention being paid to healthier lifestyle choices, the consumption of cruciferous vegetables is increasing. According to the statistics of the Food and Agriculture Organization of the United Nations, cruciferous vegetable crops covered more than 0.48 M ha in 2020 (FAOSTA, 2020), and this is expanding rapidly year on year, especially for cabbage, Chinese cabbage, and cauliflower. Many cruciferous varieties with different shapes and colors have been bred and cultivated in recent years, and their sizes, shapes, weights, and textures are often very different. Owing to differences in their breeding parents, the nutritional elements and phytochemicals of such varieties are also different [4].
Chemical component analysis has shown that the majority constituents of cruciferous vegetables are carbohydrates, comprising approximately 90% of their dry weight, of which nearly 70% are low-molecular-weight carbohydrates and 30% is dietary fiber [5]. Different studies have shown that the enrichment of high-quality protein, minerals, vitamins, and antioxidant compounds, especially organosulfur phytochemicals and other phytochemicals, improves public health [6,7,8,9,10]. With the development of natural phytochemicals as potential chemoprophylaxis agents, it is now known that the water-soluble vitamin C (VC), the lipid-soluble vitamin E, flavonoids, carotenoids, phenolics, and glucosinolates, all of which are present in cruciferous vegetables, are involved in the body’s first and second lines of defense against oxidative stress [8,11,12]. As a result, they play significant roles in the prevention of chronic conditions, such as hypertension, diabetes, and neurodegenerative disorders [13,14]. Therefore, moderate intake of cruciferous vegetables is an economical and side-effect-free method for slowing the progression of these diseases or for the prevention of complications. Furthermore, phenolics, flavonoids, and glucosinolates are all diverse secondary plant metabolites and influence the sensory characteristics of vegetables, such as taste and flavor [15,16].
The contents of nutritional material, mineral elements, and antioxidant compounds in cruciferous vegetables vary with growth conditions, environmental stress, stage of maturity, post-harvest storage method, and variety. Different studies have shown that variety is the most important factor affecting the contents of these substances [5,17,18,19,20]. Thus, the determination of such compounds in different types of Chinese cabbage, cabbage, and cauliflower aids in the analysis of cruciferous crop quality. However, few studies have addressed the VC, soluble proteins, soluble sugars, mineral elements, phenolics, flavonoid, and glucosinolates contents in different cruciferous species [5,19,21]. Although these studies reported the nutrient compositions and contents for certain cruciferous families, there remains little information on their phytochemical characteristics and biological activities [22,23]. In addition, the extraction procedures and methods used in these studies were not identical, so it is difficult to compare their results.
Most of these studies only conducted compositional analysis of different varieties of a single species, while there are few studies that performed a comparative analysis between different crops [24,25]. Therefore, we determined the contents of VC, polyphenols, flavonoids, glucosinolates, soluble proteins, soluble sugars, nitrates, and minerals in different species of Chinese cabbage, cabbage, and cauliflower cultivated under the same conditions and compared them to determine the dominant nutrients in each species and variety and performed a comparative analysis of the antioxidant properties and nutritional quality of each species. The aim was to assess the contribution of 15 substances from the three crops to dietary balance and to identify the dominant components of each crop. Furthermore, our research could provide a reference for the future selection of cabbage, Chinese cabbage, and cauliflower varieties and to provide a basis for further research on the nutritional optimization of cruciferous crops.

2. Materials and Methods

2.1. Materials and Field Management

In total, 12 different Chinese cabbage varieties (3 green mini, 3 green upright, 3 green, 3 purple), 9 cauliflower varieties (3 purple, 3 green, 3 white), and 12 cabbage varieties (3 purple, 3 green oblate, 3 green bull heart, 3 green round) were collected at the harvest stage from Yuzhong, Gansu province, China (35°85’ N, 104°12’ E). The region belongs to the temperate semi-arid continental climate; the average altitude, annual temperature, average annual precipitation, evaporation are 1790 m, 6.6 °C, 300~400 mm, 1343 mm, respectively. The test field has a gentle topography and a basically uniform fertility level; the soil type is yellow cotton soil, and the basic physical and chemical properties of the soil are shown in Table 1. The test material (Table 2) was sown on 25 July 2021, at 30 days of seedling age, 40 cm apart and 25 cm apart in rows, and each crop was harvested at the optimal harvesting period. A randomized zonal design was used with 3 replications of 10 plants each for a total of 30 plants of each variety. Three plants of the same size, similar maturity, and free of diseases and pests were selected from each variety for subsequent trials.

2.2. Sample Preparation

For uniform sampling, the heads of all the materials were cut into very small blocks. A portion of each sample was weighed, wrapped in tin foil, and stored at −80 °C for subsequent determination; the other portion was placed in an envelope and heated in an oven at 105 °C for 15 min, after which the temperature was set to 80 °C until the leaves were completely dry. Subsequent measurement of relevant indices was completed in Gansu Agricultural University. Table 3 lists each of the indices analyzed, along with abbreviations used in the tables and figures and the units in which they are expressed.

2.3. Determination of Antioxidant Indices

2.3.1. Vitamin C

Fresh samples were weighed (0.5 g), and 1.5 mL 2% oxalic acid was added for grinding. Then, 0.5 mL 30% zinc sulfate and 0.5 mL 15% potassium ferrocyanide were added, and the samples were stained with 2,6-dichlorophenolate to determine VC content [26].

2.3.2. Polyphenol

First, lyophilized samples were weighed (0.2 g) and homogeneously extracted for 10 h in 10 mL 50% methanol. The sample volume was increased with 50% methanol to 25 mL, after which the Folin phenol reagent was added, and the sample was shaken, placed in a 50 °C constant temperature water bath for 30 min protected from light, and subjected to UV–Vis measurement at 760 nm to determine the polyphenol content [27].

2.3.3. Flavonoids

Lyophilized samples were weighed (0.2 g), and 10 mL 50% methanol was added for homogenized extraction for 10 h. Next, 25 mL 50% methanol and 0.5 mL NaNO2 were added, and the sample was reacted for 5 min. Then, 0.5 mL 10% Al (NO3) 3 was added, and 2 mL 4% NaOH was added 6 min later. After 10 min, the flavonoid content was determined by UV–Vis measurement at 510 nm [27].

2.3.4. Glucosinolates

Fresh samples were accurately weighed (0.1 g), placed in a 10 mL test tube set in a boiling water bath for 10 min, then, after adding 8 mL boiling distilled water, set in the boiling water bath for a further 10 min. The volume of water was brought to 10 mL after cooling to room temperature, and the sample was filtered. Then, 2 mL of the filtrate was taken into a 10 mL cuvette tube; 4 mL of 0.15% sodium carboxymethyl cellulose was added; and 2 mL of 8 mmol/L palladium chloride color development solution was added after shaking at 22 ± 3 °C for 2 h, and the glucosinolate content was measured at 540 nm [28].

2.4. Determination of Quality Indices

2.4.1. Soluble Sugars

Fresh samples were weighed (0.2 g) and placed in a 20 mL test tube. Then, 10 mL distilled water was added, and extraction was performed with heating in a boiling water bath for 30 min. After a two-time extraction, the extract was filtered into a 25 mL volumetric flask to volume, and the filtered liquid was used to determine the soluble sugar content using the anthrone method [29].

2.4.2. Soluble Proteins

The Coomassie Brilliant Blue method was used to determine soluble protein [30]. Fresh samples were weighed (0.5 g) and quickly ground to a homogenate in 5 mL ultrapure water. This was poured into a centrifuge tube and centrifuged at 10,000 rpm for 10 min. Finally, 1 mL of the supernatant was aspirated, poured into a test tube, and 5 mL of Coomassie Brilliant Blue G-250 solution was added. The sample was mixed well and subjected to colorimetric analysis at 595 nm after standing for 2 min.

2.4.3. Nitrates

The nitrate content was measured using the salicylic acid method [31]. First, fresh samples were weighed (3.0 g) and placed in a test tube, followed by the addition of 10 mL distilled water. Then, the tube was placed in a boiling water for 30 min, and the extract was filtered into a 25 mL volumetric flask to volume. Then, 0.1 mL of the filtered supernatant was pipetted into a test tube; 0.4 mL of 5% salicylic acid sulfuric acid solution was added; and the sample was left at room temperature for 20 min after thorough mixing. Then, 9.5 mL of 8% NaOH solution was added slowly, and, after cooling to room temperature, the absorbance value at 410 nm was measured.

2.5. Determination of Mineral Elements

Dry samples were weighed (0.5 g) and transferred to a 100 mL conical flask, after which 10 mL H2SO4 was added carefully. Then, the conical flask was shaken gently to let the sample react with H2SO4. After the reaction was completed, the mixture was placed on a 300 °C hot plate, and 20 mL H2O2 was added slowly over time to the conical flask. After the liquid was processed, it was used to determine the contents of K, Ca, Mg, Cu, Fe, Zn, and Mn using an atomic flame absorption spectrophotometer (ZEEnit 700p, Jena, Germany), while the content of the non-metallic element P was determined using an antimony molybdenum resistance colorimetric method (double-beam UV–Vis spectrophotometer TU-1990) [32].

2.6. Data Analysis

Data analysis was performed using Microsoft Excel 2010 to calculate the mean (Mean) and coefficient of variation (CV) for each component. IBM SPSS Statistics version 26.0 (IBM Corp., Armonk, NY, USA) was used to perform a one-way ANOVA test (assuming an equal variance of LSD and a Duncan significance level of p ≤ 0.05), and standard errors (SE) were calculated [33]. Principal component analysis (PCA), correlation analysis, and cluster analysis (heatmaps with dendrograms) were performed and visualized using Origin 2022b (Originlab Corporation, Northampton, MA, USA) [24].

3. Results

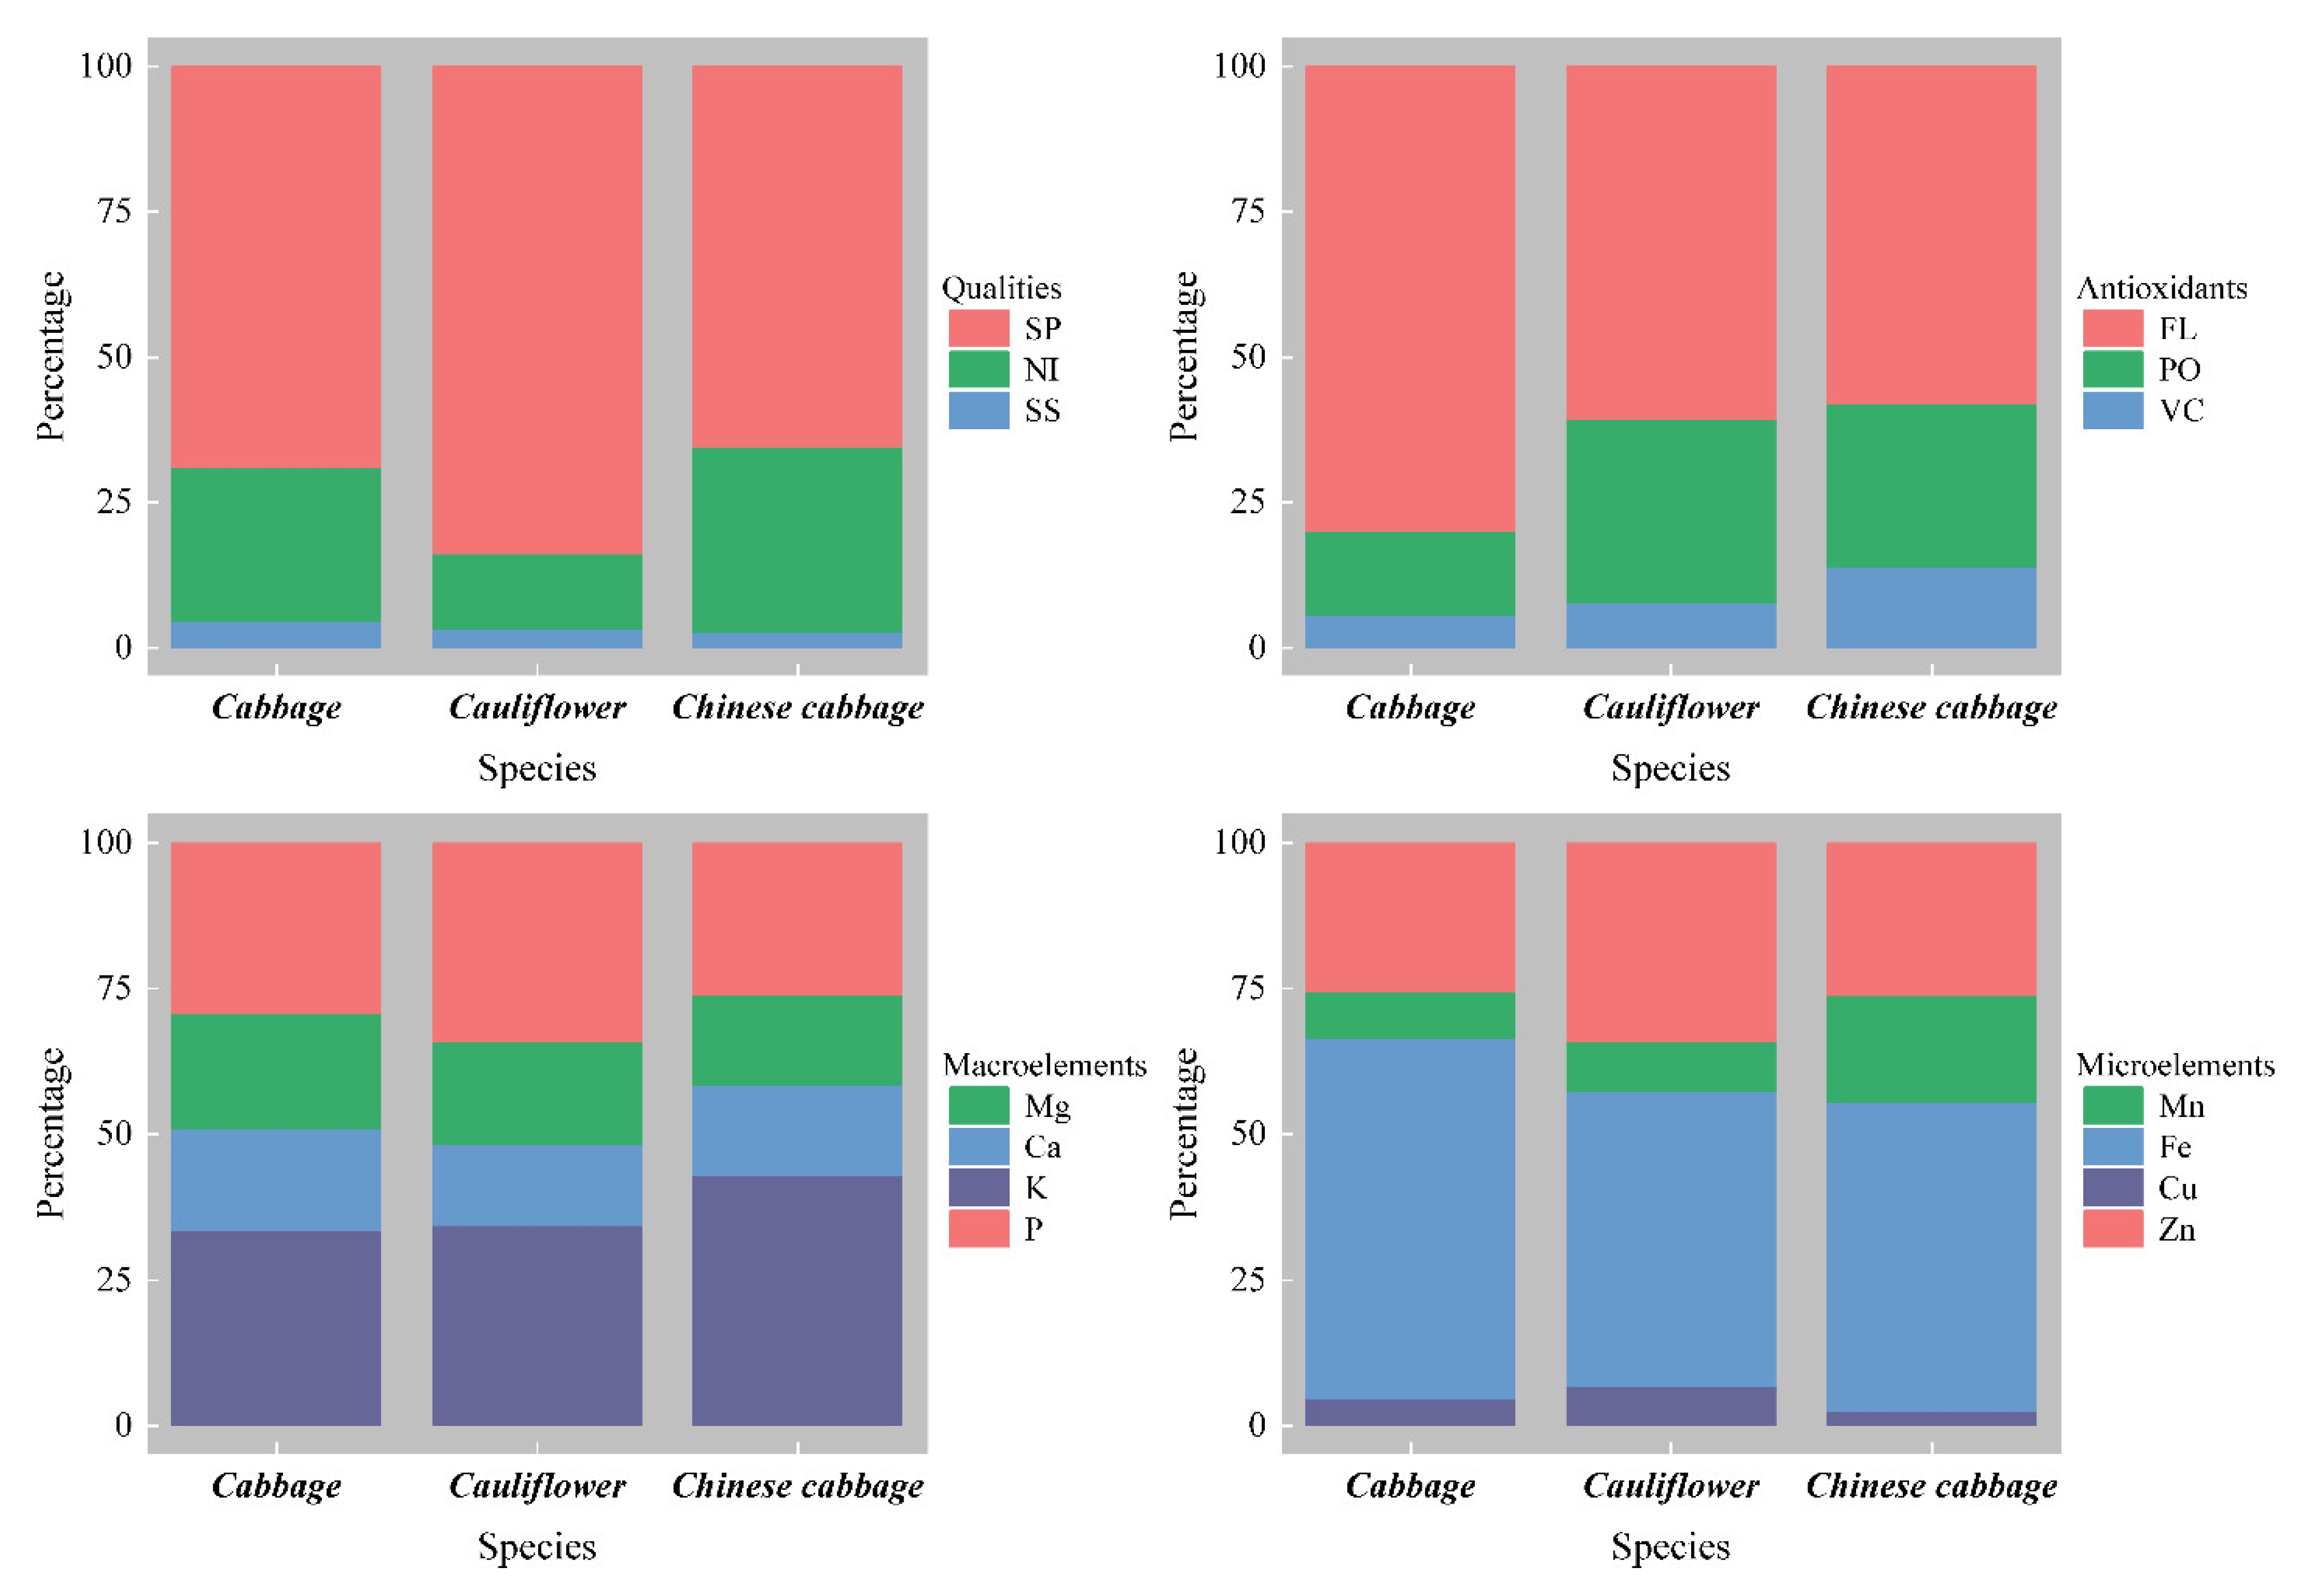
3.1. Differences among Species for Leaf Ball and Curd Composition Profile

The ANOVA results show that all evaluated components are significantly different for the three species (Table 4, Table 5 and Table 6). In terms of nutritional quality (Table 4), soluble sugars are most abundant in cabbage. The contents of soluble proteins and nitrates are the highest and lowest in cauliflower, respectively. The soluble protein content of cauliflower is 1.41-fold that of the other two species, while its nitrate content is 0.45-fold and 0.57-fold that of Chinese cabbage and cabbage, respectively. As shown in Figure 1, the soluble protein percentage is over 65% for all three species and reaches 84% in cauliflower, while the soluble sugar contents are all very low at ~3%.
In terms of antioxidants (Table 5), Chinese cabbage has the highest VC content. The flavonoid content is highest in cabbage, being 1.99-fold and 3.16-fold that in cauliflower and Chinese cabbage, respectively. As shown in Figure 1, the flavonoid content is more than 55% for all three species and reaches 80% in cabbage. In addition, the contents of polyphenols and glucosinolates are both highest in cauliflower at ~1.5-fold those in cabbage and Chinese cabbage.
Regarding the contents of different mineral elements (Table 6), it was found that the contents of macro-elements (K, Ca, Mg, and P) and trace elements (Mn and Zn) are highest in Chinese cabbage. K and P are more than 25% abundant in all three species (Figure 1), while Cu and Fe show the highest contents in cauliflower and cabbage, respectively. The percentages for Fe in cabbage, cauliflower, and Chinese cabbage are all higher than 50% (Figure 1), followed by those of Zn, which are all higher than 25%.

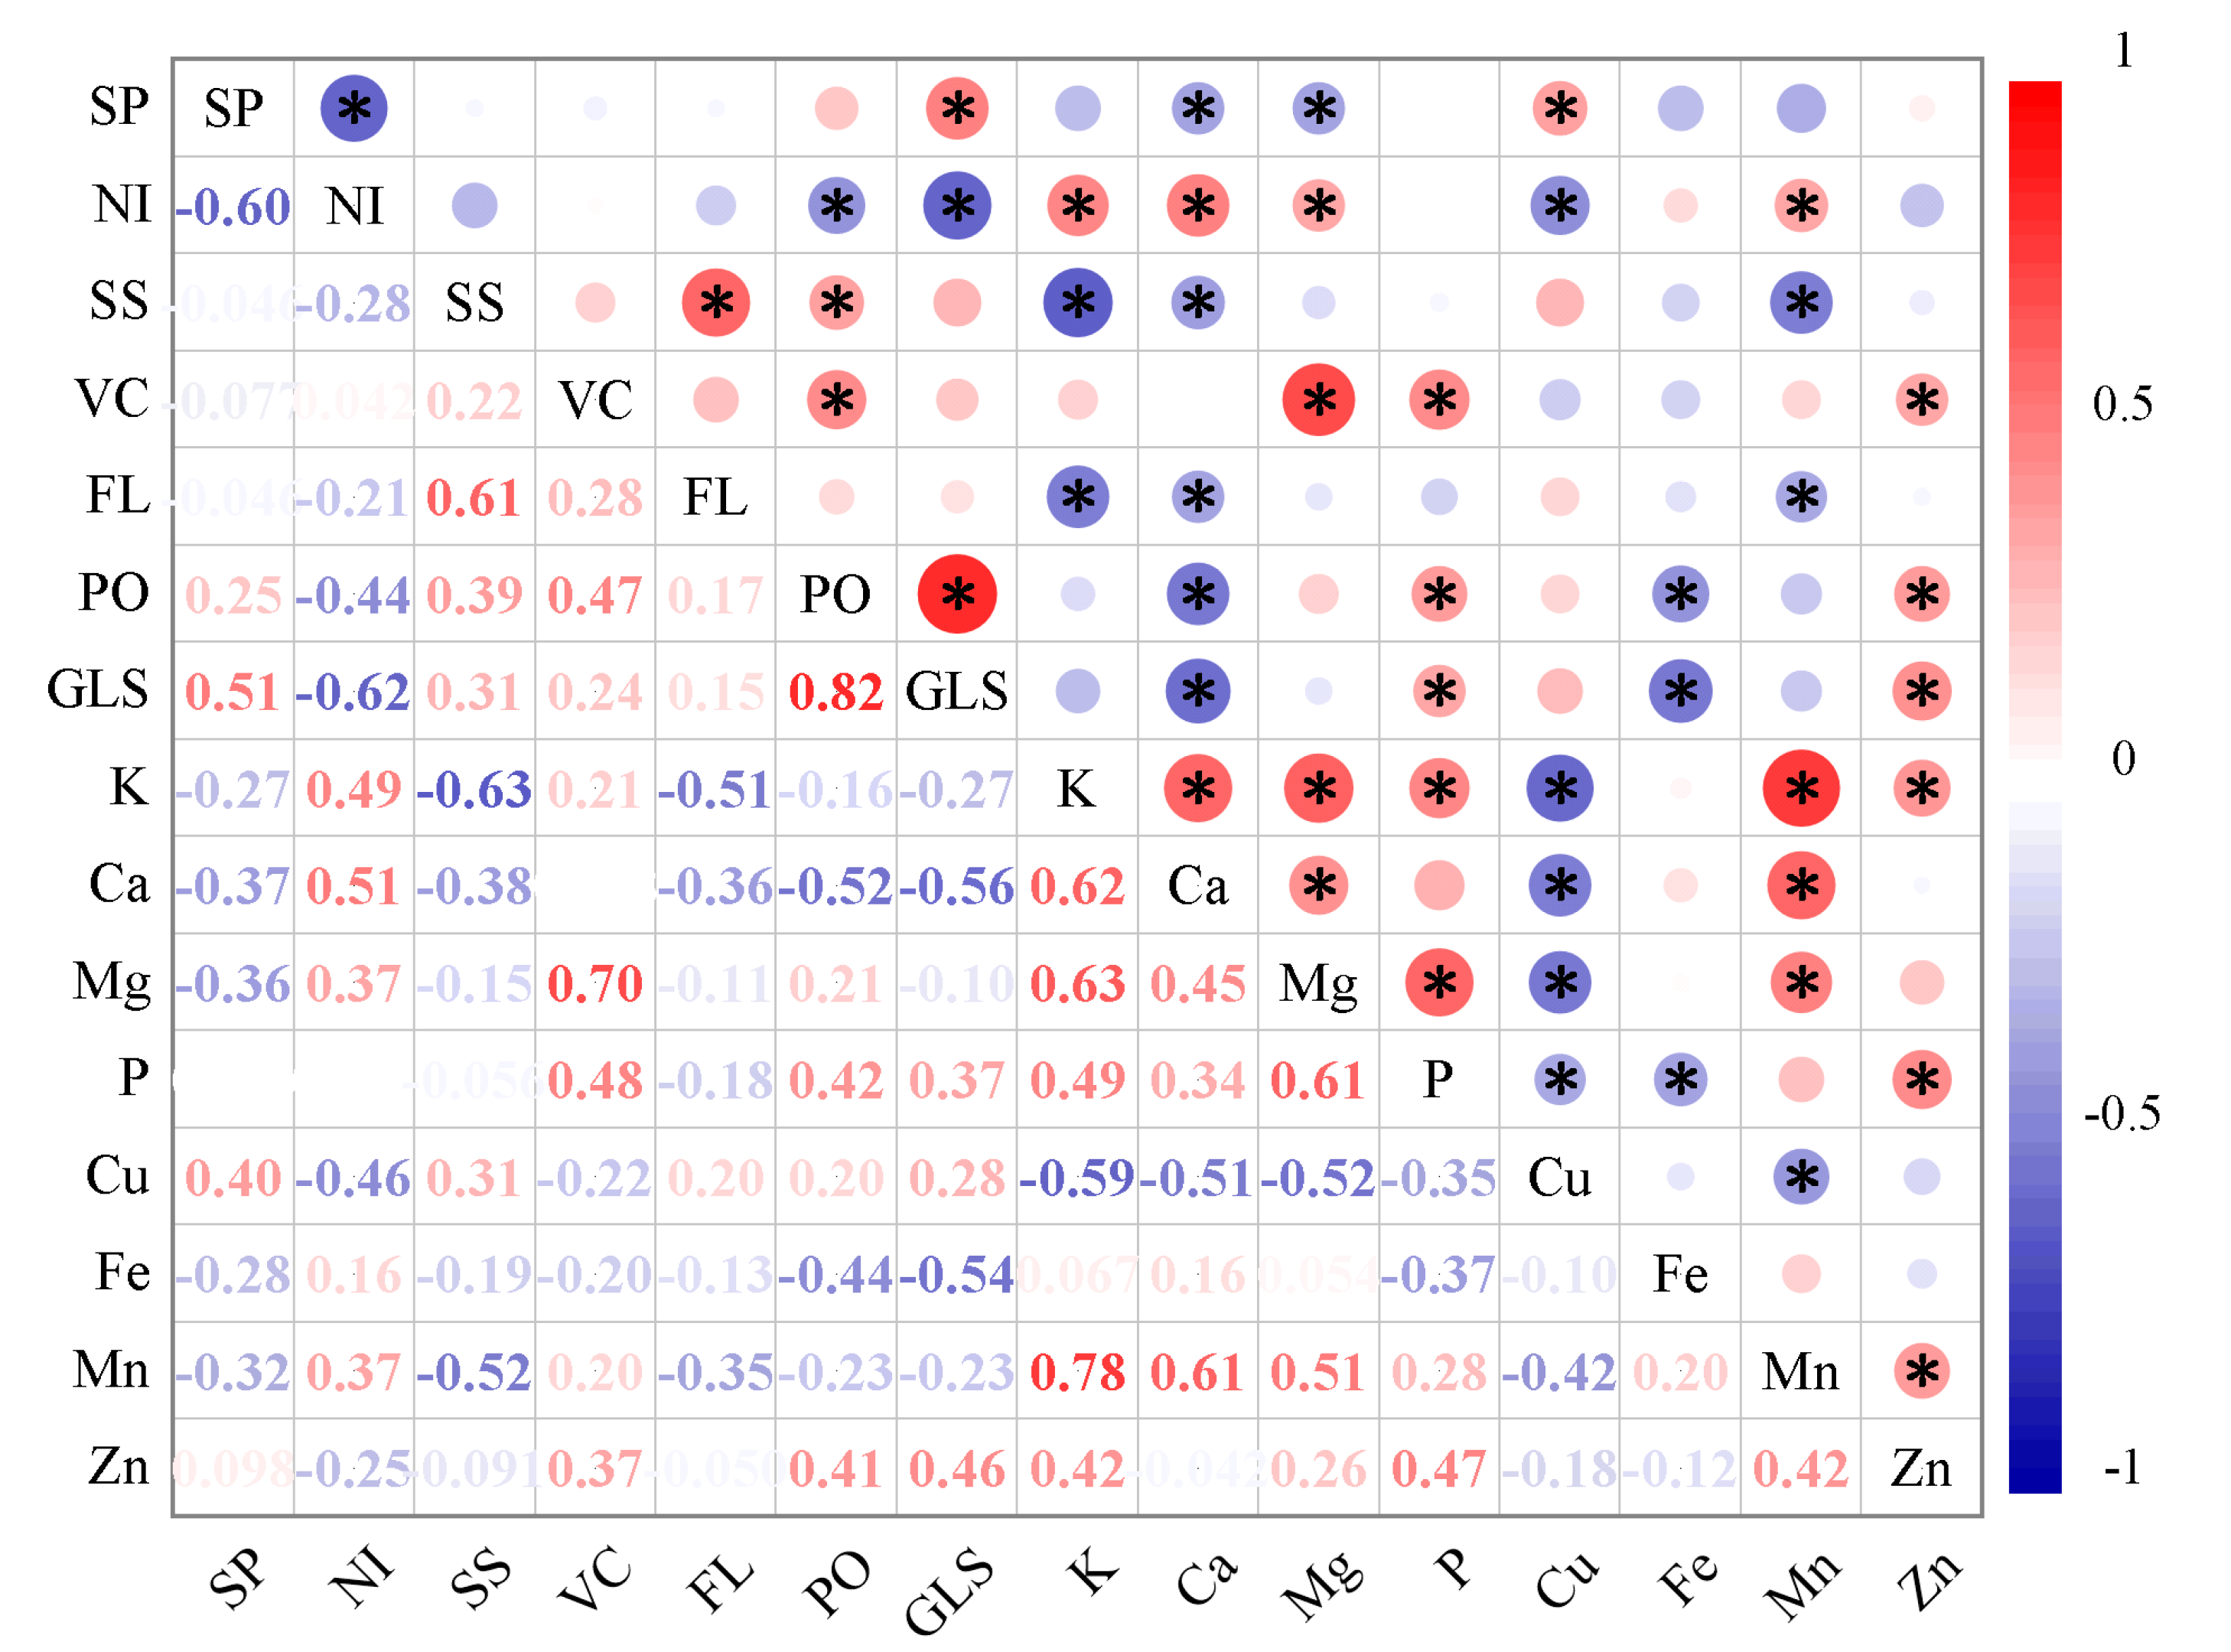
3.2. Correlation Analysis
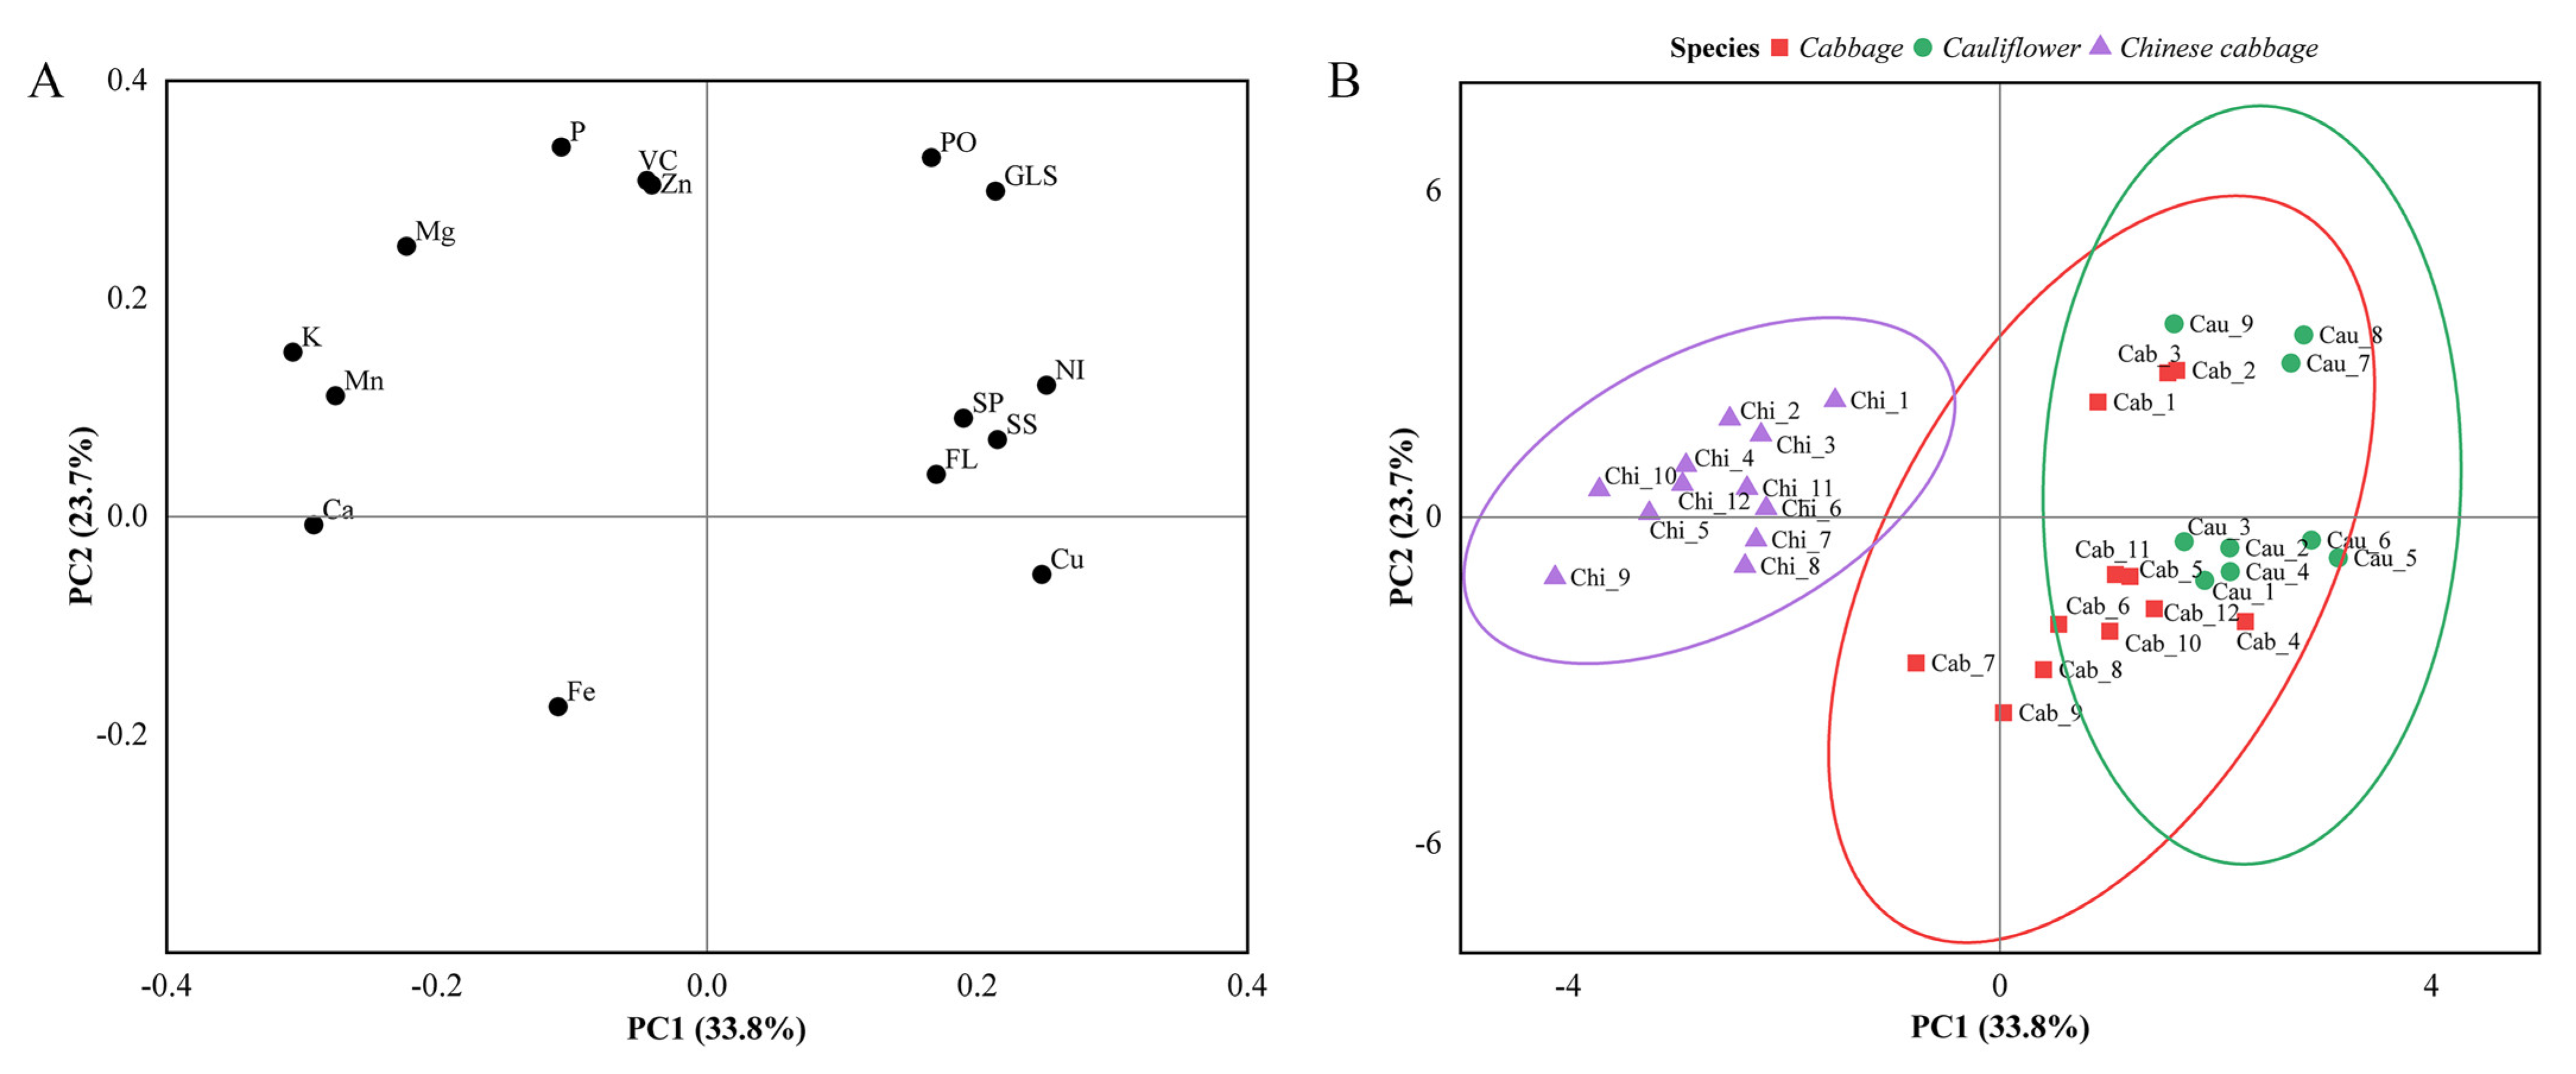
The correlation heatmap (Figure 2) shows the relationships among cabbage, cauliflower, and Chinese cabbage regarding quality, antioxidant properties, and minerals. The correlation coefficient represents the strength of the correlation between the two, and we considered strong correlation by setting the threshold to 0.5. We found that soluble sugars and soluble proteins are strongly positively correlated with flavonoids and glucosinolates, respectively. Mg has a strong positive correlation with VC, whereas nitrates are strongly negatively correlated with glucosinolate content. In addition, both K and Mn are strongly negatively correlated with soluble sugars. K and Ca exhibit strongly negative correlations with flavonoids and polyphenols, respectively. Both Fe and Ca are strongly negatively correlated with glucosinolate.

3.3. PCA

The first two principal components of the PCA explain 57.5% of the observed variance contribution, with principal component 1 (PC1) and principal component 2 (PC2) accounting for 33.8% and 23.7% of the total variance, respectively (Figure 3A,B). Soluble sugars, soluble proteins, nitrates, glucosinolates, polyphenols, flavonoids, and Cu are positively correlated with PC1 and have loading values greater than 0.2, indicating that these substances are major components of PC1. Soluble sugars, soluble proteins, nitrates, VC, polyphenols, flavonoids, glucosinolates, K, P, Zn, Mn, and Mg are positively correlated with PC2, with VC, polyphenols glucosinolates, Mg, P, and Zn loading values greater than 0.2, indicating that these substances can be used as the primary basis for evaluating PC2. However, K, Mn, and Ca are negatively correlated with PC1. In addition, Fe and PC2 are negatively correlated.
PCA clearly separates the 33 varieties evaluated into three groups that match the corresponding species (Figure 3B). Most of the cabbage and cauliflower varieties are plotted in the lower right quadrant of the score plot, with positive values for PC1 and negative values for PC2, while a small proportion of the cabbage and cauliflower varieties are clustered in the upper right quadrant, corresponding to positive values for PC1 and PC2. Most of the Chinese cabbage varieties are distributed in the upper left quadrant of the score plot, with negative values for PC1 and positive values for PC2, while a few varieties are plotted in the lower left quadrant, with negative values for both PC1 and PC2. The cabbage varieties are more widely distributed and occupy three quadrants, while the cauliflower and Chinese cabbage varieties are more narrowly distributed, indicating that the variability of cabbage is higher than that of cauliflower and Chinese cabbage. Cabbage overlaps with the confidence ellipses of cauliflower and Chinese cabbage to various degrees, but with cauliflower to a greater extent and with Chinese cabbage to a lesser extent. This shows that the compositional characteristics of some cabbage varieties are more similar to those of cauliflower.

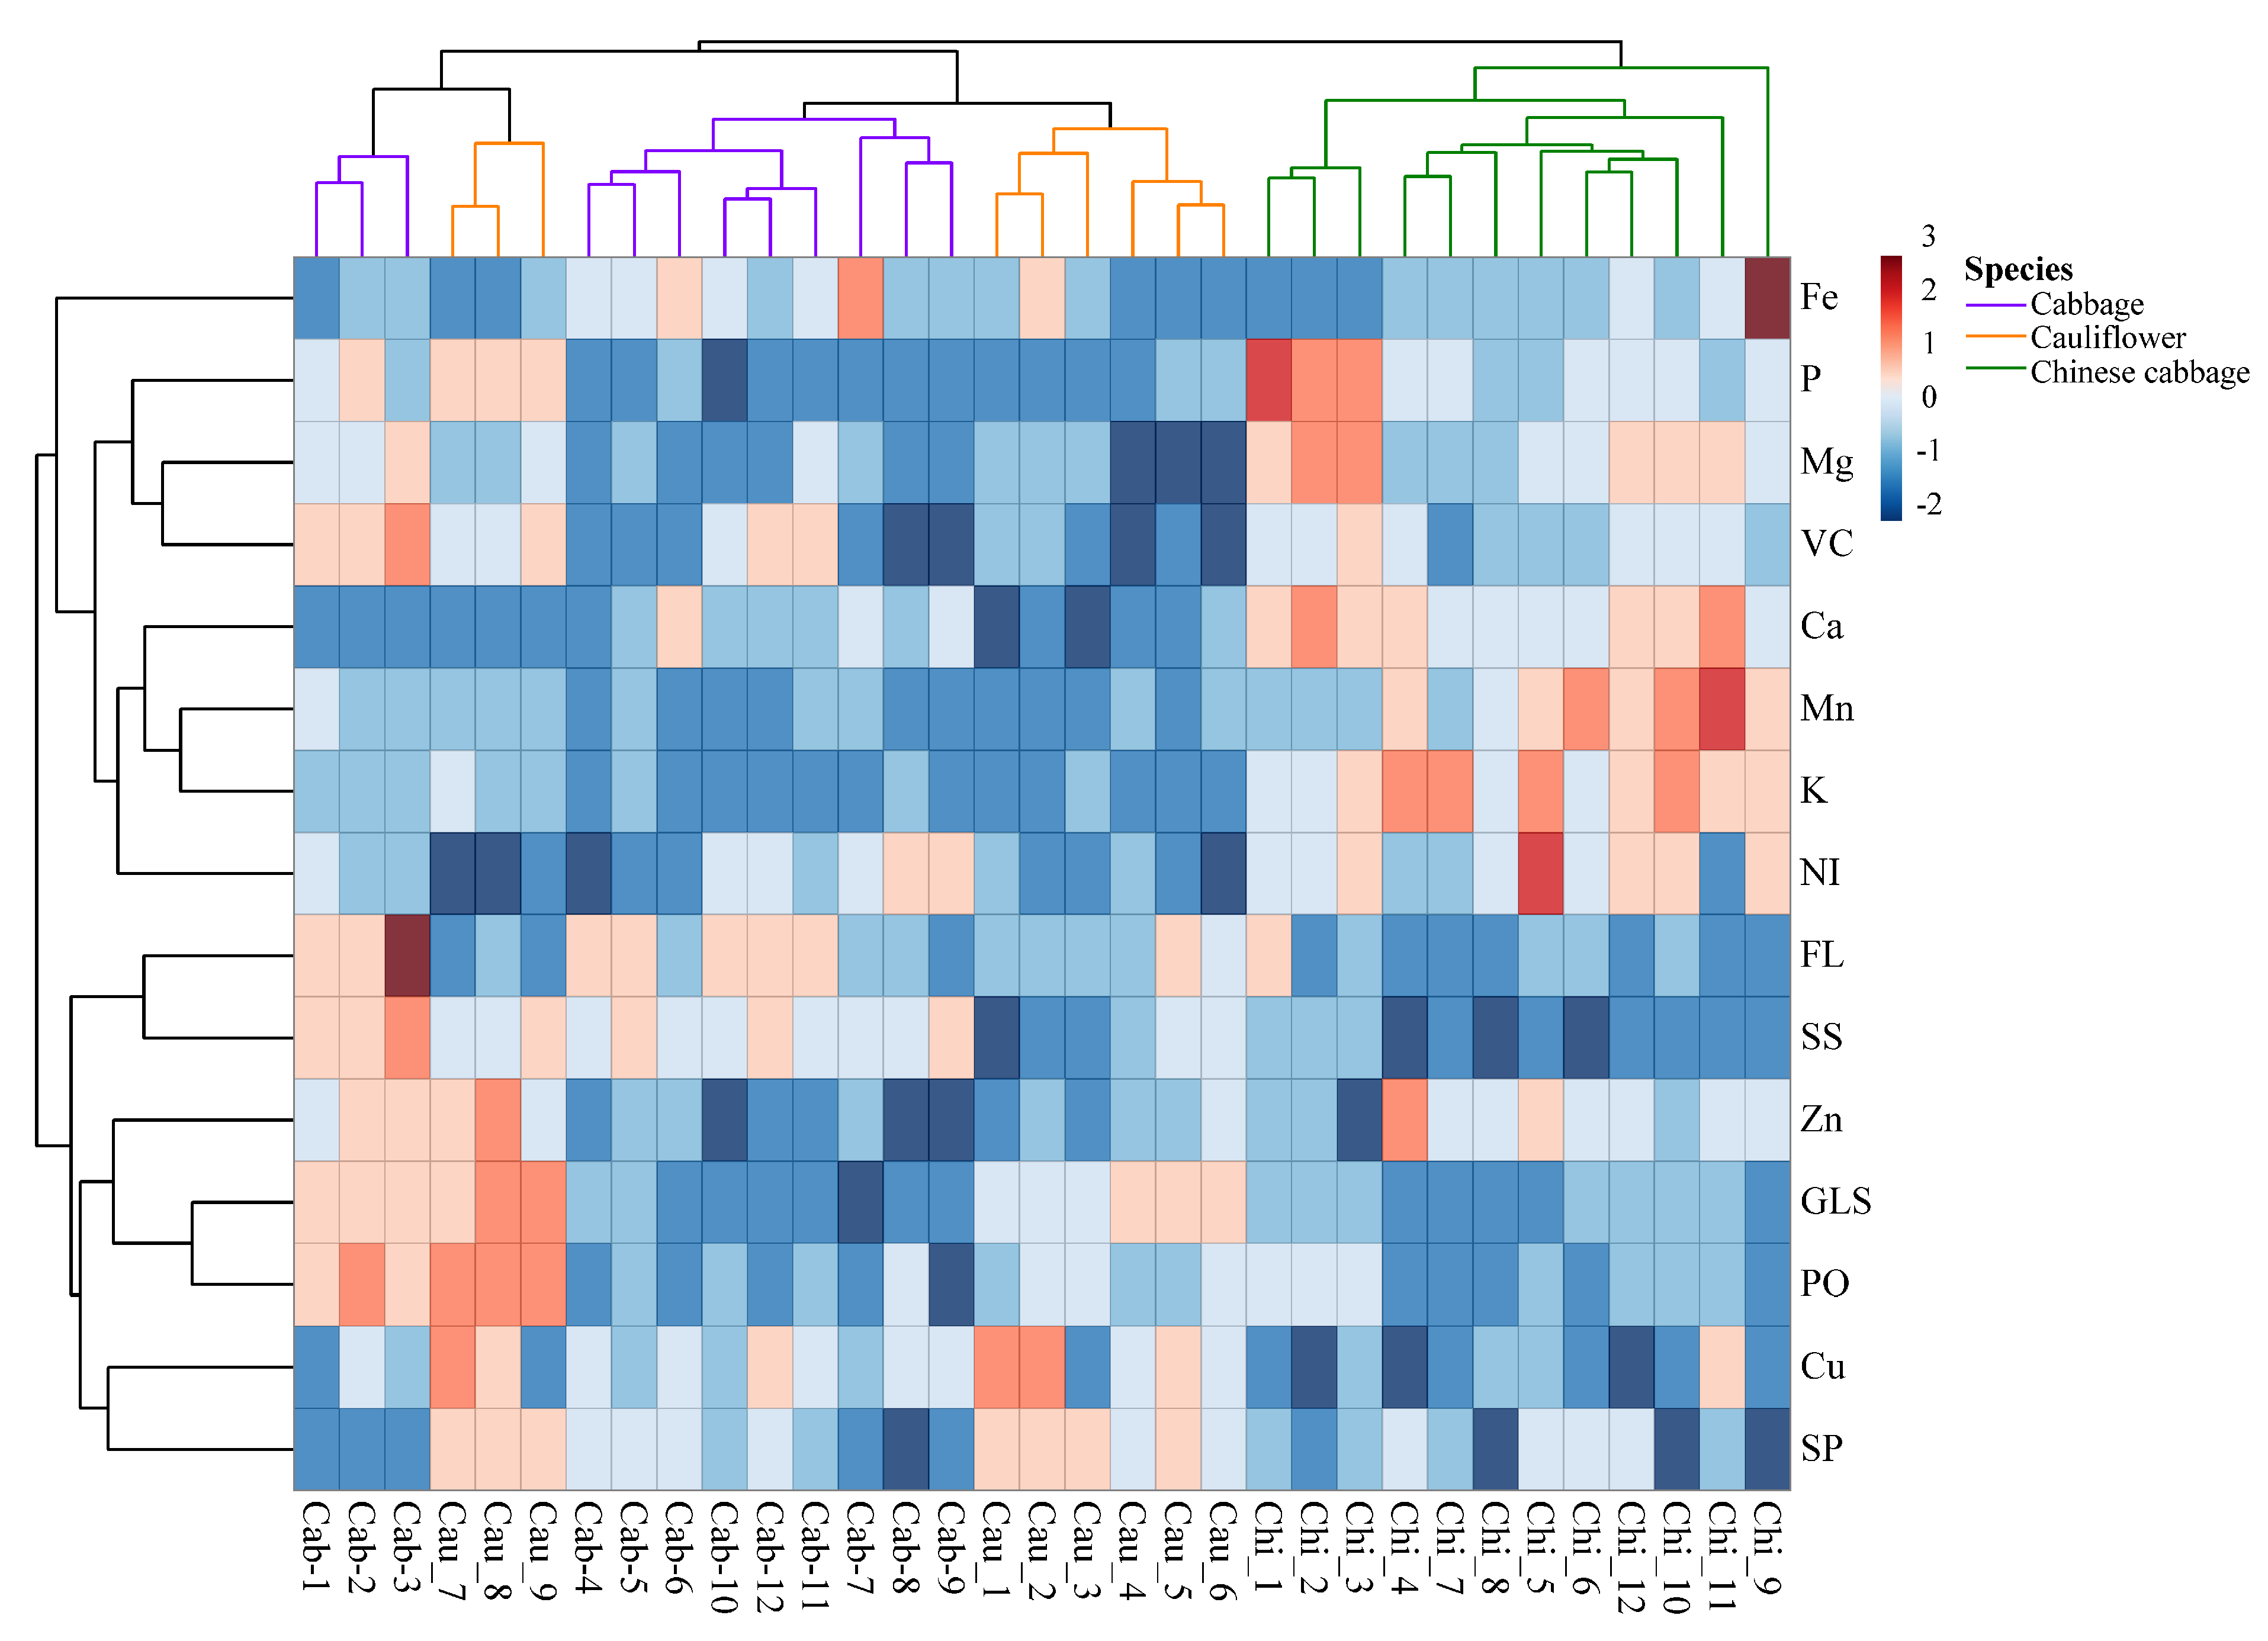
3.4. Cluster Analysis

The multivariate clustering heatmap in Figure 4 shows three main clusters for these varieties, in which the clusters for cabbage and cauliflower are more chaotic, and individual cultivars do not cluster into counterpart species, indicating that there are fewer differences in compositional characteristics between cabbage and cauliflower. In addition, the cluster analysis classified the observed parameters into two main categories. The upper cluster groups together minerals (except Cu and Zn), VC, and nitrate. The lower cluster is composed of polyphenols, flavonoids, sulfatide, soluble sugars, soluble proteins, Cu, and Zn. Among the diversities of each species, the Chinese cabbage variety Chi-9 has the highest average Fe content, while its soluble protein content is the lowest. In addition, the highest flavonoid content is observed for the cabbage cultivar Cab-3.

4. Discussion

Cruciferous vegetables have attracted much attention in recent years due to their potential therapeutic properties [34]. Some phytoconstituents in vegetables play important roles in quality and nutritional value. Studies have shown that nutrients related to plant health, such as soluble sugars, soluble protein, nitrate, and minerals, are also closely related to human dietary health, and their levels are important reference indicators for people to make informed health choices [35]. Leafy vegetables have been reported to be one of the major sources of nitrates, but excessive intake of nitrate is harmful to human health, so it is necessary to understand the nitrate contents of foods and adopt the recommended dietary patterns [36]. In this study, significant differences in the nutritional contents of different species were detected, and the nutritional value of cauliflower was better than that of Chinese cabbage and cabbage, having only had higher soluble protein content than that of Chinese cabbage and cabbage but also a lower nitrate content than that of Chinese cabbage and cabbage. It has been reported that the effect of variety in cauliflower has overwhelmed other quality determinants in terms of antioxidant capacity and nitrate accumulation [37].
Studies have shown that long-term or regular consumption of vegetables rich in secondary metabolites, such as flavonoids, polyphenols, vitamins, carotenoids, minerals, glucosinolates, and anthocyanins, can help prevent the occurrence of some chronic diseases, such as cancer and cardiovascular conditions [38,39]. The main compounds that contribute to the antioxidant activity of the crop itself and in humans vary considerably among the three species. This is due to the contents of antioxidant substances as associated with species and variety. Radish sprouts have a higher polyphenol content and antioxidant activity compared to broccoli and kale [40]. Because plants have different genetic backgrounds, they show differences in health-promoting properties [41]. Compared to cabbage and cauliflower, Chinese cabbage is rich in VC, and the selection of Chinese cabbage varieties high in VC means that it not only promotes consumer health, but it also has superior sensory qualities. Cauliflower has been shown to be rich in total polyphenols and glucosinolates, which is consistent with our findings [42,43]. Studies have shown that the antioxidant activity of cauliflower is linearly related to polyphenol content, and the glucosinolates it contains also exhibit high antioxidant capacities [44,45]. The results of this study show that the contents of polyphenols and glucosinolates in cauliflower are significantly higher than those in Chinese cabbage and cabbage.
Vegetables are considered the most economical and sustainable dietary source of micronutrients, such as vitamins and minerals [46]. Studies have shown that the human body requires multiple mineral elements, which are essential for maintaining physiological activity and metabolism in bone, blood, and tissues [47]. Our study found that eight mineral elements, i.e., K, Ca, Mg, P, Cu, Fe, Mn, and Zn, are significantly differentially abundant in Chinese cabbage, cauliflower, and cabbage, and minerals are extremely abundant in Chinese cabbage. There are differences in the dynamic uptake of elements in the soil by different vegetables and crops [48]. Interestingly, we also found that the K contents of all the Chinese cabbage varieties tested are significantly higher than those in all the varieties of cabbage and cauliflower. This is due to the different adaptation of different species to their environments during growth [49,50].
Using correlation analysis, we found that there are some intrinsic correlations among the components, and the differences in the correlation degrees are obvious. Studies have shown that plants have evolved complex sensing and response mechanisms in response to changes in the availability of mineral nutrients, enabling the monitoring of various nutrient concentrations [51]. Li et al. conducted an analysis of VC, reducing sugar, crude fiber, and protein contents in 41 Chinese cabbage varieties and found a positive relationship between VC content and reducing sugar content, while other nutrients did not show a correlation [52]. In the determination of cabbage quality, if a parent with high levels of soluble solids is selected for composition, a cabbage variety with high VC may be obtained [53]. However, among the antioxidants in cauliflower, total phenols are more related to antioxidant activity than VC and total flavonoids, indicating that although they all influence antioxidant activity, the degree varies [54].
Principal component and cluster analyses were performed for each species and variety, and we found that the intensity of variation was higher in cabbage than in cauliflower and Chinese cabbage, and significant differences were also observed among different varieties within the same species. Huang et al. speculated that the nutritional quality differed significantly between different types of cauliflower varieties and that the nutritional quality of colored cauliflower was higher than that of white cauliflower, with purple cauliflower having the highest quality [55]. Accordingly, consumers considering their daily diets should construct meals with proper pairings according to the dominant nutrients of each species, and the soluble sugars, flavonoids, VC, Fe, and K contained in cabbage and Chinese cabbage should be used to make up for the deficiency of cauliflower in these aspects.
In summary, it is essential for consumers and producers aiming to increase dietary nutrient intake to have clear information on micro- and macronutrient contents in Chinese cabbage, cabbage, and cauliflower.

5. Conclusions

The comprehensive study of edible organ components conducted in this paper provides insights into the accumulation of substances in cabbage, cauliflower, and Chinese cabbage grown under the same cultivation conditions. The results indicate the existence of quality diversity within and among the three species. Based on our results, it was determined that combined and integrated consumption patterns of cabbage, Chinese cabbage, and cauliflower would be favorable for a balanced diet because of their complementary nutritional values and functional properties. In this way, it was determined that cauliflower is superior to cabbage and Chinese cabbage in terms of nutritional value and antioxidant activity, as it has significantly higher soluble protein, polyphenol, and glucosinolate contents than those of the other two species and the lowest nitrate content. Cabbage is an ideal source of soluble sugars, flavonoids, and Fe. In addition, Chinese cabbage is an excellent source of VC and minerals. There is an intrinsic correlation between the contents of the components. Cabbage shows higher variability than the other two species, and some varieties are more similar to cauliflower in terms of compositional characteristics.

Author Contributions

Z.L. (Zeci Liu) and J.Y. designed the research; J.W., J.D., Z.L. (Zhaozhuang Li) and B.Z. determined the relevant indices in the manuscript; J.L. and Z.T. performed the data analysis; J.W. wrote the manuscript; N.J. and L.J. revised the manuscript. All authors have read and agreed to the published version of the manuscript.

Funding

This work was supported by grants from the Education Science and Technology Innovation Project of Gansu Province (GSSYLXM-02); the Gansu Top Leading Talent Plan (GSBJLJ-2021-14); Modern Silk Road Cold and Arid Agriculture Science and Technology Support Project (GSLK-2021-6); and the Central Government Guides Local Special Projects for Science and Technology Development (ZCYD-2021-6).

Data Availability Statement

Not applicable.

Conflicts of Interest

The authors declare no conflict of interest.

References

  1. Agaguenduez, D.; Sahin, T.O.; Yilmaz, B.; Ekenci, K.D.; Oezer, S.D.; Capasso, R. Cruciferous Vegetables and Their Bioactive Metabolites: From Prevention to Novel Therapies of Colorectal Cancer. Evid. Based Complement. Altern. Med. 2022, 2022, 1534083. [Google Scholar] [CrossRef]
  2. Mitra, S.; Emran, T.B.; Chandran, D.; Zidan, B.; Das, R.; Mamada, S.S.S.; Masyita, A.; Salampe, M.; Nainu, F.; Khandaker, M.U.; et al. Cruciferous vegetables as a treasure of functional foods bioactive compounds: Targeting p53 family in gastrointestinal tract and associated cancers. Front. Nutr. 2022, 9, 951935. [Google Scholar] [CrossRef] [PubMed]
  3. Gu, Y.; Becker, V.; Qiu, M.Q.; Tang, T.C.; Ampofo, E.; Menger, M.D.; Laschke, M.W. Brassinin Promotes the Degradation of Tie2 and FGFR1 in Endothelial Cells and Inhibits Triple-Negative Breast Cancer Angiogenesis. Cancers 2022, 14, 3540. [Google Scholar] [CrossRef] [PubMed]
  4. Kjeldsen, G. Cultivars of Chinese cabbage for storage. Grøn Viden Havebrug 1990. [Google Scholar]
  5. Rokayya, S.; Li, C.J.; Yan, Z.; Li, Y.; Sun, C.H. Cabbage (Brassica oleracea L. var. capitata) phytochemicals with antioxidant and anti-inflammatory potential. Asian Pac. J. Cancer Prev. 2013, 14, 6657–6662. [Google Scholar] [CrossRef] [Green Version]
  6. Suido, H.; Tanaka, T.; Tabei, T.; Takeuchi, A.; Okita, M.; Kishimoto, T.; Kasayama, S.; Higashino, K. A mixed green vegetable and fruit beverage decreased the serum level of low-density lipoprotein cholesterol in hypercholesterolemic patients. J. Agric. Food Chem. 2002, 50, 3346–3350. [Google Scholar] [CrossRef]
  7. Nilsson, J.; Olsson, K.; Engqvist, G.; Ekvall, J.; Nyman, M.; Akesson, B. Variation in the content of glucosinolates, hydroxycinnamic acids, carotenoids, total antioxidant capacity and low-molecular-weight carbohydrates in Brassica vegetables. J. Sci. Food Agric. 2006, 86, 528–538. [Google Scholar] [CrossRef]
  8. Kusznierewicz, B.; Bartoszek, A.; Wolska, L.; Drzewiecki, J.; Gorinstein, S.; Namieśnik, J. Partial characterization of white cabbages (Brassica oleracea var. capitata f. alba) from different regions by glucosinolates, bioactive compounds, total antioxidant activities and proteins. LWT Food Sci. Technol. 2008, 41, 1–9. [Google Scholar] [CrossRef]
  9. Zanfini, A.; Corbini, G.; La Rosa, C.; Dreassi, E. Antioxidant activity of tomato lipophilic extracts and interactions between carotenoids and a-tocopherol in synthetic mixtures. Food Sci. Technol. 2010, 43, 67–72. [Google Scholar] [CrossRef]
  10. Samec, D.; Piljac-Zagarac, J.; Bogovic, M.; Habjanic, K.; Gruz, J. Antioxidant potency of white (Brassica oleracea L. var. capitata) and Chinese (Brassica rapa L. var. pekinensis (Lour.) cabbage: The influence of development stage, cultivar choice and seed selection. Sci. Hortic. 2011, 128, 78–83. [Google Scholar] [CrossRef]
  11. Wennberg, M.; Ekvall, J.; Olsson, K.; Nyman, M. Changes in carbohydrate and glucosinolate composition in white cabbage (Brassica oleracea var. capitata) during blanching and treatment with acetic acid. Food Chem. 2006, 95, 226–236. [Google Scholar] [CrossRef]
  12. Wang, H.; Guo, X.; Hu, X.; Li, T.; Fu, X.; Liu, R. Comparison of phytochemical profiles, antioxidant and cellular antioxidant activities of different varieties of blueberry (Vaccinium spp.). Food Chem. 2017, 217, 773–781. [Google Scholar] [CrossRef] [PubMed]
  13. Krisetherton, P.M. Bioactive components in foods: Their role in the prevention of cardiovascular disease and cancer. Am. J. Med. 2002, 113, 71–78. [Google Scholar] [CrossRef] [PubMed]
  14. Jagdish, S.; Rai, M.; Upadhyay, A.K.; Bahadur, A.; Singh, K.P. Antioxidant phytochemicals in broccoli (Brassica oleracea L. var. italica Plenck) cultivars. J. Food Sci. Technol. Mysore 2006, 43, 391–393. [Google Scholar]
  15. Bongoni, R.; Verkerk, R.; Steenbekkers, B.; Dekker, M.; Stieger, M. Evaluation of different cooking conditions on broccoli (Brassica oleracea var. italica) to improve the nutritional value and consumer acceptance. Plant Foods Hum. Nutr. 2014, 69, 228–234. [Google Scholar] [CrossRef]
  16. Novotny, C.; Schulzova, V.; Krmela, A.; Hajslova, J.; Svobodova, K.; Koudela, M. Ascorbic acid and glucosinolate levels in new Czech cabbage cultivars: Effect of production system and fungal infection. Molecules 2018, 23, 1855. [Google Scholar] [CrossRef] [PubMed] [Green Version]
  17. West, L.G.; Meyer, K.A.; Balch, B.A.; Rossi, F.J.; Schultz, M.R.; Haas, G.W.J. Glucoraphanin and 4-hydroxyglucobrassicin contents in seeds of 59 cultivars of Broccoli, raab, kohlrabi, radish, cauliflower, brussels sprouts, kale, and cabbage. Agric. Food Chem. 2004, 52, 916–926. [Google Scholar] [CrossRef]
  18. Bennett, R.N.; Mellon, F.A.; Kroon, P.A. Screening crucifer seeds as sources of specific intact glucosinolates using ion-pair high-performance liquid chromatography negative ion electrospray mass spectrometry. J. Agric. Food Chem. 2004, 52, 428–438. [Google Scholar] [CrossRef]
  19. Charron, C.S.; Saxton, A.M.; Sams, C.E. Relationship of climate and genotype to seasonal variation in the glucosinolate–myrosinase system. II. Myrosinase activity in ten cultivars of Brassica oleracea grown in fall and spring seasons. J. Sci. Food Agric. 2010, 85, 671–681. [Google Scholar] [CrossRef]
  20. Hart, D.J.; Scott, K.J. Development and evaluation of an HPLC method for the analysis of carotenoids in foods, and the measurement of the carotenoid content of vegetables and fruits commonly consumed in the UK. Food Chem. 1995, 54, 101–111. [Google Scholar] [CrossRef]
  21. Ríos, P.; Obregón, S.; de Haro, A.; Fernández-Rebollo, P.; Serrano, M.S.; Sánchez, M.E. Effect of Brassica biofumigant amendments on different stages of the life cycle of phytophthora cinnamomi. J. Phytopathol. 2016, 164, 582–594. [Google Scholar] [CrossRef]
  22. Moreb, N.; Murphy, A.; Jaiswal, S.; Jaiswal, A.K. Cabbage-science direct. In Nutritional Composition and Antioxidant Properties of Fruits and Vegetables; Academic Press: Cambridge, MA, USA, 2020; pp. 33–54. [Google Scholar] [CrossRef]
  23. Xin, C.; Wang, W.; Song, S.; Tang, X.; Zheng, S.; Wei, L.; He, H. Effect of storage and boiling on glucosinolate content of Brassica vegetables. In Proceedings of the Vegetable Production, Quality & Process Standardization in Chain: A Worldwide Perspective, Beijing, China, 14 October 2008. [Google Scholar]
  24. Jin, N.; Jin, L.; Luo, S.L.; Tang, Z.Q.; Liu, Z.C.; Wei, S.H.; Liu, F.H.; Zhao, X.Q.; Yu, J.H.; Zhong, Y. Comprehensive Evaluation of Amino Acids and Polyphenols in 69 Varieties of Green Cabbage (Brassica oleracea L. var. capitata L.) Based on Multivariate Statistical Analysis. Molecules 2021, 26, 5355. [Google Scholar] [CrossRef]
  25. Wei, S.H.; Xiao, X.M.; Wei, L.J.; Li, L.S.; Li, G.C.; Liu, F.H.; Xie, J.M.; Yu, J.H.; Zhong, Y. Development and comprehensive HS-SPME/GC-MS analysis optimization, comparison, and evaluation of different cabbage cultivars (Brassica oleracea L. var. capitata L.) volatile components. Food Chem. 2021, 340, 128166. [Google Scholar] [CrossRef] [PubMed]
  26. Arya, S.P.; Mahajan, M.; Jain, P. Non-spectrophotometric methods for the determination of Vitamin C. Anal. Chim. Acta 2000, 417, 1–14. [Google Scholar] [CrossRef]
  27. Debnath, B.; Hussain, M.; Li, M.; Lu, X.; Sun, Y.; Qiu, D. Exogenous melatonin improves fruit quality features, health promoting antioxidant compounds and yield traits in tomato fruits under acid rain stress. Molecules 2019, 23, 1868. [Google Scholar] [CrossRef] [Green Version]
  28. Xuanxia, L.; Li, Y. Spectrophotometric determination of glucosinolates in rapeseed. Shanxi Agric. Sci. 2002, 6, 5. [Google Scholar]
  29. Wen, C.F.; Dong, A.W.; Li, G.Z.; Shu, L.; Yong, L. Determination of total sugar and reducing sugar in viola philippicassp Munda W. Becker by anthrone colorimetry. Guangzhou Food Sci. Technol. 2005, 21, 122–124. [Google Scholar]
  30. Bradford, M.M. A rapid and sensitive method for the quantitation of microgram quantities of protein utilizing the principle of protein-dye binding. Anal. Biochem. 1976, 72, 248–254. [Google Scholar] [CrossRef] [PubMed]
  31. Cataldo, D.; Maroon, M.; Schrader, L.E.; Youngs, V.L. Rapid colorimetric determination of nitrate in plant-tissue by nitration of salicylic-acid. Commun. Soil Sci. Plant Anal. 1975, 6, 71–80. [Google Scholar] [CrossRef]
  32. Wang, S.; Jin, N.; Jin, L.; Xiao, X.; Hu, L.; Liu, Z.; Wu, Y.; Xie, Y.; Zhu, W.; Lyu, J.; et al. Response of tomato fruit quality depends on period of LED supplementary light. Front. Nutr. 2022, 9, 833723. [Google Scholar] [CrossRef] [PubMed]
  33. Yang, Y.; Yao, Y.D.; Li, J.; Zhang, J.; Zhang, X.D.; Hu, L.X.; Ding, D.X.; Bakpa, E.P.; Xie, J.M. Trehalose Alleviated Salt Stress in Tomato by Regulating ROS Metabolism, Photosynthesis, Osmolyte Synthesis, and Trehalose Metabolic Pathways. Front. Plant Sci. 2022, 13, 772948. [Google Scholar] [CrossRef]
  34. Lam, T.K.; Gallicchio, L.; Lindsley, K.; Shiels, M.; Hammond, E.; Tao, X.; Chen, L.; Robinson, K.A.; Caulfield, L.E.; Herman, J.G.P. Cruciferous vegetable consumption and lung cancer risk: A systematic review. Cancer Epidemiol. Biomark. Prev. 2009, 18, 184–195. [Google Scholar] [CrossRef] [PubMed] [Green Version]
  35. Wenjie, Y.; Xinjun, L.; Yi, Z.; Yang, Q. Effect of cooking methods on the health-promoting compounds, antioxidant activity and nitrate of tatsoi (Brassica rapa L. ssp. narinosa). J. Food Processing Preserv. 2019, 43, e14008. [Google Scholar] [CrossRef]
  36. Hord, N.G. Dietary nitrates, nitrites, and cardiovascular disease. Curr. Atheroscler. Rep. 2011, 13, 484–492. [Google Scholar] [CrossRef]
  37. Maggio, A.; Pascale, S.D.; Paradiso, R.; Barbieri, G. Quality and nutritional value of vegetables from organic and conventional farming. Sci. Hortic. 2013, 164, 532–539. [Google Scholar] [CrossRef]
  38. Shree, B.; Kumar, S.; Sharma, S.; Katoch, V. Functional significance of underutilized high value cruciferous vegetables- an exotic gleam in the gloomy guise of their functional importance. S. Afr. J. Bot. 2022, 145, 420–437. [Google Scholar] [CrossRef]
  39. Feng, X.; Ma, J.; Liu, Z.; Li, X.; Wu, Y.; Hou, L.; Li, M. Analysis of glucosinolate content and metabolism related genes in different parts of Chinese flowering cabbage. Front. Plant Sci. 2022, 12, 767898. [Google Scholar] [CrossRef]
  40. Bajkacz, S.; Ligor, M.; Baranowska, I.; Buszewski, B. Separation and Determination of Chemopreventive Phytochemicals of Flavonoids from Brassicaceae Plants. Molecules 2021, 26, 4734. [Google Scholar] [CrossRef]
  41. Sarikamis, G.; Aydin, B.; Yavuz, M. Glucosinolates in Heads and Sprouts of Green, White and Romanesco Cauliflower. Fresenius Environ. Bull. 2017, 26, 618623. [Google Scholar]
  42. Djenidi, H.; Khennouf, S.; Bouaziz, A. Antioxidant activity and phenolic content of commonly consumed fruits and vegetables in Algeria. Prog. Nutr. 2020, 22, 224–235. [Google Scholar] [CrossRef]
  43. Avila, F.W.; Yang, Y.; Faquin, V.; Ramos, S.J.; Guilherme, L.R.G.; Thannhauser, T.W.; Li, L. Impact of selenium supply on Se-methylselenocysteine and glucosinolate accumulation in selenium-biofortified Brassica sprouts. Food Chem. 2014, 165, 578–586. [Google Scholar] [CrossRef]
  44. Llorach, R.; Espín, J.C.; Tomás-Barberán, F.A.; Ferreres, F. Valorization of cauliflower (Brassica oleracea L. var. botrytis) by-products as a source of antioxidant phenolics. J. Agric. Food Chem. 2003, 51, 2181–2187. [Google Scholar] [CrossRef] [PubMed]
  45. Drabinska, N.; Jez, M.; Nogueira, M. Variation in the accumulation of phytochemicals and their bioactive properties among the aerial parts of cauliflower. Antioxidants 2021, 10, 1597. [Google Scholar] [CrossRef] [PubMed]
  46. Flyman, M.V.; Afolayan, A.J. The implication of the mineral ratios of Cucumis myriocarpus Naud. and Pergularia daemia (Forsk.) Chiov. in human diets. J. Med. Food 2007, 10, 548–551. [Google Scholar] [CrossRef] [PubMed]
  47. Mobeen; Wang, X.; Saleem, M.; Parveen, A.; Mumtaz, S.; Hassan, A.; Adnan, M.; Fiaz, S.; Ali, S.; Khan, Z. Proximate composition and nutritive value of some leafy vegetables from Faisalabad, Pakistan. Sustainability 2021, 13, 8444. [Google Scholar] [CrossRef]
  48. Ai, S.W.; Guo, R.; Liu, B.L.; Ren, L.; Naeem, S.; Zhang, W.Y.; Zhang, Y.M. A field study on the dynamic uptake and transfer of heavy metals in Chinese cabbage and radish in weak alkaline soils. Environ. Sci. Pollut. Res. 2016, 23, 20719–20727. [Google Scholar] [CrossRef]
  49. Brazaityte, A.; Miliauskiene, J.; Vastakaite-Kairiene, V.; Sutuliene, R.; Lauzike, K.; Duchovskis, P.; Malek, S. Effect of different ratios of blue and red LED light on Brassicaceae microgreens under a controlled environment. Plants 2021, 10, 801. [Google Scholar] [CrossRef]
  50. Xiao, Z.; Codling, E.E.; Luo, Y.; Nou, X.; Lester, G.E.; Wang, Q. Microgreens of Brassicaceae: Mineral composition and content of 30 varieties. J. Food Compos. Anal. 2016, 49, 87–93. [Google Scholar] [CrossRef] [Green Version]
  51. Rubio, V.; Bustos, R.; Irigoyen, M.L.; Cardona-López, X.; Rojas-Triana, M.; Paz-Ares, J. Plant hormones and nutrient signaling. Plant Mol. Biol. 2009, 69, 361–373. [Google Scholar] [CrossRef]
  52. Li, G.H.; Tan, J.Q.; Chen, H.C.; Lu, M.L.; Zhang, Y.; Li, T.Y.; Ye, Y.Y.; Zhang, H. Comparative experiment on nutritional quality of different varieties of Chinese cabbage. Guangdong Agric. Sci. 2016, 43, 26–32. [Google Scholar] [CrossRef]
  53. Tai, X.; Chen, J.X.; Guo, S.H.; Zhu, X.W.; Bo, T.Y. Analysis of quality characters of different cabbage inbred lines. Mol. Plant Breed. 2021, 19, 9. [Google Scholar]
  54. Bhandari, S.R.; Kwak, J.H. Chemical composition and antioxidant activity in different tissues of Brassica vegetables. Molecules 2015, 20, 1228–1243. [Google Scholar] [CrossRef] [PubMed]
  55. Huang, S.H. Comparative experiment on nutritional quality of sightseeing and picking cauliflower varieties. Seed World 2015, 16–17. [Google Scholar]
Figure 1. Stacked bar plots showing relative abundances (%) of different quality, antioxidant, and mineral compounds over the total amount of each category present in each of the three species evaluated (cabbage, cauliflower, and Chinese cabbage). The definition for each trait abbreviation can be found in Table 3.
Agronomy 12 03121 g001
Figure 2. Heatmap showing Pearson correlation analysis between parameters of quality, antioxidant properties, and minerals. The values are Pearson correlation coefficients (⁎ correlation is significant at p ≤ 0.05). The size and color depth of the colored circles correspond to the strength of the correlation, ranging from weak (small ball, blue) to strong (large ball, red). The full name of each trait abbreviation can be found in Table 3.
Agronomy 12 03121 g002
Figure 3. PCA loading plots (A) and score plots (B) evaluated in this study based on the first two principal components. The first and second principal components account for 33.8% and 23.7% of the total variation, respectively. Depending on the species, these materials are represented by different symbols and colors: the red squares represent cabbage; the green circles represent cauliflower; and the purple triangles represent Chinese cabbage. Ellipses group the accessions of each species at a 95% confidence level. The full name of each trait can be found in Table 3.
Agronomy 12 03121 g003
Figure 4. Heatmap representing the hierarchical clustering of the 33 varieties studied based on their leaf ball and curd composition profiles. Columns represent the varieties, and rows represent the traits evaluated. Unit variance scaling was applied to rows. Both rows and columns are clustered using correlation distance and average linkage. The scale of the color intensity is shown in the top right corner, and it represents a proportional value of the compound content. The full definition for each trait abbreviation can be found in Table 3.
Agronomy 12 03121 g004
Table 1. Basic physical and chemical properties of soils.
Total Nitrogen
(g·kg−1)
Total Phosphorus
(g·kg−1)
Total Potassium
(g·kg−1)
Nitrogen Alkali
Digestion
(mg·kg−1)
Fast-Acting
Phosphorus (mg·kg−1)
Fast-Acting
Potassium (mg·kg−1)
Organic Matter
(g·kg−1)
pHEC
(ms·c m−1)
0.5220.89415.176.317116.8232.513.938.030.231
Table 2. Information on the varieties examined in this study.
CultivarsAbbreviationsSpeciesLeaf Balls/CurdsTypes
LuyizihongCab_1Cabbagepurplepurple
XinhongluCab_2Cabbagepurplepurple
Tianzi 17Cab_3Cabbagepurplepurple
GA1826Cab_4Cabbagegreengreen oblate
Lixia287Cab_5Cabbagegreengreen oblate
ZhuixiaCab_6Cabbagegreengreen oblate
ZhenniuCab_7Cabbagegreengreen bull heart
JianmeiCab_8Cabbagegreengreen bull heart
JianfengCab_9Cabbagegreengreen bull heart
FuguiCab_10Cabbagegreengreen round
Weigan 105Cab_11Cabbagegreengreen round
SijibaoCab_12Cabbagegreengreen round
GSS-07Cau_1Cauliflowerwhitewhite
YunyiqingengCau_2Cauliflowerwhitewhite
Youmei 88Cau_3Cauliflowerwhitewhite
XiulvCau_4Cauliflowergreengreen
FuzhiCau_5Cauliflowergreengreen
YanxiuCau_6Cauliflowergreengreen
Zijian 1Cau_7Cauliflowerpurplepurple
Ziyu 90Cau_8Cauliflowerpurplepurple
ZihonghuaCau_9Cauliflowerpurplepurple
ZiyiChi_1Chinese cabbagepurplepurple
Zibao 5Chi_2Chinese cabbagepurplepurple
QianbaocaiChi_3Chinese cabbagepurplepurple
QiuhuanChi_4Chinese cabbagegreengreen
HC104Chi_5Chinese cabbagegreengreen
WanqiuChi_6Chinese cabbagegreengreen
Quanmei 102Chi_7Chinese cabbagegreengreen upright
JincuiChi_8Chinese cabbagegreengreen upright
NX0010Chi_9Chinese cabbagegreengreen upright
MinixiaoqiaoChi_10Chinese cabbagegreengreen mini
Zhongwa 1Chi_11Chinese cabbagegreengreen mini
JiaowaChi_12Chinese cabbagegreengreen mini
Table 3. Compositional characteristics, abbreviations used, and expression units for cabbage, cauliflower, and Chinese cabbage varieties considered in this study.
Leaf Balls/Curds Composition TraitAbbreviationsUnits
Soluble proteinSPmg·kg−1 FW
NitrateNImg·kg−1 FW
Soluble sugarSSmg·kg−1 FW
Vitamin CVCmg·g−1 FW
FlavonoidFLmg·g−1 FW
PolyphenolPOmg·g−1 FW
GlucosinolateGLSμmol·g−1 FW
Macronutrients (Potassium, Calcium,
Magnesium, Phosphorus)
K, Ca, Mg, Pmg·kg−1 DW
Micronutrients (Copper, Iron, Manganese, Zinc)Cu, Fe, Mn, Znmg·kg−1 DW
Table 4. Mean ± standard error (SE), range, and coefficients of variation (CVs) for the quality traits in the species analyzed. Species means with different letters are significantly different at p ≤ 0.05.
TraitsCabbageCauliflowerChinese Cabbage
Mean ± SECV (%)RangeMean ± SECV (%)RangeMean ± SECV (%)Range
Soluble protein (mg·kg−1 FW)424.69 ± 15.07 b6.15304.72–569.01603.04 ± 3.41 a0.98540.91–638.55426.95 ± 5.89 b2.39232.56–569.01
Nitrate (mg·kg−1 FW)163.32 ± 6.76 b7.1768.27–261.1193.92 ± 2.09 c3.8554.06–146.45207.78 ± 0.88 a0.73114.36–340.61
Soluble sugar (mg·kg−1 FW)27.73 ± 0.56 a3.5123.36–31.6622.31 ± 0.58 b4.5113.35–28.6417.50 ± 0.62 c6.1414.43–22.08
Table 5. Mean ± standard error (SE), range, and coefficients of variation (CVs) for the antioxidant traits in the species analyzed. Species means with different letters are significantly different at p ≤ 0.05.
TraitsCabbageCauliflowerChinese Cabbage
Mean ± SECV (%)RangeMean ± SECV (%)RangeMean ± SECV (%)Range
Vitamin C (mg·g−1 FW)0.42 ± 0.01 a3.670.17–0.700.37 ± 0.01 b4.090.21–0.610.45 ± 0.01 a4.440.28–0.56
Flavonoid (mg·g−1 FW)5.90 ± 0.06 a1.701.46–12.952.96 ± 0.25 b14.680.24–6.681.87 ± 0.07 c6.230.61–6.49
Polyphenol (mg·g−1 FW)1.06 ± 0.01 b2.380.31–1.971.53 ± 0.02 a2.101.01–2.220.91 ± 0.01 c1.100.57–1.39
Glucosinolate (μmol·g−1 FW)13.40 ± 0.68 b8.745.83–24.5125.27 ± 0.83 a5.7117.91–33.0812.56 ± 0.66 b9.118.15–16.23
Table 6. Mean ± standard error (SE), range, and coefficients of variation (CVs) for the mineral elements in the species analyzed. Species means with different letters are significantly different at p ≤ 0.05.
TraitsCabbageCauliflowerChinese Cabbage
Mean ± SECV (%)RangeMean ± SECV (%)RangeMean ± SECV (%)Range
K (mg·kg−1 DW)4624.45 ± 16.14 c0.603306.67–6173.334764.44 ± 24.48 b0.893146.67–6773.339206.67 ± 45.01 a0.857506.67–11640.00
P (mg·kg−1 DW)4020.10 ± 21.26 c0.923051.13–5915.814726.61 ± 68.53 b2.513449.59–6378.235614.78 ± 25.87 a0.804531.84–8095.07
Ca (mg·kg−1 DW)2384.72 ± 15.27 b1.111722.67–3321.001891.52 ± 13.02 c1.191563.67–2566.673297.00 ± 20.84 a1.092828.00–3890.00
Mg (mg·kg−1 DW)2737.33 ± 13.94 b0.882302.20–3548.002454.25 ± 11.91 c0.841747.00–3160.003322.79 ± 10.23 a0.532799.90–4026.00
Cu (mg·kg−1 DW)3.56 ± 0.05 b2.662.15–4.514.25 ± 0.01 a0.541.84–5.692.12 ± 0.02 c1.511.06–4.76
Fe (mg·kg−1 DW)46.90 ± 0.27 a1.0120.62–75.9231.98 ± 0.19 c1.0419.11–62.3044.02 ± 0.37 b1.4420.33–119.54
Mn (mg·kg−1 DW)6.06 ± 0.06 b1.823.48–10.835.42 ± 0.11 c3.562.80–7.2815.36 ± 0.13 a1.478.28–26.46
Zn (mg·kg−1 DW)19.33 ± 0.20 b1.8114.61–25.4321.62 ± 0.32 a2.5818.52–26.1621.87 ± 0.58 a4.6016.58–27.11
Publisher’s Note: MDPI stays neutral with regard to jurisdictional claims in published maps and institutional affiliations.

