1. Introduction
Ginseng (
Panax ginseng C. A. Meyer) is the dried root and rhizome of ginseng of the family Wujia, which has the effects of tonifying the kidneys, calming the mind, nourishing the brain, brightening the eyes, and beneficial to intellectual development [
1]. It is referred to as the “king of all herbs” since it is a priceless Chinese herb and tonic [
2]. The appearance of particular ginseng features is the key factor used in the traditional method of ginseng identification to assess its quality. The literature [
3] also demonstrates that there is a correlation between the appearance of ginseng’s characteristic traits and its main chemical components. Empirical identification of ginseng quality based on “identifying the appearance and shape to discuss the quality” is a scientific method [
4,
5,
6] that is particularly effective. However, it has shortcomings. To identify a ginseng specimen, a connoisseur must first carefully observe all aspects of the ginseng plant under exam, which requires a lot of time and effort. Secondly, ginseng with high economic and therapeutic value may be damaged, since the manual identification process has a tendency to harm the plant. In the end, manual recognition is subject to some degree of subjective influence. This frequently leads to inconsistent identification criteria and incorrect identification outcomes [
7]. At present, there is a lack of sufficient attention to the study of ginseng characteristics. The 2020 edition of the Chinese Pharmacopoeia also includes descriptions and specificities of ginseng phenotypic features; however, in practice, the general public will still not be able to tell ginseng quality by its appearance. With the rapid advancement of computer technology, artificial intelligence technology has slowly begun to be integrated in traditional Chinese medicine identification. The “Fourteenth Five-Year Plan for the Development of Chinese Medicine Informatization” announced in 2022 makes it very obvious that informational means must be used to advance the modernization of Chinese medicine.
Deep learning is close to the way humans learn by mimicking the neural networks of the human brain, using a hierarchical network model structure to gather information about the appearance and sound of things, to perceive and understand them, and to generate appropriate behaviors. Its development in the field of computer vision is more complete than in other areas and has produced some outcomes [
8]. LECUN et al. [
9] proposed LeNet, which is the most representative convolutional neural network and consists of a Conv layer, a pooling layer, and a fully connected layer. When the network was initially used to accurately classify handwritten datasets, it established the stage for the later development of convolutional neural networks. With the AlexNet [
10] network winning the ImageNet (large visualization database) competition in 2012, a number of classical deep convolutional neural networks have emerged, such as VGG [
11], GoogLeNet [
12], ResNet [
13], DenseNet [
14], etc. They outperform conventional approaches in picture identification and offer greater advantages. These networks are already extensively utilized in the fields of Chinese medicine and plant identification, despite the fact that they have not yet been employed to identify the appearance and quality of ginseng. Dyrmann et al. [
15] adopted a method for identifying plant species in color images using convolutional neural networks and were able to identify 22 weed and crop species with an accuracy of 86.2%. Lee et al. [
16] designed a deep learning method for the quantitative discrimination of leaves by gathering data on leaf features and analyzing them through convolutional neural networks and deconvolutional networks. The results of the study demonstrated that using deep learning methods can further increase the identification efficiency of plant classification based on the leaf. Liu et al. [
17] applied the Inception structure and introduced dense connectivity to successfully achieve the classification and identification of six grape diseases, and the final model accuracy was 97.22%. Liu Wei et al. [
18] combined Xception and DenseNet to propose the new image identification model DxFusion, which was able to accurately identify 60 Chinese herbs. Li Dongming et al. [
19] used a deep learning strategy with the residual network and densely linked network to eventually identify and categorize five distinct origins of the Saposhnikovia divaricate.
Ginseng appearance quality identification is a fine-grained classification task. Therefore, considering the above research analysis, we attempted to apply deep learning techniques to the field of ginseng appearance quality identification and enhance ResNet50 according to the characteristics of ginseng. We finally propose an algorithm that can be effective, quick, and precise for grading the appearance and quality of ginseng.
2. Data Pre-Processing
2.1. Dataset Construction
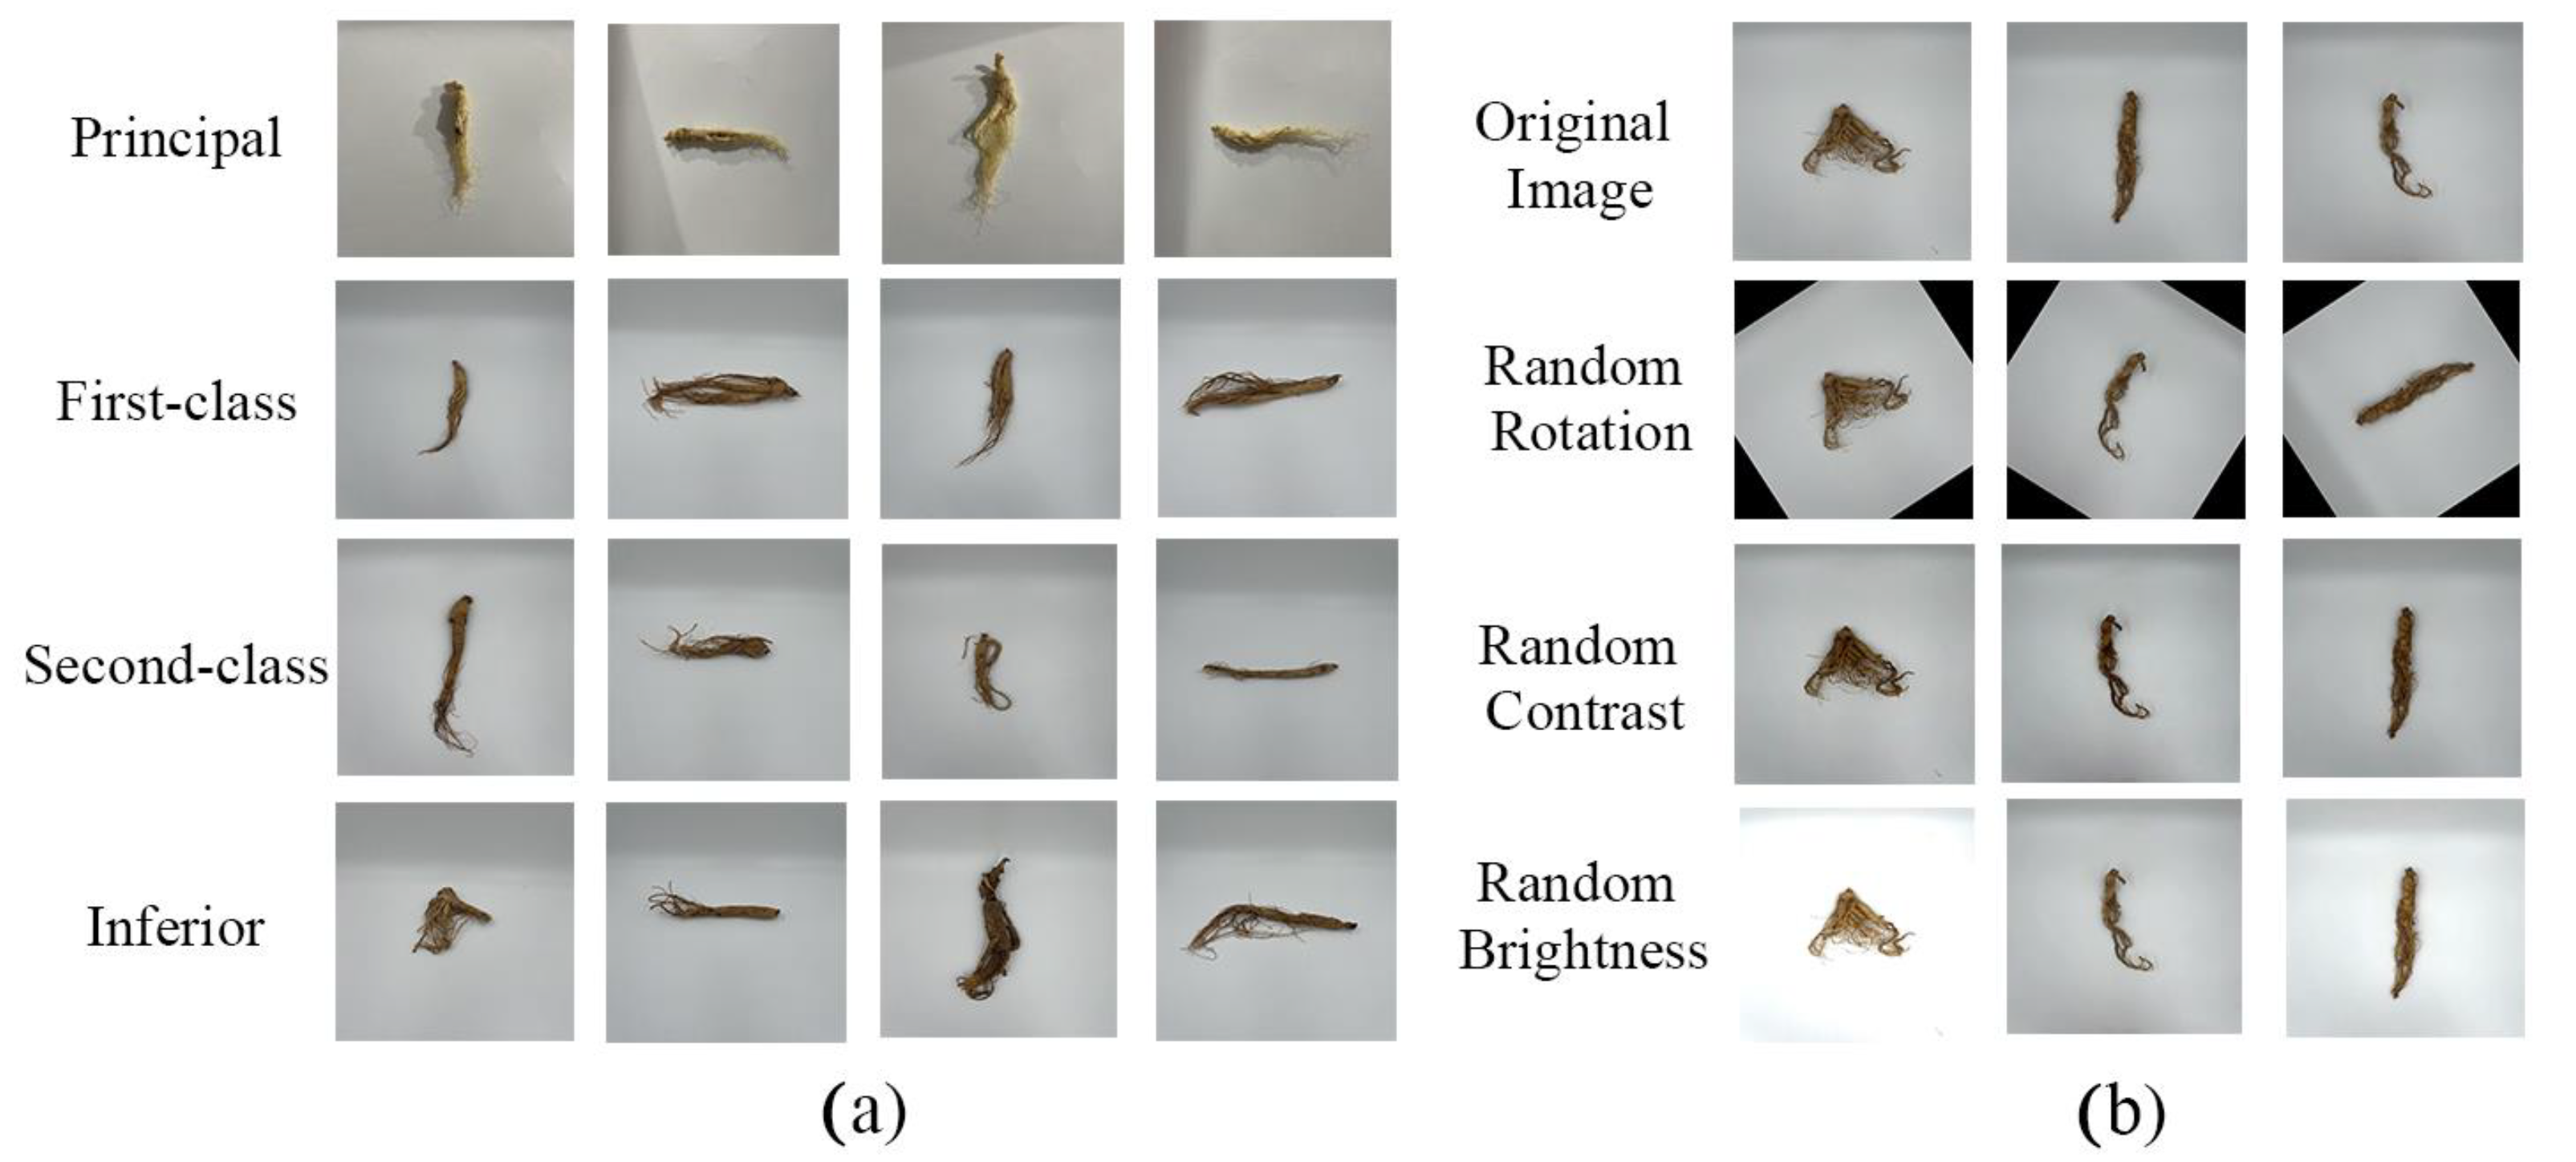
After analyzing various ginseng varieties, we chose to employ white ginseng (a product made from fresh garden ginseng that was cleaned and dried or dried in the sun) as the experimental subject due to the complex morphological structure of the herb and market demand. The experimental data were gathered in September 2021 at the School of Chinese Herbal Medicine, Jilin Agricultural University, from the same batch of white ginseng. To facilitate the image collection, the white ginseng batch was assigned a serial number and scored by experts in accordance with the guidelines for white ginseng in the document “Group Standard for Ginseng of Jilin Daoji Herbs” which was released by the Tonghua Ginseng Industry Association on 10 September 2021 (as in
Table 1). Ginseng of a standard lower than the principal, first-class, and second-class was rated as inferior.
The specimens were then photographed according to their ratings by using a small HD folding studio box (Sutefoto., Guangdong, China). A mobile phone camera (Apple., Cupertino, CA, USA) was positioned at the top of the studio box, perpendicular to the ginseng, at a height of 40 cm, guaranteeing that all samples were essentially photographed in the same position. The photographs of the white ginseng were gathered from various angles and backgrounds, and each image had a resolution of 1024 × 1024 pixels, with distinct image details. A total of 549 images of the principal white ginsengs, 790 images of the first-class white ginsengs, 600 images of the second-class white ginsengs, and 290 images of the inferior white ginsengs were saved after numerous photos were shot and gathered.
2.2. Data Enhancement
When the number and quality of the data were higher during the deep learning training phase, the model was more generalizable. As a result, the upper limit of the model learning was directly determined by the data. During the collection of the data, most of the photographs had difficulty in reproducing the full scene of the environment in which the samples were positioned, and the number of photographs taken was small. Because of this, we needed to perform data enhancement on the collected photos [
20]. In this paper, two types of enhancement were adopted: offline enhancement and online enhancement.
The offline enhancement method applies random rotation, random adjustment of contrast, and random adjustment of brightness to expand the dataset. Following offline augmentation, the data were increased to 6131 frames. Information on the dataset is shown in
Figure 1.
The online enhancement method uses the PIL (Python Image Library) module in the Python image library to uniformly crop a given image to 256 pixels by 256 pixels before each training round; then the images are processed using the center crop method, and finally the normalization is completed. This could indirectly increase the amount of training data by increasing the diversity of the image samples used in the training process.
2.3. Dataset Partitioning
To eliminate the serendipity of the experimental results, all training in this paper was conducted by using the five-fold cross-validation method. A randomly selected 80% of the dataset was used as the training set, and 20% of it as the test set. That is, 1225 images were used as validation data each time, while 4906 images were extracted from the training set as training data, and the validation data were not repeated. The final results were the average of five experiments, and the breakdown of the data for each class is shown in
Table 2.
3. Building the Network Model
3.1. Resnet50 Model
He et al. proposed ResNet in 2015 [
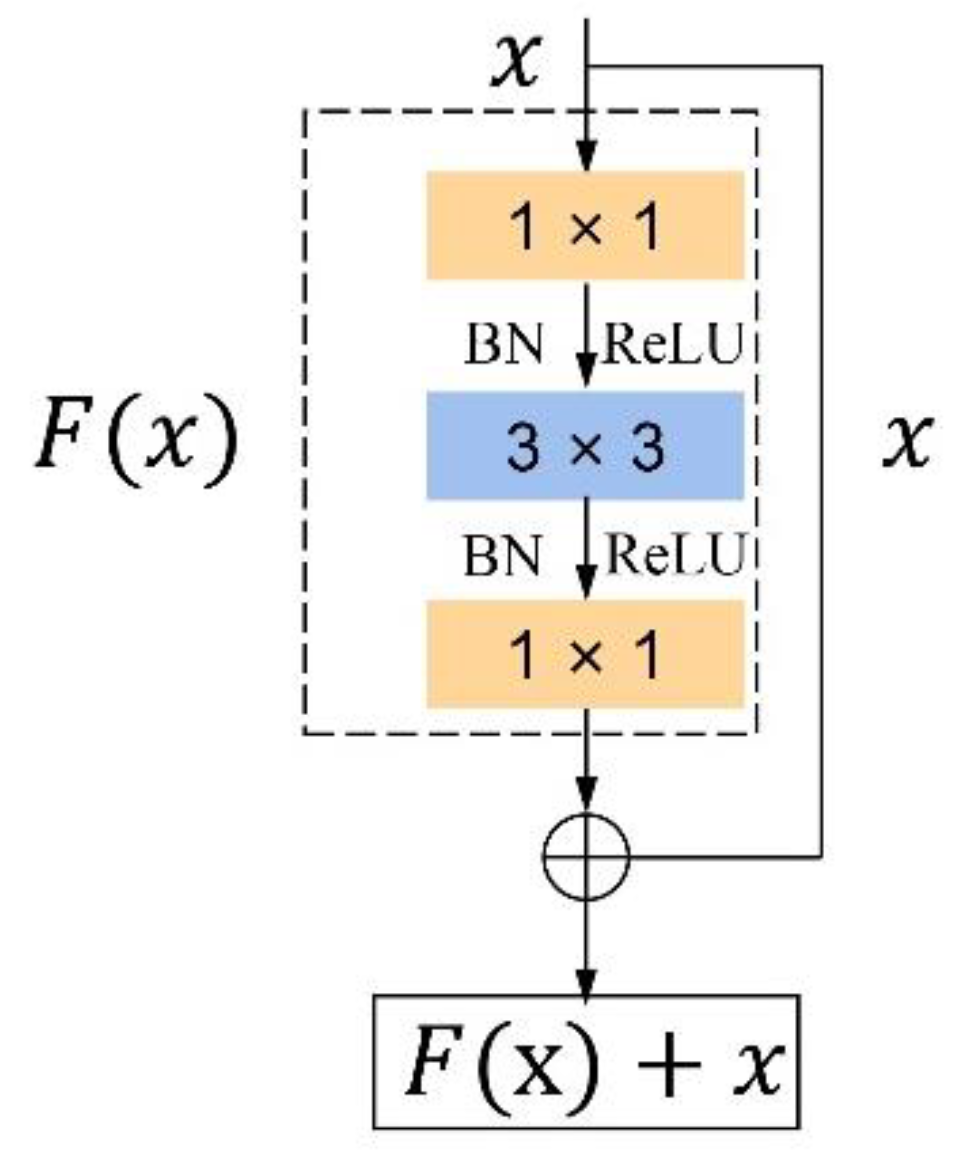
13], in which the residual block is an important structure. It enhances the transfer of features by introducing shortcut connections in the convolutional neural network, so that the next layer contains more information about the image. The + residual block consists of a Convolution Layer (Conv), a Batch Normalization Layer (BN), and a Rectified Linear Units Layer (
ReLU). The structure of the residual block used by ResNet50 is shown in
Figure 2. Here,
is the input to the network, and
represents the output after three Conv layers of processing. As the depth of the neural network increases, the image information in the feature map decreases layer by layer. Therefore, it is merged with the original output through the mapping of shortcut connections before being delivered to the subsequent layer
The issue that typical deep learning algorithms cause the network to burst and disappear as the number of layers grows, making the model difficult to converge, is resolved by this operation. The main branch contains three Conv layers, the first being a 1 × 1 Conv layer to compress dimensionality, the second a 3 × 3 Conv layer, and the third a 1 × 1 Conv layer to reduce dimensionality. This greatly maintains accuracy and reduces the computational effort [
21].
3.2. Improving the Resnet50 Model
3.2.1. Using the Leaky ReLU Activation Function
Using activation functions in neural networks can increase the non-linear variability of the neural network model. The traditional ResNet uses a
ReLU activation function. It is characterized by fast computing speed and good performance. Its function expression is shown in Equation (1).
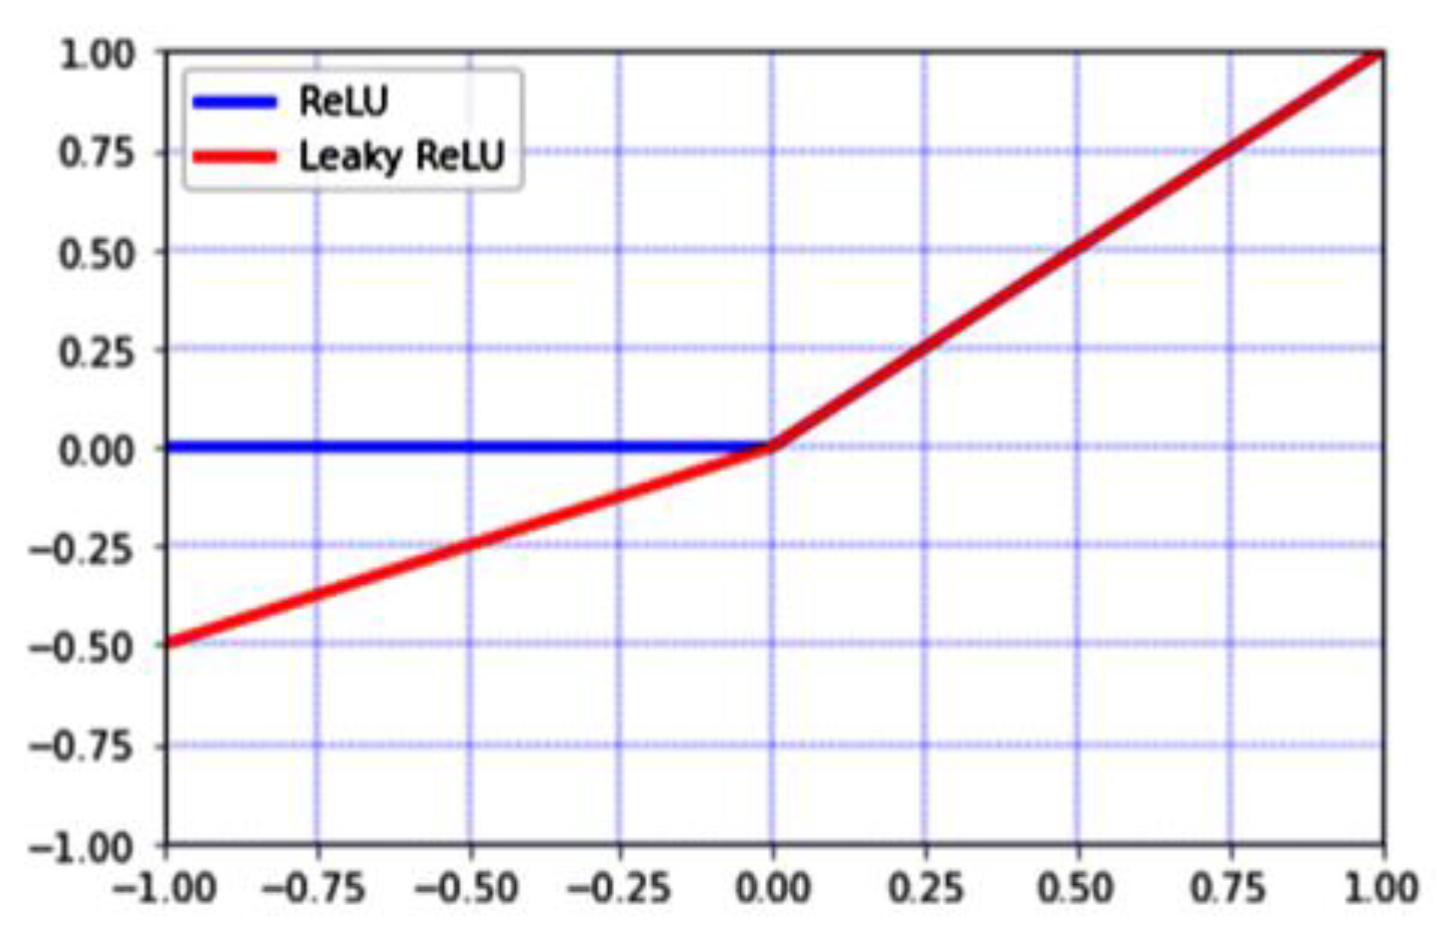
As can be seen in
Figure 3, the gradient of this interval is constant when
of the
ReLU function is greater than 0, thus alleviating the gradient disappearance problem. However, when the input value is negative during training, the function will reach hard saturation, resulting in the weights not being updated, i.e., the neuron death phenomenon.
To address this problem, we replaced the
ReLU activation function with a
Leaky ReLU [
22]. The
Leaky ReLU function has the characteristics of being able to achieve hard saturation, fast computation, and quick convergence compared to the conventional activation functions Sigmoid and Tanh. Its expression is shown in Equation (2).
where
is the value of the gradient, the default setting being
. The capacity of the
Leaky ReLU function to preserve the gradient when the input information is less than 0 gives it an advantage over the
ReLU function, allowing the parameters to continue to be updated, as can also be seen from the comparison chart in
Figure 3. By doing this, the network’s interpretability will be enhanced, and any data loss will be prevented.
3.2.2. Adding an Attention Mechanism
The use of an attention mechanism in convolutional neural networks has been much favored in recent years, as it can substantially improve a network performance by refining the feature mapping [
23,
24,
25]. The channel attention mechanism has demonstrated the most potential for enhancing network performance among the available attention mechanisms. One of its representative networks is the Squeeze and Excitation Network (SENet) that incorporates the SE module (Squeeze and Excitation) [
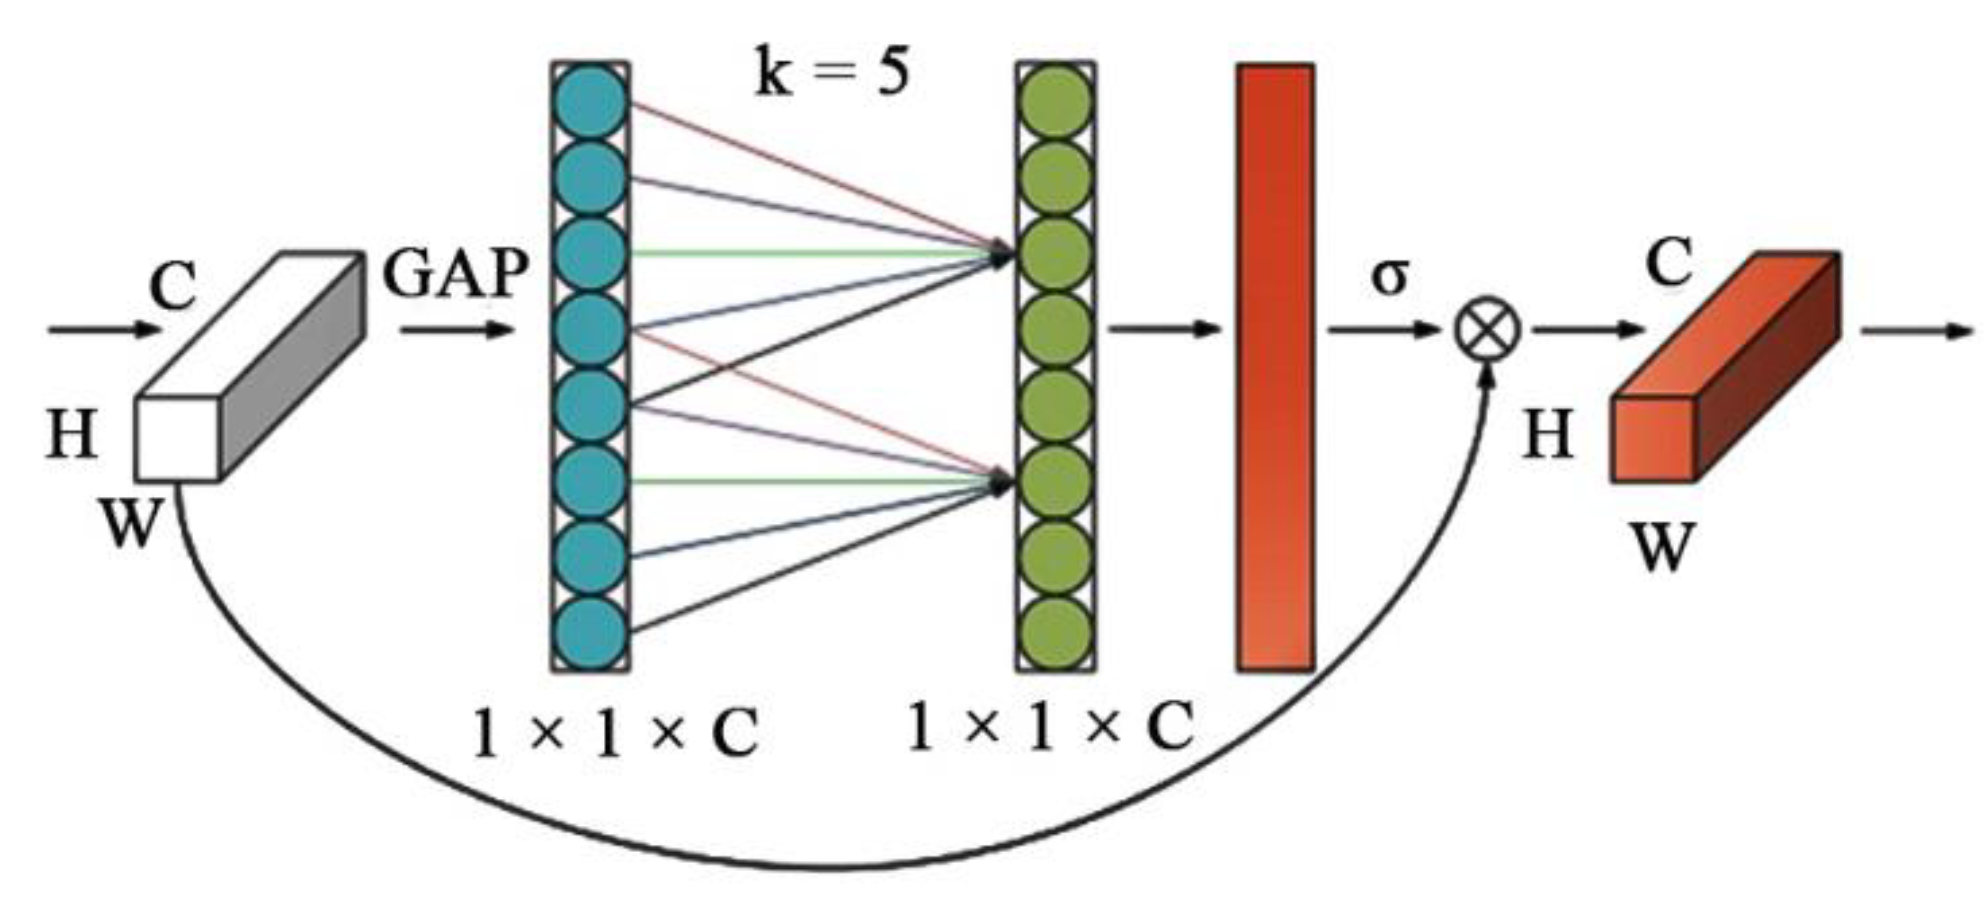
26]. However, the feature extraction process’s dimensionality reduction has negative effects on channel attention prediction and ineffectively captures the dependencies between all channels. Therefore, Wang et al. then proposed a new efficient channel attention network, i.e., the ECA-Net (Efficient Channel Attention for Deep Convolutional Neural Networks), in 2019 [
27]. The structure of the ECA module is shown in
Figure 4. Without dimensionality reduction, the ECA module has the ability to adaptively choose one-dimensional convolutional kernels. Here is how it works.
- (1)
Input features: Given an input feature image of size , the input image is subjected to Global Average Pooling (GAP) to obtain all the feature information without dimensionality reduction.
- (2)
Calculation: The one-dimensional convolution operation with a convolution kernel of size is used to efficiently complete the cross-channel information interaction and obtain the weights of each channel , as shown in Equation (3).
where
represents the sigmoid activation function, and
represents the one-dimensional convolution. The number of channels
is proportional to the one-dimensional convolution with kernel
, as shown in Equation (4).
The final kernel size
can be determined adaptively using Equation (5).
where
is the nearest odd number to
,
is 1, and
is 2.
- (3)
Output features: The weights of each channel are obtained using the sigmoid function, and the input feature maps are channel-weighted to finally obtain the feature maps under different weights.
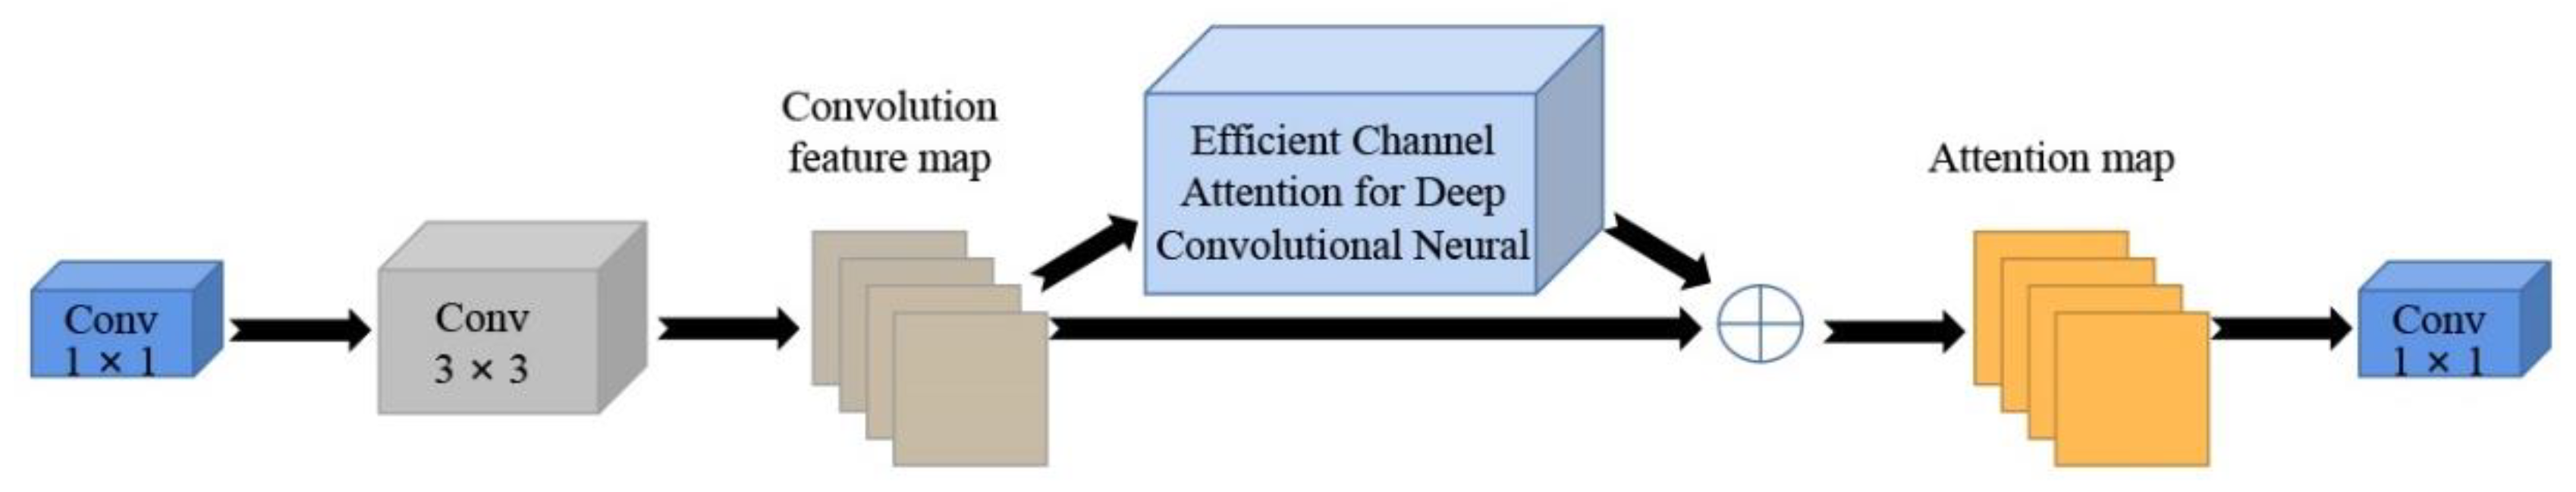
Since backpropagating the feature information is vulnerable to gradient dissipation close to the input layer, it is challenging to boost the network model’s efficiency. The majority of ginseng plants share a similar shape and have fine textures and dense roots, which can affect their identification after downsampling and makes it difficult to extract detailed features from the network. Therefore, we improved the original residual block by adding the ECA module before the feature overlay, as shown in
Figure 5. With the addition of the ECA module, the network enhanced the learning of channel attention features for each Conv block, and focusing the attention on hard-to-identify ginseng images allowed the features to be reused. As a result, the network model performed significantly better.
3.2.3. Introduction of a Focal Loss Function
The focal loss function (Focal Loss) [
28] is the main solution to the problem of the existence of imbalances in the classification dataset and of mining difficult samples. It is based on an enhancement of the cross-entropy loss function [
29]. Ordinary cross entropy states that for positive samples, the output probability increases, and the loss decreases; for negative samples, the output probability decreases, and the loss increases. In this case, the loss function improved slowly over the iterative process of a large number of simple samples and might not be able to optimize to the optimum. The original base was increased by the adjustment factor
. Its formula is shown in Equation (6); by reducing the loss of easy-to-classify samples, it concentrates more on complex, incorrectly classified samples. When
is 0, we have the cross-entropy loss function.
In addition to this, a balancing factor
was introduced to compensate the unequal distribution of positive and negative samples; its formula is given in Equation (7).
Due to the minimal number of inferior samples in the constructed ginseng dataset and the lack of distinctive features between different ginseng species, to reduce the weight of the negative samples in the training, a focal loss function was introduced; this allowed the model to obtain more accurate classification results.
3.2.4. Structure of the Ginseng Appearance Quality Grading Model
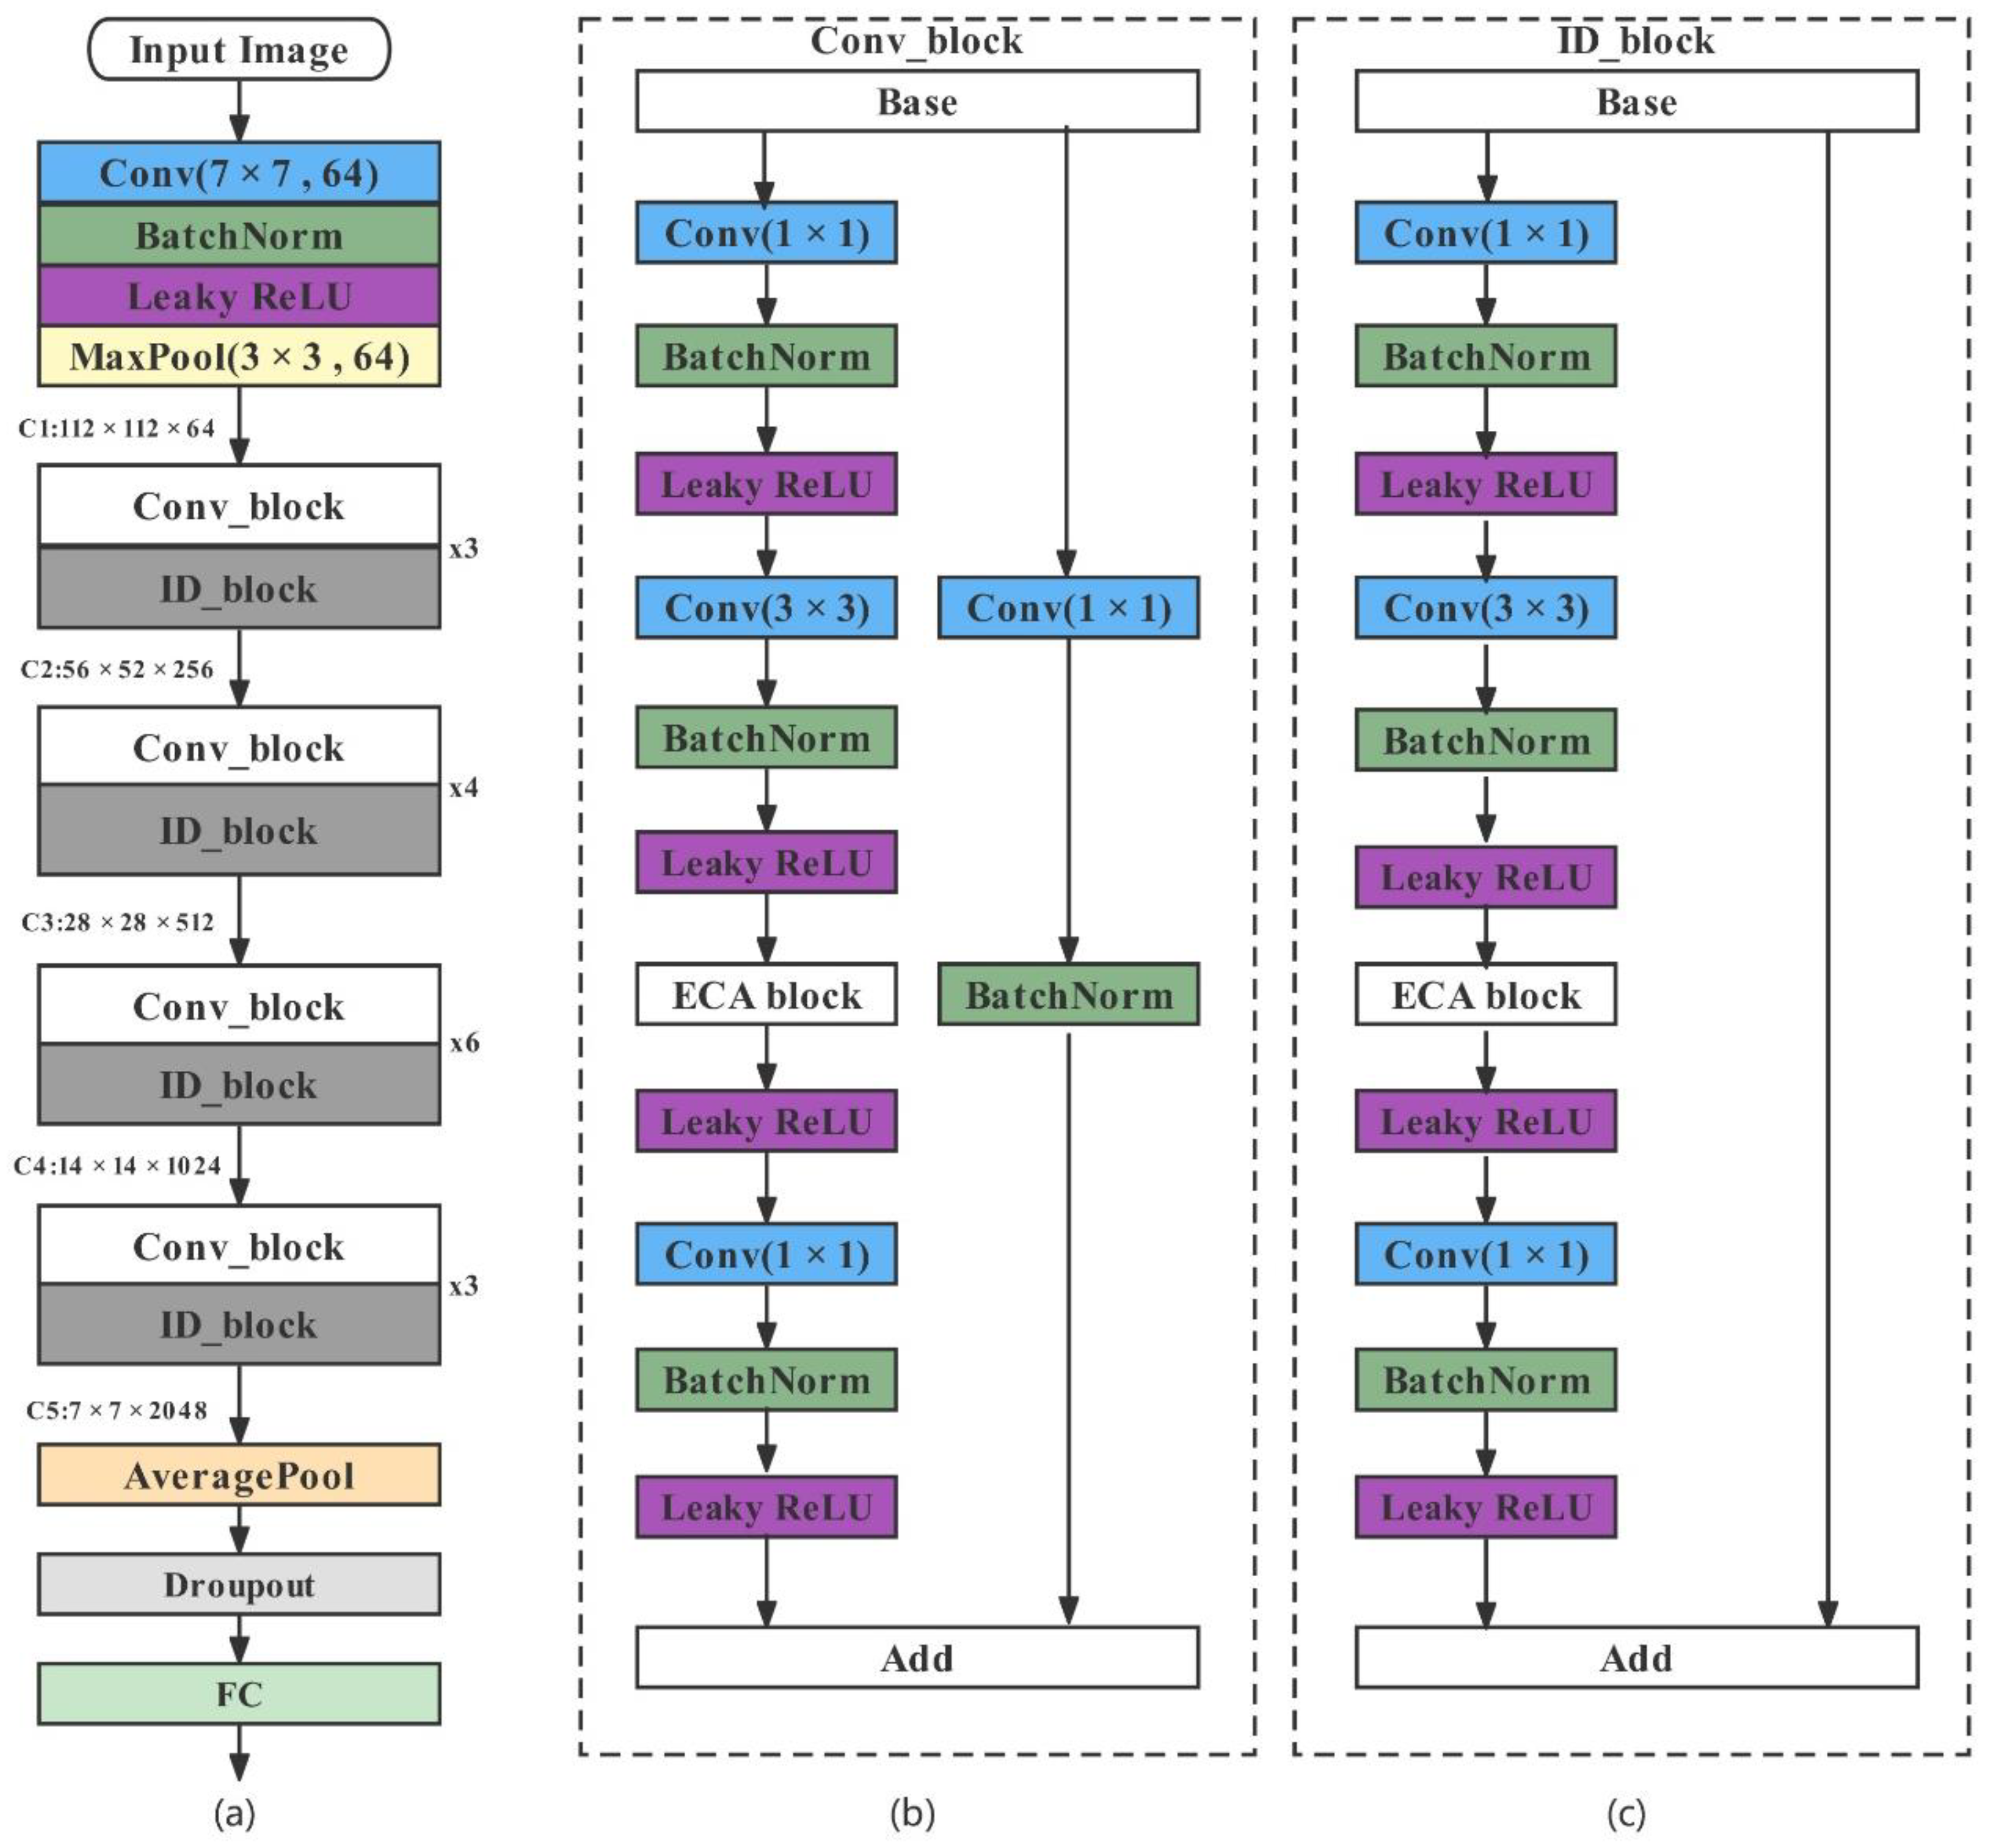
The classical ResNet consists of three parts: the input, the convolution, and the output. First, the data enter the network and go through the input section. Then, they go through the intermediate 1, 2, 3, and 4 Conv layer sections. Finally, the data go to the averaging pooling and fully connected layers to acquire the result. In this study, the original ResNet50 was reconstructed using the three suggested strategies for improvement. The enhanced network structure is shown in
Figure 6.
The input feature map of this network first passes through a 7 × 7 Conv layer, preserving the image’s original features over a substantial area. Then, after the BN (BatchNormalization) layer and the
Leaky ReLU activation function, the features are extracted from the feature map using a 3 × 3 maximum pooling layer and compressed into a feature map with a channel count of 64. The feature map enters four layers in turn. Each layer consists of a Conv block and a variable number of ID (Identity) blocks. One Conv block and two ID blocks make up the first layer, one Conv block and three ID blocks make up layer 2, one Conv block and five ID blocks make up layer 3, and one Conv block and two ID blocks make up layer 4. Each Conv block and ID block adds the ECA module as indicated in
Figure 6b,c. Eventually, a feature map with a channel count of 2048 is produced by successively passing the shallow spatial information and the underlying semantic information. The constructed model employs a global average pooling layer to optimize the network structure and adds a discard layer before the fully connected layer to prevent overfitting. The feature map is finally sent to the fully connected layer prediction to obtain the classification result.
3.3. Model Training for Transfer Learning
Transfer learning [
30] involves moving pre-trained model parameters to a newly constructed model and sharing the newly learned knowledge with the new model in order to accelerate and optimize the learning speed of the model and bring it to convergence in the shortest possible time. Due to the fact that the model training used a supervised learning approach, a substantial amount of data samples were needed once the ginseng appearance quality grading model had been constructed. We had a limited number of samples, which made it challenging to set up the deep network training. However, the use of transfer learning methods could effectively improve the accuracy and generalization of the model. First, the constructed ginseng appearance quality grading model was initialized by loading the dataset from ImageNet. After that, the trained weights were transferred to the enhanced Conv layer. Finally, the ginseng dataset was loaded into the network, and then all layers aside from the fully connected layer were frozen and continuously fine-tuned for training until the optimal model was obtained [
31].
4. Experimental Validation and Analysis of the Results
4.1. Experimental Setup and Analysis of the Results
We implemented our approach based on PyTorch. The processor of the experimental workstation was Xeon 4210 (8-core 2.45 GHz) (Intel., Santa Clara, CA, USA); the memory was 64 G. the GPU was NVIDIA GeForce GTX 1080 ti (NVIDIA., Santa Clara, CA, USA); the running memory was 11 GBRAM. The software experimental configuration environment was Ubuntu 16.04; Python 3.7.0; Pytorch 1.10.1; CUDA 10.2. The specific parameter settings in the experiment are shown in
Table 3.
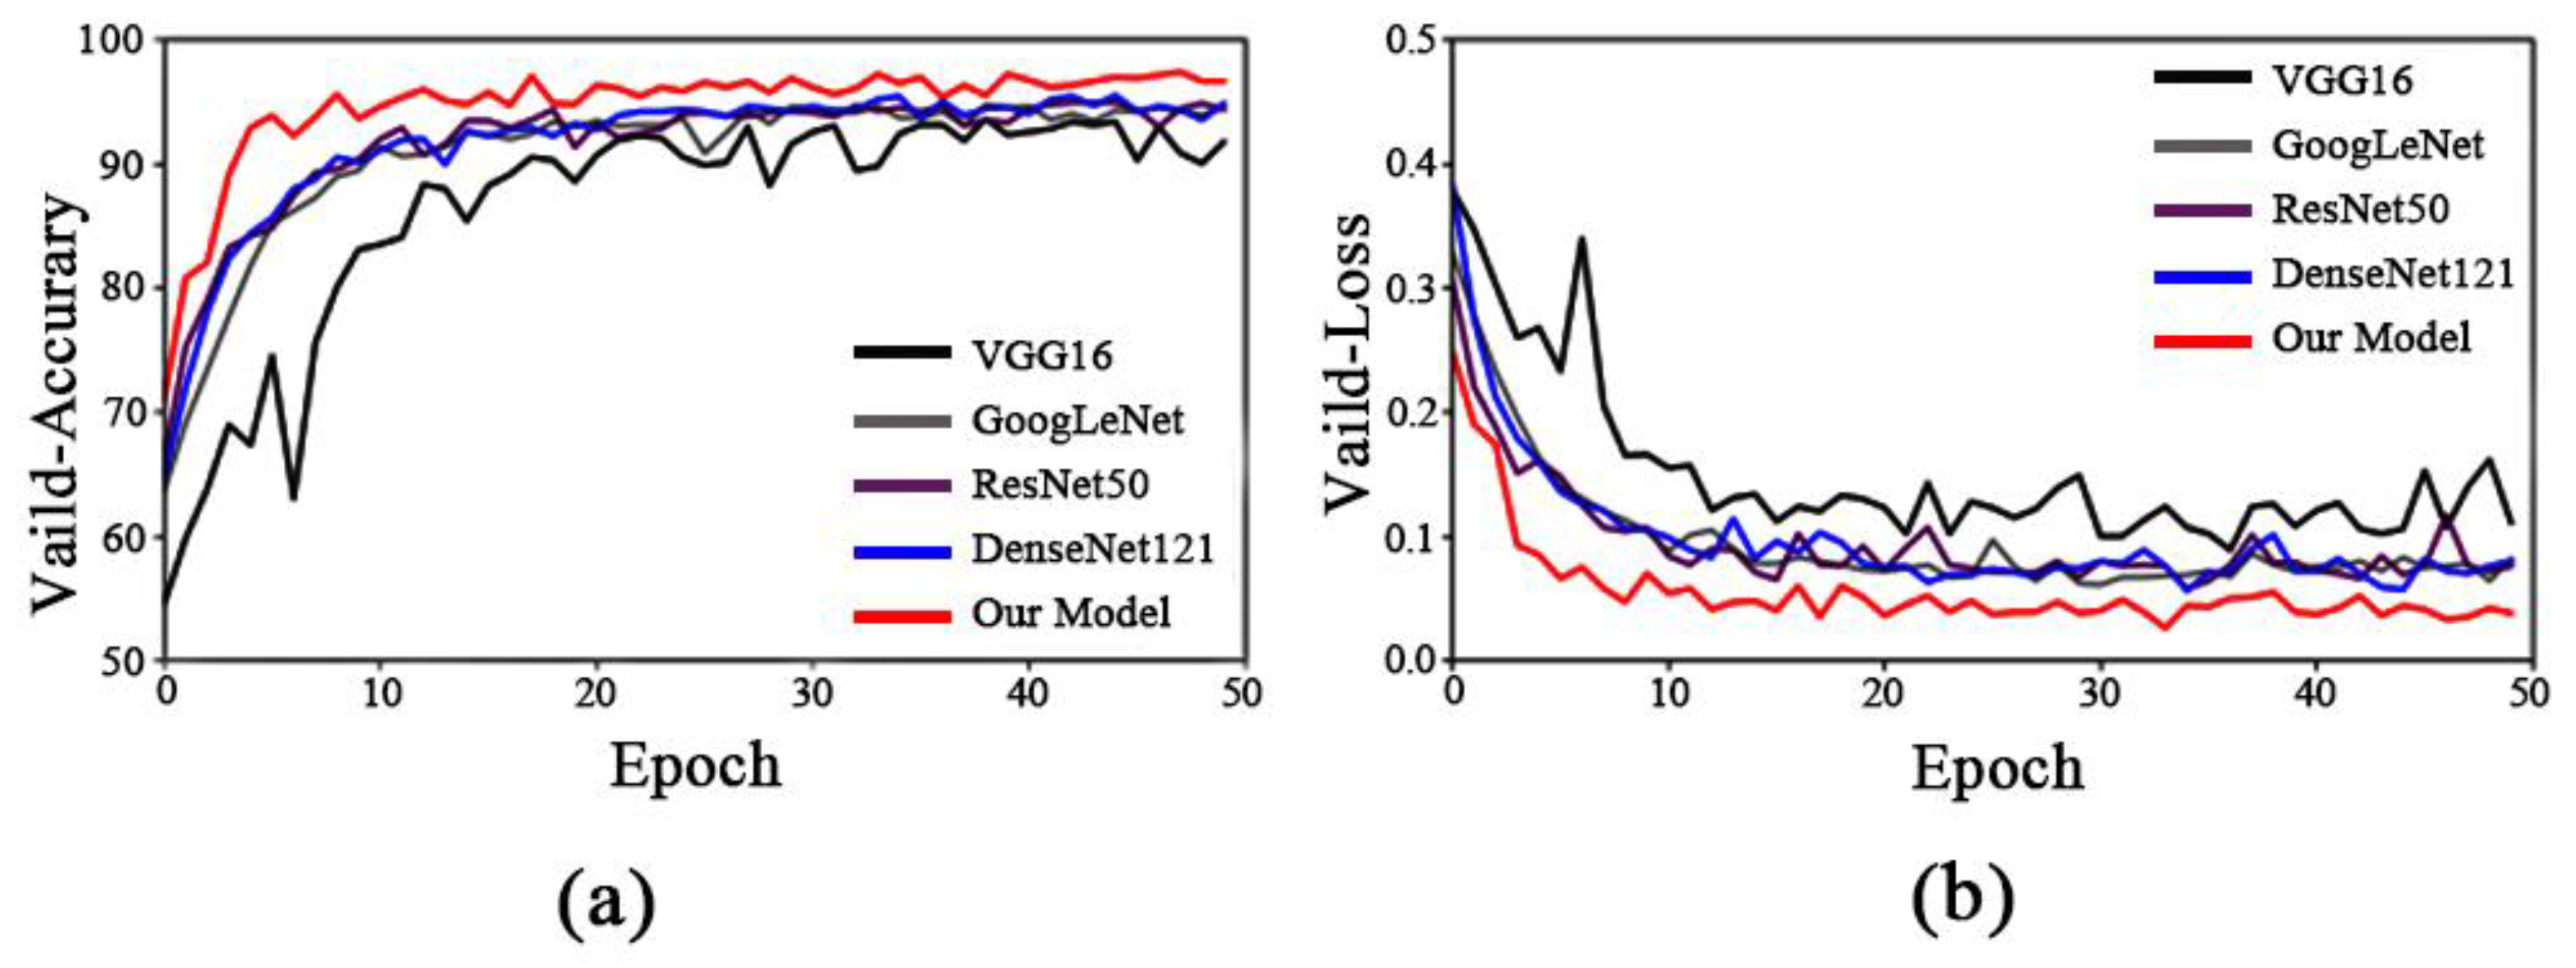
To confirm the validity of the model, we compared the improved model with the classical convolutional neural network models VGG16, GoogLeNet, ResNet50, and DenseNet121. The accuracy rates increased by 3.76, 2.61, 2.45, and 1.88 percentage points, and the loss values decreased by 0.091, 0.042, 0.031, and 0.022 percentage points, as shown in
Table 4. The comparison graph in
Figure 7 shows that the improved model showed the highest recognition accuracy and the lowest loss value when compared to the other models as well as the shortest training time per round, and could quickly converge to find the optimal value; it also reached convergence quickly to find the optimal value. This demonstrated the superior performance of the model, indicating that it would provide a valuable reference for the subsequent application in ginseng appearance quality identification.
4.2. Impact of Attention Mechanisms on the Model Performance
In our experiments, we found that the addition of different attention mechanisms also had some effects on the model’s performance when all other factors were equal. As shown in
Table 5, the model improved its recognition accuracy by 0.74, 1.31, and 1.72 percentage points, and the loss values decreased by 0.002, 0.02, and 0.021 percentage points, respectively, with the addition of the
Leaky ReLU activation function alone and then the addition of the SE channel attention mechanism [
26], the CBAM (Convolutional Block Attention Module) convolutional attention mechanism [
32], and the ECA efficient channel attention mechanism. While the loss values decreased by 0.002, 0.02 and 0.021 percentage points, the recognition accuracy increased by 0.74, 1.31 and 1.72 percentage points, respectively. In contrast, the addition of the SK (Selective Kernel) attention mechanism [
33] resulted in a 2.857 percentage point decrease in identification accuracy and a concomitant 0.019 increase in loss value. The results showed that the ECA mechanism had a more significant role in improving the performance of the network model than the other attention mechanisms. However, the results of incorporating the SK attention mechanism also demonstrated that the introduction of an attention mechanism into the network model does not guarantee an accurate identification; therefore the choice of the attention mechanism needs to be made appropriately for different tasks.
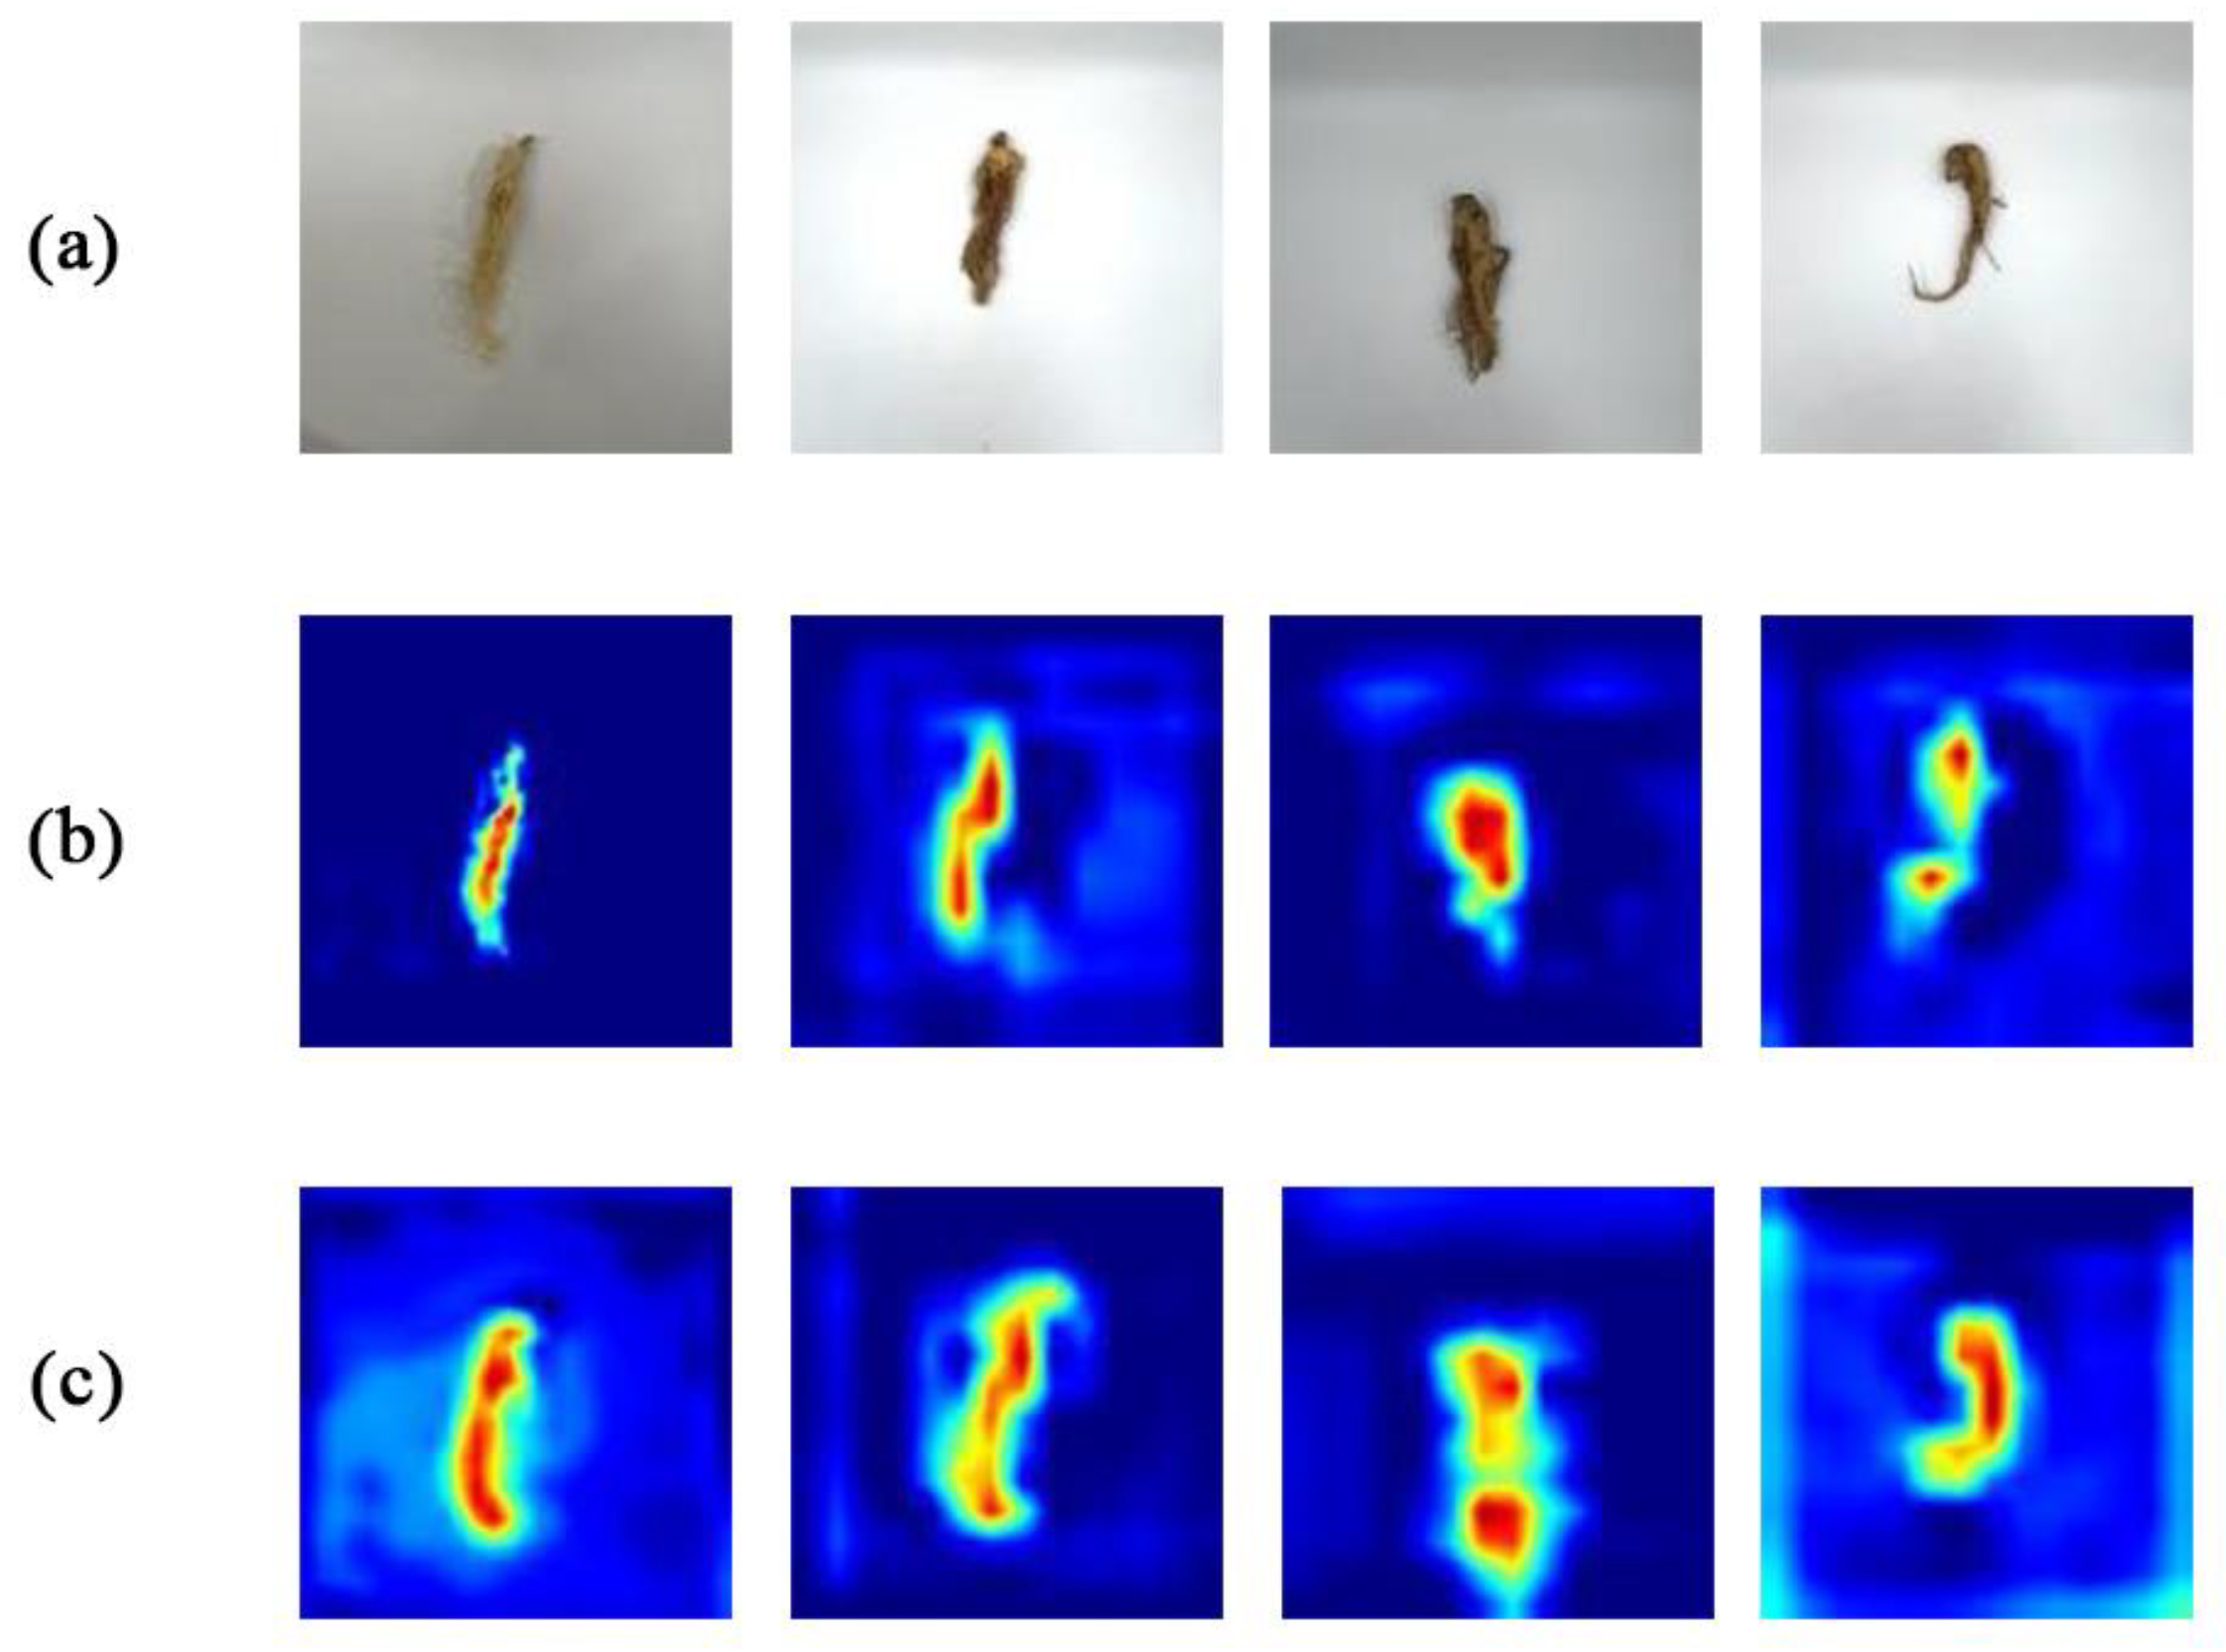
Furthermore, the visualization images obtained by the tool Grad-Cam [
34] provided a more intuitive view of the regions of the network’s attention to the feature maps before and after the addition of the ECA mechanism.
Figure 8 clearly demonstrates how effectively the ECA mechanism module we introduced could capture the ginseng features. It overcame the conflict between performance and complexity by using fewer parameters. To enhance the feature representation of the network model, it efficiently made use of the ability of convolutional neural networks to capture details about neighborhoods. The complex texture of ginseng and slight variations in appearance could also be used to effectively address the negative impact on experimental accuracy.
4.3. Effect of the Activation Function on the Model Performance
The selection of an activation function is also crucial during the training process, since it has a significant impact on how well the same model performs. During the experiment, we replaced the
Leaky ReLU activation function with three activation functions,
ReLU, Sigmoid, and Tanh. The accuracy and loss values employing the two activation functions Sigmoid and Tanh differed significantly from those obtained with
ReLU, as shown in
Table 6. In contrast to the
ReLU activation function, the
Leaky ReLU function showed an improvement in accuracy of 0.63 and a reduction in loss value of 0.023. There are two reasons for this result: (1) the
Leaky ReLU activation function could transmit negative weights, which makes the model more capable of pushing information; (2) the
Leaky ReLU activation function transmitted more detail information, such as texture, line, and color of ginseng, to extract feature detail information that was not easily extracted by the network, which led to a substantial improvement in model performance.
4.4. Effect of the Loss Function on the Model Performance
To investigate the effect of various loss functions on the model performance, we selected a cross-entropy loss function for comparison. Although the cross-entropy loss function convergence effect is very good, but it still has limitations: in real applications, containing the complex background information of an image—such as, in this case, the fact that the number of ginseng pixels was much smaller than the number of background pixels—can lead to prevailing background information in the cross-entropy loss function composition; therefore, the network model is clearly biased, resulting in a decline in recognition effect. As can be seen in
Table 7, the accuracy of the model utilizing the focal loss function increased to some extent both before and after the improvement, with a significant decrease in the loss values. This indicated that the introduction of a focal loss function could adequately address the problem of sample imbalance in the dataset and has a positive influence on the final classification of the model.
4.5. Model Evaluation
In image classification, the prediction results of a classification model are frequently represented as a confusion matrix, from which the metrics Accuracy, Recall, and Precision are derived:
where
(true positive) is the number of ginseng specimens accurately identified,
(false positive) is the number of ginseng specimens incorrectly identified,
(false negative) is the number of ginseng specimens identified as other types of ginseng, and
(true negative) is the number of other ginseng specimens accurately identified.
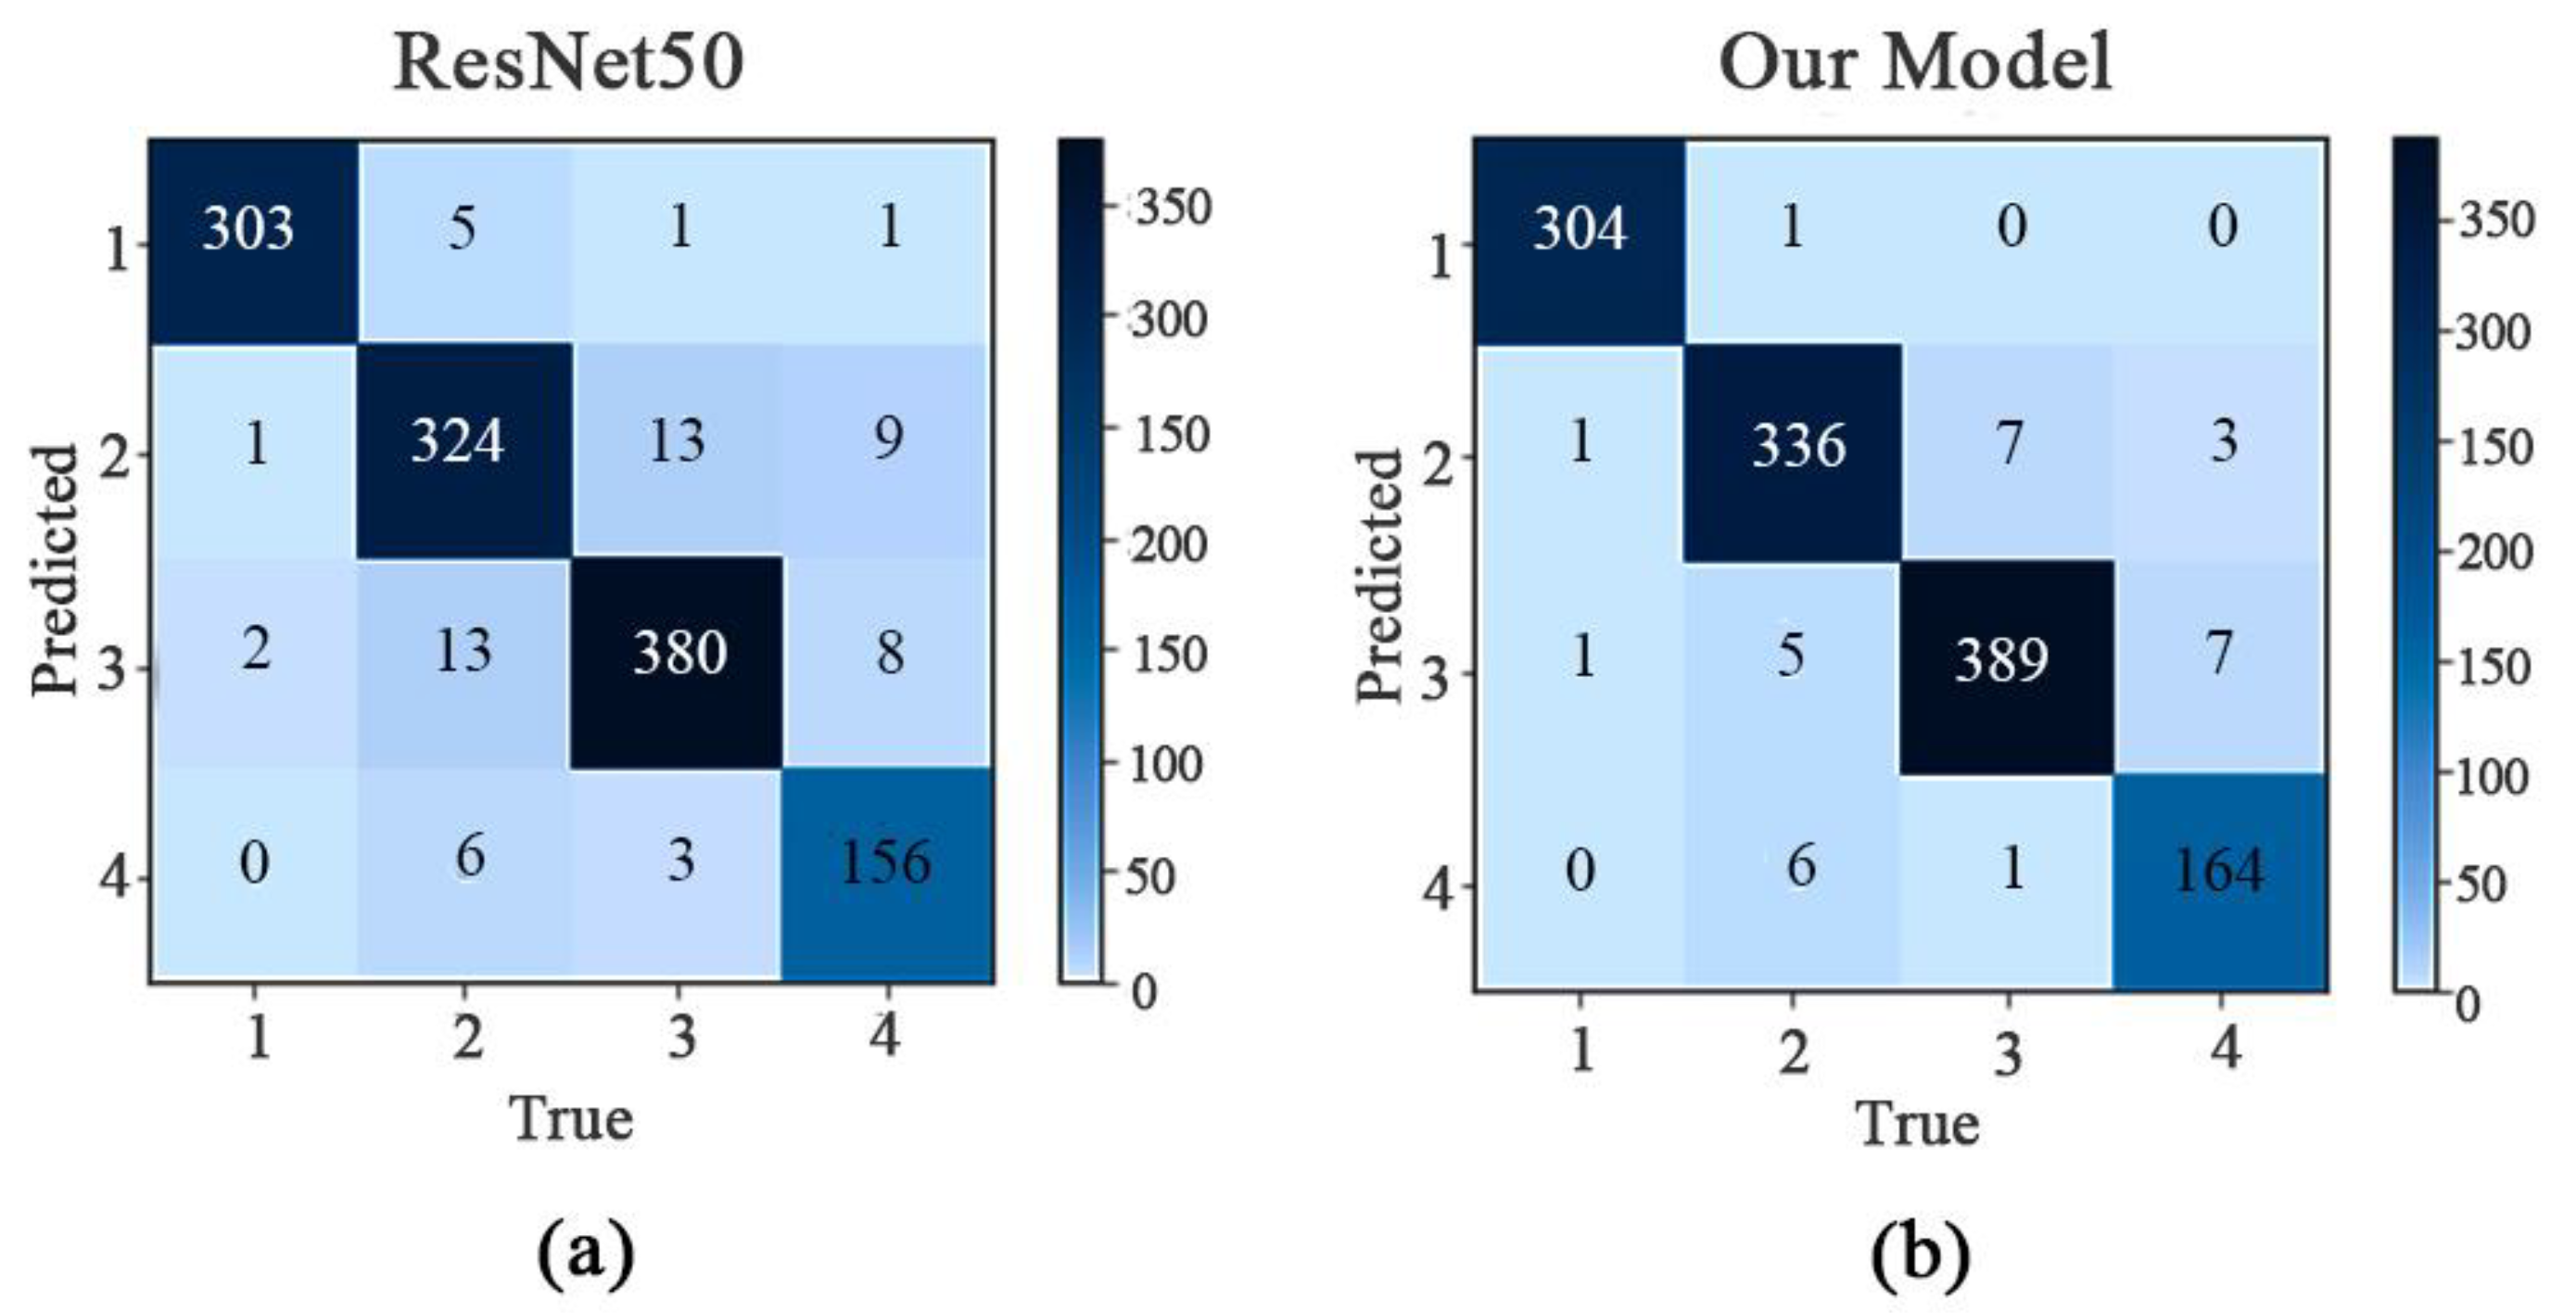
In the confusion matrix in
Figure 9, 1 represents the principal ginseng, 2 the first-class ginseng, 3 the second-class ginseng, and 4 the inferior ginseng; the horizontal coordinates represent the true category, and the vertical coordinates represent the predicted category. According to the confusion matrix in
Figure 9, the ResNet50 model has an overall accuracy of 94.94% for the test set, an overall recall of 94.37%, and an accuracy of 94.99%. The overall accuracy of our proposed model’s test set was 97.39%, while its overall recall was 97.03%, and its accuracy was 97.29%.
In
Table 8, the improved model enhanced the recall of all four types of ginseng to different degrees compared to the original model. However, the model still showed a large error in the identification of “inferior” ginseng; thus, improving the identification rate of inferior ginseng will be the focus of our future research.
5. Discussion
Ginseng is a traditional Chinese medicine also used as food and is also a common health care medicine, very appreciated by people. The identification of the quality of ginseng is therefore of paramount importance and is an important area of concern for the majority of researchers in this field, today. The traditional methods of identifying the appearance and quality of ginseng do not offer advantages in the age of artificial intelligence; therefore, after learning about the achievements of convolutional neural networks in the field of image processing, we decided to use ResNet50 as a base model to improve the evaluation of ginseng quality based on the small differences in features and details found in ginseng plants of different levels of quality. However, as can be seen from the confusion matrix with the original model, inferior ginseng had the lowest recognition accuracy, which also reflects the need to further improve the model’s ability to extract features in order to provide better recognition results when using a ginseng dataset with highly similar specimens. We subjected the improved model to multiple ablation experiments on the ginseng dataset, and the results showed that the improved ResNet50 outperformed other models mainly in terms of accuracy and loss values and offered greater advantages in terms of convergence speed and stability; it also showed a slightly faster training time per round than the other models. The model performance was further improved with a recognition accuracy of 97.39%. We also proved through experiments that the method could improve the identification accuracy without damaging the appearance of the ginseng specimens and basically met the identification needs.
6. Conclusions
The focus of our future research is on the further optimization of this model structure, with reference to the needs of realistic applications, focusing on reducing the weight of the model so that it could still achieve effective classification tasks with fewer parameters. As this study was only about the classification of white ginseng specimens of different quality, we will next construct a dataset for ginseng from different origins and different years to analyze the effect of the appearance characteristics of ginseng from different backgrounds on its classification. In addition, we will deploy the model on mobile devices for use in public promotion, market supervision, and industrial production. We will make it easier and faster for people to identify the quality of ginseng, thus improving public awareness, market supervision, and industrial production efficiency. This will provide a better solution to the problem of identifying the appearance of ginseng quality in theory and practice.
In this paper, the traditional ResNet50 network was improved according to the characteristics of ginseng. Our conclusions are as follows.
First of all, we constructed a ginseng dataset and classified the data to identify samples of four different quality levels: principal, first-class, second-class, and inferior ginseng. Data augmentation was then performed on the dataset to extend it. Then, we replaced the traditional activation function ReLU with the Leaky ReLU activation function to enhance the expressiveness of the model. We also introduced the ECA mechanism module on the residual block to increase the model’s sensitivity to ginseng pixels and better capture the ginseng specimens’ features. Additionally, the focal loss function was introduced to balance the dataset, and the idea of transfer learning was used to train the model. Finally, our proposed model showed greater advantages in different aspects compared to the classical convolutional neural network models Vgg16, GoogLeNet, ResNet50, and Densenet121. Many comparison experiments clearly showed that the method proposed in this paper had a beneficial impact on the model performance. Compared with the original model, the accuracy and loss value of the improved model were the best. In addition, with the significant improvement of the model performance indicators, the accuracy and overall recall rate were also improved. These results also validated the effectiveness and feasibility of the improvements to the original model. In future studies, we plan to further optimize the model and combine it with a mobile terminal to provide technical support for ginseng appearance quality recognition.
Author Contributions
Conceptualization, W.L. and D.L.; methodology, D.L. and X.P.; software, D.L. and X.P.; validation, D.L., X.P. and Y.L.; formal analysis, W.L. and L.Z.; investigation, Y.L.; resources, D.L. and X.P. and W.L.; data curation, X.P. and Y.L.; writing—original draft preparation, L.M., W.L., D.L., X.P., Y.L. and L.Z.; writing—review and editing, L.M., W.L., D.L., X.P., Y.L. and L.Z.; visualization, L.M., W.L., D.L., X.P., Y.L. and L.Z.; supervision, D.L.; project administration, D.L.; funding acquisition, L.M., W.L., D.L. and L.Z. All authors have read and agreed to the published version of the manuscript.
Funding
This research was funded by the National Natural Science Foundation of China (No. 61801439); the Department of Science and Technology of Jilin Province (20210204050YY); Jilin Provincial Education Department Scientific Research Project (JJKH20210747KJ); Jilin Provincial Environmental Protection Department Project (202107); Jilin Provincial Middle and Young Leaders Team and Innovative Talents Support Program (No. 20200301037RQ).
Institutional Review Board Statement
Not applicable.
Informed Consent Statement
Not applicable.
Data Availability Statement
All relevant data are included in the manuscript. Raw images are available on request from the corresponding author.
Conflicts of Interest
The authors declare no conflict of interest.
References
- Li, F.; Bao, H. Herbal Textual Research and progress on pharmacological actions of Ginseng Radix et Rhizoma. Ginseng Res. 2017, 29, 43–46. [Google Scholar]
- Liu, W.; Li, W. Review on industrialization development status and prospect of panax ginseng processing. J. Jilin Agric. Univ. 2022, 1–11. [Google Scholar]
- Dai, Q.; Li, L.; Xu, G.; Tang, D.; Ma, H. Study on the Correlation between Morphological Characteristics and Chemical Constituents of GardenGinseng, Mountain Transplanted Ginseng and Mountain-grown Ginseng Based on “Evaluating Qualityfrom Morphological Characteristics”. China Pharm. 2020, 31, 650–655. [Google Scholar]
- Li, J.; Wei, X.; Wan, G.; Yang, X.; Shi, J.L. Historical Evolution and Modern Research Progress of Quality Evaluation Based onCharacter Identification of Traditional Chinese Medicinal Materials. Chin. J. Exp. Tradit. Med. 2021, 27, 189–196. [Google Scholar]
- Liu, T.-R.; Jin, Y.; Meng, H.-B.; Zhao, Y.-Y.; Zhou, J.-H.; Yuan, Y.; Huang, L.-Q. Biological research of color and quality evaluation in”quality discriminationby character”of Chinese medicine. China J. Chin. Mater. Med. 2020, 45, 4545–4554. [Google Scholar]
- Wang, H.; Tian, Y.; Liu, D.; Ma, X.; Zhan, Z.; Huang, L.; Du, H. History, Development and Application of the Traditional Chinese Medicine ”Quality Evaluation ThroughMorphological Identification”. J. Chin. Med. Mater. 2021, 44, 513–519. [Google Scholar]
- Li, M.; Zhang, X.; Liu, S.; Chen, X.; Huang, L.; Shi, T.; Yang, R.; Liu, S.; Zheng, F. Partly Interpretable Machine Learning Method of Ginseng Geographical Origins Recognition and Analysis by Hyperspectral Measurements. Spectrosc. Spectr. Anal. 2022, 42, 1217–1221. [Google Scholar]
- Geng, L.; Huang, Y.; Guo, Y. Apple variety classification method based on fusion attention mechanism. Trans. Chin. Soc. Agric. Mach. 2022, 53, 304–310 + 369. [Google Scholar]
- Lecun, Y.; Bottou, L.; Bengio, Y.; Haffner, P. Gradient-based learning applied to document recognition. Proc. IEEE 1998, 86, 2278–2324. [Google Scholar] [CrossRef] [Green Version]
- Krizhevsky, A.; Sutskever, I.; Hinton, G.E. ImageNet classification with deep convolutional neural networks. Commun. ACM 2017, 60, 84–90. [Google Scholar] [CrossRef] [Green Version]
- Simonyan, K.; Zisserman, A. Very deep convolutional networks for large-scale image recognition. arXiv 2014, arXiv:1409.1556. [Google Scholar]
- Szegedy, C.; Liu, W.; Jia, Y.; Sermanet, P.; Reed, S.; Anguelov, D.; Erhan, D.; Vanhoucke, V.; Rabinovich, A. Going Deeper with Convolutions. In Proceedings of the IEEE Conference on Computer Vision and Pattern Recognition, Boston, MA, USA, 7–12 June 2015; pp. 1–9. [Google Scholar]
- He, K.; Zhang, X.; Ren, S.; Sun, J. Deep Residual Learning for Image Recognition. In Proceedings of the IEEE Conference on Computer Vision and Pattern Recognition, Las Vegas, NV, USA, 27–30 June 2016; pp. 770–778. [Google Scholar]
- Huang, G.; Liu, Z.; Pleiss, G.; van der Maaten, L.; Weinberger, K.Q. Convolutional Networks with Dense Connectivity. IEEE Trans. Pattern Anal. Mach. Intell. 2022, 44, 8704–8716. [Google Scholar] [CrossRef] [Green Version]
- Dyrmann, M.; Karstoft, H.; Midtiby, H.S. Plant species classification using deep convolutional neural network. Biosyst. Eng. 2016, 151, 72–80. [Google Scholar] [CrossRef]
- Lee, S.H.; Chan, C.S.; Mayo, S.J.; Remagnino, P. How deep learning extracts and learns leaf features for plant classification. Pattern Recognit. 2017, 71, 1–13. [Google Scholar] [CrossRef] [Green Version]
- Liu, B.; Ding, Z.; Tian, L.; He, D.; Li, S.; Wang, H. Grape Leaf Disease Identification Using Improved Deep Convolutional Neural Networks. Front. Plant. Sci. 2020, 11, 1082. [Google Scholar] [CrossRef]
- Liu, W.; Zou, W.; Lu, Y.; Hu, W.; Liu, T. Research on image recognition of chinese medicinal materials based on transfer learning and model fusion. J. Hunan Univ. Chin. Med. 2022, 42, 809–814. [Google Scholar]
- Li, D.; Tang, P.; Zhang, L.; Lei, Y.; Liu, S. Genuine identification for Saposhnikovia divaricata based on improved DenseNet. Trans. Chin. Soc. Agric. Eng. 2022, 38, 276–285. [Google Scholar]
- He, J.; Shi, Y.; Liu, B.; He, D. External Quality Grading Method of Fuji Apple Based onDeep Learning. Trans. Chin. Soc. Agric. Mach. 2021, 52, 379–385. [Google Scholar]
- He, D.; Wang, P.; Niu, T.; Mao, Y.; Zhao, Y. Classification Model of Grape Downy Mildew Disease Degree in FieldBased on Improved Residual Network. Trans. Chin. Soc. Agric. Mach. 2022, 53, 235–243. [Google Scholar]
- Maas, A.L.; Hannun, A.Y.; Ng, A.Y. Rectifier Nonlinearities Improve Neural Network Acoustic Models. In Proceedings of the 30th International Conference on International Conference on Machine Learning, Atlanta, GA, USA, 16–21 June 2013; JMLR: Cambridge, MA, USA, 2013; p. 3. [Google Scholar]
- Zhu, X.; Cheng, D.; Zhang, Z.; Lin, S.; Dai, J. An Empirical Study of Spatial Attention Mechanisms in Deep Networks. In Proceedings of the IEEE/CVF International Conference on Computer Vision, Seoul, Republic of Korea, 27 October–2 November 2019; pp. 6688–6697. [Google Scholar]
- Yan, H.; Liu, Z.; Cui, Q.; Hu, Z. Multi-target detection based on feature pyramid attention and deep convolution network for pigs. Trans. Chin. Soc. Agric. Eng. 2020, 36, 193–202. [Google Scholar]
- Choi, H.; Cho, K.; Bengio, Y. Fine-grained attention mechanism for neural machine translation. Neurocomputing 2018, 284, 171–176. [Google Scholar] [CrossRef] [Green Version]
- Hu, J.; Shen, L.; Sun, G. Squeeze-and-Excitation Networks. In Proceedings of the IEEE Conference On Computer Vision and Pattern Recognition, Salt Lake City, UT, USA, 18–23 June 2018; pp. 7132–7141. [Google Scholar]
- Wang, Q.; Wu, B.; Zhu, P.; Li, P.; Zuo, W.; Hu, Q. Supplementary Material for ‘ECA-Net: Efficient Channel Attention for Deep Convolutional Neural Networks. In Proceedings of the 2020 IEEE/CVF Conference on Computer Vision and Pattern Recognition, Seattle, WA, USA, 13–19 June 2020; IEEE: Piscataway, NJ, USA; pp. 13–19. [Google Scholar]
- Lin, T.-Y.; Goyal, P.; Girshick, R.; He, K.; Dollár, P. Focal Loss for Dense Object Detection. In Proceedings of the IEEE International Conference on Computer Vision, Venice, Italy, 22–29 October 2017; pp. 2980–2988. [Google Scholar]
- De Boer, P.-T.; Kroese, D.P.; Mannor, S.; Rubinstein, R.Y. A tutorial on the cross-entropy method. Ann. Oper. Res. 2005, 134, 19–67. [Google Scholar] [CrossRef]
- Pan, S.J.; Yang, Q. A Survey on Transfer Learning. IEEE Trans. Knowl. Data Eng. 2010, 22, 1345–1359. [Google Scholar] [CrossRef]
- Zhang, R.; Li, Z.; Hao, J.; Sun, L.; Li, H.; Han, P. Image recognition of peanut pod grades based on transfer learning with convolutional neural network. Trans. Chin. Soc. Agric. Eng. 2020, 36, 171–180. [Google Scholar]
- Woo, S.; Park, J.; Lee, J.-Y.; Kweon, I.S. CBAM: Convolutional Block Attention Module. In Proceedings of the European Conference on Computer Vision (ECCV), Munich, Germany, 8–14 September 2018; pp. 3–19. [Google Scholar]
- Li, X.; Wang, W.; Hu, X.; Yang, J. Selective Kernel Networks. In Proceedings of the IEEE/CVF Conference on Computer Vision and Pattern Recognition, Long Beach, CA, USA, 15–20 June 2019; pp. 510–519. [Google Scholar]
- Selvaraju, R.R.; Cogswell, M.; Das, A.; Vedantam, R.; Parikh, D.; Batra, D. Grad-Cam: Visual Explanations from Deep Networks via Gradient-Based Localization. In Proceedings of the IEEE International Conference on Computer Vision, Venice, Italy, 22–29 October 2017; pp. 618–626. [Google Scholar]
Figure 1.
Ginseng (Panax ginseng C. A. Meye) dataset. (a) Different levels of ginseng images; (b) Image enhancement example diagram.
Figure 1.
Ginseng (Panax ginseng C. A. Meye) dataset. (a) Different levels of ginseng images; (b) Image enhancement example diagram.
Figure 2.
Residual block.
Figure 2.
Residual block.
Figure 3.
Comparison of the ReLU and Leaky ReLU functions.
Figure 3.
Comparison of the ReLU and Leaky ReLU functions.
Figure 4.
Structure of the Efficient Channel Attention Module.
Figure 4.
Structure of the Efficient Channel Attention Module.
Figure 5.
Adding the residual block structure of the ECA attention mechanism.
Figure 5.
Adding the residual block structure of the ECA attention mechanism.
Figure 6.
Structure of the improved model. (a) Backbone structure; (b) Conv_block; (c) ID_block. Note: Conv is Conv Layer; BatchNorm is Batch Normalization; ID_Block is identity block; Conv_block is convolution block; FC is full connection; ECA block is Efficient Channel Attention block.
Figure 6.
Structure of the improved model. (a) Backbone structure; (b) Conv_block; (c) ID_block. Note: Conv is Conv Layer; BatchNorm is Batch Normalization; ID_Block is identity block; Conv_block is convolution block; FC is full connection; ECA block is Efficient Channel Attention block.
Figure 7.
Identification results of each mode. (a) Model accuracy; (b) model loss.
Figure 7.
Identification results of each mode. (a) Model accuracy; (b) model loss.
Figure 8.
Visualization results of the thermal characteristic diagram of the new network before and after adding the ECA module. (a) Input image; (b) image before joining the ECA module; (c) image after adding the ECA module.
Figure 8.
Visualization results of the thermal characteristic diagram of the new network before and after adding the ECA module. (a) Input image; (b) image before joining the ECA module; (c) image after adding the ECA module.
Figure 9.
Confusion matrix before and after the model improvement. (a) ResNet50 confusion matrix; (b) our model confusion matrix. Note: 1 is principal; 2 is first-class; 3 is second-class; 4 is inferior. The x-axis is the real category, and the y-axis is the predicted category.
Figure 9.
Confusion matrix before and after the model improvement. (a) ResNet50 confusion matrix; (b) our model confusion matrix. Note: 1 is principal; 2 is first-class; 3 is second-class; 4 is inferior. The x-axis is the real category, and the y-axis is the predicted category.
Table 1.
Scoring criteria.
Table 1.
Scoring criteria.
| Project | Principal | First-Class | Second-Class |
|---|
| Rutabaga | Complete with rutabaga and ginseng (Panax ginseng C. A. Meye) fibrous roots | The rutabaga and ginseng fibrous roots are more complete | Rutabaga and ginseng with incomplete fibrous roots |
| Surface | Yellowish white or greyish yellow, without water embroidery or guttering | Yellowish white or greyish yellow, or with water rust or guttering | Yellowish white or greyish yellow with rust and guttering |
| Breakage Scar | None | Mild | Have |
| Branching out | No small ginseng or ginseng whiskers are allowed to be caught by those with branching roots, no tied tails or lightly tied tails or tied tails |
| Section | Section pale yellowish white, pink |
| Texture | Hard, powdery, no hollow |
| Odor | Unique aroma, taste slightly bitter, sweet |
| Main Root | Cylindrical |
| Insects Mildew Impurities | None |
Table 2.
Dataset partition.
Table 2.
Dataset partition.
| Level | Training Set Image | Verification Set Image |
|---|
| Principal | 1225 | 306 |
| First-class | 1396 | 348 |
| Second-class | 1589 | 397 |
| Inferior | 696 | 174 |
Table 3.
Model parameter settings.
Table 3.
Model parameter settings.
| Parameter | Set Up |
|---|
| Optimizer | Adam |
| Learning rate | 0.0001 |
| Weight decay | 0.0001 |
| Batch size | 32 |
| Epoch | 50 |
| Loss function | Focal Loss |
Table 4.
Comparison of the experimental results of various models.
Table 4.
Comparison of the experimental results of various models.
| Model | Accuracy/% | Loss | Convergence/Epoch | Training Time per Round/s |
|---|
| VGG16 | 93.63 | 0.126 | 22 | 20 |
| GoogLeNet | 94.78 | 0.077 | 18 | 18 |
| ResNet50 | 94.94 | 0.066 | 15 | 22 |
| DenseNet121 | 95.51 | 0.057 | 12 | 25 |
| Our model | 97.39 | 0.035 | 5 | 19 |
Table 5.
Comparison of the results obtained with different attention mechanisms.
Table 5.
Comparison of the results obtained with different attention mechanisms.
| Model | Accuracy/% | Loss |
|---|
| No attention | 95.67 | 0.056 |
| SE | 96.41 | 0.054 |
| CBAM | 96.98 | 0.036 |
| SK | 92.82 | 0.075 |
| ECA | 97.39 | 0.035 |
Table 6.
Experimental comparison results of different activation functions.
Table 6.
Experimental comparison results of different activation functions.
| Activate Function | Accuracy/% | Loss |
|---|
| Sigmoid | 63.84 | 0.308 |
| Tanh | 75.76 | 0.216 |
| ReLU | 96.76 | 0.058 |
| LeakyReLU | 97.39 | 0.035 |
Table 7.
Experimental comparison of the results obtained with different loss functions.
Table 7.
Experimental comparison of the results obtained with different loss functions.
| Model | Loss Function | Accuracy/% | Loss |
|---|
| ResNet50 | Cross entropy Loss | 94.78 | 0.176 |
| Focal Loss | 94.94 | 0.066 |
| Our model | Cross entropy Loss | 97.22 | 0.119 |
| Focal Loss | 97.39 | 0.035 |
Table 8.
Recall and accuracy of ginseng classification by class before and after model improvement.
Table 8.
Recall and accuracy of ginseng classification by class before and after model improvement.
| Level | Model | Recall/% | Precision% |
|---|
| Principal | ResNet50 | 99.02 | 97.74 |
| Our model | 99.35 | 99.67 |
| First-class | ResNet50 | 93.10 | 93.37 |
| Our model | 96.56 | 96.83 |
| Second-class | ResNet50 | 95.72 | 94.29 |
| Our model | 97.98 | 96.77 |
| Inferior | ResNet50 | 89.66 | 94.55 |
| Our model | 94.25 | 95.91 |
| Publisher’s Note: MDPI stays neutral with regard to jurisdictional claims in published maps and institutional affiliations. |
© 2022 by the authors. Licensee MDPI, Basel, Switzerland. This article is an open access article distributed under the terms and conditions of the Creative Commons Attribution (CC BY) license (https://creativecommons.org/licenses/by/4.0/).


