Article

Identification of Genomic Loci Controlling Grain Macro and Micronutrient Variation in a Wild Barley (Hordeum vulgare spp. spontaneum) Diversity Panel

by
Jillian A. Abendroth
1,
Ahmad H. Sallam
2,
Brian J. Steffenson
2,
Marcus A. Vinje
1,
Ramamurthy Mahalingam
1,* and
Jason G. Walling
1,*
1
USDA-ARS, Cereal Crops Research Unit, 502 Walnut Street, Madison, WI 53726, USA
2
Department of Plant Pathology, University of Minnesota, St. Paul, MN 55108, USA
*
Authors to whom correspondence should be addressed.
Agronomy 2022, 12(11), 2839; https://doi.org/10.3390/agronomy12112839
Submission received: 1 October 2022 / Revised: 27 October 2022 / Accepted: 4 November 2022 / Published: 14 November 2022
(This article belongs to the Topic Plants Nutrients)

Abstract

:
Nutrient deficiencies in humans are problematic on a global scale but are more prevalent in regions where high-quality and nutrient-dense foods are scarce. Developing nutrient-rich crops that thrive in these regions of the world would help alleviate the disparity. We leveraged the wild barley (Hordeum vulgare spp. spontaneum) Diversity Collection (WBDC) (N = 232) to characterize the variation in seed macronutrient (P, K, Ca, and Mg) and micronutrient (B, Cu, Fe, Mn, and Zn) contents found in this subspecies and to reveal chromosomal regions associated with these traits. Most micro- and macronutrients displayed variation in the WBDC and, except for boron and phosphorous, had a modest level of heritability (>0.5). Variation due to environment was significant (p < 0.001) for each element, except iron, and genotype was significant for all the tested nutrients, except boron. Thirty-seven marker–trait associations (MTAs) were detected for three (K, Ca, and Mg) of the four macro- and four (Cu, Fe, Mn, and Zn) of the five micronutrients. Several compelling candidate genes harbored within MTAs were also identified, including ABC transporters, NAC transcription factors, and bZIP transcription factors.

1. Introduction

Barley (Hordeum vulgare spp. vulgare) is a diploid, selfing cereal crop of the Poaceae family first cultivated in the Fertile Crescent. Since its domestication approximately 10,000 years ago [1], barley has been grown in many parts of the world, with the average global annual production estimated to be 151 million MT [2]. While the US, the European Union, and other Western cultures utilize barley for animal feed and malt production, elsewhere, it is a primary dietary staple. The peoples of Northern Africa, mountainous East Asia, and the Andean region rely heavily on barley as a food source since other cereals fail to yield substantively in the rugged climates [3]. Generally, seed composition ranges between 53 and 61% carbohydrates, 12 and 17% protein, 2 and 4% lipids, and 2 and 4% nonorganic minerals [4]. The biochemical properties of barley kernels are dependent on genotypic and environmental factors. Given its beneficial value with high dietary fiber content, innate tolerance for harsh environmental conditions, and established use as a direct and indirect component in the global diet, barley is in an advantageous position for nutritional improvement.
The Food and Agriculture Organization (FAO) estimates that 418 million people in Asia, 282 million people in Africa, and 60 million people from Latin America and the Caribbean are plagued by undernourishment. Globally, the number of undernourished individuals is estimated to be between 720 and 811 million [5]. Undernourishment, as defined by the Global Hunger Index (GHI), is a deficiency in calories, energy, protein, or essential vitamins and minerals [6]. There are 15 mineral elements considered essential for human health, including Calcium (Ca), Chloride (Cl), Chromium (Cr), Cobalt (Co), Copper (Cu), Fluoride (F), Phosphorus (P), Potassium (K), Selenium (Se), Sulfur (S), Magnesium (Mg), Manganese (Mn), Iron (Fe), Iodine (I), and Zinc (Zn). Extended inadequate consumption of any one element can negatively impact human health [7].
Adequate Ca intake, especially during adolescence, is critical to reducing the rate of bone loss, rickets, and osteoporosis. In contrast, lower intake provokes health risks, such as hypocalcemia, hypertension, colorectal cancer, bone weakness, and fractures accompanied by aging [8,9,10]. Mg is the fourth most abundant mineral in the human body, with an estimated daily requirement of 265 and 350 mg for adult females and males, respectively [11]. Mg serves as a key cofactor for more than 300 enzymes, playing a pivotal role in protein synthesis, glucose metabolism, and blood pressure regulation [12]. Mg deficiency is associated with insulin resistance, cardiovascular diseases, and obesity [12,13]. Mn is considered a trace element in human diets, although diets deficient in this micronutrient are generally rare. Despite the paucity of cases, Mn provides antioxidant properties and has been attributed to strong bone development. The reduction potential of Cu and Fe ions allows them to frequently serve in crucial roles of electron receptors, as in the electron transport chain during photosynthesis and cellular respiration [14]. While both micronutrients are undoubtedly essential to life, persistent inadequate Fe consumption negatively impacts human health.
Insufficient Fe intake results in the most widespread nutrient deficiency globally, impacting 66–80% of the population [15]. The resulting anemia has been reported in 1.2 billion cases globally, a sixth of the total population [16]. Iron deficient anemia is one of the top five causes of disability and is a global health priority of the World Health Organization (WHO) [17]. Fe is one of the five nutrient deficiencies reported as “hidden hunger”, the others being Zn, Se, I, and Vitamin A. Lacking these minerals and/or vitamins dramatically impacts an individual’s health and are reflected in the 65% of childhood deaths worldwide due to hidden hunger [15]. In total, 2 billion (>25% of the global population) are estimated to be negatively impacted by Fe and Zn deficiencies. As a principal ion in protein composition, Zn serves multiple roles as a protein modifier, an enzyme activator, an RNA regulator, and a direct inducer of gene expression. Insufficient human consumption of Zn is known to negatively impact the epidermal, gastrointestinal, central nervous, immune, skeletal, and reproductive organ systems [18]. Lack of Zn is especially impactful on the growth and development of children. Ultimately, prolonged, and severe Zn deficiency is fatal, resulting in acute interest by the scientific and humanitarian communities for methods of improved Zn delivery.
Furthermore, the lack of any one micronutrient can negatively impact crop growth and yield, an indirect impact of nutrient deficiency on human health. Ca plays an essential role in cell wall structure, plant architecture, quality, and yield formation, while its deficiency makes the plant more sensitive to biotic and abiotic stresses [9]. Mg deficiency in plants leads to stunted growth and reduced yield. Since more than 35% of Mg is in chloroplasts, chlorosis, and leaf yellowing are common symptoms of its deficiency [19]. Mg is released from the roots to chelate the excess aluminum in the soil, thus minimizing Al toxicity to the plants [20]. In common bean, the Mg concentration was 0.33–1.52 mg kg−1 [21]. B is a micronutrient critical for plant growth and defense that can negatively affect plant growth when deficient but can also accumulate to levels toxic to the plant. B is easily taken up by roots, and elevated grain B levels are found in regions with high levels of this micronutrient in the soil and irrigation water [22]. Genetic factors controlling B assimilation and sensitivity have been described in several plants, including maize [23], barley [24], rice [25], and brassica [26]. Major intrinsic factor protein (MIF) and BOR transporters, two transporters common to most plants, have been shown to control B uptake and transport, and their modulation of source–sink redistribution has been attributed to the maintenance of B within subtoxic levels of accumulation [27,28]. In plants, Mn is a critical component of several classes of enzymes, including superoxide dismutases (SODs) and oxalate oxidases. Furthermore, it can modulate the activation of enzymes in the tricarboxylic acid cycle and shikimic acid pathway [29]. When barley is grown in soils depleted in Mn, genotypes with naturally higher levels of grain Mn yield more grain per acre compared to genotypes with low grain Mn [30]. Mn deficiency can significantly affect development and plant structure, including a decrease in lignin content [31], increases in leaf chlorosis, and an overall decrease in stress tolerance [32]. Lack of Cu or Fe leads to chlorosis, decreased biomass, and potentially negatively impacts yield [33].
Nutrient accumulation in comestible material represents a significant challenge for agriculturalists, as it is not simply increasing caloric production but rather the quality of grains through mineral enrichment. Agricultural research seeks to address the complexity of nutrient deficiency through a multifaceted approach [34,35] that includes the utilization of soil additives, precision agriculture [36], conventional breeding, and biotechnological methodologies [37,38,39]. Ultimately, biofortification emphasizes the supplication of sufficient nutrients for plant growth and human consumption. Current research pertaining to biofortification emphasizes the micronutrients Fe and Zn in response to diet deficiencies globally. Utilization of biofortification has been reported for several important crops, including rice, wheat, maize, sweet potato, lentils, squash, and sorghum [40,41,42,43,44]. In barley, genome-wide association (GWA) studies have identified genomic regions associated with variable concentrations of micronutrients in grain samples. Three micronutrient Marker Trait Associations (MTAs) were recently identified in a spring barley population [45]. Seventy-six MTAs related to six micronutrients were reported by Detterbeck et al. 2019 [46], and fourteen associated with Fe and Zn were reported in a world barley collection [47]. An Ethiopian barley collection reported an MTA for zinc on the long arm of chromosome six [48]. Of note, these reports only examined the grain nutrient of landraces and cultivated barley. Thus, addressing grain nutrient content by examining the allelic diversity found in wild accessions is an exciting avenue of inquiry, given that wild relatives of cultivated cereal germplasm often possess considerable endogenous nutrient variation [34].
The wild barley diversity collection (WBDC) consists of 314 accessions of Hordeum vulgare spp. spontaneum previously described and utilized in identifying QTLs linked to disease resistance [49,50,51,52], vitamin E isoforms [53], and malt quality traits [54]. This population colocalizes with the FAO-identified African and Asian regions of undernourishment, making it a valuable resource to leverage for improving grain nutrient content. Within this paradigm, this project seeks to utilize a subset of the WBDC (232 lines: Fertile crescent: N = 174 (75%), Caucasus region: N = 9 (3.87%), N. Africa: N = 6 (2.58%), Central Asia: N = 34 (14.65%), and S. Central Asia: N = 9 (3.88%)) to: (1) examine the diversity of micro- and macro- nutrient contents in the WBDC, (2) assign MTA to genomic regions for each micro- and macro- nutrients, and (3) identify potential candidate genes within the MTA for use in crop biofortification.

2. Materials and Methods

2.1. Plant Material

The Wild Barley Diversity Collection (WBDC), H. vulgare spp. spontaneum, was grown in field conditions at UC Davis during the 2006–2007 and 2015–2016 field seasons [49,53,54]. Twenty seeds from each line of the WBDC were sown in hill plots during December 2006 and 2015, then harvested in May 2007 and 2016. Mature spikes from each line were harvested manually and threshed clean of all chaff, broken kernels, and aborted seeds. Of the 314 accessions, 297 accessions yielded sufficient samples in the two replicate experiments. Harvested and cleaned seeds from both replicate field trials were stored at 4 °C.

2.2. Micronutrient Analysis

Samples of the wild barley accessions were provided to the Research Analytical Laboratory (University of Minnesota, St. Paul, MN, USA) for micronutrient analysis. Seed samples were dried and ground in accordance with the North Central Region (NCR-13) and Association of Official Agricultural Chemists (AOAC) recommendations. The dry-ashing method described for Ethiopian and Eritrean barley landraces was used [48]. Briefly, all samples were ashed in a muffle furnace for 12 h at 485 °C. Then, the ash was dissolved in 5 mL of 20% HCl, followed by a dilution with 5 mL of deionized water. Elemental determinations were performed with a simultaneous multi-element inductively coupled plasma-optical emission spectrometer (ICP-OES) (Perkin Elmer Optima 3000 ICP-OES; Perkin Elmer, Waltham, MA, USA). The ICP-OES provides concentration assays for several elements, including B, Ca, Cu, Fe, K, Mg, Mn, P, and Zn. These nutrients were measured in both the 2006–07 and 2015–16 field samples. The analysis also included checks following the analytical laboratory’s quality control policy. Of the 297 samples, 232 were common and comprise the final data set on which computational analyses were performed.

2.3. Statistical Analysis

General statistics such as mean, standard deviation, error, and range were calculated using base R [55] for each micronutrient trait. Due to a skew, data were transformed using a cube root transformation [56]. Transformed data were then used to perform an Analysis of Variance (ANOVA). Broad-sense heritability was calculated using the equation H2 = Vg/(Vg + Ve), where Vg is the genetic variance, and Ve is the variance of the environment, as described in Sallam et al. 2017 [49]. For micronutrients within and across years, Pearson’s correlation coefficient was calculated and visualized using the R package corrplot [57]. Distributions were visualized in histograms and boxplots.

2.4. Genotyping Association Analysis

Genotypic data for each line of the WBDC were previously generated using a genotyping-by-sequencing (GBS) approach with reference to the barley reference genome, Morex v2 [49,58]. SNP data for this project were generated utilizing the barley reference genome, Morex v3 [59], reporting 62,654 SNP markers across the genome. The resulting data were analyzed and filtered using PLINK (https://www.cog-genomics.org/plink/ (accessed on 10 July 2022)) [60]. The success rate of SNP call was 94.19% and filtering for taxa and missing data at value ≥ 20% removed no individuals or SNP loci. Following filtering, 62,654 markers were utilized in the identification of Marker Trait Associations (MTAs), approached with both single and multiple loci models. Utilization of both methodologies enabled corroboration of results in and across years further limiting risks of false positives.
A mixed linear model (MLM), also known as the Q + K methodology [51,61], was utilized via the R package GWASpoly [62]. A multi-locus GWAS approach was also undertaken utilizing Fixed and random model Circulating Probability Unification (FarmCPU) [63] using the R package GAPIT (version 3) [64]. Briefly, a MLM accounts for multiple levels of relatedness within a studies population through inclusions for a population structure (Q) and kinship (K), preventing spurious association. FarmCPU employs the calculation and utilization of pseudo-quantitative trait nucleotides (QTNs) to identify functional associations, limiting false positives and kinship confounding through testing markers and cofactors simultaneously. The phenotypic variance explained by each MTA was calculated using the equation R2 = SSregression/SStotal, as described in Sallam et al., 2017 [49]. Manhattan plots for MTA data points across chromosomes for both years were generated. An initial cutoff of −log10 > 3.5 [65,66] (p ≤ 0.000316) was employed. To limit the risk of false positives, a stricter cutoff of −log10 > 4.79 (1/N, where N= number of SNPs) [67] (p ≤ 1.62 × 10⁻⁵) was used as a threshold for MTA significance.

2.5. Candidate Gene Identification

Candidate gene identification for each significant MTA was undertaken in a multi-step approach. A 1 Mb window (500 Kb up and downstream of SNP location) was selected to extract stable gene identifiers with the Plant Ensembl (IBSC v2) [68] barley database. Gene-stable IDs tagged with Gene Ontologies (GOs) were given special consideration. Specifically, ontologies associated with known nutrient-associated functions such as ion binding and transportation, DNA replication [69], electron transport chain proteins, chlorophyll biosynthesis [70], and regulatory genes, especially transcription factors, were of particular interest.

3. Results and Discussion

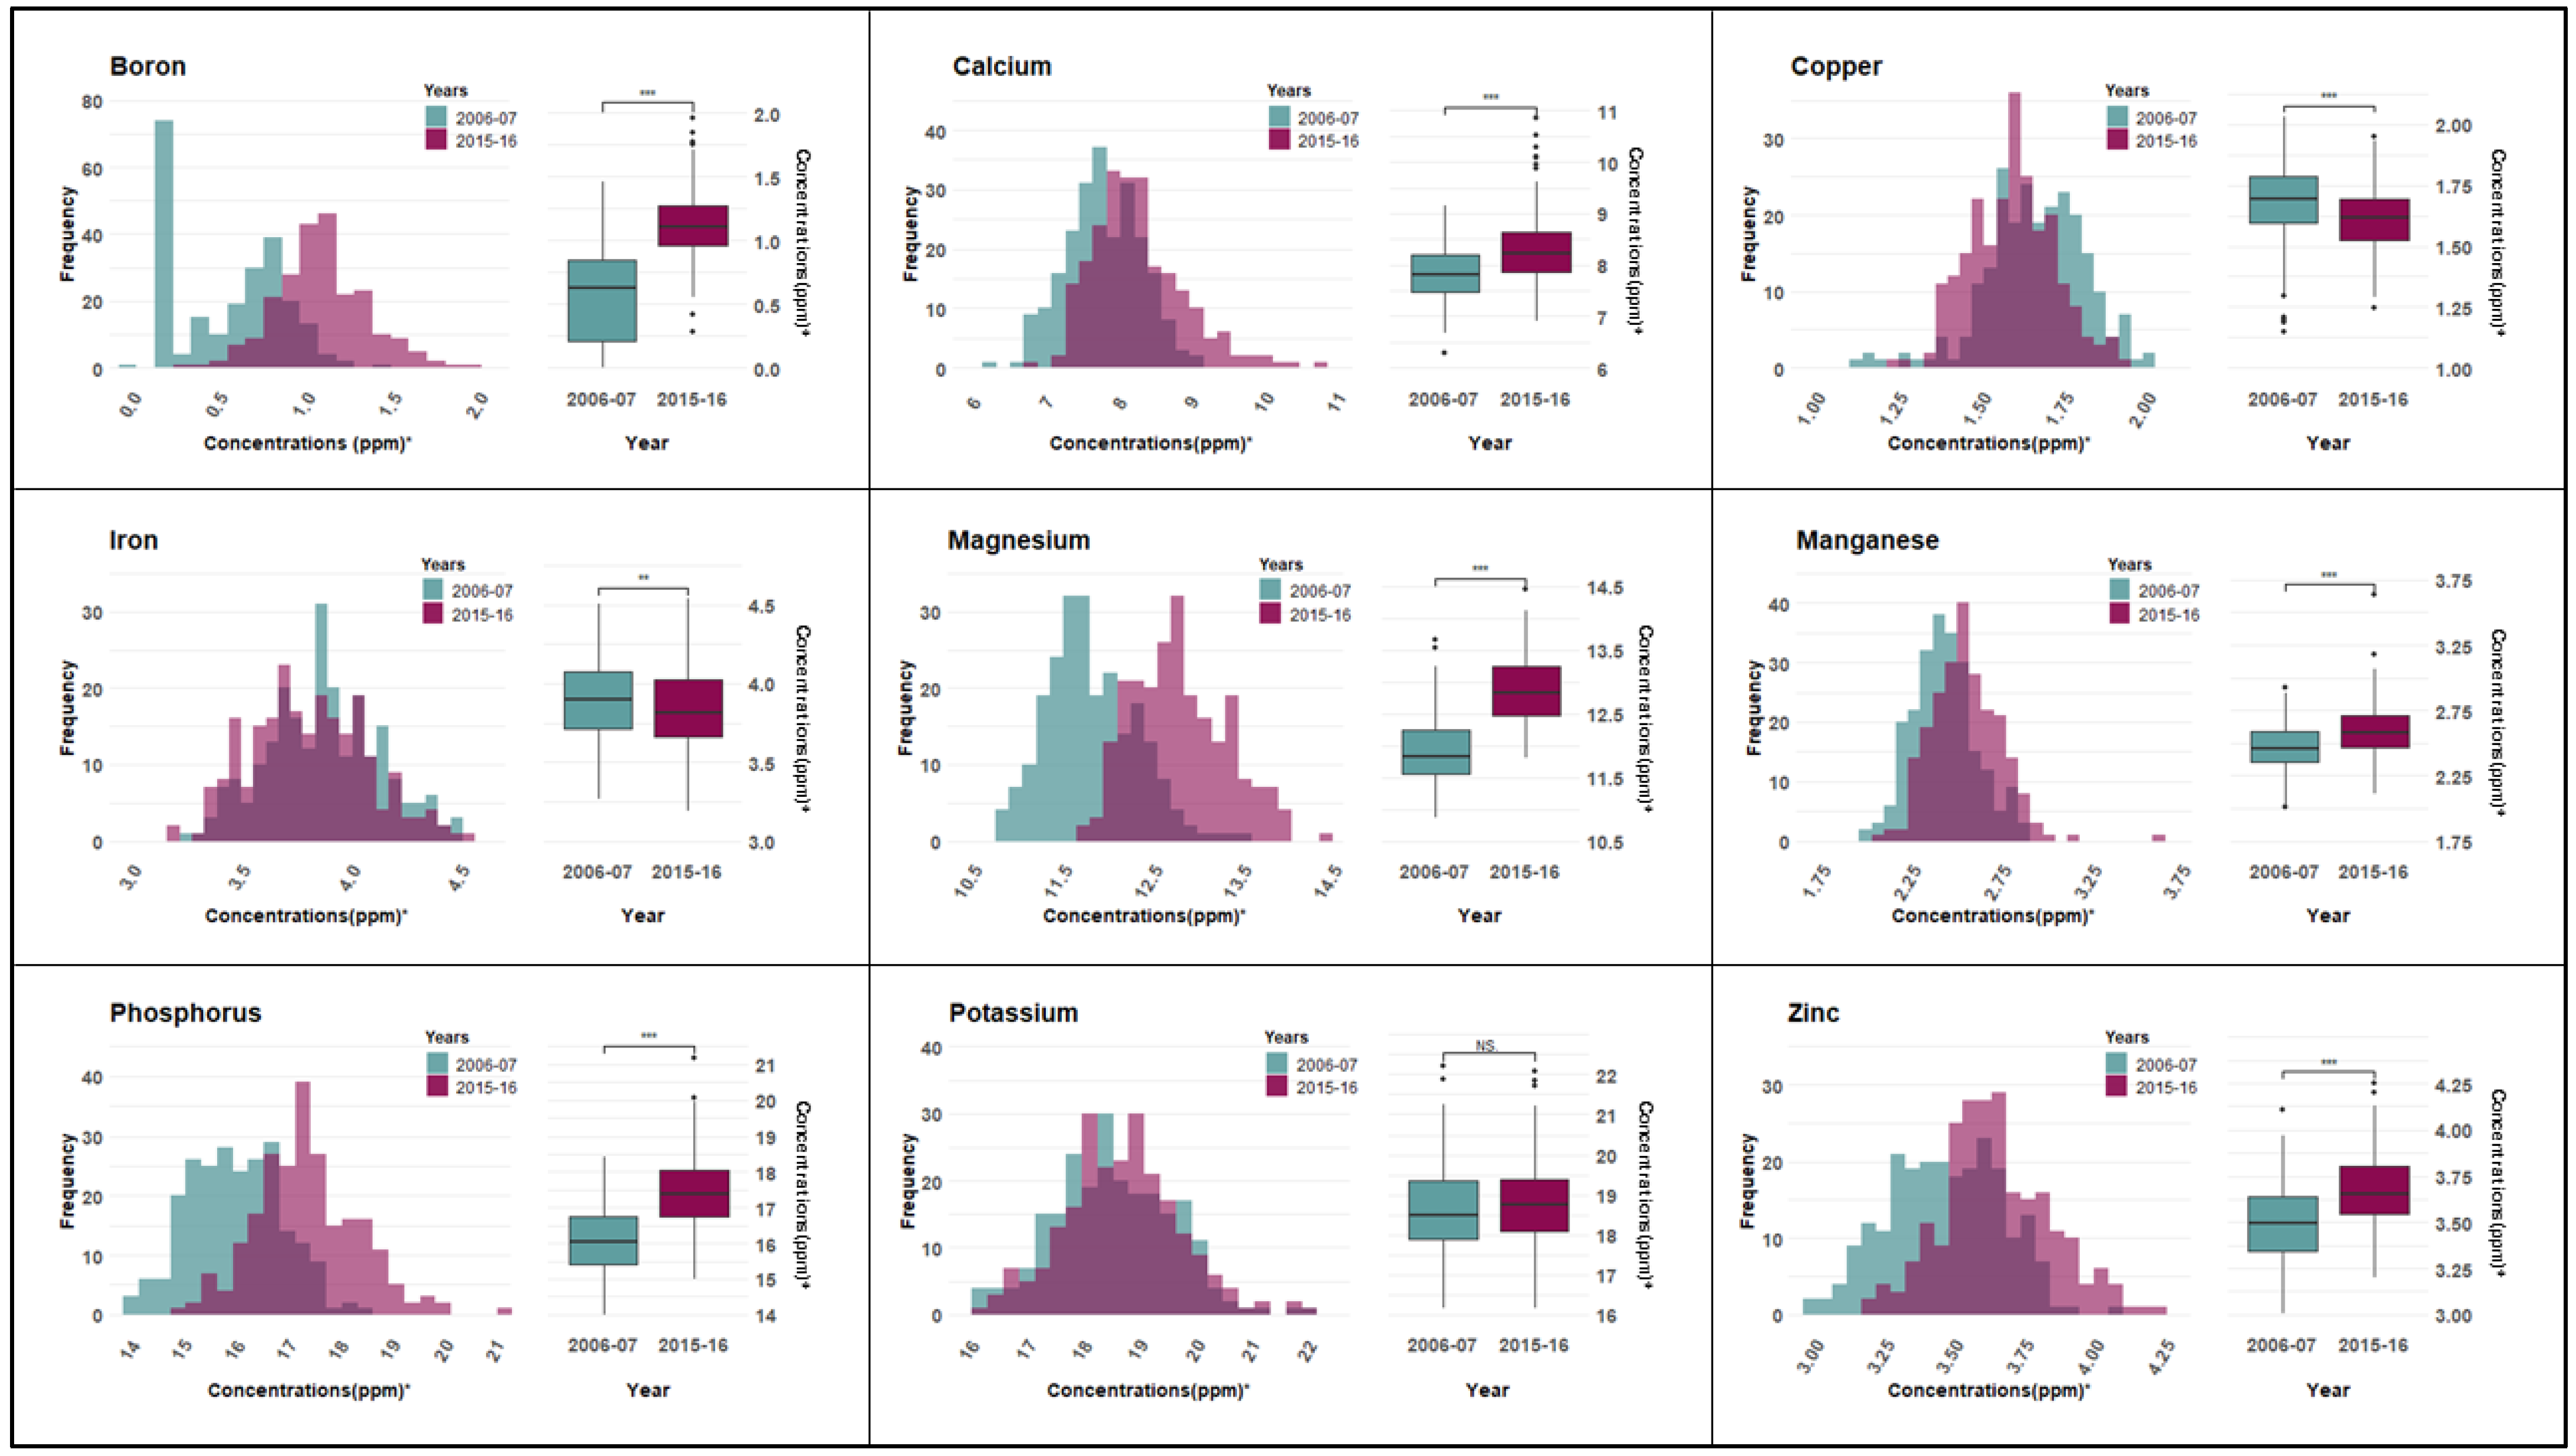
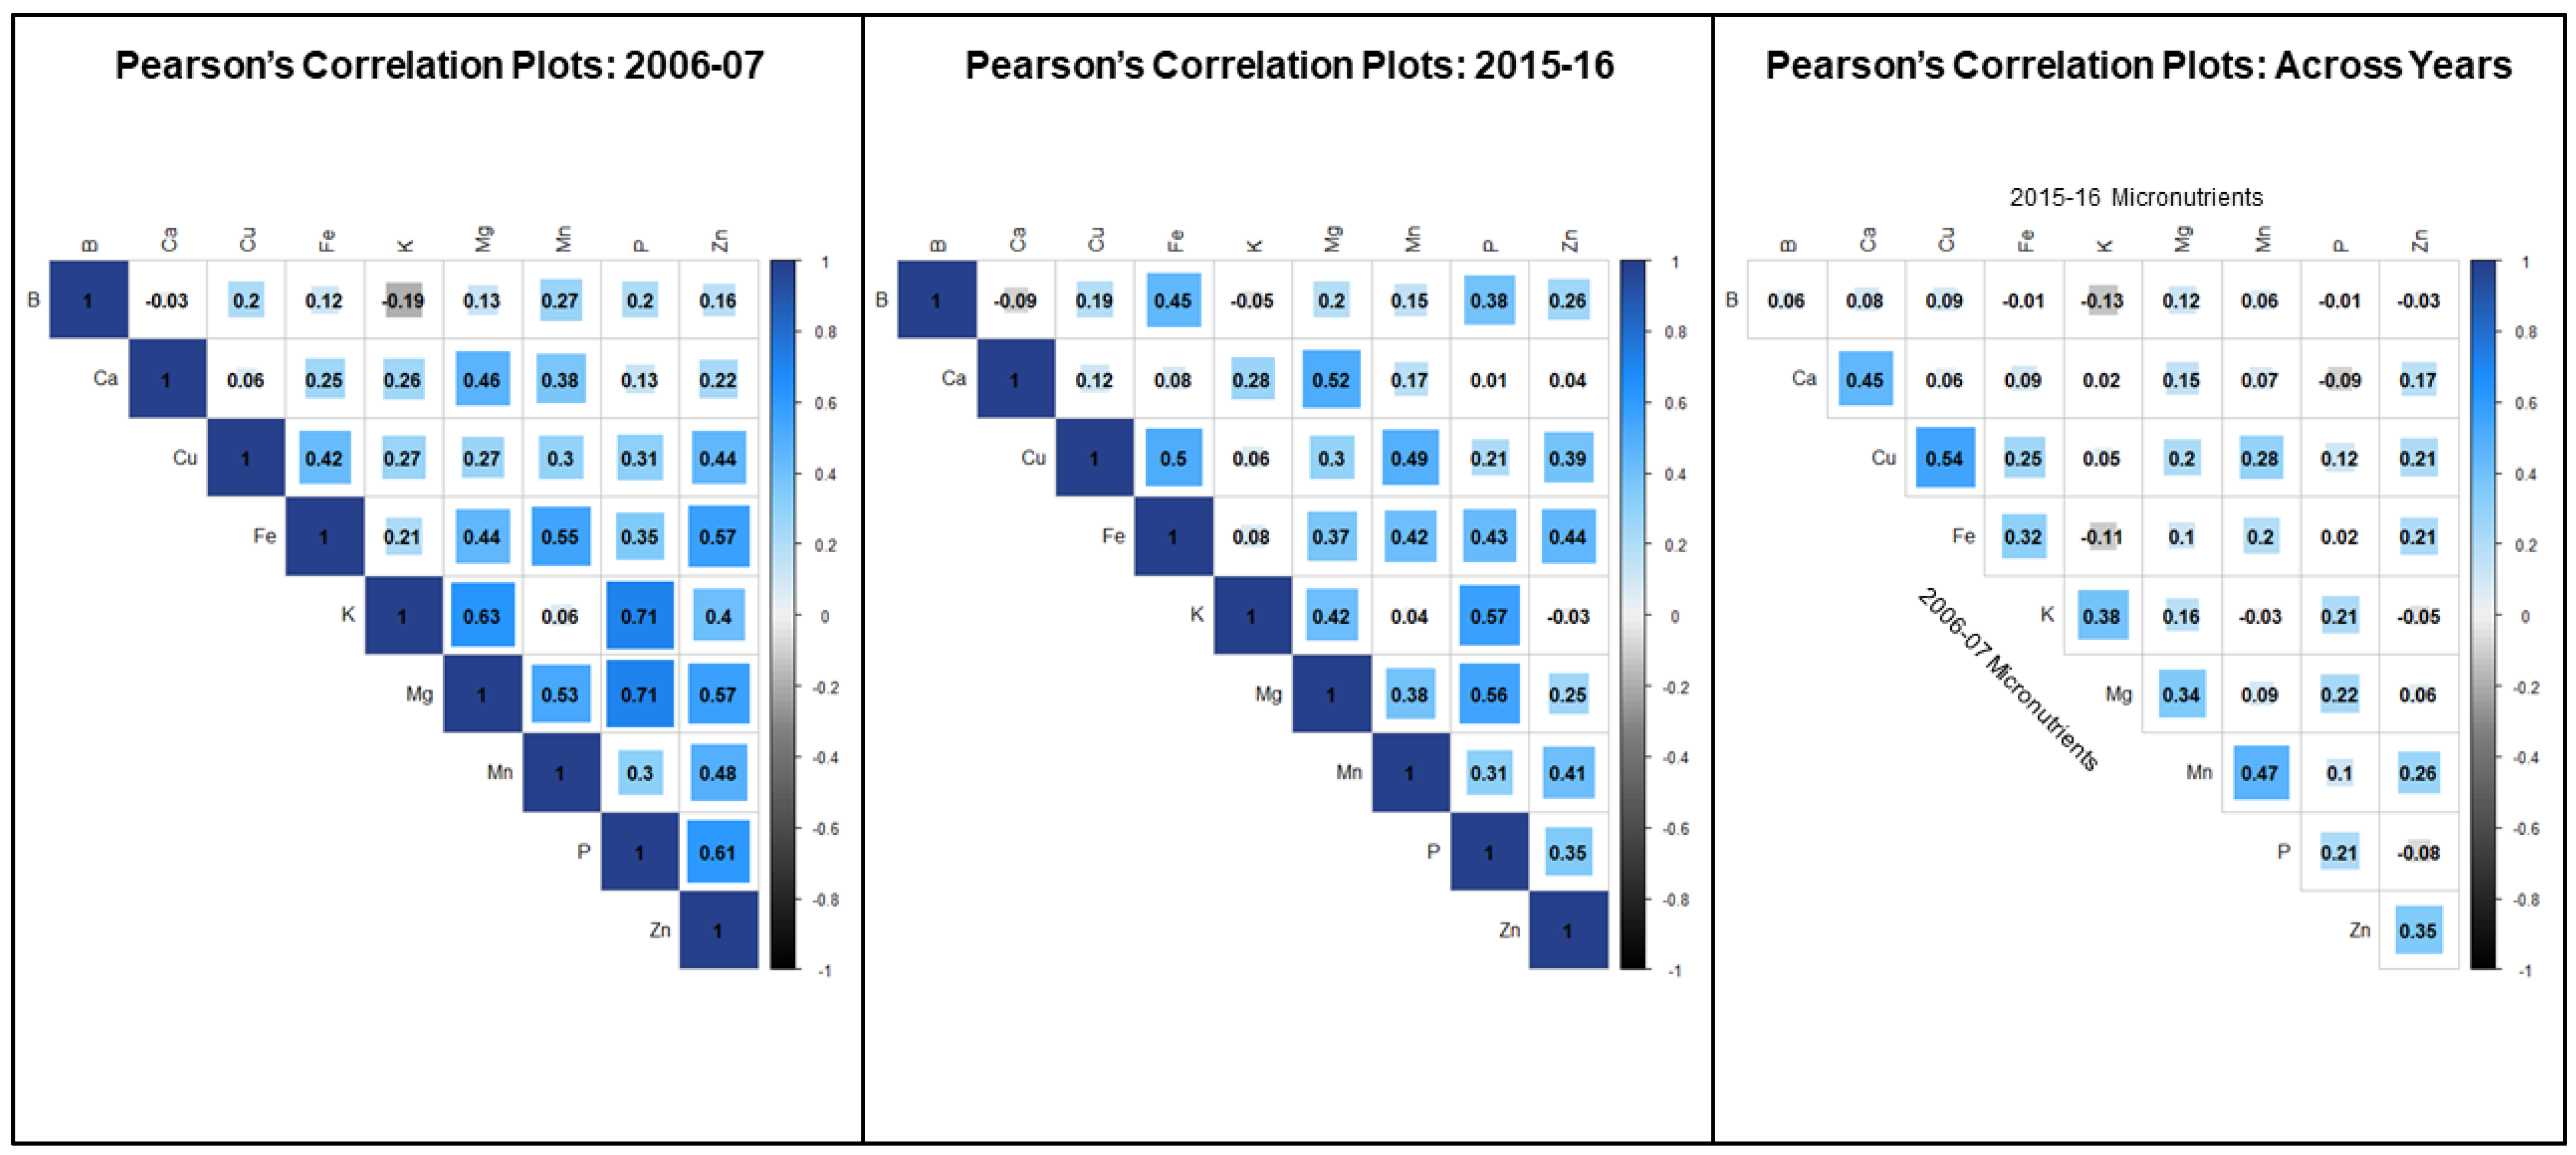
3.1. Macro and Micronutrient Content and Correlation Analysis

Two hundred thirty-two wild barley accessions were represented in analyses for the 2006–2007 and 2015–2016 crop years. Phenotypic results from both years demonstrated nutrient concentrations significantly varied across years, except in the case of K (Figure 1, Supplementary Table S1a,b, Supplementary Figure S1).
In a few instances (e.g., B), the nutrient concentration fell below method detection limits; this was accounted for in the analysis by setting the concentration value to the limit detection cutoff (0.01 mg/kg). ANOVA (Supplementary Table S2) and broad sense heritability (Table 1) analysis indicate that not all traits have strong genotypic components, nor are the genetic basis of accumulation necessarily transferable through generations. Speculation as to significant variation in grain nutrient accumulation could be attributed to environmental variations, as indicated by ANOVA results. Furthermore, there are known correlations between soil nutrient availability and plant nutrient accumulation; therefore, it is worth noting variations in growing conditions.
In 2007, the recorded average temperature during the period of flowering and grain fill (March–May) at the University of California-Davis was 25 °C with 56.9 mm of recorded precipitation. The temperature during the same period in 2017 was slightly cooler, 23.9 °C, but 168.1 mm of rain was recorded (http://atm.ucdavis.edu/weather/uc-davis-weather-climate-station/ (accessed on 28 October 2021)). Furthermore, while soil chemical properties for the UC Davis during the 2006–07 and 2015–16 growing seasons were not taken and not publicly available, open data sets enable general commentary on the region’s soil composition. The US Geological Survey has published mineralogical data, sampling five locations during July 2010 in the Davis, CA region (site 2399 [38.6329°, −121.2743°], site 6495 [38.517°, −121.694°], site 9567 [38.0909°, −121.6868°], site 10,591 [38.3503, −121.2308°], and site 11,615 [38.758°, −121.495°]). Soil nutrient concentration ranges taken at depths ranging between 0–32 cm, depending on site, are as follows, B: Not Available, Ca: 0.81–1.85 wt. %, Cu: 34.9–82.7 mg kg−1, Fe: 2.04–4.23 wt. %, K: 0.94–1.4 wt. %, Mg: 0.3–2.44 wt. %, Mn: 320–766 mg/kg, P: 220–850 mg kg−1, and Zn: 85–124 mg kg−1 [71]. However, broad regional measurements do not apply directly to mineralogical composition in field plots, nor do soil nutrient concentration explicitly translate into nutrient plant availability. Soil chemical characteristics such as the calcium carbonate equivalent, the cation exchange capacity, organic matter percentage, sodium absorption ratio, and pH have a dramatic impact on and are indicative of plant nutrient availability [72]. Comprehensively, in Davis, CA, USA, calcium carbonate equivalent ranges from 5–150 kg m−2, cation exchange capacity ranges from 5 to 15 cmolc kg−1, soil organic matter is approximately 17–31 kg m−2, sodium absorption ratios in the region have a large range of <1–25, and pH falls between neutral and moderately alkaline (6.6–8.5) (https://casoilresource.lawr.ucdavis.edu/soil-properties/ (accessed on 29 October 2022)).
A correlation analysis between traits is important for selecting genotypes with the best trait of interest in a breeding program. If two traits are positively correlated, then selecting the genotype based on one trait can also improve the other trait. Pearson’s correlation (Figure 2) measured a significant impact in nutrient interactions, mirrored across years. Notable is the positive correlation between P and Mg (2006–07: r = 0.71, 2015–16: r = 0.56) and P and K (2006–07: r = 0.71, 2015–16: r = 0.57). Significant positive correlations were also reported for P and K in faba beans [73] and common beans [74].
The positive correlation between K and Mg may be explained partially by the role of Mg in plants in Mg–ATP complexes [75], such as the one for plasma membrane-bound ATPases in maize roots, as maximal activity requires the presence of both Mg2+ and K+ [76]. Such complexes in the seeds could be important for germination processes when the conditions are ripe. Synergistic effects of Mg and K on photosynthesis [77], carbohydrate transport and allocation [78], and N metabolism [79] further supports the observed positive correlation between these two nutrients. Negative correlations between B and K across years (2006–2007: BxK r= −0.19; 2015–2016: BxK r= −0.05) and B and Ca (2006–2007: BxCa r = −0.09) were observed. A strong negative correlation between B and K was reported for common beans [74]. However, the significance of this antagonism is currently not clearly understood.
Pearson’s correlation for all mineral elements among both data sets is also presented in Figure 2. Findings of this correlation demonstrate a moderate positive correlation of phenotypic values over both years. The correlations of micronutrients across years roughly mirror the calculated heritability. The extremely low B correlation could reflect limitations in nutrient measurement, in which B concentration fell below method detection limits and imposed values at limit detection cutoff were set. Furthermore, low-to-moderate P and K correlations are potentially attributed to the field management applications of fertilizers.

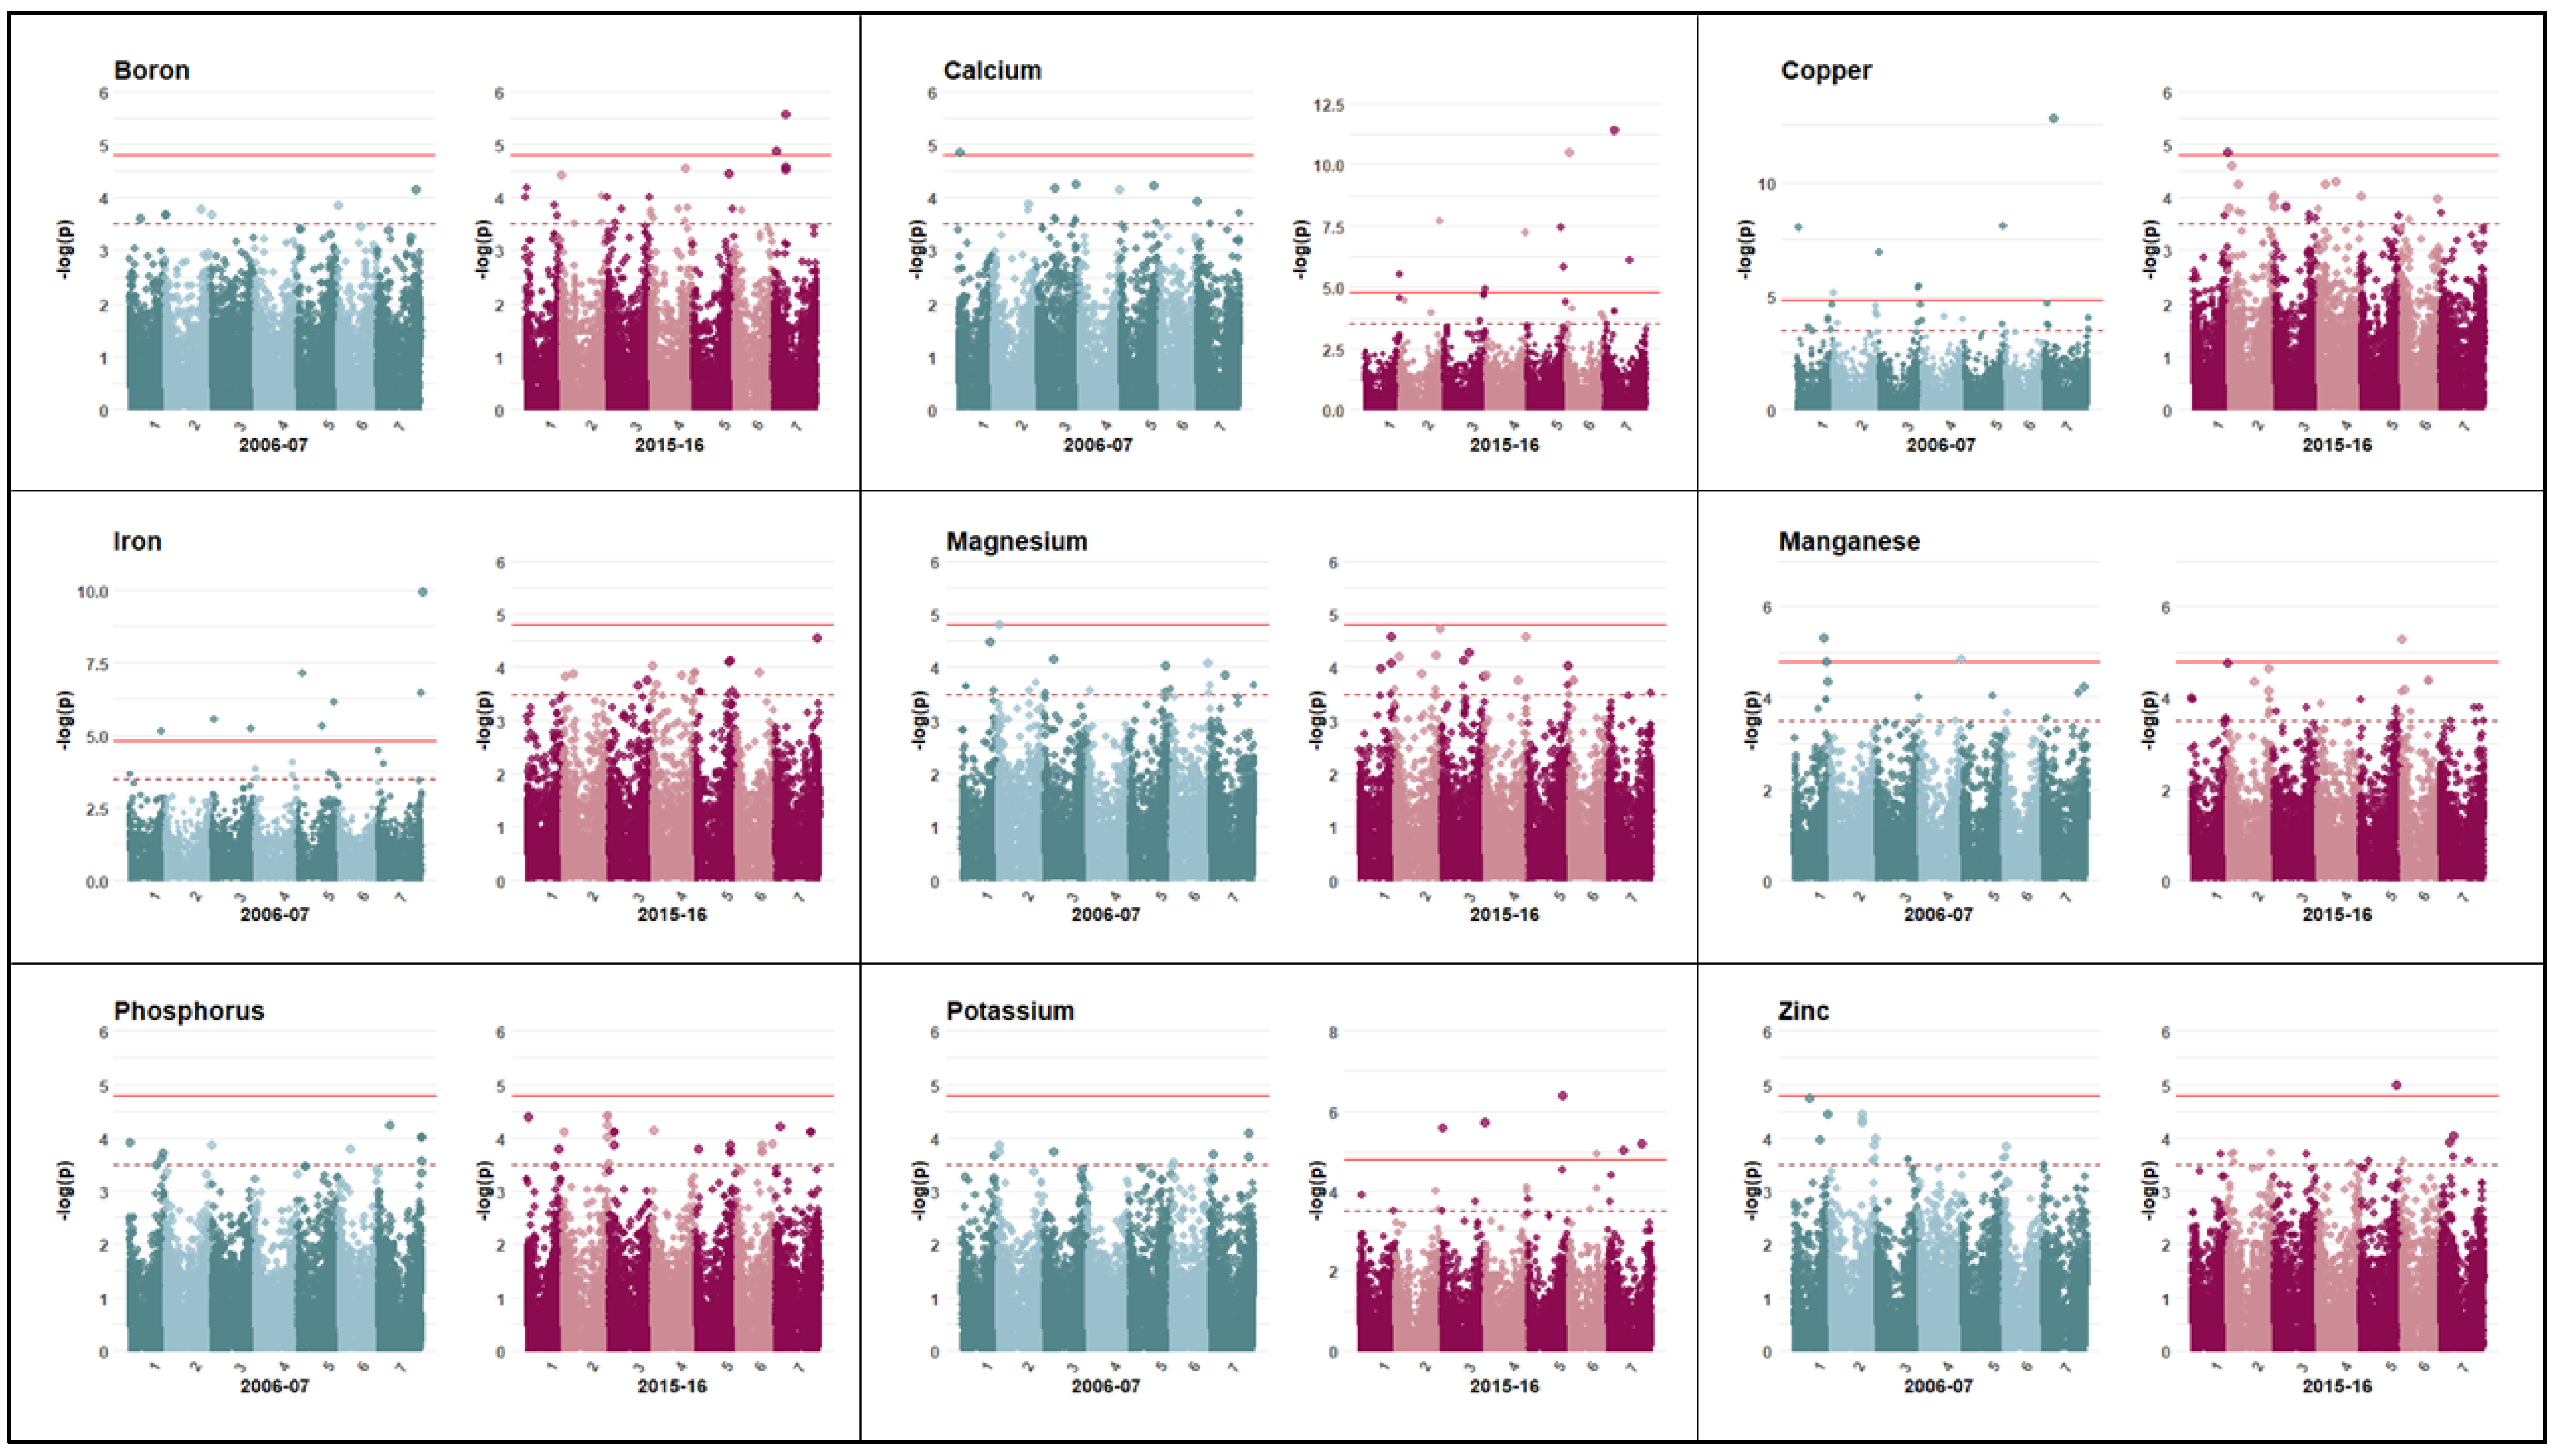
3.2. Marker Trait Association

Interestingly, while initial analysis calculated significant MTAs with two methods, the iterative approach towards fixed and random effects employed by the FarmCPU model returned higher confidence results within this data set. This interpretation is not surprising, considering the polygenic nature of many micronutrient traits. A number of these SNPs were corroborated with returns in the GWASpoly methodology (Supplementary Table S2, Supplementary Figure S2). However, the results reported here are predominantly based on FarmCPU SNP returns (Figure 3, Table 2). The exception is the emphasis of an MTA for Cu identified across years via GWASpoly parameters and the discussion of MTAs related to Mg and Mn identified with GWASpoly.

3.3. Primary Macronutrients: Phosphorus and Potassium

Aside from nitrogen, P and K are two of the three major macronutrients essential for plant growth and development. In an association mapping panel of 336 spring barley seeds from ICARDA, P content reported ranged from 2272 to 5428 mg kg−1. The seed P content in the WBDC showed a range spanning 2731–9479 mg kg−1, suggesting that the range of P concentrations in some wild barley seeds is close to twice the amount reported in the spring barleys collected from low-input and high-input barley breeding programs [47]. In this same study, the reported range of K in the seeds was 4200–6000 mg kg−1 compared to 3728–10,967 mg kg−1 observed in the WDBC, further showing the richness of the macronutrient composition of these wild barley seeds.
Despite the widespread concentrations of P in both the cultivated barley [47] and WDBC seeds, no significant MTAs were identified for this macronutrient in either population. In another ionome study of a peanut diversity panel containing 120 lines, no QTLs for P were identified [80]. Interestingly, in a GWAS of 96 common bean genotypes, five significant MTAs for seed P content were identified on five different chromosomes [74]. We speculate that this may have been made possible using more than 100,000 markers in the bean study. These studies highlight that both sample sizes and SNP numbers can affect the ability to identify significant MTAs associated with the nutrient content.
Six significant MTAs for K content in the WDBC were identified on three chromosomes, two markers each on chromosomes 3 and 7 and one each on chromosomes 5 and 6. The total variation explained for the seed K content based on these associations was only 6.4%, assuming the additive nature of these markers. One of the genes in the proximity to a K-associated SNP is annotated as a transmembrane protein, the well-known high-affinity transporters of K (HAK) are transmembrane proteins [81]. The significant SNP on chromosome 7 is in proximity to a bZIP transcription factor. Recently, a rice bZIP TF was reported to be involved in the transcriptional regulation of the high-affinity potassium transporter genes OsHKT1 [82].

3.4. Secondary Macronutrients: Calcium and Magnesium

The Ca content showed a wide variation between the varieties, which ranged from 249 to 1275 mg kg−1 DW. The heritability was high (0.61), indicating that a major part of the variability was due to genotypic effects, in agreement with previous studies [83,84,85]. The results, across two growing seasons, showed significant genotypic variances (p < 0.001). The ANOVA results indicated that genotypes and environmental factors significantly affect Ca concentration in barley seeds. A similar conclusion for grain Ca in maize was reported earlier [86]. Nine markers associated with variation in seed Ca were identified in all seven barley chromosomes, with chromosomes 5 and 7 containing two SNPs each. The proportion of phenotypic variance explained by the marker (R2) indicated a modest proportion range between 0.2 and 9.7% for individual markers and summating to about 27% in total, assuming additive effects. A SNP on chromosome 7 explained the highest variance. Nuclear transport factor 2 family protein, ABC transporter, and two pentatricopeptide repeat containing proteins were in proximity to the significant SNPs associated with the Ca content in barley seeds. The AtMRP5 gene of Arabidopsis is an ATP-binding cassette transporter protein that has been shown to be a central regulator of guard cell ion channel during ABA and Ca signal transduction [87].
In the wild barley seeds, the observed range of Mg content was 1279–2547 mg kg−1. Interestingly, the SNPs significantly associated with the Mg content in barley were only identified using the GWASpoly analysis but not in the FarmCPU. Two closely linked markers on chromosome 6 and a marker on chromosome 2 were found to be associated with the seed Mg content. The markers on chromosome 6 accounted for 24%, and the marker on chromosome 2 accounted for 16.2% of the variation in Mg. The largest effect SNPs, accounting for nearly 40% of the variation in Mg abundance, were identified in this study. One of the genes in the vicinity of the significant SNP encodes for a Pentatricopeptide repeat (PPR) superfamily protein [88]. Proteins of this superfamily were also identified in a GWA study to be allied with the Mg content in Turkish common beans [21]. This family is characterized by a tandem 30–40 amino acid sequence motif and is involved in the post-transcriptional processing of RNA in chloroplasts and mitochondria, which is very important for plant development and evolutionary adaptation [89].

3.5. Micronutrients: Boron, Manganese, Copper, Iron, and Zinc

The WBDC panel grain B concentrations ranged from 0 and 7.55 mg kg−1 DW. Three significant B SNPs were detected using the GWASpoly approach (Supplemental Table S2): two on chromosome seven (S7H_177304153, S7H_180179844) and one on chromosome three (S3H_116597238). All MTAs for grain B concentration were detected in the 2015–2016 population. Within the year, both detection methods (FarmCPU and GWASpoly) promoted the S7H_177304153 as significant with an R2 of 0.13. Significance attribution by both methodologies increases confidence in the result, as there is less chance of false positives and parameter confounding. Combined with the SNP on chromosome 3, MTAs for B explain about 15% of the genetic contribution of this trait. Candidate gene scan within 1Mb of the SNP identified a NAC (NAM, ATAF, and CUC)-like transcription factor (HORVU.MOREX.r3.7HG0680130). NAC transcription factors are induced in Arabidopsis plants subjected to toxic levels of B [90]. In rice, a map-based cloning approach was used to examine candidate genes in a QTL named BORON EXCESS TOLERANT 1 (BET1), and the approach identified a novel NAC-like transcription factor (Os04g0477300) [91]. However, the WBDC population exhibited a very low level of heritability (0.11), with ANOVA only identifying the environment as significant (p < 0.001), suggesting that variation in grain B levels is primarily due to location and year rather than genetic sources. Interestingly, a GWA in cultivated barley (H. vulgare) reported higher heritability, up to 0.83 [27]. It is speculated that the domestication of cultivated barley (H. vulgare) from H. vulgare spontaneum through the recurrent selection of each of these traits may have introduced heightened genetic control of B uptake and assimilation efficiency.
Within the WBDC, Mn grain content was variable among genotypes and years, with the lowest being 8.09 mg kg−1 DW in a genotype from 2006/07 to 48.04 mg kg−1 DW in a genotype from 2015–16. ANOVA identified both the environment and genotype as significant to Mn grain content (p > 0.001). Next to Cu, Mn had the second highest heritability (0.63), suggesting an appreciable amount of genetic control that may be exploited. The genome-wide analysis using the GWASpoly method identified three MTAs for Mn grain content: one on chromosome 1H (S1H_437852428) identified in 2006–07 grow out, and two found in 2015–16 grow out, 5H (S5H_569184852) and 7H (S7H_24895773) (Supplementary Table S3). FarmCPU identified the same MTA on 1H (S1H_437852428) and another on chromosome 6H (S6H_7595410). Both the MTA on 7H and 5H have R2 of about 0.13. However, the other MTAs, including the one on chromosome 1H found using both methods have calculated R2 close to zero. Thus, despite the substantial variance due to genotype, the MTAs identified here only explain a small portion of the genetic control of Mn in the WBDC. Previously, eight MTAs were identified from a diversity collection of cultivated barley (H. vulgare), six of which are located on chromosome 7H and the other two on 3H and 4H; all had an R2 lower than 0.05 [47]. A review of genes within the 1 Mb window did not reveal any compelling annotations. Therefore, a candidate gene is not nominated for this MTA. While several association studies have highlighted chromosomal regions controlling Mn content in cereal grains, candidate genes within Mn MTAs in cereal grains are generally underrepresented in the literature. However, a metal ion transporter, HvIRT1, identified in cultivated barley, is a member of the ZIP family of genes reported to transport many trace elements [29].
In the scope of these analyses, the distribution of Fe and Cu concentrations were comparable across years, although the means were significantly different. The mean values of Fe were 60.15 mg kg−1 and 57.11 mg kg−1, and for Cu, the mean values were 4.91 and 4.26 in 2006–07 and 2015–16, respectively. Similar Cu grain concentrations (1.5–9.8 mg kg−1) were reported in cultivated barley [47]. Conversely, these Fe concentrations are slightly elevated compared to field condition trials in Ethiopian barley, mean of 56.07 mg kg−1 [48], field condition trials of 216 spring barley lines, BLUEs mean = 35.56 µg g−1 [45], and larger than the calculated mean (28.75 mg kg−1) in an expansive 496 world barley accession study [92]. ANOVA results for both micronutrients show strong variance association within accession with p-values being less than 1 × 10⁻⁶ (Fe: p = 4.14 × 10⁻⁷, Cu: p < 2.2 × 10⁻¹⁶). However, Cu is also tied to the environment, with the trial having a significant impact based on ANOVA (p = 5.51 × 10⁻¹⁴). The FarmCPU and GWASpoly MTA analyses revealed several potentially impactful SNPs for both micronutrients. Changes in the mineral composition in the field plots from year to year would certainly affect the overall Cu grain content.
The total variation explained by the seven significant MTAs identified in FarmCPU for Cu was 14.86%. SNP S7H_123030780 was returned via the FarmCPU mapping method for 2006–2007 and identified across the years in GWASpoly. S7H_123030780 had the highest calculated R2 (6.2–8.8%) and was the most compelling due to its replicated return across years and models. It is worth noting that S7H_123030780 was included as a significant MTA although it failed to surpass the −log(p) > 4.79 due to its presence of significance at an initial threshold of −log(p) > 3.5 in both years. Upstream and downstream gene identification returned two potential genes, HORVU.MOREX.r3.7HG0671730 and HORVU.MOREX.r3.7HG0671750. The functions of these genes are suggested to be related to Kanadaptin, a kidney anion exchanger adapter protein [93], and RNA-directed DNA polymerase (reverse transcriptase), respectively.
Eight MTAs were returned via FarmCPU; all but one was identified for the 2006–07 phenotypic data. Similar to the Cu results, the association analysis for Fe identified one SNP, S5H_76074047, that was maintained as significant across the years via FarmCPU, albeit at a lower confidence threshold, and as a SNP of interest via the GWASpoly parameters at a more stringent threshold. Of further note, SNP S7H_630244607 was detected across methodologies within the 2006–07 season. Annotation of the region surrounding S5H_76074047 revealed two overlapping gene stable IDs, HORVU.MOREX.r3.5HG0439860, a disease resistance protein RPM1, and HORVU.MOREX.r3.5HG0439870, a dicer-like 3 protein. The SNP S7H_630244607 is downstream of three genes, HORVU.MOREX.r3.7HG0752330, HORVU.MOREX.r3.7HG0752340, and HORVU.MOREX.r3.7HG0752350. Interestingly, HORVU.MOREX.r3.7HG0752330 and HORVU.MOREX.r3.7HG0752340 code for 2-oxoglutarate (2OG) and Fe(II)-dependent oxygenase superfamily proteins.
In this study, Zn accumulation in seeds ranged between 27.22 and 76.96 mg kg−1 DW across years, with a mean of 42.96 (2006–2007) and 49.96 (2015–2016) and an approximate two fold increase over the determined mean, 20.1, meta-analysis of Zn content in cultivated barley [94]. Furthermore, the heritability analysis of the WBDC (H2 = 0.51) indicates that this accumulation is transferable across generations. WBDC heritability in this study differs from those previously reported: 0.65 [48], 0.73 [46], and 0.30 [45]. However, the general takeaway from the cumulative knowledge is that, to a moderate extent, seed Zn content is a heritable trait and thus worth pursuing within a breeding program. To that end, multi-locus mixed linear modeling via FarmCPU identified a single SNP, S5H_525224694, associated with the Zn content in the 2015–16 trial. However, this SNP fails to account for even 1% (R2 = 0.0034) of the phenotypic variation in the Zn content. Three genes, HORVU.MOREX.r3.5HG0509880, a kinase, HORVU.MOREX.r3.5HG0509890, a general transcription factor, and HORVU.MOREX.r3.5HG0509900, stem-specific protein TSJT1, were identified in the vicinity of S5H_525224694. The location of this identified SNP is consistent with a previous study reporting chromosome 5H as a genomic region of interest for the seed Zn content [45].

4. Conclusions

As shown in previous research, the WBDC has a substantial amount of variation in the seed vitamin E content [53]. This study further expands the repertoire to useful mineral nutrients that play an important role in both plant and human health. The identified SNP markers can be utilized to select genotypes for further characterization in the context of “elemental pyramiding” in cereal grains. Further efforts, such as RNA-Seq, fine mapping, and ultimately knocking-out or overexpressing candidates for functional validation, will be needed to verify the candidate genes identified in this study.
However, assuming the identification and functional validation of candidate genes, the endogenous variation of the wild barley diversity collection serves as an invaluable bank of genetic resources. Current work on introgression breeding within [95,96,97] and outside [98,99,100] the barley crop bolster confidence in the pursuit of introducing and utilizing wild relatives in crop improvement. High-to-moderate heritability rates, substantial R2, and reliable minor allele frequency provide several quality MTAs worth introducing into a traditional breeding program. For example, Fe has a heritability of 0.48, and MTA S5H_76074047 (maf = 0.48, R2 = 0.008) was determined across years and methodologies. Line WBDC-042 (https://barley.triticeaetoolbox.org/stock/96107/view, accessed on 29 October 2022) carries the major cytosine allele at the S5H_76074047 location and had consistently high levels of Fe in both grow-out years (2006: 74.81 mg/kg- Rank 28 of 232; 2015: 76.559 mg/kg- Rank 15 of 232). This line is already utilized in an introgression breeding line with Rasmussen, making it an ideal candidate should a program be interested in breeding for elevated Fe.
How plants integrate different signals to maintain mineral nutrient homeostasis and modulate their growth capacity represents a key frontier in plant nutrition. Although plant systems biology is still in its infancy, a rapidly growing list of omics data sets and computational tools are becoming increasingly available. Unraveling the intricate mineral nutrient signaling cross-talks will facilitate effective and sustainable biotechnological solutions to enhance the mineral nutrition in crops in agrarian environments and provide viable solutions to eradicate “hidden hunger” in the 21st century.

Supplementary Materials

The following supporting information can be downloaded at: https://www.mdpi.com/article/10.3390/agronomy12112839/s1: Table S1a: Comparison of Standard Statistics, for All Nutrients, Across Years Table S1b: Comparison of Standard Statistics, Across Years. Data Cube Root Transformed. Table S2: Analysis of Variance (ANOVA) Accession~Year. Table S3: SNPs Associated with Seed Micronutrients and Genes of Interest in that Genomic Region, Identified by GWASpoly. Figure S1: Histograms and boxplots of untransformed phenotypic data. Figure S2: GWASpoly Manhattan plots.

Author Contributions

J.G.W. and R.M. supervised the overall project; J.A.A., J.G.W., A.H.S. and R.M. were responsible for the investigation, methodology, data curation, and data visualization; J.A.A., J.G.W., R.M., M.A.V., B.J.S. and A.H.S. prepared and edited the manuscript; and J.G.W. and R.M. contributed to the funding acquisition. All authors have read and agreed to the published version of the manuscript.

Funding

This research was funded, in part, by the Lieberman-Okinow Endowment at the University of Minnesota, and Minnesota Agricultural Experiment Station Project, No. MIN-22-085: Exploiting Wild Relatives for Cultivated Wheat and Barley Improvement.

Institutional Review Board Statement

Not applicable.

Informed Consent Statement

Not applicable.

Data Availability Statement

Genotype marker data and phenotype data will be available on T3. The mention of trade names or commercial products in this publication is solely for the purpose of providing specific information and does not imply recommendation or endorsement by the U.S. Department of Agriculture. The USDA is an equal opportunity provider and employer.

Acknowledgments

We thank Erin Kilbane for technical assistance in the data analysis and development of graphics and Tamas Szinyei, Matthew Martin, Lee Jackson, Isabel Alicia del Blanco, and Nicolas Cobo for curating and growing out the collection of wild barley accessions. We extend our appreciation to the staff of the Research Analytical Lab (University of Minnesota) for the analysis of the micro- and macroelements.

Conflicts of Interest

The authors declare no conflict of interest.

References

  1. Badr, A.; Müller, K.; Schäfer-Pregl, R.; El Rabey, H.; Effgen, S.; Ibrahim, H.H.; Pozzi, C.; Rohde, W.; Salamini, F. On the Origin and Domestication History of Barley (Hordeum vulgare). Mol. Biol. Evol. 2000, 17, 499–510. [Google Scholar] [CrossRef] [PubMed] [Green Version]
  2. FAOSTAT. Available online: https://www.fao.org/faostat/en/#data/QCL (accessed on 2 August 2022).
  3. Grando, S.; Macpherson, H.G. Food Barley: Importance, Uses and Local Knowledge. In Proceedings of the International Workshop on Food Barley Improvement, Hammamet, Tunisia, 14–17 January 2002; ICARDA: Aleppo, Syria, 2005. [Google Scholar]
  4. Åman, P.; Newman, C.W. Chemical Composition of Some Different Types of Barley Grown in Montana, U.S.A. J. Cereal Sci. 1986, 4, 133–141. [Google Scholar] [CrossRef]
  5. The World Is at a Critical Juncture. Available online: https://www.fao.org/state-of-food-security-nutrition/2021/en/ (accessed on 26 August 2022).
  6. The Concept of the Global Hunger Index. Available online: https://www.globalhungerindex.org/about.html (accessed on 20 June 2022).
  7. Zoroddu, M.A.; Aaseth, J.; Crisponi, G.; Medici, S.; Peana, M.; Nurchi, V.M. The Essential Metals for Humans: A Brief Overview. J. Inorg. Biochem. 2019, 195, 120–129. [Google Scholar] [CrossRef] [PubMed]
  8. Centeno, V.; de Barboza, G.D.; Marchionatti, A.; Rodríguez, V.; Tolosa de Talamoni, N. Molecular Mechanisms Triggered by Low-Calcium Diets. Nutr. Res. Rev. 2009, 22, 163–174. [Google Scholar] [CrossRef] [PubMed] [Green Version]
  9. Dayod, M.; Tyerman, S.D.; Leigh, R.A.; Gilliham, M. Calcium Storage in Plants and the Implications for Calcium Biofortification. Protoplasma 2010, 247, 215–231. [Google Scholar] [CrossRef]
  10. Pravina, P.; Sayaji, D.; Avinash, M. Calcium and Its Role in Human Body. Int. J. Res. 2013, 4, 659–668. [Google Scholar]
  11. Rude, R.K. Magnesium Deficiency: A Cause of Heterogeneous Disease in Humans. J. Bone Miner. Res. 1998, 13, 749–758. [Google Scholar] [CrossRef]
  12. Gröber, U.; Schmidt, J.; Kisters, K. Magnesium in Prevention and Therapy. Nutrients 2015, 7, 8199–8226. [Google Scholar] [CrossRef] [Green Version]
  13. Cakmak, I. Magnesium in Crop Production, Food Quality and Human Health. Plant Soil 2013, 368, 1–4. [Google Scholar] [CrossRef] [Green Version]
  14. Hänsch, R.; Mendel, R.R. Physiological Functions of Mineral Micronutrients (Cu, Zn, Mn, Fe, Ni, Mo, B, Cl). Curr. Opin. Plant Biol. 2009, 12, 259–266. [Google Scholar] [CrossRef]
  15. Welch, R.M.; Graham, R.D. Breeding for Micronutrients in Staple Food Crops from a Human Nutrition Perspective. J. Exp. Bot. 2004, 55, 353–364. [Google Scholar] [CrossRef]
  16. Vos, T.; Abajobir, A.A.; Abate, K.H.; Abbafati, C.; Abbas, K.M.; Abd-Allah, F.; Abdulkader, R.S.; Abdulle, A.M.; Abebo, T.A.; Abera, S.F.; et al. Global, Regional, and National Incidence, Prevalence, and Years Lived with Disability for 328 Diseases and Injuries for 195 Countries, 1990–2016: A Systematic Analysis. Lancet 2017, 390, 1211–1259. [Google Scholar] [CrossRef] [Green Version]
  17. World Health Organization. Global Nutrition Targets 2025: Policy Brief Series. Available online: https://www.who.int/nutrition/publications/globaltargets2025_policybrief_anaemia/en (accessed on 28 September 2022).
  18. Hambidge, K.M.; Walravens, P.A. Disorders of Mineral Metabolism. Clin. Gastroenterol. 1982, 11, 87–117. [Google Scholar] [CrossRef]
  19. Farahat, M.H.; Sharaf, M.A. Hematological and Biochemical Parameter Alteration after Plateletpheresis Donation. Egypt. J. Haematol. 2016, 41, 174. [Google Scholar] [CrossRef]
  20. Cakmak, I.; Yazici, A.M. Others Magnesium: A Forgotten Element in Crop Production. Better Crops 2010, 94, 23–25. [Google Scholar]
  21. Baloch, F.S.; Nadeem, M.A. Unlocking the Genomic Regions Associated with Seed Protein Contents in Turkishcommon Bean Germplasm through Genome–Wide Association Study. Turk. J. Agric. For. 2022, 46, 113–128. [Google Scholar] [CrossRef]
  22. Cayton, M.T.C. Boron Toxicity in Rice; IRRI Research Paper Series; International Rice Research Institute: Manila, Philippines, 1985; Volume 113. Available online: https://pdf.usaid.gov/pdf_docs/PNABC298.pdf (accessed on 27 September 2022).
  23. Chatterjee, M.; Tabi, Z.; Galli, M.; Malcomber, S.; Buck, A.; Muszynski, M.; Gallavotti, A. The Boron Efflux Transporter ROTTEN EAR Is Required for Maize Inflorescence Development and Fertility. Plant Cell 2014, 26, 2962–2977. [Google Scholar] [CrossRef] [Green Version]
  24. Sutton, T.; Baumann, U.; Hayes, J.; Collins, N.C.; Shi, B.-J.; Schnurbusch, T.; Hay, A.; Mayo, G.; Pallotta, M.; Tester, M.; et al. Boron-Toxicity Tolerance in Barley Arising from Efflux Transporter Amplification. Science 2007, 318, 1446–1449. [Google Scholar] [CrossRef]
  25. Shao, J.F.; Yamaji, N.; Liu, X.W.; Yokosho, K.; Shen, R.F.; Ma, J.F. Preferential Distribution of Boron to Developing Tissues Is Mediated by the Intrinsic Protein OsNIP3. Plant Physiol. 2018, 176, 1739–1750. [Google Scholar] [CrossRef] [Green Version]
  26. Diehn, T.A.; Bienert, M.D.; Pommerrenig, B.; Liu, Z.; Spitzer, C.; Bernhardt, N.; Fuge, J.; Bieber, A.; Richet, N.; Chaumont, F.; et al. Boron Demanding Tissues of Brassica Napus Express Specific Sets of Functional Nodulin26-like Intrinsic Proteins and BOR1 Transporters. Plant J. 2019, 100, 68–82. [Google Scholar] [CrossRef] [Green Version]
  27. Jia, Z.; Bienert, M.D.; von Wirén, N.; Bienert, G.P. Genome-Wide Association Mapping Identifies HvNIP2;2/HvLsi6 Accounting for Efficient Boron Transport in Barley. Physiol. Plant. 2021, 171, 809–822. [Google Scholar] [CrossRef]
  28. Bienert, G.P.; Bienert, M.D.; Jahn, T.P.; Boutry, M.; Chaumont, F. Solanaceae XIPs Are Plasma Membrane Aquaporins That Facilitate the Transport of Many Uncharged Substrates. Plant J. 2011, 66, 306–317. [Google Scholar] [CrossRef] [PubMed]
  29. Pedas, P.; Ytting, C.K.; Fuglsang, A.T.; Jahn, T.P.; Schjoerring, J.K.; Husted, S. Manganese Efficiency in Barley: Identification and Characterization of the Metal Ion Transporter HvIRT1. Plant Physiol. 2008, 148, 455–466. [Google Scholar] [CrossRef] [PubMed] [Green Version]
  30. Longnecker, N.E.; Marcar, N.E.; Graham, R.D. Increased Manganese Content of Barley Seeds Can Increase Grain Yield in Manganese-Deficient Conditions. Aust. J. Agric. Res. 1991, 42, 1065–1074. [Google Scholar] [CrossRef]
  31. Burnell, J.N. The Biochemistry of Manganese in Plants. In Manganese in Soils and Plants: Proceedings of the International Symposium on ‘Manganese in Soils and Plants’ Held at the Waite Agricultural Research Institute, The University of Adelaide, Glen Osmond, South Australia, August 22–26, 1988 as an Australian Bicentennial Event; Graham, R.D., Hannam, R.J., Uren, N.C., Eds.; Springer: Dordrecht, The Netherlands, 1988; pp. 125–137. ISBN 9789400928176. [Google Scholar]
  32. Marschner, H. Mineral Nutrition of Higher Plants. 2nd. 1995. Available online: https://www.scirp.org›reference›ReferencesPapers (accessed on 28 September 2022).
  33. Puig, S.; Andrés-Colás, N.; García-Molina, A.; Peñarrubia, L. Copper and Iron Homeostasis in Arabidopsis: Responses to Metal Deficiencies, Interactions and Biotechnological Applications. Plant Cell Environ. 2007, 30, 271–290. [Google Scholar] [CrossRef]
  34. White, P.J.; Broadley, M.R. Biofortification of Crops with Seven Mineral Elements Often Lacking in Human Diets--Iron, Zinc, Copper, Calcium, Magnesium, Selenium and Iodine. New Phytol. 2009, 182, 49–84. [Google Scholar] [CrossRef]
  35. Shariatipour, N.; Heidari, B. Genetic-Based Biofortification of Staple Food Crops to Meet Zinc and Iron Deficiency-Related Challenges. Plant Micronutr. 2020, 173–223. [Google Scholar] [CrossRef]
  36. Mikula, K.; Izydorczyk, G.; Skrzypczak, D.; Mironiuk, M.; Moustakas, K.; Witek-Krowiak, A.; Chojnacka, K. Controlled Release Micronutrient Fertilizers for Precision Agriculture–A Review. Sci. Total Environ. 2020, 712, 136365. [Google Scholar] [CrossRef]
  37. Lowe, N.M. The Global Challenge of Hidden Hunger: Perspectives from the Field. Proc. Nutr. Soc. 2021, 80, 283–289. [Google Scholar] [CrossRef]
  38. Saltzman, A.; Birol, E.; Bouis, H.E.; Boy, E.; De Moura, F.F.; Islam, Y.; Pfeiffer, W.H. Biofortification: Progress toward a More Nourishing Future. Glob. Food Secur. 2013, 2, 9–17. [Google Scholar] [CrossRef]
  39. Bouis, H.E.; Hotz, C.; McClafferty, B. Biofortification: A New Tool to Reduce Micronutrient Malnutrition. Food Nutr. 2011, 32 (Suppl. 1), S31–S40. [Google Scholar] [CrossRef]
  40. Cakmak, I.; Kutman, U.B. Agronomic Biofortification of Cereals with Zinc: A Review. Eur. J. Soil Sci. 2018, 69, 172–180. [Google Scholar] [CrossRef]
  41. Bashir, K.; Takahashi, R.; Nakanishi, H.; Nishizawa, N.K. The Road to Micronutrient Biofortification of Rice: Progress and Prospects. Front. Plant Sci. 2013, 4, 15. [Google Scholar] [CrossRef] [Green Version]
  42. Dhaliwal, S.S.; Sharma, V.; Shukla, A.K.; Verma, V.; Kaur, M.; Shivay, Y.S.; Nisar, S.; Gaber, A.; Brestic, M.; Barek, V.; et al. Biofortification—A Frontier Novel Approach to Enrich Micronutrients in Field Crops to Encounter the Nutritional Security. Molecules 2022, 27, 1340. [Google Scholar] [CrossRef]
  43. Laurie, S.; Faber, M.; Adebola, P.; Belete, A. Biofortification of Sweet Potato for Food and Nutrition Security in South Africa. Food Res. Int. 2015, 76, 962–970. [Google Scholar] [CrossRef]
  44. Jha, A.B.; Warkentin, T.D. Biofortification of Pulse Crops: Status and Future Perspectives. Plants 2020, 9, 73. [Google Scholar] [CrossRef] [Green Version]
  45. Thabet, S.G.; Alomari, D.Z.; Brinch-Pedersen, H.; Alqudah, A.M. Genetic Analysis toward More Nutritious Barley Grains for a Food Secure World. Bot. Stud. 2022, 63, 6. [Google Scholar] [CrossRef]
  46. Detterbeck, A.; Nagel, M.; Rensch, S.; Weber, M.; Börner, A.; Persson, D.P.; Schjoerring, J.K.; Christov, V.; Clemens, S. The Search for Candidate Genes Associated with Natural Variation of Grain Zn Accumulation in Barley. Biochem. J. 2019, 476, 1889–1909. [Google Scholar] [CrossRef]
  47. Gyawali, S.; Otte, M.L.; Chao, S.; Jilal, A.; Jacob, D.L.; Amezrou, R.; Verma, R.P.S. Genome Wide Association Studies (GWAS) of Element Contents in Grain with a Special Focus on Zinc and Iron in a World Collection of Barley (Hordeum Vulgare L.). J. Cereal Sci. 2017, 77, 266–274. [Google Scholar] [CrossRef]
  48. Mamo, B.E.; Barber, B.L.; Steffenson, B.J. Genome-Wide Association Mapping of Zinc and Iron Concentration in Barley Landraces from Ethiopia and Eritrea. J. Cereal Sci. 2014, 60, 497–506. [Google Scholar] [CrossRef]
  49. Sallam, A.H.; Tyagi, P.; Brown-Guedira, G.; Muehlbauer, G.J.; Hulse, A.; Steffenson, B.J. Genome-Wide Association Mapping of Stem Rust Resistance in Hordeum vulgare Subsp. Spontaneum. G3 Genes Genomes Genet. 2017, 7, 3491–3507. [Google Scholar] [CrossRef] [Green Version]
  50. Roy, J.K.; Smith, K.P.; Muehlbauer, G.J.; Chao, S.; Close, T.J.; Steffenson, B.J. Association Mapping of Spot Blotch Resistance in Wild Barley. Mol. Breed. 2010, 26, 243–256. [Google Scholar] [CrossRef] [PubMed]
  51. Yun, S.J.; Gyenis, L.; Hayes, P.M.; Matus, I.; Smith, K.P.; Steffenson, B.J.; Muehlbauer, G.J. Quantitative Trait Loci for Multiple Disease Resistance in Wild Barley. Crop Sci. 2005, 45, 2563–2572. [Google Scholar] [CrossRef]
  52. Ames, N.; Dreiseitl, A.; Steffenson, B.J.; Muehlbauer, G.J. Mining Wild Barley for Powdery Mildew Resistance. Plant Pathol. 2015, 64, 1396–1406. [Google Scholar] [CrossRef] [Green Version]
  53. Mahalingam, R.; Sallam, A.H.; Steffenson, B.J.; Fiedler, J.D.; Walling, J.G. Genome-Wide Association Analysis of Natural Variation in Seed Tocochromanols of Barley. Plant Genome 2020, 13, e20039. [Google Scholar] [CrossRef]
  54. Walling, J.G.; Sallam, A.H.; Steffenson, B.J.; Henson, C.; Vinje, M.A.; Mahalingam, R. Quantitative Trait Loci Impacting Grain Β-glucan Content in Wild Barley (Hordeum Vulgare ssp. Spontaneum) Reveals Genes Associated with Cell Wall Modification and Carbohydrate Metabolism. Crop Sci. 2022, 62, 1213–1227. [Google Scholar] [CrossRef]
  55. R Core Team. R: A Language and Environment for Statistical Computing. Available online: https://www.R-project.org/ (accessed on 8 April 2022).
  56. Goh, L.; Yap, V.B. Effects of Normalization on Quantitative Traits in Association Test. BMC Bioinform. 2009, 10, 415. [Google Scholar] [CrossRef] [Green Version]
  57. Taiyun Corrplot; Github. Available online: https://github.com/taiyun/corrplot (accessed on 10 September 2022).
  58. Mascher, M.; Gundlach, H.; Himmelbach, A.; Beier, S.; Twardziok, S.O.; Wicker, T.; Radchuk, V.; Dockter, C.; Hedley, P.E.; Russell, J.; et al. A Chromosome Conformation Capture Ordered Sequence of the Barley Genome. Nature 2017, 544, 427–433. [Google Scholar] [CrossRef] [Green Version]
  59. Navrátilová, P.; Toegelová, H.; Tulpová, Z.; Kuo, Y.-T.; Stein, N.; Doležel, J.; Houben, A.; Šimková, H.; Mascher, M. Prospects of Telomere-to-Telomere Assembly in Barley: Analysis of Sequence Gaps in the MorexV3 Reference Genome. Plant Biotechnol. J. 2022, 20, 1373–1386. [Google Scholar] [CrossRef]
  60. Purcell, S.; Neale, B.; Todd-Brown, K.; Thomas, L.; Ferreira, M.A.R.; Bender, D.; Maller, J.; Sklar, P.; de Bakker, P.I.W.; Daly, M.J.; et al. PLINK: A Tool Set for Whole-Genome Association and Population-Based Linkage Analyses. Am. J. Hum. Genet. 2007, 81, 559–575. [Google Scholar] [CrossRef] [Green Version]
  61. Kang, H.M.; Zaitlen, N.A.; Wade, C.M.; Kirby, A.; Heckerman, D.; Daly, M.J.; Eskin, E. Efficient Control of Population Structure in Model Organism Association Mapping. Genetics 2008, 178, 1709–1723. [Google Scholar] [CrossRef] [Green Version]
  62. Rosyara, U.R.; De Jong, W.S.; Douches, D.S.; Endelman, J.B. Software for Genome-Wide Association Studies in Autopolyploids and Its Application to Potato. Plant Genome 2016, 9, plantgenome2015.08.0073. [Google Scholar] [CrossRef]
  63. Liu, X.; Huang, M.; Fan, B.; Buckler, E.S.; Zhang, Z. Iterative Usage of Fixed and Random Effect Models for Powerful and Efficient Genome-Wide Association Studies. PLoS Genet. 2016, 12, e1005767. [Google Scholar] [CrossRef]
  64. Wang, J.; Zhang, Z. GAPIT Version 3: Boosting Power and Accuracy for Genomic Association and Prediction. Genom. Proteom. Bioinform. 2021, 19, 629–640. [Google Scholar] [CrossRef] [PubMed]
  65. Chan, E.K.F.; Rowe, H.C.; Kliebenstein, D.J. Understanding the Evolution of Defense Metabolites in Arabidopsis Thaliana Using Genome-Wide Association Mapping. Genetics 2010, 185, 991–1007. [Google Scholar] [CrossRef] [Green Version]
  66. Pasam, R.K.; Sharma, R.; Malosetti, M.; van Eeuwijk, F.A.; Haseneyer, G.; Kilian, B.; Graner, A. Genome-Wide Association Studies for Agronomical Traits in a World Wide Spring Barley Collection. BMC Plant Biol. 2012, 12, 16. [Google Scholar] [CrossRef] [Green Version]
  67. Yang, J.; Zaitlen, N.A.; Goddard, M.E.; Visscher, P.M.; Price, A.L. Advantages and Pitfalls in the Application of Mixed-Model Association Methods. Nat. Genet. 2014, 46, 100–106. [Google Scholar] [CrossRef] [Green Version]
  68. Kinsella, R.J.; Kähäri, A.; Haider, S.; Zamora, J.; Proctor, G.; Spudich, G.; Almeida-King, J.; Staines, D.; Derwent, P.; Kerhornou, A.; et al. Ensembl BioMarts: A Hub for Data Retrieval across Taxonomic Space. Database 2011, 2011, bar030. [Google Scholar] [CrossRef]
  69. Perera, L.; Freudenthal, B.D.; Beard, W.A.; Shock, D.D.; Pedersen, L.G.; Wilson, S.H. Requirement for Transient Metal Ions Revealed through Computational Analysis for DNA Polymerase Going in Reverse. Proc. Natl. Acad. Sci. USA 2015, 112, E5228–E5236. [Google Scholar] [CrossRef] [Green Version]
  70. Droppa, M.; Horváth, G. The Role of Copper in Photosynthesis. CRC Crit. Rev. Plant Sci. 1990, 9, 111–123. [Google Scholar] [CrossRef]
  71. Smith, D.B.; Cannon, W.F.; Woodruff, L.G.; Solano, F.; Kilburn, J.E.; Fey, D.L. USGS Data Series 801: Geochemical and Mineralogical Data for Soils of the Conterminous United States. Available online: https://pubs.usgs.gov/ds/801/ (accessed on 21 October 2022).
  72. U.S. Department of Agriculture, Natural Resources Conservation Service. National Soil Survey Handbook, Title 430-VI. Available online: http://www.nrcs.usda.gov/wps/portal/nrcs/detail/soils/ref/?cid=nrcs142p2_054242 (accessed on 20 October 2022).
  73. Baloch, F.S.; Karaköy, T.; Demïrbaş, A.; Toklu, F.; Özkan, H.; Hatiïpoğlu, R. Variation of Some Seed Mineral Contents in Open Pollinated Faba Bean (Vicia Faba L.) Landraces from Turkey. Turk. J. Agric. For. 2014, 38, 591–602. [Google Scholar] [CrossRef]
  74. Rasool, S.; Mahajan, R.; Nazir, M.; Bhat, K.A.; Shikari, A.B.; Ali, G.; Bhat, B.; Bhat, B.A.; Shah, B.; Murtaza, I.; et al. SSR and GBS Based GWAS Study for Identification of QTLs Associated with Nutritional Elemental in Common Bean (Phaseolus Vulgaris L.). Sci. Hortic. 2022, 306, 111470. [Google Scholar] [CrossRef]
  75. Narwal, R.P.; Kumar, V.; Singh, J.P. Potassium and Magnesium Relationship in Cowpea (Vigna Unguiculata (L.) Walp.). Plant Soil 1985, 86, 129–134. [Google Scholar] [CrossRef]
  76. Leonard, R.T.; Hotchkiss, C.W. Cation-Stimulated Adenosine Triphosphatase Activity and Cation Transport in Corn Roots. Plant Physiol. 1976, 58, 331–335. [Google Scholar] [CrossRef] [PubMed] [Green Version]
  77. Tränkner, M.; Tavakol, E.; Jákli, B. Functioning of Potassium and Magnesium in Photosynthesis, Photosynthate Translocation and Photoprotection. Physiol. Plant. 2018, 163, 414–431. [Google Scholar] [CrossRef] [Green Version]
  78. Koch, M.; Busse, M.; Naumann, M.; Jákli, B. Differential Effects of Varied Potassium and Magnesium Nutrition on Production and Partitioning of Photoassimilates in Potato Plants. Physiologia 2019, 166, 921–935. [Google Scholar] [CrossRef] [Green Version]
  79. Ding, Y.; Luo, W.; Xu, G. Characterisation of Magnesium Nutrition and Interaction of Magnesium and Potassium in Rice. Ann. Appl. Biol. 2006, 149, 111–123. [Google Scholar] [CrossRef]
  80. Zhang, H.; Wang, M.L.; Schaefer, R.; Dang, P.; Jiang, T.; Chen, C. GWAS and Coexpression Network Reveal Ionomic Variation in Cultivated Peanut. J. Agric. Food Chem. 2019, 67, 12026–12036. [Google Scholar] [CrossRef]
  81. Gierth, M.; Mäser, P. Potassium Transporters in Plants–Involvement in K+ Acquisition, Redistribution and Homeostasis. FEBS Lett. 2007, 581, 2348–2356. [Google Scholar] [CrossRef] [Green Version]
  82. Baoxiang, W.; Yan, L.; Yifeng, W.; Jingfang, L.; Zhiguang, S.; Ming, C.; Yungao, X.; Bo, X.; Bo, Y.; Jian, L.; et al. OsbZIP72 Is Involved in Transcriptional Gene-Regulation Pathway of Abscisic Acid Signal Transduction by Activating Rice High-Affinity Potassium Transporter OsHKT1;1. Rice Sci. 2021, 28, 257–267. [Google Scholar] [CrossRef]
  83. Vreugdenhil, D.; Aarts, M.G.M.; Koornneef, M.; Nelissen, H.; Ernst, W.H.O. Natural Variation and QTL Analysis for Cationic Mineral Content in Seeds of Arabidopsis Thaliana. Plant Cell Environ. 2004, 27, 828–839. [Google Scholar] [CrossRef]
  84. Garcia-Oliveira, A.L.; Tan, L.; Fu, Y.; Sun, C. Genetic Identification of Quantitative Trait Loci for Contents of Mineral Nutrients in Rice Grain. J. Integr. Plant Biol. 2009, 51, 84–92. [Google Scholar] [CrossRef]
  85. Peleg, Z.; Cakmak, I.; Ozturk, L.; Yazici, A.; Jun, Y.; Budak, H.; Korol, A.B.; Fahima, T.; Saranga, Y. Quantitative Trait Loci Conferring Grain Mineral Nutrient Concentrations in Durum Wheat x Wild Emmer Wheat RIL Population. Züchter Genet. Breed. Res. 2009, 119, 353–369. [Google Scholar] [CrossRef] [Green Version]
  86. Gu, R.; Chen, F.; Liu, B.; Wang, X.; Liu, J.; Li, P.; Pan, Q.; Pace, J.; Soomro, A.-A.; Lübberstedt, T.; et al. Comprehensive Phenotypic Analysis and Quantitative Trait Locus Identification for Grain Mineral Concentration, Content, and Yield in Maize (Zea Mays L.). Theor. Appl. Genet. 2015, 128, 1777–1789. [Google Scholar] [CrossRef] [Green Version]
  87. Suh, S.J.; Wang, Y.-F.; Frelet, A.; Leonhardt, N.; Klein, M.; Forestier, C.; Mueller-Roeber, B.; Cho, M.H.; Martinoia, E.; Schroeder, J.I. The ATP Binding Cassette Transporter AtMRP5 Modulates Anion and Calcium Channel Activities in Arabidopsis Guard Cells. J. Biol. Chem. 2007, 282, 1916–1924. [Google Scholar] [CrossRef] [Green Version]
  88. Xing, H.; Fu, X.; Yang, C.; Tang, X.; Guo, L.; Li, C.; Xu, C.; Luo, K. Genome-Wide Investigation of Pentatricopeptide Repeat Gene Family in Poplar and Their Expression Analysis in Response to Biotic and Abiotic Stresses. Sci. Rep. 2018, 8, 2817. [Google Scholar] [CrossRef] [Green Version]
  89. Saha, D.; Prasad, A.M.; Srinivasan, R. Pentatricopeptide Repeat Proteins and Their Emerging Roles in Plants. Plant Physiol. Biochem. 2007, 45, 521–534. [Google Scholar] [CrossRef]
  90. Kasajima, I.; Fujiwara, T. Identification of Novel Arabidopsis Thaliana Genes Which Are Induced by High Levels of Boron. Plant Biotechnol. 2007, 24, 355–360. [Google Scholar] [CrossRef] [Green Version]
  91. Ochiai, K.; Shimizu, A.; Okumoto, Y.; Fujiwara, T.; Matoh, T. Suppression of a NAC-like Transcription Factor Gene Improves Boron-Toxicity Tolerance in Rice. Plant Physiol. 2011, 156, 1457–1463. [Google Scholar] [CrossRef] [Green Version]
  92. Nyiraguhirwa, S.; Grana, Z.; Ouabbou, H.; Iraqi, D.; Ibriz, M.; Mamidi, S.; Udupa, S.M. A Genome-Wide Association Study Identifying Single-Nucleotide Polymorphisms for Iron and Zinc Biofortification in a Worldwide Barley Collection. Plants 2022, 11, 1349. [Google Scholar] [CrossRef]
  93. Chen, J.; Vijayakumar, S.; Li, X.; Al-Awqati, Q. Kanadaptin Is a Protein That Interacts with the Kidney but Not the Erythroid Form of Band 3. J. Biol. Chem. 1998, 273, 1038–1043. [Google Scholar] [CrossRef] [PubMed] [Green Version]
  94. Khan, W.A.; Shabala, S.; Cuin, T.A.; Zhou, M.; Penrose, B. Avenues for Biofortification of Zinc in Barley for Human and Animal Health: A Meta-Analysis. Plant Soil 2021, 466, 101–119. [Google Scholar] [CrossRef]
  95. Hernandez, J.; Meints, B.; Hayes, P. Introgression Breeding in Barley: Perspectives and Case Studies. Front. Plant Sci. 2020, 11, 761. [Google Scholar] [CrossRef] [PubMed]
  96. Hernandez, J.; Steffenson, B.J.; Filichkin, T.; Fisk, S.P.; Helgerson, L.; Meints, B.; Vining, K.J.; Marshall, D.; Del Blanco, A.; Chen, X.; et al. Introgression of Rpg4/Rpg5 Into Barley Germplasm Provides Insights Into the Genetics of Resistance to Puccinia Graminis f. Sp. Tritici Race TTKSK and Resources for Developing Resistant Cultivars. Phytopathology 2019, 109, 1018–1028. [Google Scholar] [CrossRef]
  97. Pickering, R.; Johnston, P.A. Recent Progress in Barley Improvement Using Wild Species of Hordeum. Cytogenet. Genome Res. 2005, 109, 344–349. [Google Scholar] [CrossRef]
  98. Xu, Q.; Zheng, T.-Q.; Hu, X.; Cheng, L.-R.; Xu, J.-L.; Shi, Y.-M.; Li, Z.-K. Examining Two Sets of Introgression Lines in Rice (Oryza Sativa L.) Reveals Favorable Alleles That Improve Grain Zn and Fe Concentrations. PLoS ONE 2015, 10, e0131846. [Google Scholar] [CrossRef]
  99. Bertioli, D.J.; Cannon, S.B.; Froenicke, L.; Huang, G.; Farmer, A.D.; Cannon, E.K.S.; Liu, X.; Gao, D.; Clevenger, J.; Dash, S.; et al. The Genome Sequences of Arachis Duranensis and Arachis Ipaensis, the Diploid Ancestors of Cultivated Peanut. Nat. Genet. 2016, 48, 438–446. [Google Scholar] [CrossRef]
  100. Jaradat, A.A. Phenotypic and Ionome Profiling of Triticum Aestivum × Aegilops Tauschii Introgression Lines. Crop Sci. 2017, 57, 1916–1934. [Google Scholar] [CrossRef]
Figure 1. Histograms and boxplots demonstrating and comparing the distribution of mineral element concentrations (ppm) in 232 accessions of the WBDC. ** p-value < 0.01, *** p value < 0.001, NS = no significant difference.
Agronomy 12 02839 g001
Figure 2. Pearson’s correlation plots. (left) looks at the relationship between traits from 2006–07 samples. (middle) looks at the relationship between traits from 2015–16 samples. (right) looks at the relationship between traits from across years samples.
Agronomy 12 02839 g002
Figure 3. Manhattan plots for the genome wide association study, utilizing the FarmCPU GAPIT model, of seed mineral nutrient accumulation in the WBDC. The −log(p-value) > 4.79 threshold is indicated by a solid red line. The dashed line is representative of an initial lenient −log(p-value) > 3.5 cutoff.
Agronomy 12 02839 g003
Table 1. Nutrient Heritability.
TraitVariance ComponentsHeritability (H2)
Genotype (Vg)Residuals (Ve)
Boron (B)0.0060.0430.115
Calcium (Ca)0.1490.0950.612
Copper (Cu)0.0110.0050.696
Iron (Fe)0.0220.0230.481
Potassium (K)0.4230.3450.551
Magnesium (Mg)0.0900.0850.512
Manganese (Mn)0.0160.0090.636
Phosphorus (P)0.1870.3480.350
Zinc (Zn)0.0140.0130.515
Table 2. SNPs Associated with Seed Micronutrients and Genes of Interest in that Genomic Region.
TraitYearSNPChrPositionAllelep-ValueR2mafStable Gene IDIPK Descriptions
B15–16S7H_1773041537H177304153A/G2.77 × 10−60.0140.045HORVU.MOREX.r3.7HG0680110Potassium transporter
HORVU.MOREX.r3.7HG06801203-oxoacyl-reductase
HORVU.MOREX.r3.7HG0680130NAC (No Apical Meristem) domain transcriptional regulator superfamily protein
Ca15–16S1H_5141667091H514166709C/T2.89 × 10−60.0620.409HORVU.MOREX.r3.1HG0094570Minichromosome maintenance 8
Ca15–16S2H_6072307982H607230798A/C1.91 × 10−80.0220.084HORVU.MOREX.r3.2HG0193490Growth-regulating factor
HORVU.MOREX.r3.2HG0193510Gpcr-type g protein 2
Ca15–16S3H_6101767673H610176767G/T1.05 × 10−50.0190.069HORVU.MOREX.r3.3HG0326120Glutathione S-transferase T3
HORVU.MOREX.r3.3HG0326130FBD-associated F-box protein
HORVU.MOREX.r3.3HG0326140FBD-associated F-box protein
HORVU.MOREX.r3.3HG0326160F-box protein-like protein
HORVU.MOREX.r3.3HG0326170Nuclear transport factor 2 family protein
HORVU.MOREX.r3.3HG0326190ABC transporter ATP-binding protein
HORVU.MOREX.r3.3HG0326200Cofactor assembly
HORVU.MOREX.r3.3HG0326210Mitochondrial-processing peptidase alpha
HORVU.MOREX.r3.3HG0326220Leucine-rich repeat-containing protein 1
HORVU.MOREX.r3.3HG0326230Vacuolar protein sorting 55 containing protein
Ca15–16S4H_5917162194H591716219C/G5.86 × 10−80.0250.063HORVU.MOREX.r3.4HG0411440Superoxide dismutase [Cu-Zn]
HORVU.MOREX.r3.4HG0411460Peptide transporter
HORVU.MOREX.r3.4HG0411500Werner Syndrome-like exonuclease
Ca15–16S5H_5110933535H511093353G/T3.59 × 10−80.0030.233HORVU.MOREX.r3.5HG0503550Serine/threonine-protein kinase
HORVU.MOREX.r3.5HG0503560Serine/threonine-protein kinase
HORVU.MOREX.r3.5HG0503570Serine/threonine-protein kinase
Ca15–16S5H_5418873135H541887313C/G1.46 × 10−60.0290.108HORVU.MOREX.r3.5HG0516830Dehydrin
Ca15–16S6H_424922966H42492296C/G3.06 × 10−110.0060.043HORVU.MOREX.r3.6HG0555030Pentatricopeptide repeat-containing protein
HORVU.MOREX.r3.6HG0555040Succinate dehydrogenase [ubiquinone] flavoprotein subunit, mitochondrial
HORVU.MOREX.r3.6HG0555060Pentatricopeptide repeat-containing protein
HORVU.MOREX.r3.6HG0555090CASP-like protein
Ca15–16S7H_1447724137H144772413A/G3.80 × 10−120.0060.103HORVU.MOREX.r3.7HG0675630Pantothenate kinase
HORVU.MOREX.r3.7HG0675670Chaperone protein dnaJ, putative
HORVU.MOREX.r3.7HG0675690F-box/RNI-like superfamily protein
Ca15–16S7H_3867968247H386796824A/G8.56 × 10−70.0970.119HORVU.MOREX.r3.7HG0700320Pentatricopeptide repeat-containing protein
HORVU.MOREX.r3.7HG0700330XH/XS domain protein
Cu06–07S1H_214623251H21462325A/C9.47 × 10−90.0540.127HORVU.MOREX.r3.1HG0009000FAR1-related sequence 10
HORVU.MOREX.r3.1HG0009020Werner Syndrome-like exonuclease
HORVU.MOREX.r3.1HG0009050MYB transcription factor
Cu06–07S2H_106287642H10628764C/G6.37 × 10−60.0010.069HORVU.MOREX.r3.2HG0099760Serpin
HORVU.MOREX.r3.2HG0099780Maternal effect embryo arrest protein
HORVU.MOREX.r3.2HG0099790Lectin receptor kinase
HORVU.MOREX.r3.2HG0099800Carboxymethylenebutenolidase-like protein
HORVU.MOREX.r3.2HG0099810NAD(P)-binding rossmann-fold protein
HORVU.MOREX.r3.2HG0099820NAD(P)-binding Rossmann-fold protein
HORVU.MOREX.r3.2HG0099840Nicotianamine synthase
HORVU.MOREX.r3.2HG0099870Heat shock protein 90
Cu06–07S3H_110667283H11066728C/T1.32 × 10−70.0280.127HORVU.MOREX.r3.3HG0224020BED Zn finger, hATdimerization domain
HORVU.MOREX.r3.3HG0224040Pentatricopeptide repeat-containing protein
Cu06–07S3H_5548632163H554863216A/G3.96 × 10−60.0350.297HORVU.MOREX.r3.3HG0304030Arginine N-methyltransferase (DUF688)
HORVU.MOREX.r3.3HG0304070Defensin
HORVU.MOREX.r3.3HG0304080Glutaredoxin-like
Cu06–07S3H_5815357473H581535747G/T3.38 × 10−60.0080.162HORVU.MOREX.r3.3HG0312640AT5g16110
HORVU.MOREX.r3.3HG0312670Serine/threonine-protein phosphatase 7
HORVU.MOREX.r3.3HG0312690Potassium transporter
Cu06–07S5H_5608895775H560889577A/G8.41 × 10−90.0130.069HORVU.MOREX.r3.5HG0525290Amino acid transporter, putative
Cu06–07S7H_1230307807H123030780C/T1.58 × 10−130.0220.166HORVU.MOREX.r3.7HG0671730Kanadaptin
HORVU.MOREX.r3.7HG0671750RNA-directed DNA polymerase
Fe06–07S1H_4546167911H454616791C/G7.16 × 10−60.0090.101HORVU.MOREX.r3.1HG0071240Polynucleotidyl transferase, RnaseH family
HORVU.MOREX.r3.1HG0071260Receptor-like kinase
Fe06–07S3H_316185123H31618512A/G2.97 × 10−60.0260.153HORVU.MOREX.r3.3HG0233410Transmembrane protein, putative
HORVU.MOREX.r3.3HG0233420LINE−1 reverse transcriptase like
HORVU.MOREX.r3.3HG0233430Polynucleotidyl transferase, RNaseH family
Fe06–07S3H_5571433963H557143396C/G5.87 × 10−60.0110.121HORVU.MOREX.r3.3HG0304800SMC protein
HORVU.MOREX.r3.3HG0304810Ethylene-responsive transcription factor
HORVU.MOREX.r3.3HG0304830Protein kinase
Fe06–07S5H_3567778005H356777800C/T4.75 × 10−60.0310.252NoneN/A
Fe06–07S5H_5263130215H526313021C/G7.16 × 10−70.0000.453HORVU.MOREX.r3.5HG0510200Protein OBERON 1
HORVU.MOREX.r3.5HG0510210Tryptophan RNA-binding attenuator protein
HORVU.MOREX.r3.5HG0510220Late embryogenesis abundant protein
HORVU.MOREX.r3.5HG0510230Dirigent protein
HORVU.MOREX.r3.5HG0510240Dirigent protein
HORVU.MOREX.r3.5HG0510250Dirigent protein
Fe06–07S7H_6234887007H623488700G/T3.78 × 10−70.0220.496HORVU.MOREX.r3.7HG0749550Disease resistance protein RPM1
HORVU.MOREX.r3.7HG0749560Coiled-coil domain-containing protein 12
HORVU.MOREX.r3.7HG0749570Prolyl oligopeptidase family protein
Fe06–07S7H_6302446077H630244607A/G1.10 × 10−100.0330.332HORVU.MOREX.r3.7HG07523302-oxoglutarate Fe(II)-dependent oxygenase
HORVU.MOREX.r3.7HG07523402-oxoglutarate Fe(II)-dependent oxygenase
HORVU.MOREX.r3.7HG0752350AT hook motif DNA-binding family protein
K15–16S3H_197119173H19711917A/G2.60 × 10−60.0030.131HORVU.MOREX.r3.3HG0228430transmembrane protein, putative (DUF247)
HORVU.MOREX.r3.3HG0228450ArfGap/RecO-like Zn finger domain protein
K15–16S3H_6093131483H609313148C/T1.91 × 10−60.0080.162HORVU.MOREX.r3.3HG0325670F-box domain containing protein
HORVU.MOREX.r3.3HG0325680Histidine decarboxylase
HORVU.MOREX.r3.3HG0325700KH domain-containing protein
HORVU.MOREX.r3.3HG0325710Serine/threonine-protein phosphatase 7
HORVU.MOREX.r3.3HG0325720Actin cytoskeleton-regulatory complex pan1
HORVU.MOREX.r3.3HG0325730Gamma-tubulin complex component
K15–16S5H_4960798765H496079876C/T4.11 × 10−70.0240.065NoneN/A
K15–16S6H_4038452686H403845268A/C1.18 × 10−50.0010.043NoneN/A
K15–16S7H_2210252987H221025298A/G9.44 × 10−60.0200.123NoneN/A
K15–16S7H_4887729607H488772960C/T6.52 × 10−60.0090.261HORVU.MOREX.r3.7HG0713790Cellulose synthase
HORVU.MOREX.r3.7HG0713820Transcription factor
Mn06–07S1H_4378524281H437852428C/G4.95 × 10−60.0090.037HORVU.MOREX.r3.1HG0067260NB-ARC domain-disease resistance protein
HORVU.MOREX.r3.1HG0067270H/ACA ribonucleoprotein complex NAF1
Mn15–16S6H_75954106H7595410A/G5.01 × 10−60.0000.041HORVU.MOREX.r3.6HG0541060Ubiquitin family protein
HORVU.MOREX.r3.6HG0541070Outer envelope protein 61
HORVU.MOREX.r3.6HG0541100Polygalacturonase non-catalytic protein
HORVU.MOREX.r3.6HG0541110F-box domain containing protein
Zn15–16S5H_5252246945H525224694A/C1.00 × 10−50.0030.209HORVU.MOREX.r3.5HG0509880Kinase
HORVU.MOREX.r3.5HG0509890General transcription factor 3C polypeptide 3
HORVU.MOREX.r3.5HG0509900Stem-specific protein TSJT1
FeBothS5H_760740475H76074047C/T>3.1 × 10−40.0080.50000HORVU.MOREX.r3.5HG0439860Disease resistance protein RPM1
HORVU.MOREX.r3.5HG0439870Dicer-like 3
Publisher’s Note: MDPI stays neutral with regard to jurisdictional claims in published maps and institutional affiliations.

