Article

The Effect of Neutral Salt and Alkaline Stress with the Same Na+ Concentration on Root Growth of Soybean (Glycine max (L.) Merr.) Seedlings

1
Key Laboratory of Ministry of Agriculture and Rural Affairs of Soybean Mechanized Production, Heilongjiang Bayi Agricultural University, Daqing 163319, China
2
Research Center of Saline and Alkali Land Improvement Engineering Technology in Heilongjiang Province, Daqing 163319, China
*
Authors to whom correspondence should be addressed.
Agronomy 2022, 12(11), 2708; https://doi.org/10.3390/agronomy12112708
Submission received: 25 September 2022 / Revised: 26 October 2022 / Accepted: 28 October 2022 / Published: 1 November 2022
(This article belongs to the Special Issue Frontier Studies in Legumes Genetic Breeding and Production)

Abstract

:
Salt stress is a common abiotic stress that negatively affects crop growth and yield. However, there have been significant differences found on the effect degree and management mechanism in plants under neutral salt stress and alkaline stress. In this study, two soybean cultivars, Heihe 49 (HH49, saline-alkali stress tolerant) and Henong 95 (HN95, saline-alkali stress sensitive), were hydroponically cultured and treated with salt solutions of 25, 50, and 75 mM Na+ in the form of NaCl, Na2SO4, NaHCO3, and Na2CO3. Plants treated with alkaline stress (NaHCO3 and Na2CO3) showed a greater decrease in root growth and root activity of both soybean cultivar seedlings than that under neutral salt stresses (NaCl and Na2SO4) with 25–75 mM Na+ concentration. Alkaline stress (25–50 mM Na+ content) activated a higher ability of antioxidant defense (by enhancing the activists of superoxide dismutase (SOD), peroxidase (POD), and ascorbate peroxidase (APX)) and increased the content of soluble sugars to a higher level than that under neutral salt stresses. However, 75 mM Na+ content salt treatments reduced antioxidant enzyme activities and osmotic regulating substance content. Furthermore, alkaline salt and neutral salt stress was able to induce DNA damage and cell cycle arrest in HH49 and HN95 seedling roots. Treatment with Na2CO3 induced the least random amplification polymorphic DNA (RAPD) polymorphism in soybean seedling roots among all salt treatments, which could have been related to the early cell cycle arrest.

1. Introduction

Affected by natural and human factors, soil salinization has become an increasingly serious ecological and environmental problem in the world [1]. According to statistics from the Food and Agriculture Organization of the United Nations (FAO), approximately 20% of irrigated soils worldwide are salinized [2]. Soil salinization seriously affects plant growth and yield, reduces soil utilization efficiency, and causes other ecological and environmental problems [3]. Most land salinization is mixed by different types of salt (including neutral salt and alkaline salt [4]. However, neutral salt and alkaline salt have different effects on plant growth and must be managed differently [5]. Therefore, exploring the mechanisms by which different types of salt stress affect plant growth is beneficial to breed salt tolerant crop cultivars and develop salt tolerant cultivation strategies.
Neutral salt (such as NaCl and Na2SO4) stress can inhibit plant growth through primary and secondary salt damage. Primary salt damage refers to the direct damage of salt ions to plants [6]. A large amount of Na+ and Cl ions in plant root environment can produce osmotic stress and ion toxicity on plants [7]. Excessive accumulation of ions can lead to degeneration and inactivation of some enzymes in plant cells, affecting the normal physiological functions and metabolic activities of plants [8]. Salt stress can also cause the accumulation of reactive oxygen species (ROS) in plants, which can further lead to plasma membrane damage [9]. Plasma membrane injury further affects cell metabolism, causing different degrees of damage to the physiological function of cells [6]. ROS can also cause oxidative damage to biological macromolecules such as proteins and nucleic acids, destroying the balance of metabolism, impacting genome stability, and inhibiting normal plant growth [10]. Salt-stress-induced secondary damage includes osmotic, water, and nutrient stress in plants caused by the indirect effects of salt ions. Excessive salinity in the soil decreases the osmotic potential of the soil solution in the root environment, resulting in decreased plant root water absorption and physiologic drought [11]. A salt content of approximately 0.2%~0.5% (w/w) in the soil environment can induce difficulty in plant water absorption when the salt content exceeds 0.4%, wherein the water in the plant will extravasate, and the growth rate will decrease significantly, or death will occur [12]. Plants transport external nutrients into the body through ion channels [13]. When plants absorb too much of a certain salt, they will reject the absorption of other nutrient elements, resulting in the imbalance of nutrient absorption and single salt toxicity and nutrient deficiency stress [14]. For example, when plants absorb too much Na+, the absorption of K+, PO43−, and Ca2+ was suppressed. Cl inhibits the uptake of NO3− and H2PO4 by plants [15]. Alkaline salt (such as NaHCO3 and Na2CO3) stress can induce similar damage to plants as neutral salt stress. Alkaline stress can also cause high pH in the soil environment, which can further impact plants [16]. High pH in the soil environment also lead to the deposition of some divalent metal cations, such as Fe2+, Mg2+, and Ca2+, accompanied by the decrease in inorganic anions, causing serious nutrient stress to plants [17].
Plants maintain ionic and osmotic homeostasis through a variety of complex regulatory pathways [18]. The root is the first plant organ to cope with salt and alkali stress, and metabolic regulation in the root is the main way for plants to alleviate salt and alkali stress [19]. The effects of salt and alkali stress on plant growth can be effectively reduced by regulating the content of osmotic regulatory substances, improving the ability of antioxidant enzymes, selectively absorbing ions, and adjusting the allocation of biomass in plant roots [20,21]. Organic solutes synthesized in cells (such as proline, betaine, choline, and organic acids) and some metabolic intermediates (such as sugars and their derivatives) play an important role in plant osmotic regulation and resistance under salt stress [18,22]. As an energy store, proline in its free state plays an important role in stabilizing the structure of biological macromolecules, removing ammonia toxicity and regulating the redox potential of plants under salt stress [23]. Previous studies have shown that foliar spraying with proline can stimulate plant root growth and contribute to an improved dry/fresh weight, photosynthetic rate, and antioxidant enzyme activities in chili (Capsicum annum L.) under salt stress [24]. Soluble sugar is not only the material basis and energy of organic matter synthesis but also an important material in maintaining the osmotic balance of plants under abiotic stress conditions [18]. The exogenous addition of sucrose can effectively alleviate salt stressed induced reproductive obstacles and enhance salt tolerance of chickpea (Cicer arietinum L.) [25]. Abiotic stress induces excessive ROS in plant cells, which causes peroxidation of the cytoplasmic membrane, resulting in the irreparable loss of membrane metabolic function and even cell death. Excessive ROS in plants can be removed by antioxidant enzyme, such as superoxide dismutase (SOD, EC 1.15.1.1), peroxidase (POD, EC 1.11.1.7), catalase (CAT, EC 1.11.1.6), and ascorbate peroxidase (APX, EC 1.11.1.11) [26]. Previous studies have shown that there is a significant positive correlation between the tolerance ability of plants to abiotic stress conditions, including salt, alkali, drought, cold, pesticides, and heavy metals and the regulatory ability of antioxidant enzymes in plants [27,28].
Soybean is an important source of vegetable protein and oil worldwide, and is also an important forage crop [29]. Soybean yield and grain quality are impacted by salt and saline–alkali stress [30]. Although a large number of studies have revealed the mechanism of response of soybean to salt stress (especially NaCl) or alkali stress (mixed saline–alkali stress) [31,32,33], few studies have been conducted on the difference of soybean response mechanism under different types of salt stress [34].
In this study, two soybean cultivars with significant differences in saline–alkali tolerance, HH49 (saline-alkali tolerance) and HN95 (saline-alkali sensitive), were treated with neutral and alkaline salts with same Na+ content to analyze the effect of different type salt stress on (1) soybean seedling roots growth, (2) osmotic adjustment, (3) antioxidant defense, and (4) DNA damage and cell cycle arrest. The results of this study can lay a theoretical foundation for the breeding of salt tolerant soybean cultivars.

2. Materials and Methods

2.1. Materials, Growth, and Treatment Conditions

Soybean (Glycine max (L.) Merr.) seeds Heihe 49 (HH49, saline–alkali stress-tolerant) and Henong 95 (HN95, saline–alkali stress-sensitive) were provided by the Germplasm Resources Innovation team of the College of Agronomy, Heilongjiang Bayi Agricultural University, Heilongjiang, PR China. Average-sized soybean seeds without disease and insect spots were selected, then sterilized using 5% (v/v) sodium hypochlorite for 10 min. The sterilized seeds were sown in a polypropylene pot (length × width × height = 10 cm × 10 cm × 15 cm) filled with mixed soil (made by mixing peat-soil and vermiculite at a volume ratio of 3:1, pH = 6.8). Each pot cultivated 9 soybean seeds was and put in a controlled environment chamber with a light regime of 16 h/8 h (light/dark) and relative humidity of 50–55% at 28 ± 2 °C until cotyledons were unearthed.
The uniformly grown soybean seedlings were selected and transferred into a 250 mL conical flask filled with a salt treatment solution (Na+ concentrations were set as 25 mM, 50 mM, and 75 mM). The salt treatment solution was prepared by dissolving NaCl, Na2SO4, NaHCO3, and Na2CO3 into distilled water, separately. The pH values of the different solutions are shown in Table S1. Each conical flask contained 10 soybean seedlings. Distilled water treatment was used as the control treatment. Soybean seedlings were incubated for 3 days at 28 ± 1 °C with a light regime of 16 h light/8 h dark. The treatment solution was changed every day. All experiments were repeated 6 times—3 replicates were used for biomass and morphological measurement, and the other 3 replicates were used for physiological and molecular analyses.

2.2. Biomass and Morphological Measurement

The morphological indicators of soybean seedlings were measured using a WinRHIZO Pro 2012b root scanning image analysis system (Regent Instruments, Inc., Quebec, QC, Canada). Fresh weights of samples were measured using one ten-thousandth balance and then oven-dried to constant weight using an oven (Jinghong, China) at 105 °C for 30 min, followed by 85 °C for 3 h. The dry weight of samples was measured using one ten-thousandth balance. Root length inhibition rate (%) was calculated as follows: (Root length of the control − Root length of the treatment)/Root length of the control × 100%. All experiments were repeated three times.

2.3. Measurement of Root Activity and Relative Electrical Conductivity

Fresh samples of soybean seedling roots were used to measure root activities and relative electrical conductivity. The root activities were determined using the triphenyltetrazolium chloride (TTC) reduction method as described by Du et al. [35]. Fresh root sample (0.1 g) was washed with distilled water 3 times, then surface-dried using filter paper. The sample was transferred into a 10 mL centrifuge tube full of deionized water, and then soaked for 12 h at room temperature. The extract conductance (R1) was measured using a conductance meter (Leici DDS-307A). The sample was then heated in a boiling water bath for 30 min, followed by a second measuring of the extract conductance (R2) after the solution was cooled to room temperature and blended. Relative conductivity was calculated as follows: R1/R2 × 100%.

2.4. Measurement of Antioxidant Enzyme Activities and ROS Content

Soybean roots frozen at −80 °C were used to measure antioxidant enzyme activities and ROS content. The activities of the antioxidant enzymes SOD, POD, and CAT were determined as described by Du et al. [35]. APX activity was measured using the ascorbic acid method as described by Asada [36]. The superoxide radical (O2) content was determined using the hydroxylamine oxidation method as described by Elstner and Heupel [37]. The hydrogen peroxide (H2O2) content was determined using the trichloroacetic acid (TCA) method described by Velikova et al. [38]. Malondialdehyde (MDA) content was determined using the thiobarbituric acid (TBA) method described by Ji et al. [39].

2.5. Measurement of Osmotic Regulator Content

Soybean roots frozen at −80 °C were used to measure the contents of soluble sugars, soluble protein, and proline. The contents of soluble sugars was determined as described by Du et al. [35]. The contents of soluble protein was measured using the Coomassie brilliant blue G-250 method as described by Zhang et al. [40]. The content of proline was determined using sulfosalicylic acid method as described by Yuan et al. [41].

2.6. DNA Extraction and RAPD Analysis

Fresh soybean roots (100 mg) frozen at −80 °C were used for total genomic DNA extraction using the plant Genomic DNA Isolation Kit (Tiangen, Beijing, China). Quantity and integrity of the extracted DNA was assessed using the NanoDrop 2000 (Thermo Fisher Scientific, MA, USA), and then diluted to 1 μg·μL−1 using sterilized ddH2O water.
Random amplification polymorphic DNA (RAPD) reaction solution was prepared by mixing 1 μL of diluted total genomic DNA (100 ng·μL−1), 1 μL of random primer (10 mM), 10 μL of 2 × Taq PCR mix (CWBIO, Beijing, China), and 8 μL of dH2O. The information on random primers used for RAPD analysis is listed in Table S2. The PCR amplification conditions were as follows: initial denaturation at 93 °C for 2 min; 45 cycles of denaturation at 93 °C for 1 min, annealing at 36 °C, and primer extension at 72 °C for 1.5 min; final extension at 72 °C for 5 min; and maintained at 4 °C. The polymorphism frequency of RAPDs was assessed using 3% (w/v) agarose gel electrophoresis and calculated as described by Wang et al. [42]. To assess RAPD, if the control and salt-treated PCR amplification products displayed different electrophoretic motilities (RAPD polymorphisms appeared or disappeared), and the case was scored as positive for RAPD. The genome template stability (GTS) was calculated as described by Zhao et al. [43].

2.7. RNA Extraction, First-Strand cDNA Synthesis, and qRT-PCR Analysis

Fresh soybean roots (100 mg) frozen at −80 °C were used for total RNA extracting using the miniBEST Plant RNA Extraction Kit (TaKaRa, Maebashi, Japan). NanoDrop 2000 was used to assess RNA quantity and integrity. Total RNA (1 μg) was used to synthesize 20 μL of first-strand cDNA reaction mixture using a TransScript All-in-One First-Strand cDNA Synthesis Super Mix (TransScript, Beijing, China) according to the manufacturer’s manual.
qRT-PCR amplification was performed on a real-time qPCR (CFX-96, Bio-rad, Hercules, CA, USA) via a TransScript® Top Green qPCR SuperMix (TransScript, Beijing, China). The reaction solution was prepared by mixing 1 μL of cDNA reaction mixture, 0.5 μL of forward primer (10 μM), 0.5 μL of reverse primer (10 μM), 10 μL of 2 × TransStartR Green qPCR SuperMix, and 8 μL of dH2O. qRT-PCR amplification conditions were performed as follows: holding at 94 ℃ for 30 s, then performed for 40 cycles with the following cycle profile: a 5 s denaturation step at 94 °C, a 15 s annealing step at 60 °C, and a 15 s extension step at 72 °C. After a final elongation step (5 min at 72 °C), the amplificated product was maintained at 4 °C. The information on random primers used for qRT-PCR analysis is listed in Table S2. Relative gene expression levels of soybean seedlings between different treatments were calculated using the operational formula 2−ΔΔCt [44]. The qRT-PCR experiments were conducted with three biological replicates. Each biological replicate had three technical replicates.

2.8. Statistical Analysis

SPSS (version 23.0) was used for all statistical analyses. Results are expressed as the means ± standard deviation (SD) of three independent experiments. One-way ANOVA was used to evaluate the differences between the same cultivar among the treatments (p < 0.05).

3. Results

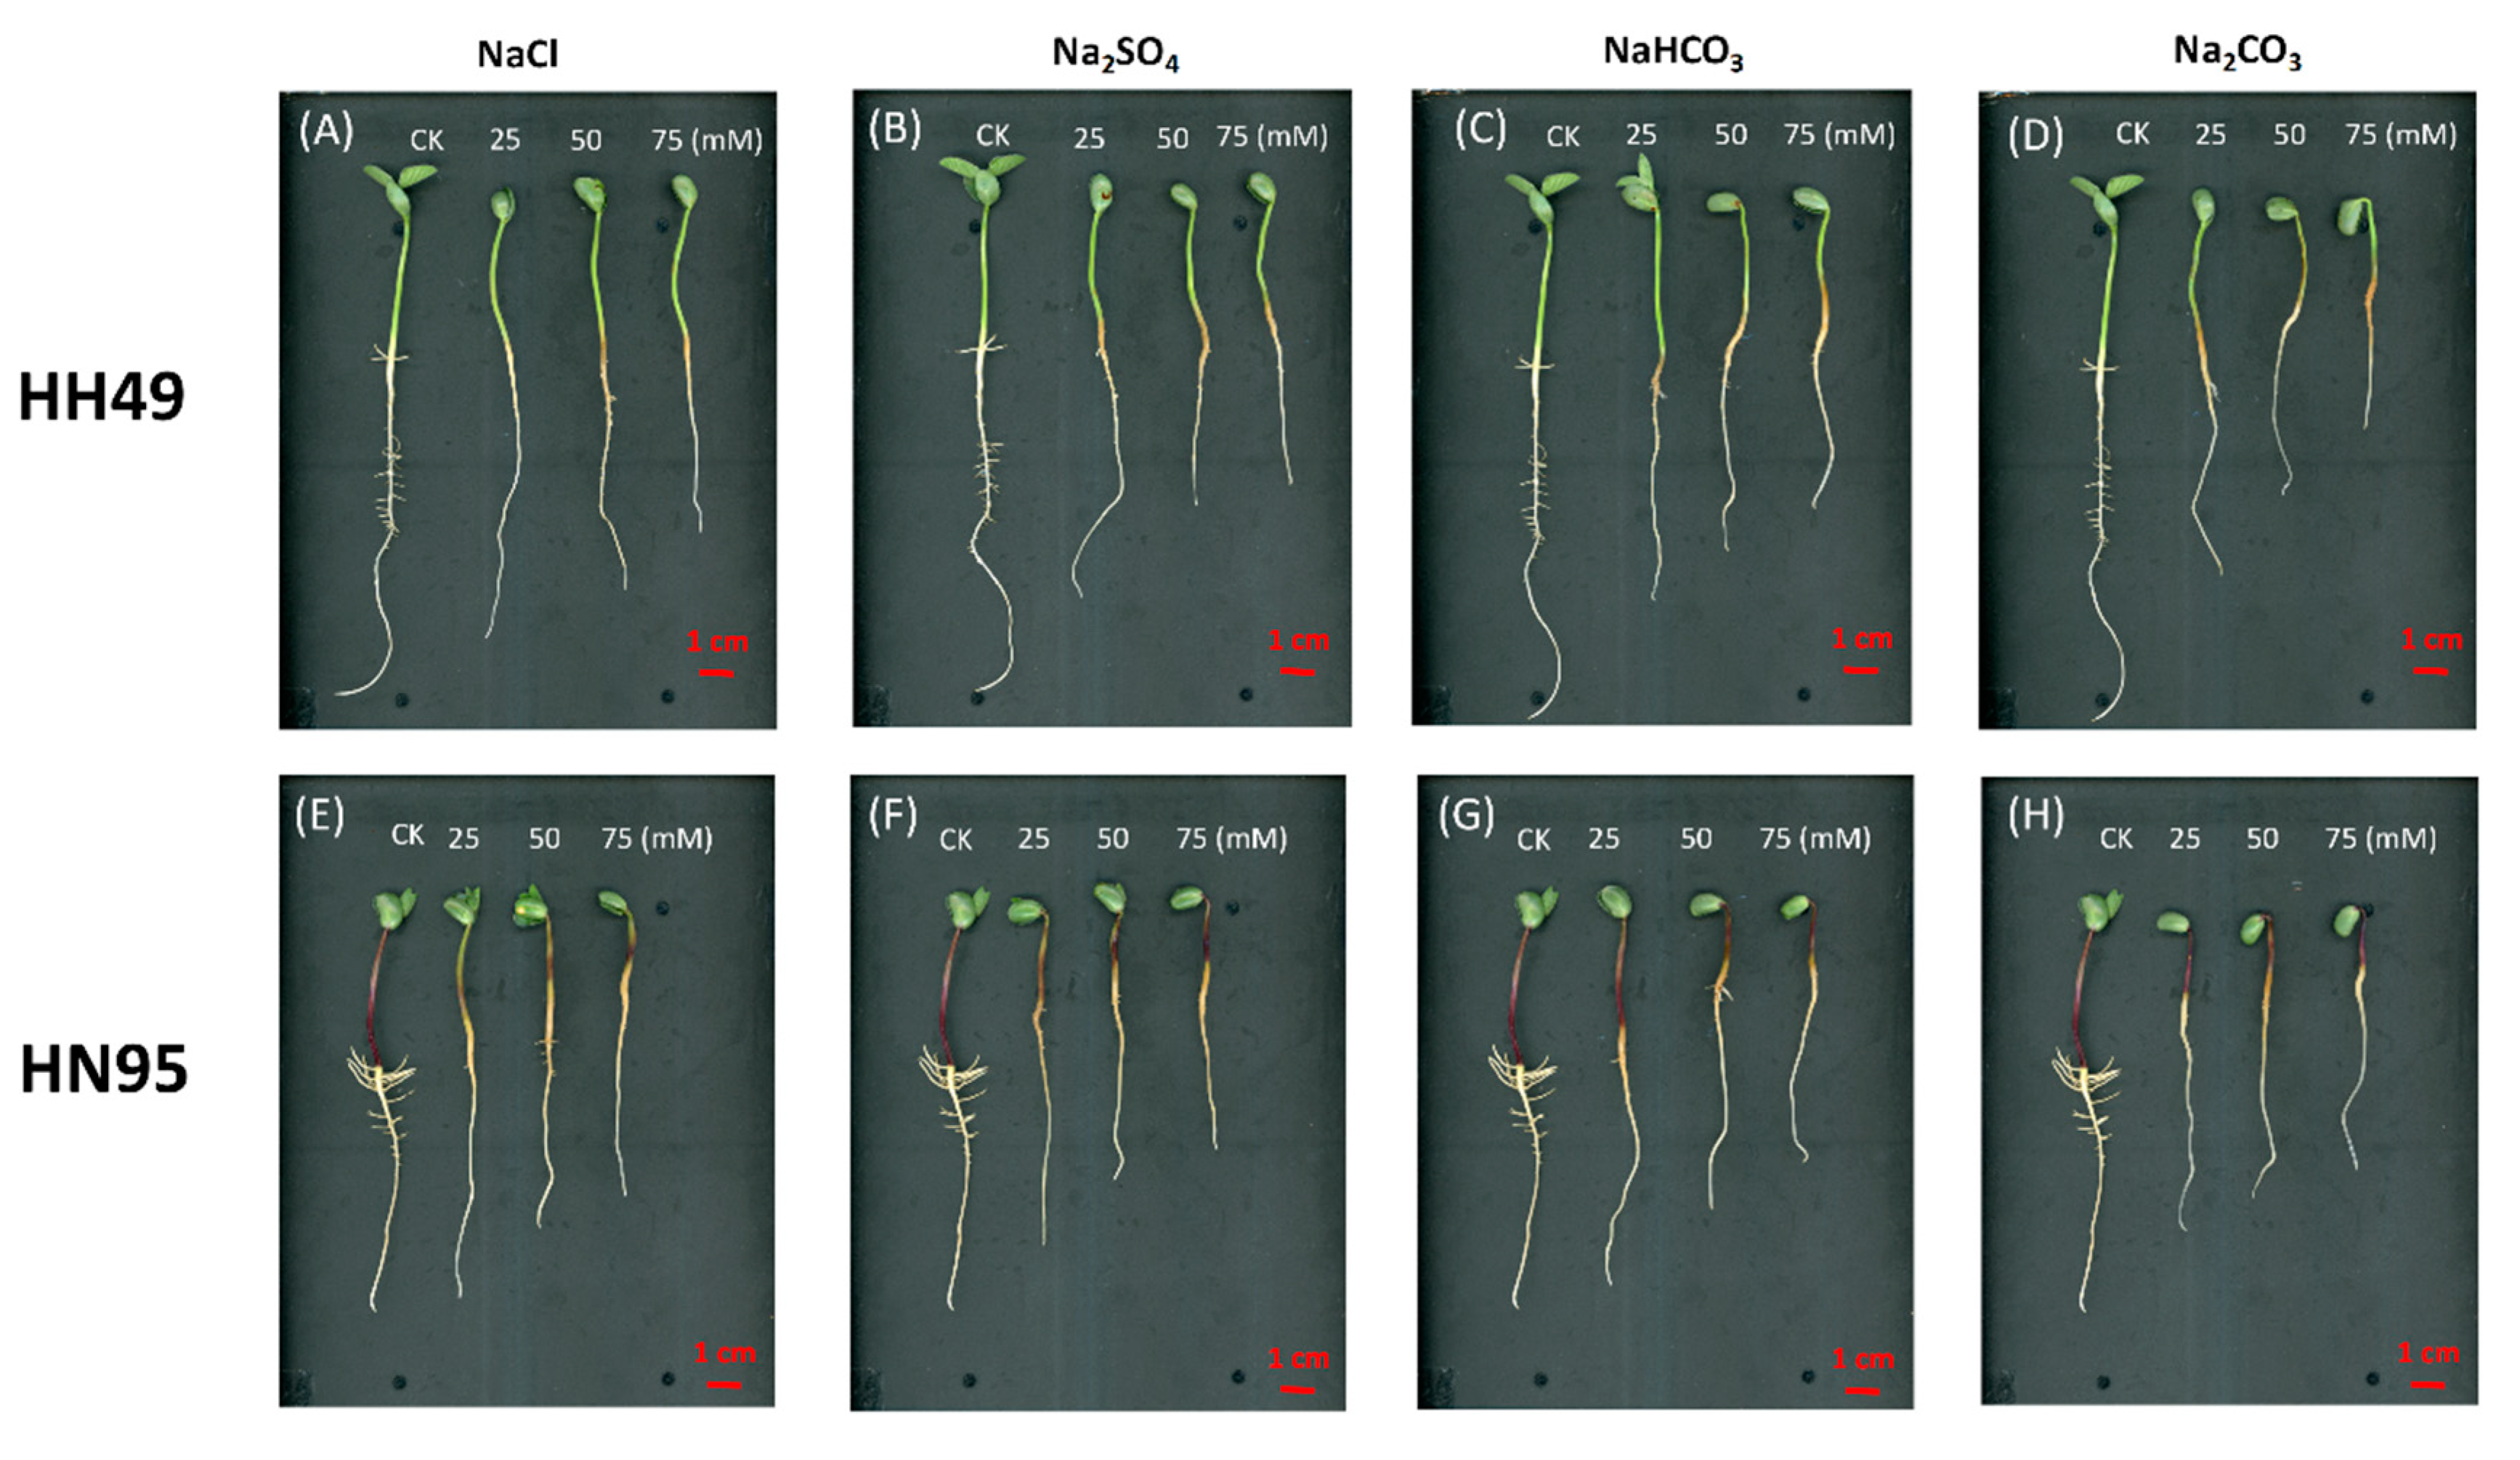
3.1. Effects of Different Salt Stress Treatments on the Root Growth of Soybean Seedlings

The morphological characteristics and biomass accumulation of HH49 and HN9 seedling roots were determined to evaluate the effects of different salt stress treatments on soybean seedling roots growth treated with 25, 50, and 75 mM Na+ concentrations solution in the formula of NaCl, Na2SO4, NaHCO3, and Na2CO3 for 3 days, separately. Compared with the control, all salt treatments significantly inhibited the root growth of HH49 and HN95 seedlings, and a dose-dependent decrease in root length was observed with increasing Na+ concentrations (Figure 1, Table 1). All salt treatments significantly decreased the fresh and dry weight of HH49 and HN95 roots compared with the control, with the exception that 25 mM NaCl treatment had no significant effect on the fresh and dry weight of HH49 seedlings. When Na+ concentrations reached 75 mM, NaCl, Na2SO4, NaHCO3, and Na2CO3 treatments significantly decreased the superficial area and volume of HH49 and HN95 seedling roots. Exposure to the same salt treatment for 3 days induced a higher inhibition of HN95 root growth than that of HH49. It is worth noting that the effects of different salt treatments with the same Na+ concentration on root growth of HH49 and HN95 soybean seedlings were significantly different. NaHCO3 and Na2CO3 treatments had similar effects on root growth of the HH49 seedling, both of which were more severe than Na2SO4 and NaCl treatments. NaHCO3 treatments had the most significant inhibitory effect on the root growth of the HN95 seedling, followed by Na2CO3, Na2SO4, and NaCl.

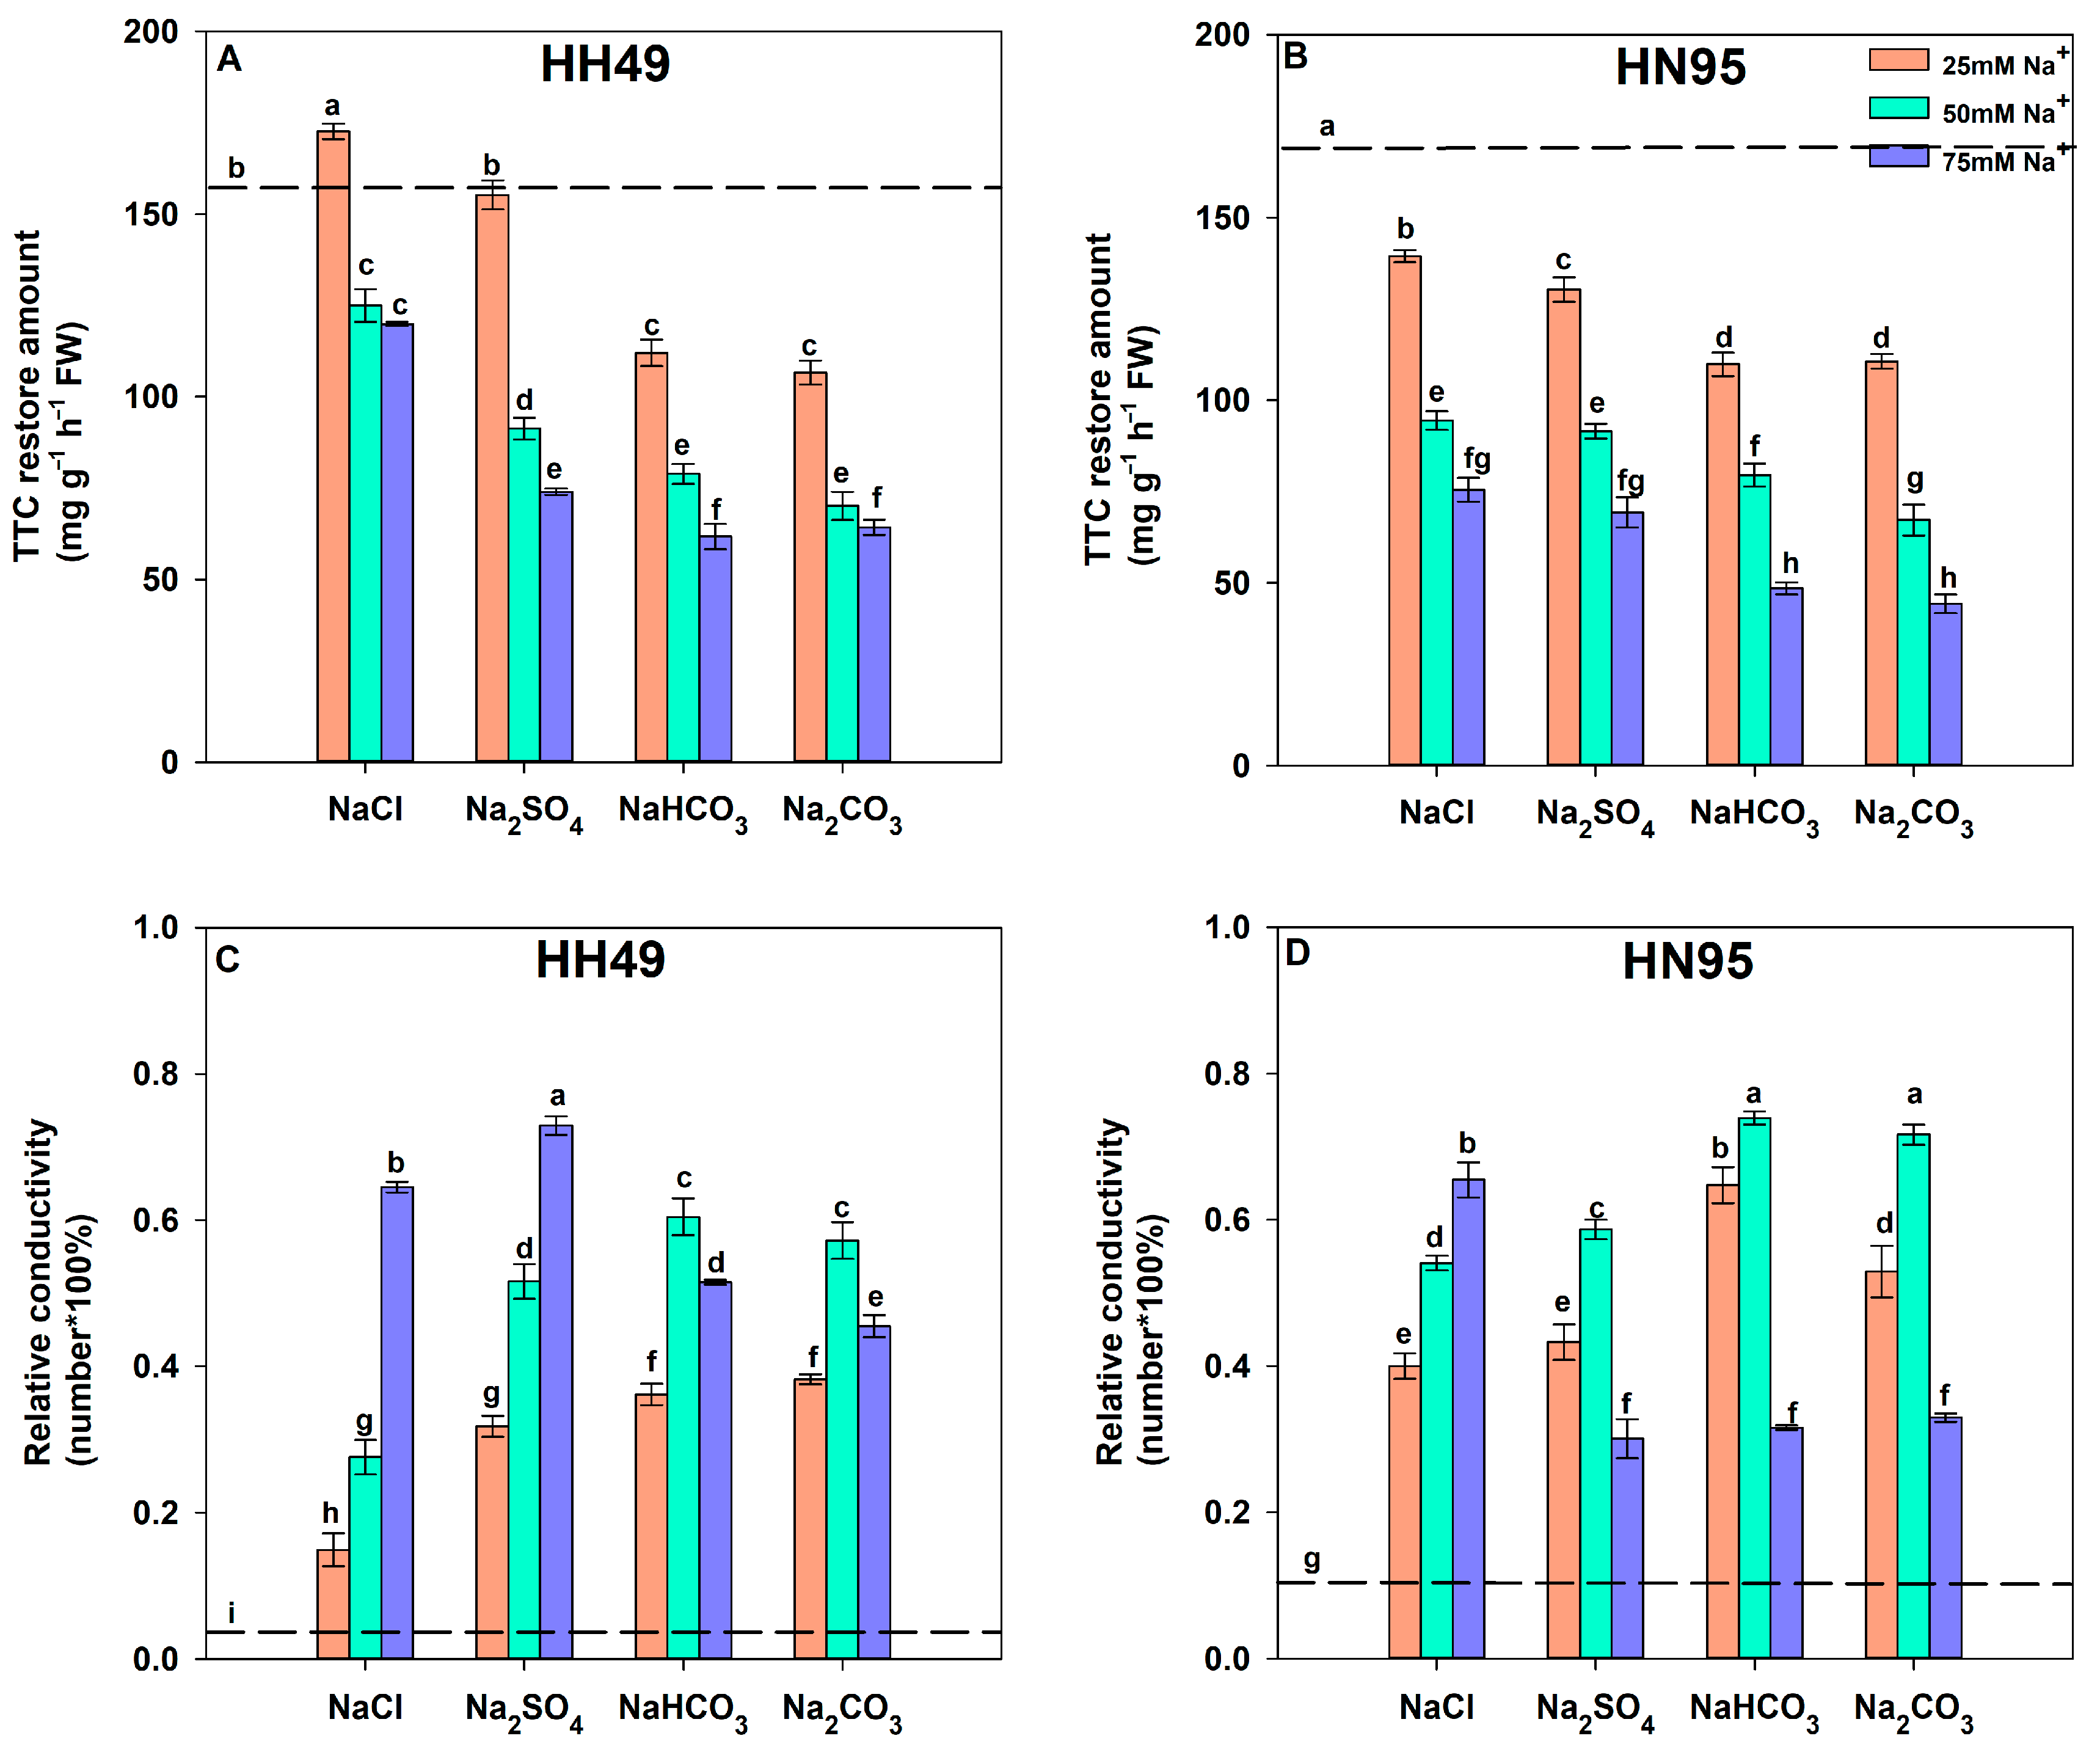
3.2. Effects of Different Salt Stress Treatments on the Root Activity and Relative Conductivity of Soybean Seedling Roots

The TTC restorations of the amount and relative conductivity of HH49 and HN9 seedling roots were determined to evaluate the effect of different salt stress treatments on root activity. Exposure to 25–75 mM Na+ stress (NaCl, Na2SO4, NaHCO3, and Na2CO3) for 3 days significantly reduced the TTC restoration amount of HH49 and HN95 seedling roots compared with the control, with the exception that 25 mM Na+ stress in the formula of NaCl treatment significantly increased the TTC restoration amount of HH49 seedlings (Figure 2A,B), while 25 mM Na+ stress in the formula of Na2SO4 had no significant effect on the TTC restoration amount of HH49 seedlings compared with the control. Furthermore, a dose-dependent decrease in TTC restoration amount was observed with increasing Na+ concentrations. When exposed to the same Na+ concentration of salt for 3 days, NaHCO3 and Na2CO3 treatments had a higher reduction in the TTC restoration amount of HH49 and HN95 seedlings than that of Na2SO4 and NaCl treatments. The same type and concentration of Na+ treatment reduced the TTC restoration amount of HH49 seedling roots less than that of HN95.
Compared with the control, all salt treatments significantly increased the relative conductivity of HH49 and HN95 seedling roots (Figure 2C,D). The relative conductivity in HH49 seedling roots was dose-dependently increased with the increasing Na+ concentration treatments in the formulas of NaCl and Na2SO4. In contrast, HH49 seedling roots showed higher relative conductivity under 50 mM Na+ treatment than that of 75 mM Na+ treatment when exposed to Na2CO3 and NaHCO3 treatments. The relative conductivity of HN95 seedling roots increased with increasing Na+ concentrations when exposed to NaCl treatment. However, the relative conductivity of HH95 roots under 75 mM Na+ treatment in the formulas of Na2SO4, NaHCO3, and Na2CO3 was the lowest among all salt treatments.

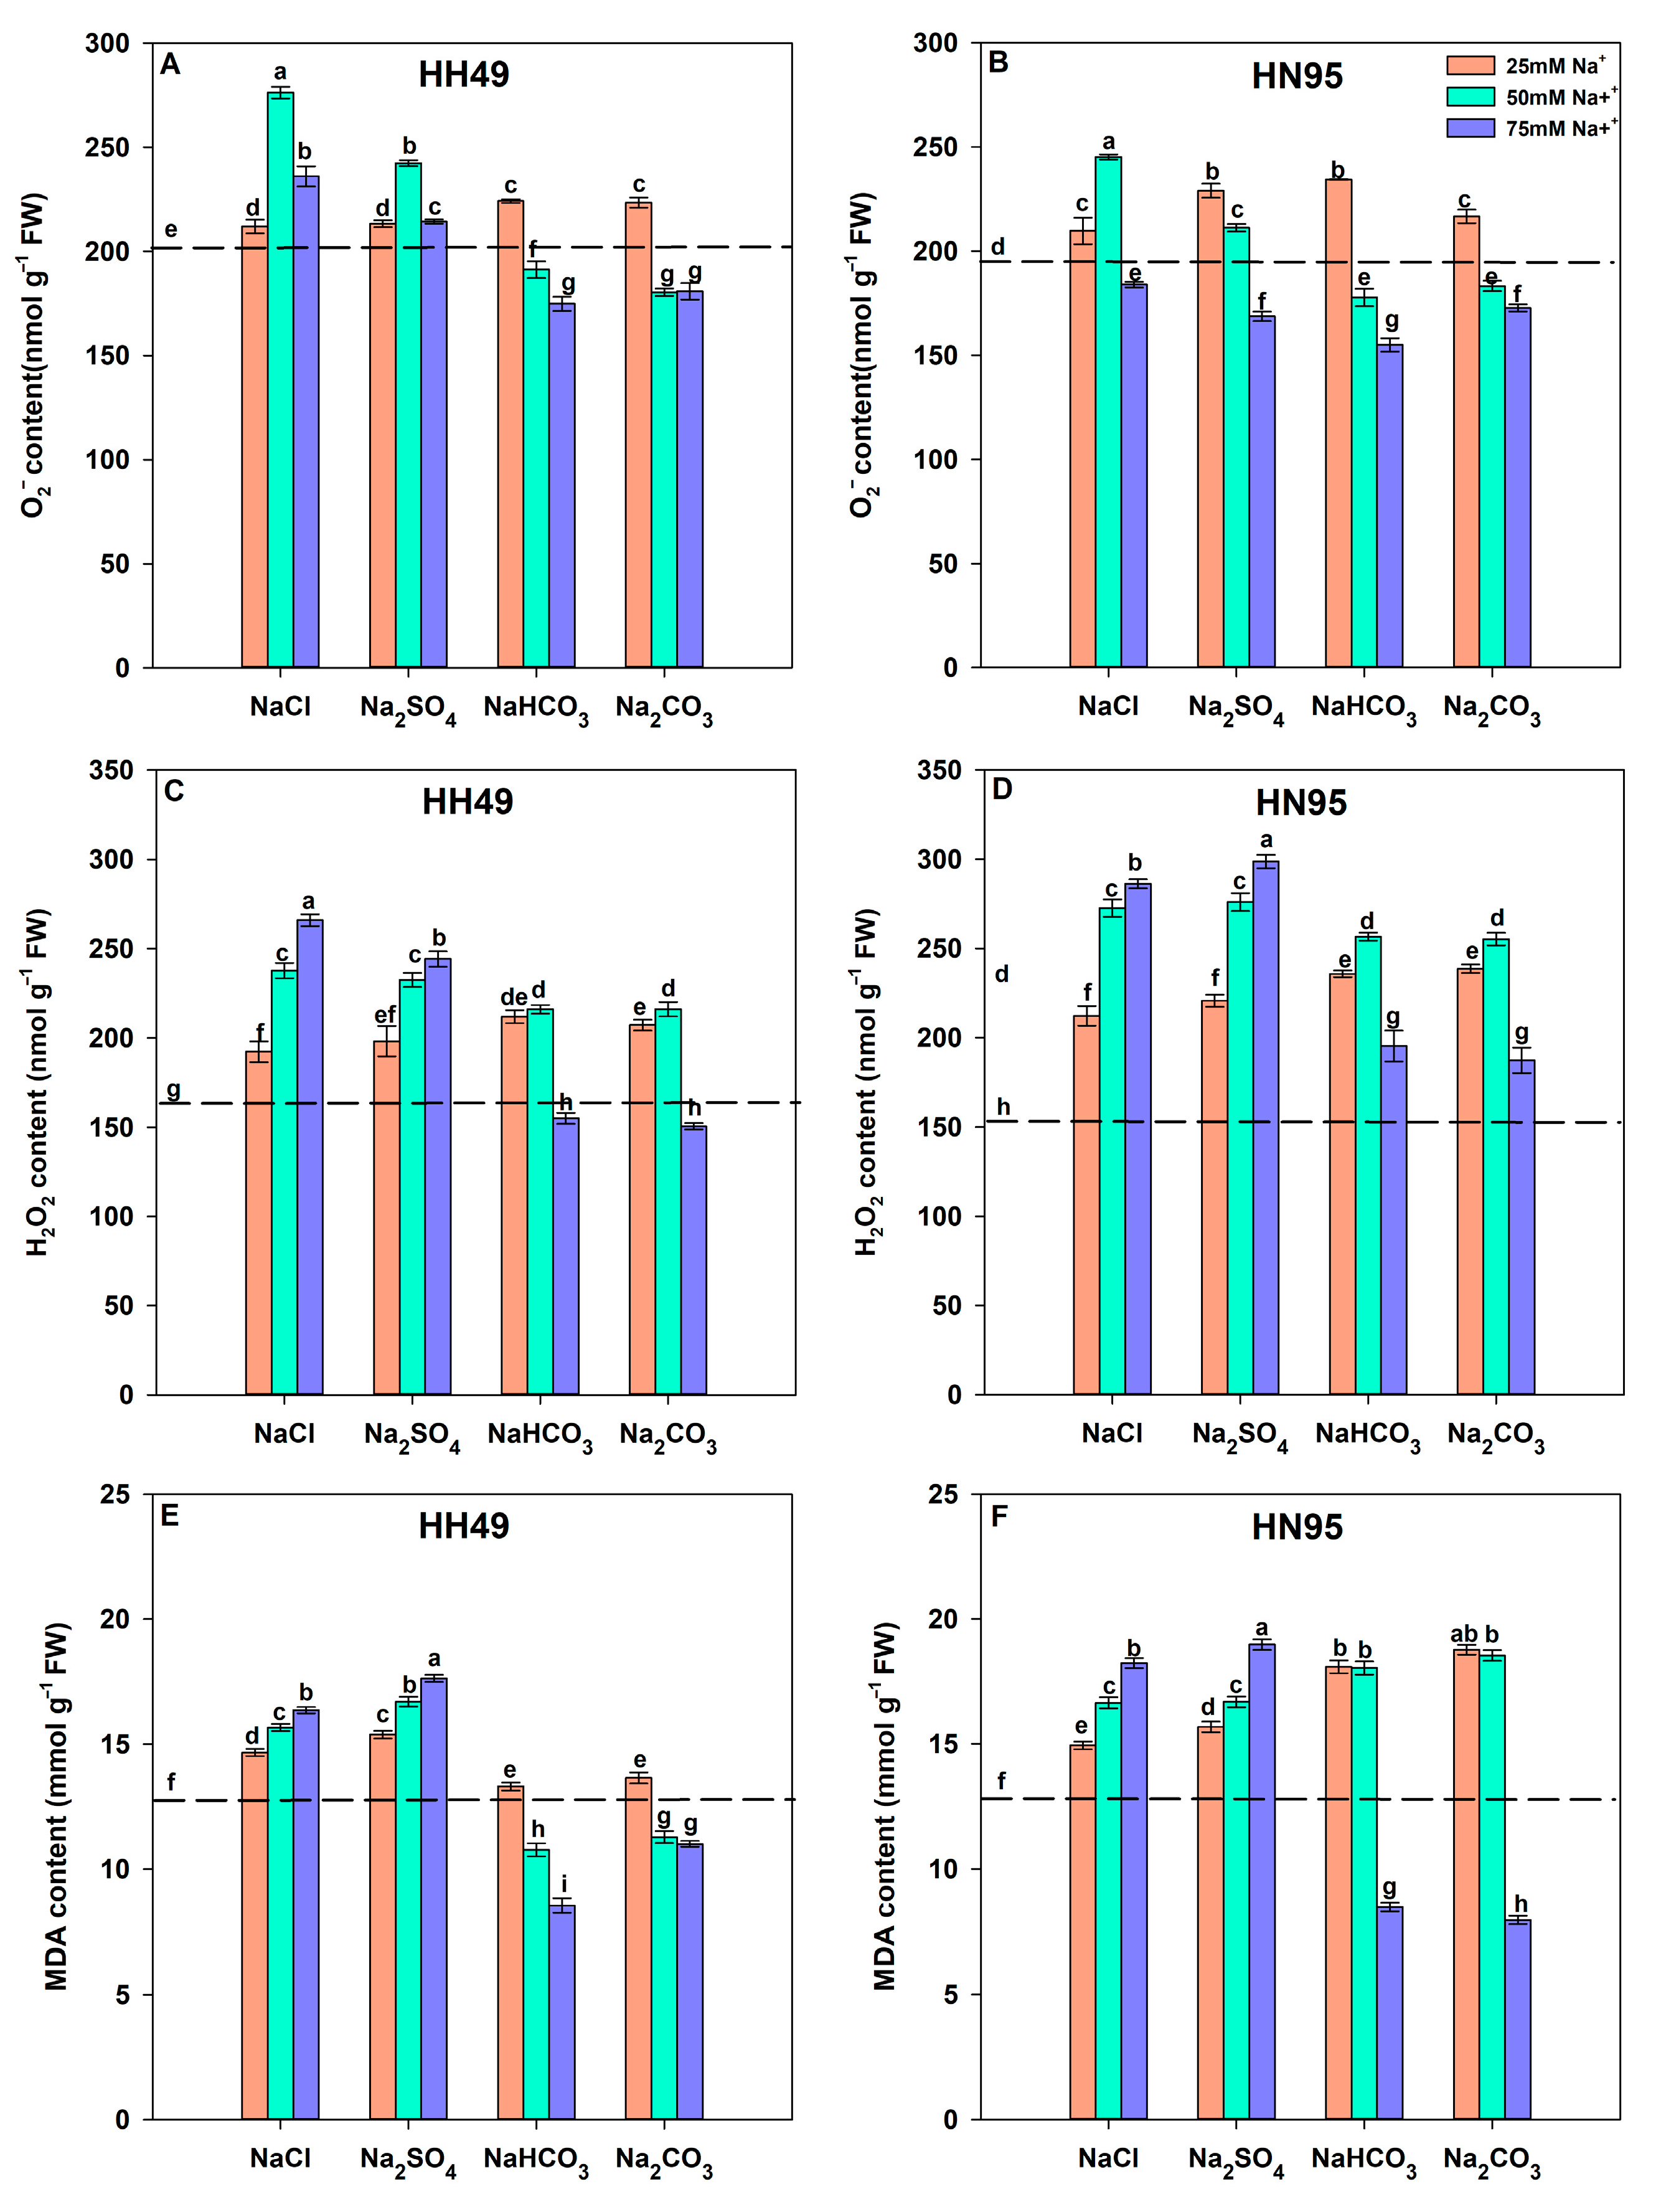
3.3. Effects of Different Salt Stress Treatments on ROS Accumulation in Soybean Seedling Roots

The contents of O2, H2O2, and MDA in HH49 and HN59 roots were determined to evaluate the effect of different salt-stress-treatment-induced oxidative stress on soybean seedlings. Exposed to 25–75 mM Na+ concentration treatments in a formula of NaCl and Na2SO4 significantly increased O2 content in HH49 and HN95 seedling roots, with the exception that 75 mM Na+ concentration treatments significantly decreased O2 content in HN95 seedling roots comparted with the control (Figure 3A,B). Furthermore, 50 mM Na+ concentration salt treatments induced higher O2 content in HH49 seedling roots than that under 25 and 75 mM Na+ concentration salt treatments. Meanwhile, O2 content in HN95 seedling roots was decreased in a dose-dependent manner with increasing Na+ concentrations in the formula of Na2SO4 treatments. Exposure to 25 mM Na+ concentration treatments in formulas of NaHCO3 and Na2CO3 treatments for 3 days significantly increased the O2 content in HH49 and HN95 seedling roots compared with the control. Conversely, 50–75 mM Na+ concentration treatments in the formulas of NaHCO3 and Na2CO3 treatments significantly decreased the O2 content in HH49 and HN95 seedling roots compared with the control, and a dose-dependent decrease in O2 content was observed with increasing Na+ concentrations.
Exposure to 25–75 mM Na+ concentration solutions in formula of NaCl and Na2SO4 for 3 days significantly increased the H2O2 and MDA content in HH49 and HN95 seedling roots compared with the control, and a dose-dependent increase in H2O2 and MDA content was observed with increasing Na+ concentrations (Figure 3C,F). Conversely, exposure to 25–50 mM Na+ concentration solutions in formulas of NaHCO3 and Na2CO4 for 3 days increased H2O2 and MDA content in HH49 and HN95 seedling roots compared with the control, with the exception that 50 mM Na+ concentration solutions in the formula of NaHCO3 decreased the MDA content in HH49 seedling roots compared with the control. Exposure to 75 mM Na+ concentration treatments in formulas of NaHCO3 and Na2CO4 for 3 days decreased the H2O2 and MDA content in HH49 seedling roots compared with the control. Meanwhile, 75 mM Na+ concentration treatments in formulas of NaHCO3 and Na2CO4 increased H2O2 content but decreased MDA content in HN95 seedling roots compared with the control.

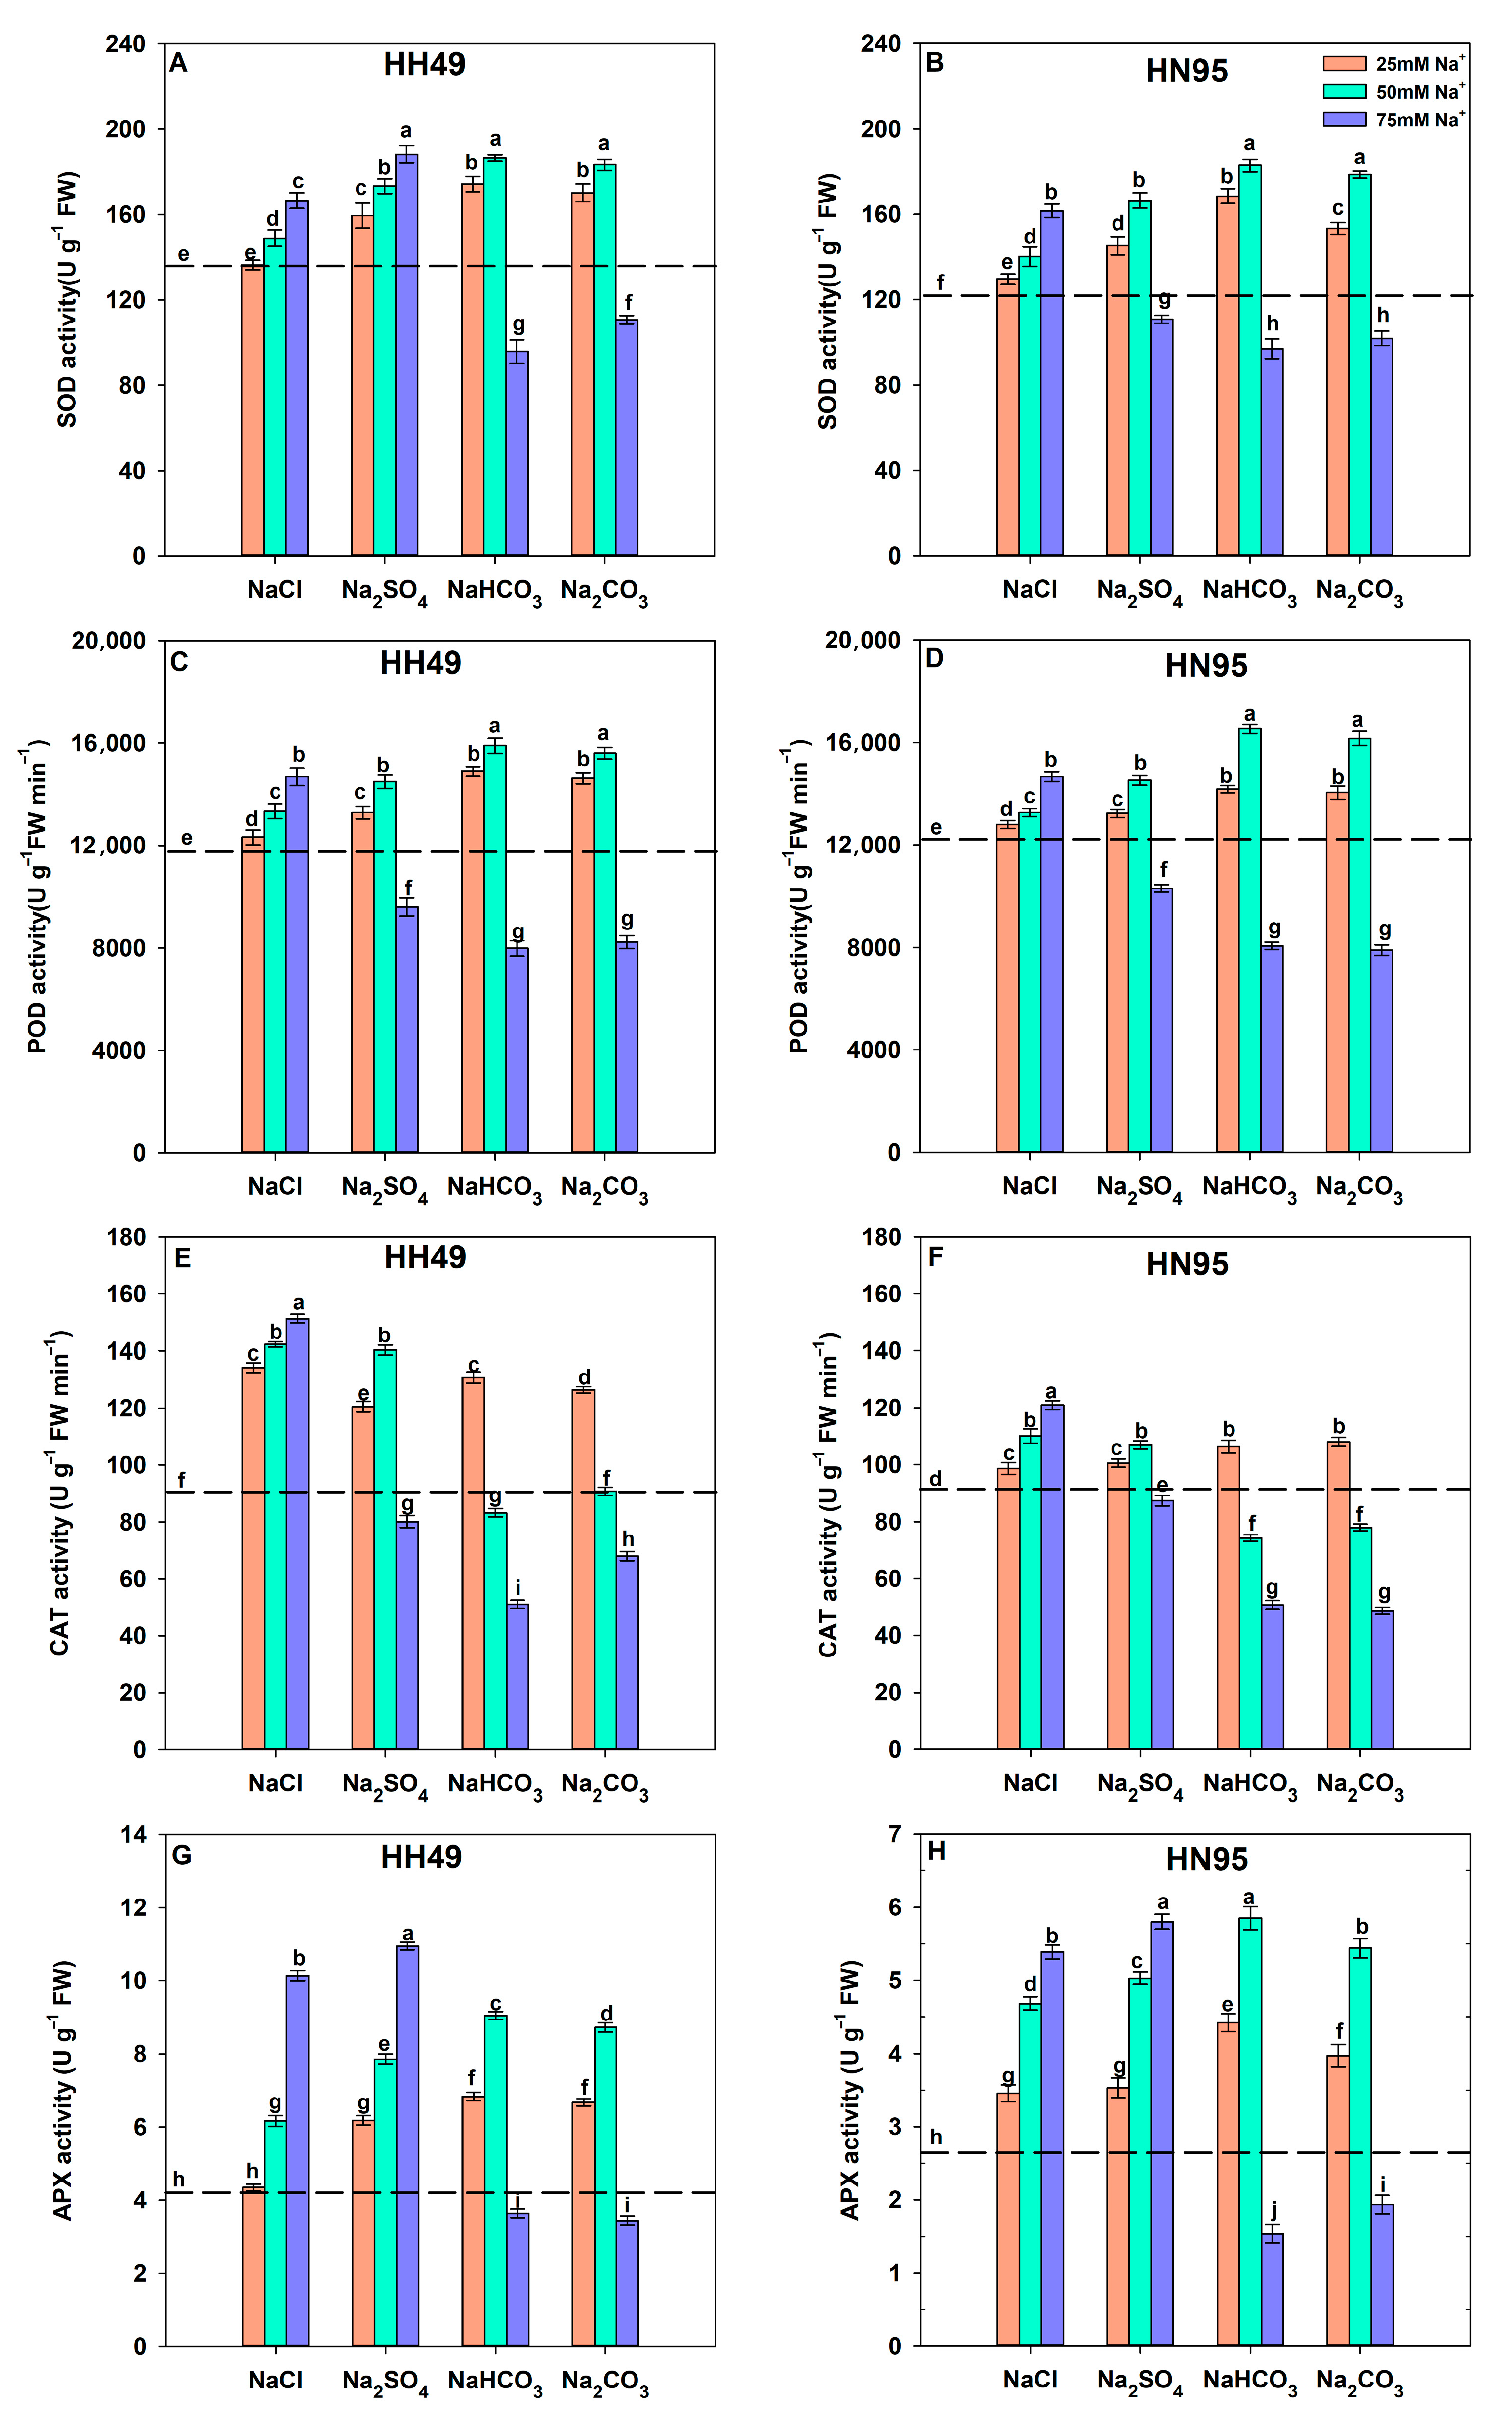
3.4. Effects of Different Salt Stress Treatments on Antioxidant Enzyme Activity in Soybean Seedling Roots

The activities of SOD, POD, CAT, and APX in HH49 and HN59 roots were determined to evaluate the effect of different salts stress treatments on the antioxidant defense of soybean seedlings. Exposed to 25–50 mM Na+ concentration treatments in formulas of NaCl and Na2SO4 significantly increased the activities of SOD, POD, CAT, and APX in HH49 and HN95 seedling roots comparted with the control (Figure 4), with an exception that 25 mM Na+ concentration treatments in the formula of NaCl had no significant effects on SOD and APX activities in HH49 seedling roots compared with the control. Furthermore, a dose-dependent increase in SOD, POD, CAT, and APX activities was observed with increasing Na+ concentrations. Conversely, 25–50 mM Na+ concentration treatments in formulas of NaHCO3 and Na2CO3 significantly increased the activities of SOD, POD, and APX in HH49 and HN95 seedling roots compared with the control. The activity of these antioxidant defense enzymes in HH49 and HN95 seedling roots under 50 mM Na+ concentration treatments in formulas of NaHCO3 and Na2CO3 was higher than that under 25 mM Na+ concentration treatments. Meanwhile, exposure to 25 mM Na+ concentration treatments in formulas of NaHCO3 and Na2CO3 significantly decreased the activities of CAT in HH49 and HN95 seedling roots compared with the control. When Na+ concentrations of salt treatment was 75 mM, NaCl treatment significantly increased the actives of SOD, POD, CAT, and APX in HH49 and HN95 seedling roots compared with the control. Exposure to 75 mM Na+ concentration treatments in formulas of Na2SO4, NaHCO3, and Na2CO3 decreased the activities of SOD, POD, CAT, and APX in HH49 and HN95 seedling roots, with the exception that 75 mM Na+ concentrations in formal of Na2SO4 treatments significantly increased the activities of SOD and APX in HH49 seedling roots and the activity of APX in HN95 seedling roots compared with the control.

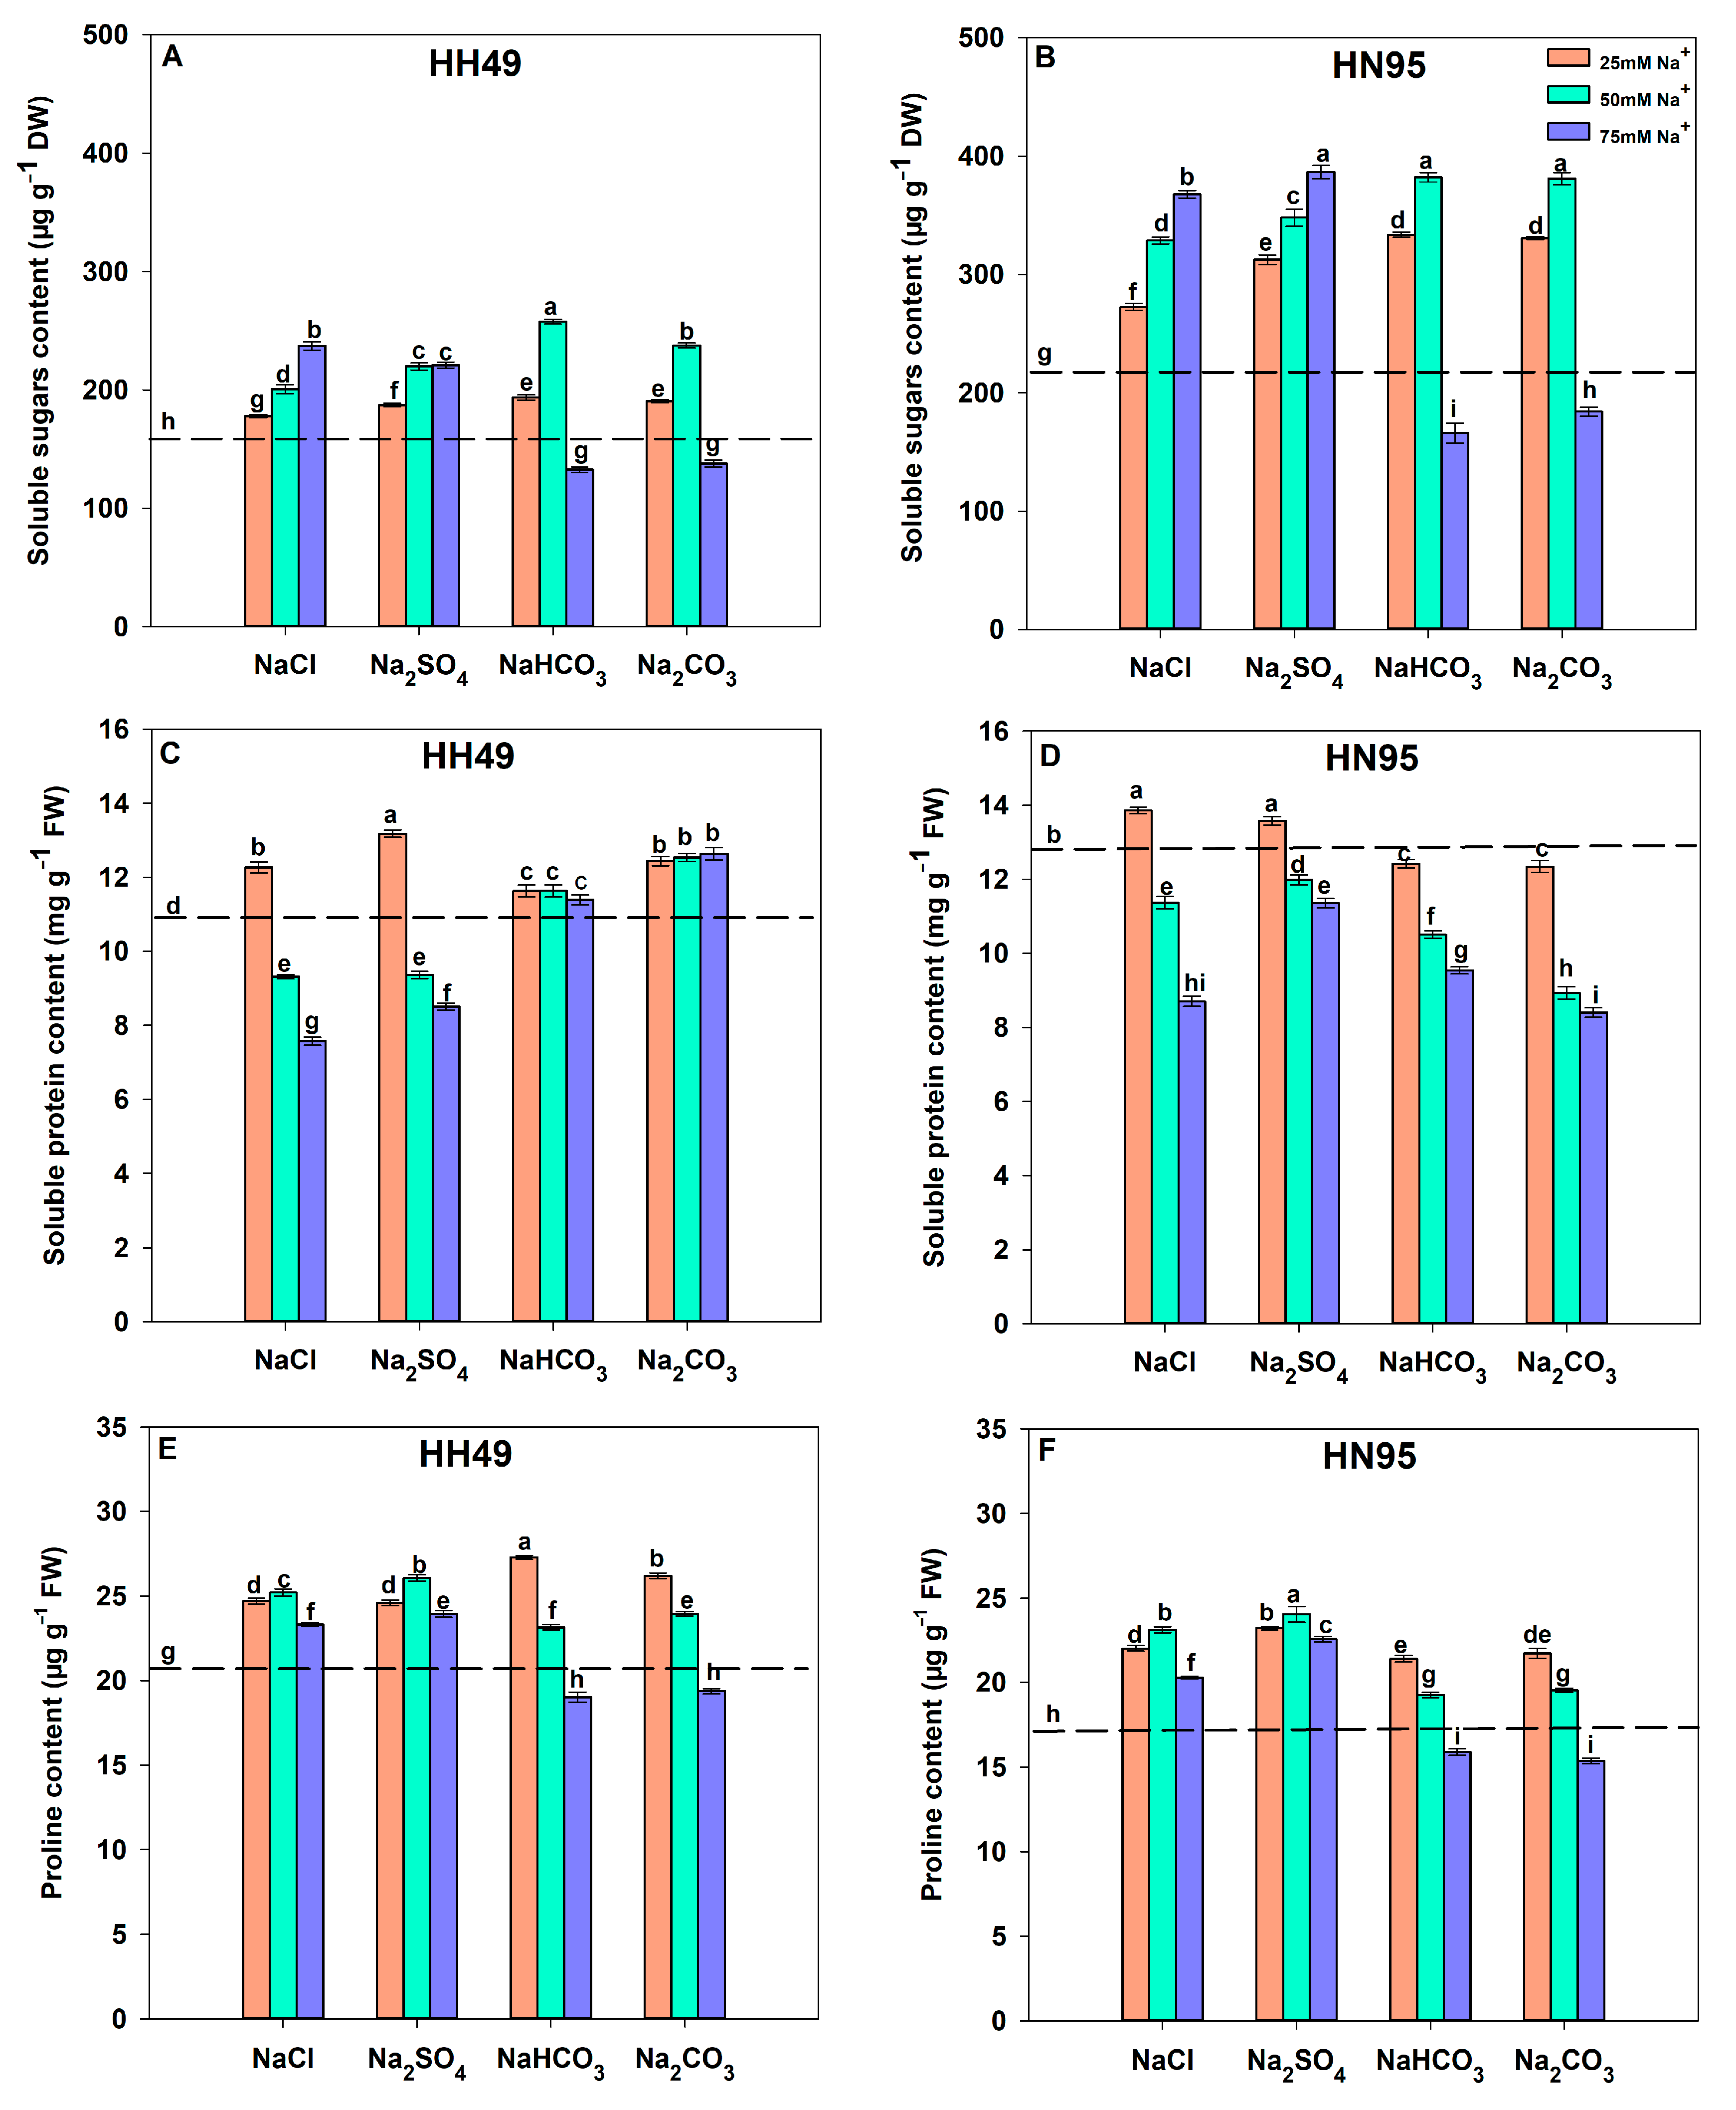
3.5. Effects of Different Salt Stress Treatments on Osmotic Regulator Content of Soybean Seedling Roots

The content of soluble sugars, soluble protein, and proline in HH49 and HN59 roots were determined to evaluate the effect of different salt stress treatments on osmotic regulation of soybean seedlings. Exposure to 25–75 mM Na+ concentration treatments in formulas of NaCl and Na2SO4 significantly increased the content of soluble sugars and proline in HH49 and HN95 seedling roots compared with the control (Figure 5), and a dose-dependent increase in soluble sugars and proline content was observed with increasing Na+ concentrations. Conversely, 25 mM Na+ concentration treatments in the formula of NaCl and Na2SO4 significantly increased soluble protein content in HH49 and HN95 seedling roots compared with the control. In contrast, exposure to 50–75 mM Na+ concentration treatments in formulas of NaCl and Na2SO4 significantly decreased soluble protein content in HH49 and HN95 seedling roots compared with the control. Furthermore, a dose-dependent decrease in soluble protein content was observed with increasing Na+ concentrations.
Compared with the control, exposure to 25–50 mM Na+ concentration treatments in the formula of NaHCO3 and Na2CO3 significantly increased the content of soluble sugars and proline in HH49 and HN95 seedling roots. In addition, exposure to 50 mM Na+ concentration treatments in formulas of NaHCO3 and Na2CO3 induced higher soluble sugars and proline content in HH49 and HN95 seedling roots than that under 25 mM Na+ concentration treatments. Conversely, 75 mM Na+ concentration treatments in formulas of NaHCO3 and Na2CO3 significantly decreased the content of soluble sugars and proline in HH49 and HN95 seedling roots compared with the control. A dose-dependent decrease in proline content was observed with increasing Na+ concentrations. Soybean seedlings exposed to 25–75 mM Na+ concentration treatments in formulas of NaHCO3 and Na2CO3 significantly increased soluble protein content in HH49 seedling roots compared with the control. Conversely, exposure to 25–75 mM Na+ concentration treatments in the formula of NaHCO3 and Na2CO3 significantly decreased soluble protein content in HN95 seedling roots when compared with the control, and a dose-dependent decrease in soluble protein content was observed with increasing Na+ concentrations.

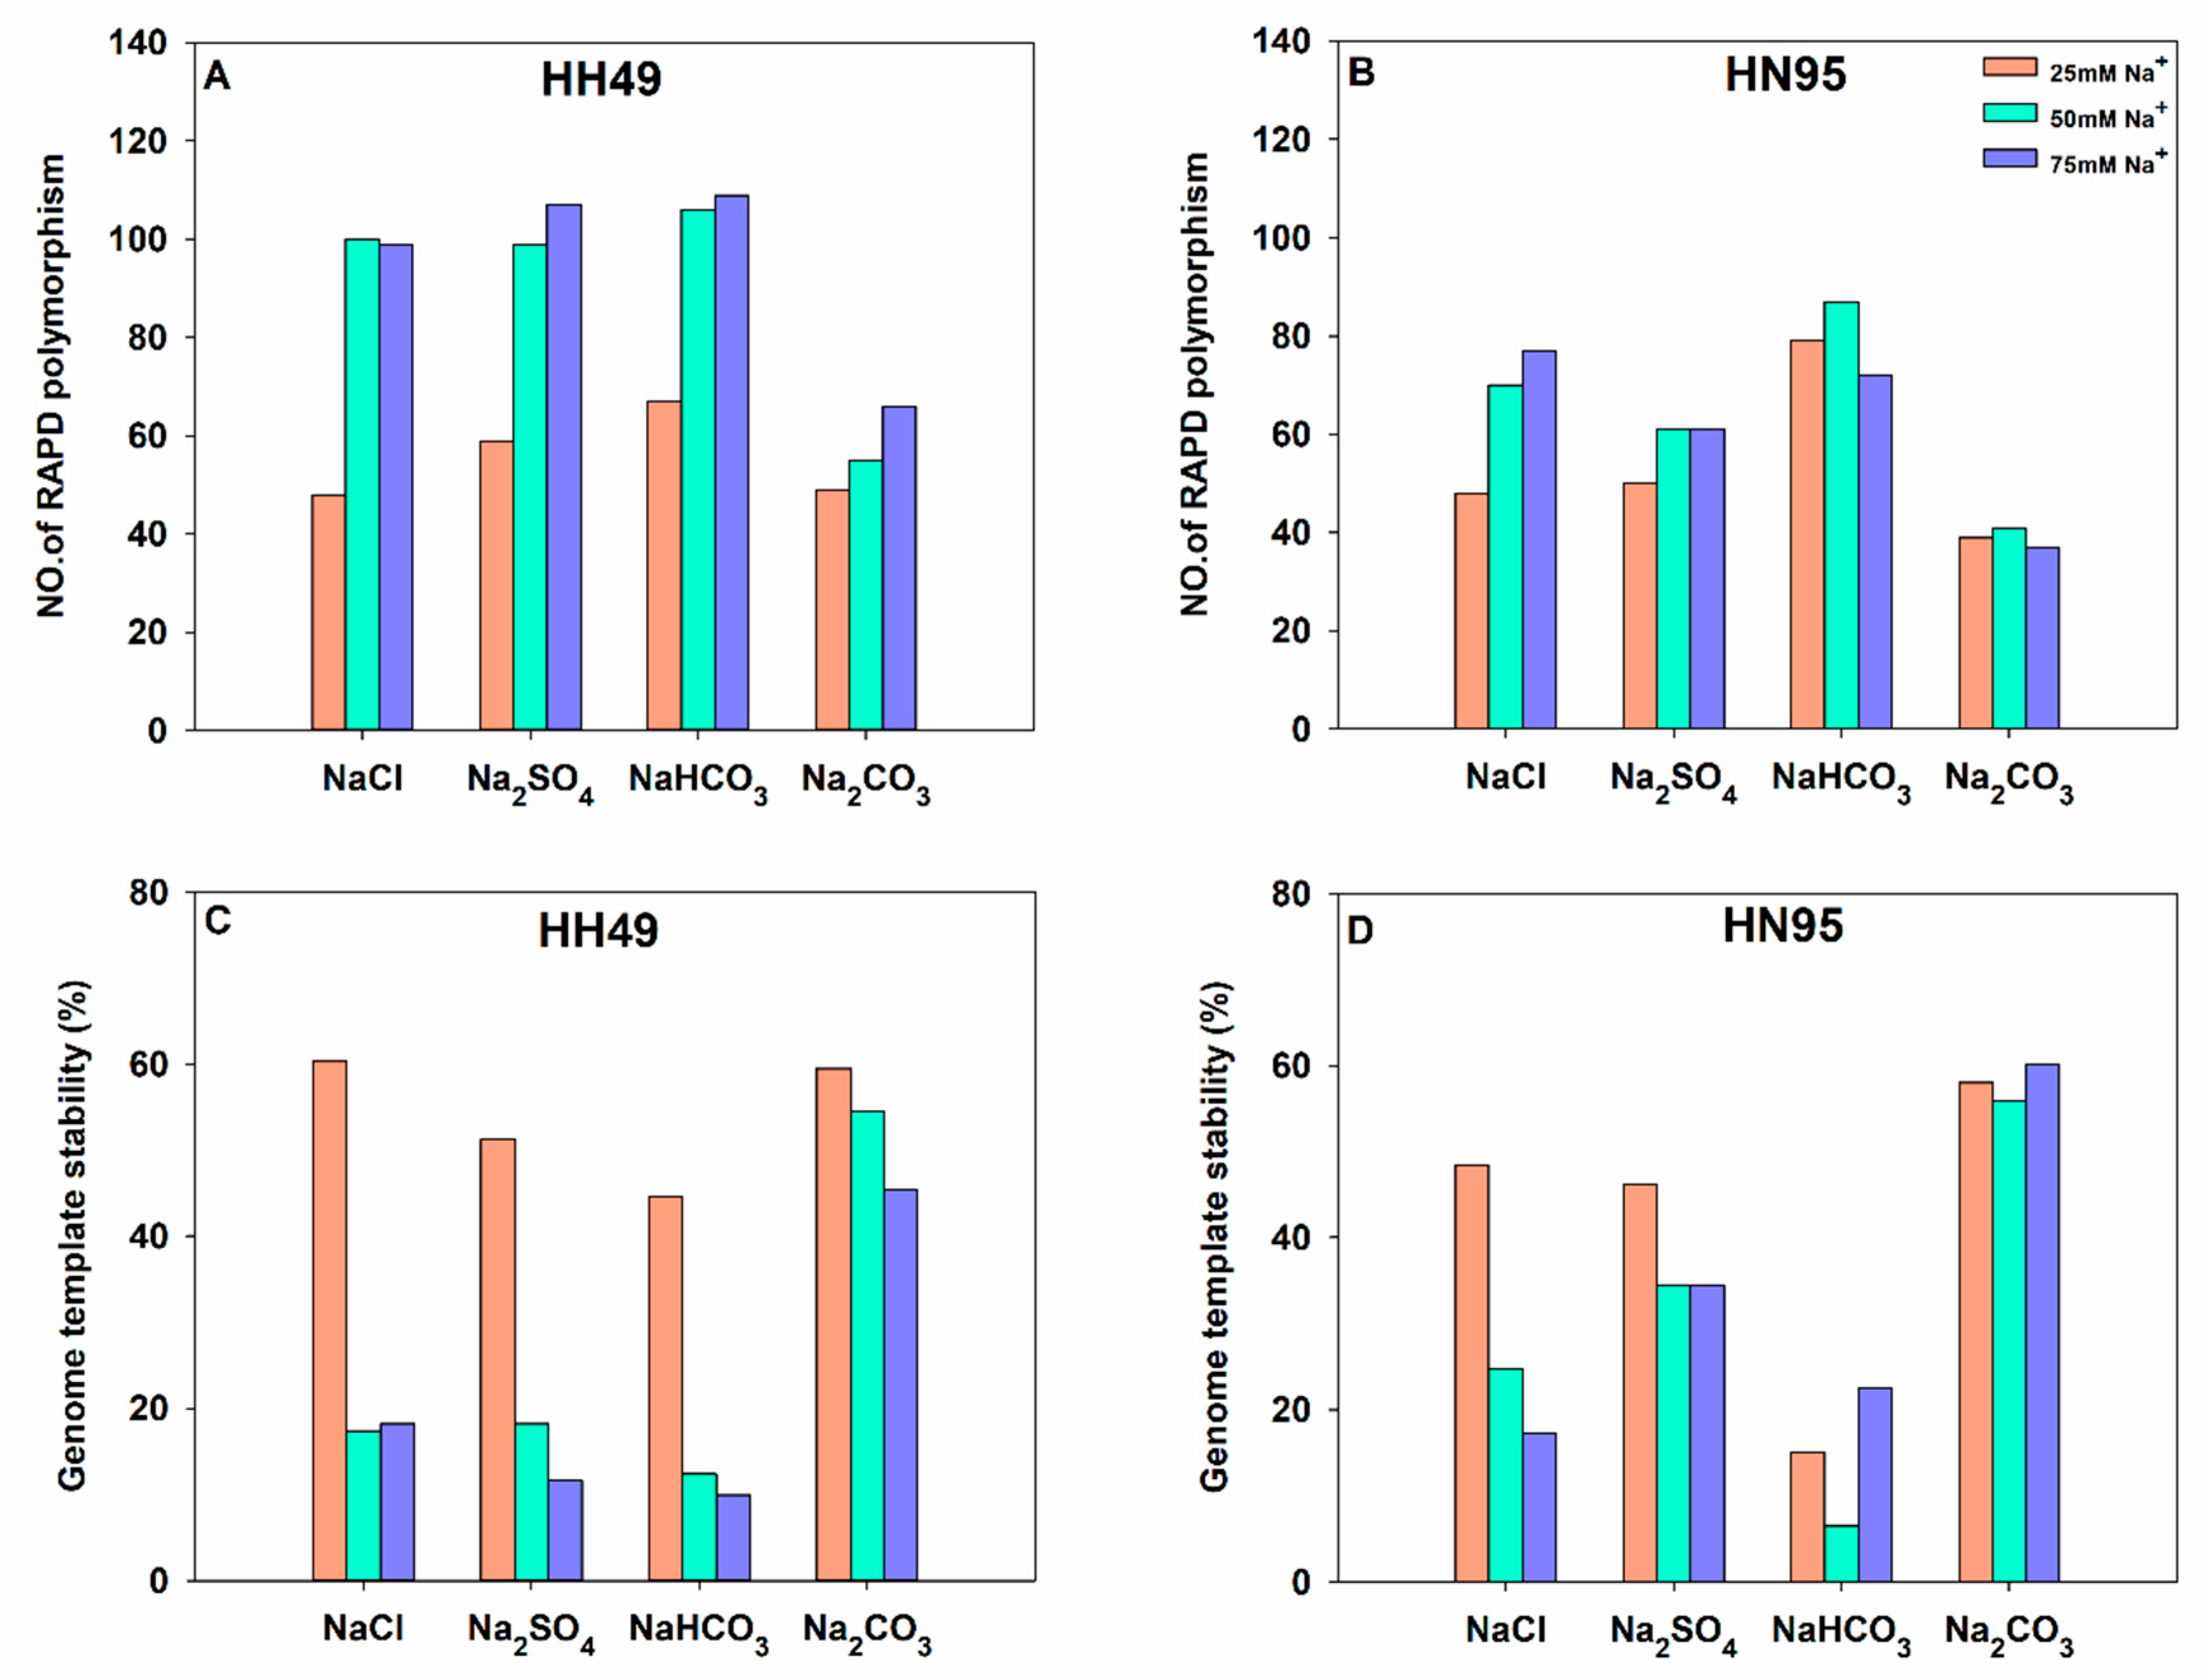
3.6. Effects of Different Salt Stress Treatments on DNA Oxidative Damage of Soybean Seedling Roots

RAPD analysis was used to evaluate the effect of different salt stress treatment on the DNA damage of HH49 and HN95 seedling roots. Compared with the control, all salt treatments could significantly increase the frequency of RAPD polymorphism and decrease the genome template stability (GTS) in both HH49 and HN95 seedling roots (Figure 6, Figures S1 and S2). Notably, a dose-dependent increase in RAPD polymorphism frequency was observed with the increasing Na+ concentrations (including NaCl, Na2SO4, and Na2CO3 treatments) in HH49 seedling roots. The RAPD polymorphism frequency in HN95 seedling roots was increased in a dose-dependent manner with the increasing Na+ concentration treatment in formulas of of NaCl and Na2SO4. However, the frequency of RAPD polymorphism in HN95 seedling roots under 75 mM Na+ concentration in formulas of NaHCO3 and Na2CO3 was less than that of under 50 mM Na+ concentration treatment. When exposed to the same Na+ concentration of salt for 3 days, NaHCO3 treatments induced the highest frequency of RAPD polymorphisms and the smallest GST in both HH49 and HN95 seedling roots among all salt treatments, with the exception that 75 mM Na+ treatment in the formula of NaCl induced the highest frequency of RAPD polymorphisms and the smallest GST than that of 75 mM Na+ treatment in the formula of NaHCO3 in HN95 seedling roots. Expose to the same type and concentration of Na+ treatment induced more RAPD polymorphism frequency and lower GST in HH49 than that of HN95.

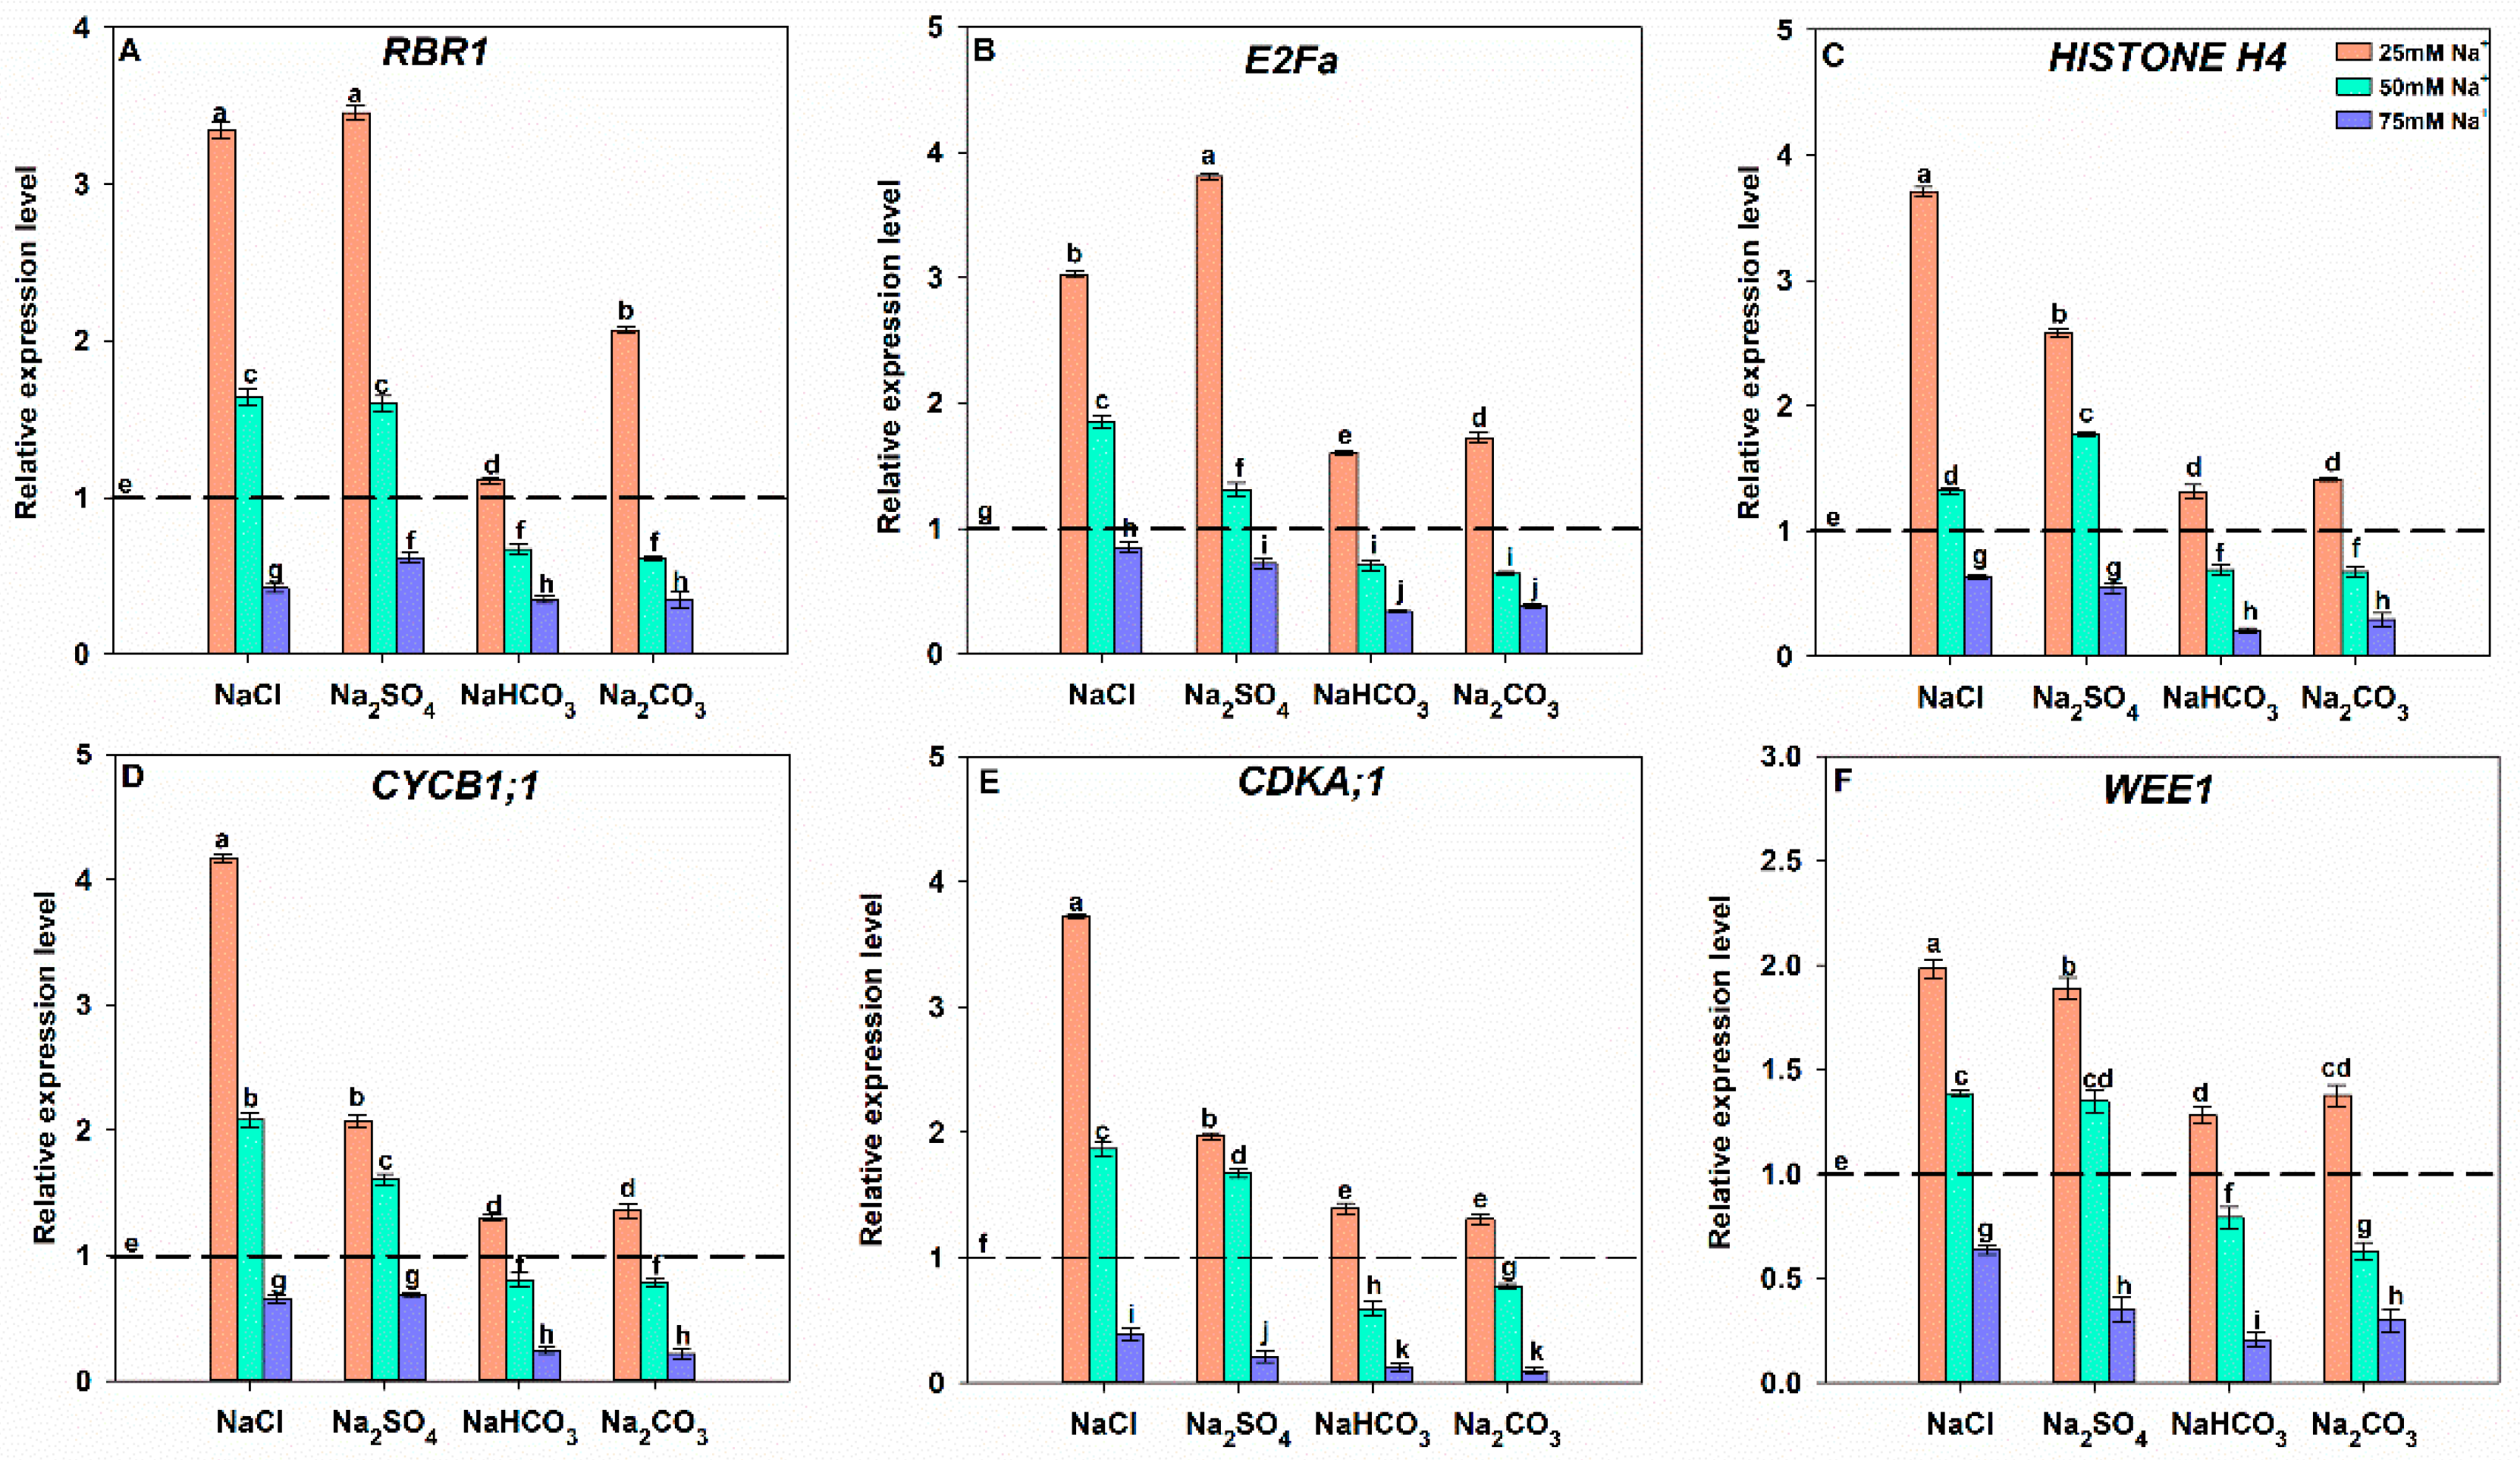
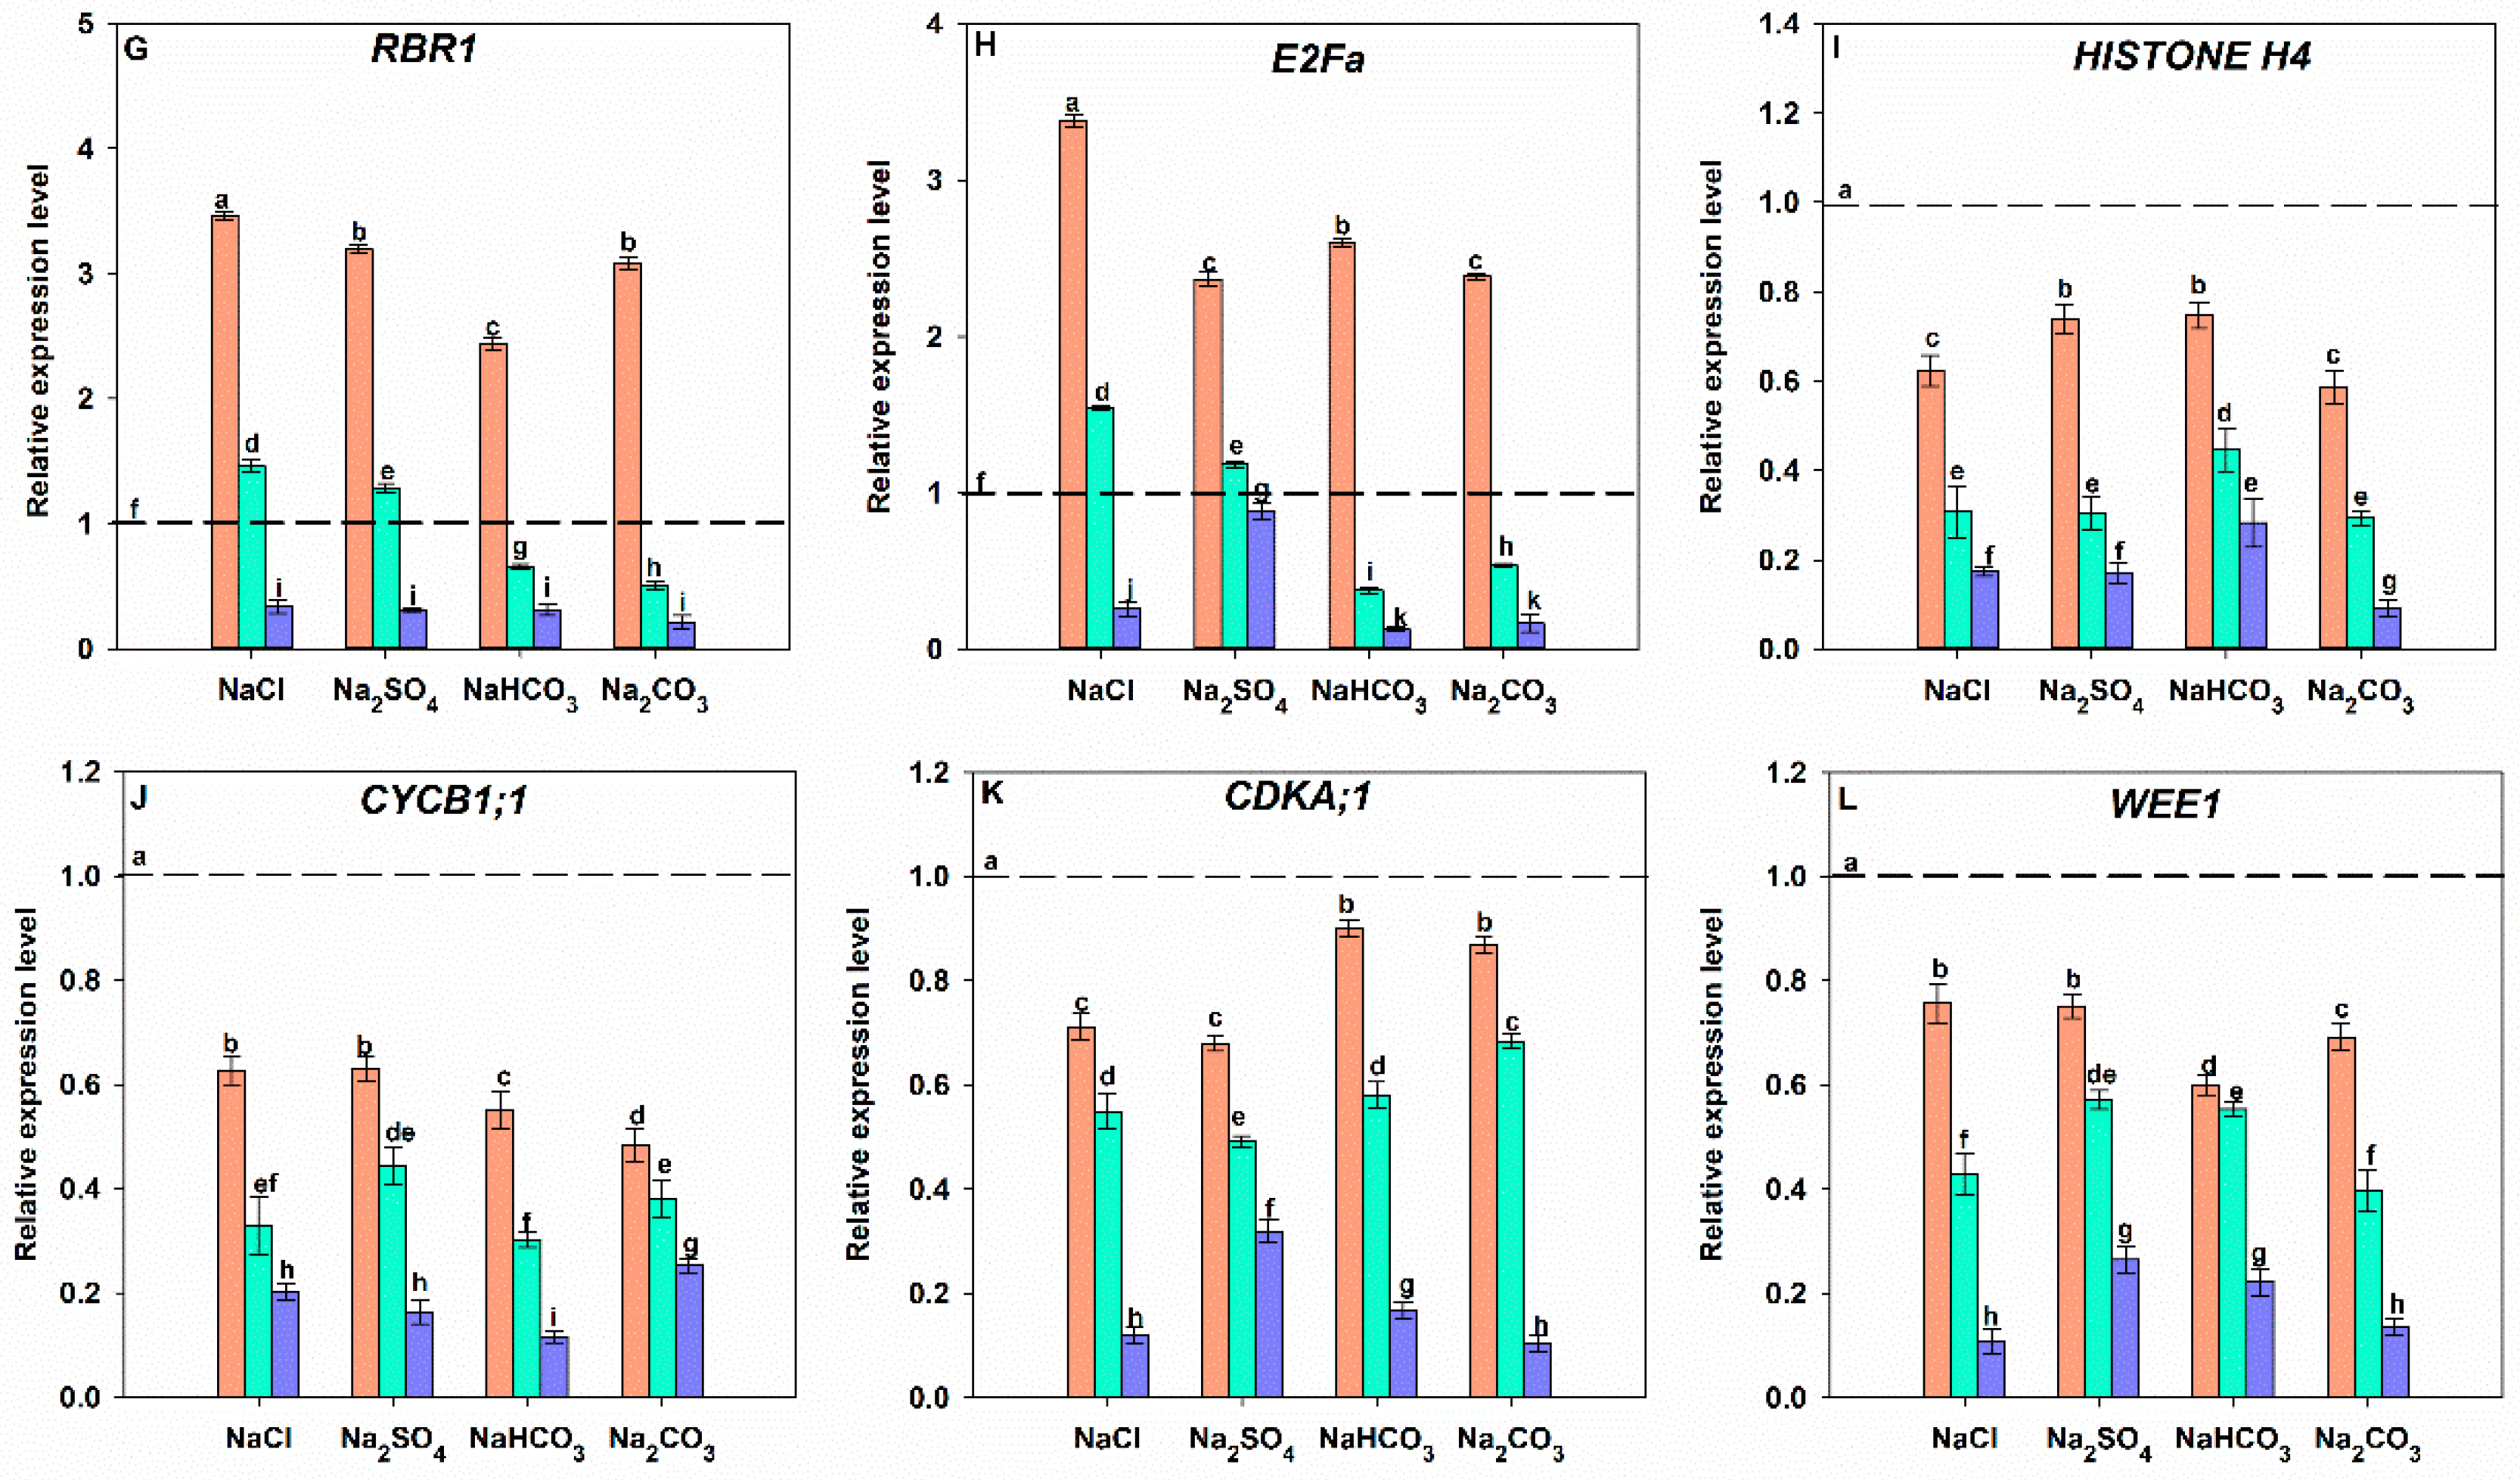
3.7. Effects of Different Salt Stress Treatments on Cell Cycle Progression of Soybean Seedling Roots

In order to study the effects of different salt stress treatments on cell cycle of soybean seedling roots, the expression levels of RBR1, E2Fa, HISTONE H4 (G1/S phase transition regulation/marker genes), CYCB1;1, CDKA;1, and WEE1 (G2/M phase transition regulation/marker genes) were studied via qRT-PCR analysis (Figure 7). Compared with the control, 25 mM Na+ concentration treatments in formula of NaCl, Na2SO4, NaHCO3, and Na2CO3 and 50 mM Na+ concentration treatments in formulas of NaCl and Na2SO4 significantly upregulated the expression levels of RBR1, E2Fa, HISTONE H4, CYCB1;1, CDKA;1, and WEE1 in HH49 seedling roots, and the expression levels of RBR1 and E2Fa in HN95 seedling roots. Conversely, 50 mM Na+ concentration treatments in formulas of NaHCO3 and Na2CO3 significantly downregulated the expression levels of RBR1, E2Fa, HISTONE H4, CYCB1;1, CDKA;1, and WEE1 in HH49 seedling roots, whereas the expression levels of RBR1 and E2Fa were significantly downregulated in HN95 seedling roots. Furthermore, 75 mM Na+ concentration treatments in formulas of NaCl, Na2SO4, NaHCO3, and Na2CO3 significantly downregulated the expression levels of G1/S and G2/M phase transition regulation/marker genes in both HH49 and HN95 seedling roots compared with the control. The expression levels of HISTONE H4, CYCB1;1, CDKA;1, and WEE1 in HN95 seedlings were downregulated by all salt stress treatments compared with the control.

4. Discussion

Salt stress in the environment is a long-term stress that runs throughout the whole life cycle of the plant. Generally, with the prolongation of stress time, plants undergo two stress response stages. The first stage is the response of plants to short-term stress (caused by water or osmotic stress) [45]. The second stage is the response of plants to long-term salt stress exposure (caused by ion toxicity) [46,47]. An important adaptive function of plant survival under salt stress conditions is to slow down the growth rate, which provides extra energy and biomass for plants to cope with salt stress via various strategies [48]. When exposed to salt stress, a series of physiological and biochemical reactions occur in plants to prevent, reduce, or compensate for the damage induced by salt stress. Several studies have shown that different types of salt stress have significant differences in the degree of stress and mechanism by which plants respond to stress [49,50]. The damage to plants caused by neutral salt stress is usually caused by the accumulation of Na+ [45]. Alkaline stress can also create a high pH environment, resulting in more serious growth inhibition of plants [46]. Consistent with previous studies [51], when soybean cultivars HH49 and HN95 seedlings were exposed to different types of salt stress with the same Na+ concentration, alkaline stress showed a higher degree of inhibition on root growth than plants grown under neutral salt stress (Figure 1, Table 1).
Salt stress conditions have significant effects on plant growth through primary salt damage (including ion extravasation caused by plasma membrane damages, metabolic block caused by enzyme passivation and osmotic stress) and secondary salt damage (oxidative damage, etc.) [52]. Plasma membrane damage and osmotic stress can destroy the water potential relationship and the equilibrium state of ion distribution between plant and environment [53]. Cell membrane is a necessary barrier for cells to maintain a stable intracellular metabolic environment, and its selective permeability can regulate and select the entry and exit of substances. Osmotic stress and ion toxicity induced by salt stress will affect cytoplasmic membrane components, permeability, transport, and ion flow rate, affecting normal membrane function as well as the metabolic activities and physiological functions of cells [54]. For example, a high concentration of Na+ can displace Ca2+ bound by the plasma membrane and inner membrane system, resulting in an increase in Na+/Ca2+ ratio in membrane-bound ions, damaging membrane structural integrity and resulting in extravasation of intracellular electrolytes, K+, P+, and organic solutes [55,56]. In addition, previous results have shown that in addition to Na+ accumulation, the content of Cl and SO42− ions increased in plants under neutral salt stress, while alkaline stress limited the accumulation of anions in plant cells due to the high pH [57]. This difference in ion accumulation and homeostasis may also be responsible for the stronger inhibitory effect of alkaline stress on plant growth than neutral salt stress. In this study, salt stress could lead to the destruction of the cell membrane and electrolyte leakage in the roots of the two soybean cultivars, which was illustrated by the increased relative electrical conductivity in the seedling roots of both soybean cultivars as well as the inhibition of root activities (Figure 2). In addition, under the same Na+ treatment (25, 50 mM), the amount of electrolyte infiltration in the two soybean roots under alkaline salt treatment was higher than that under neutral salt stress treatment, while the root activity under alkaline stress treatment was lower than that under neutral salt stress treatment. It is worth noting that when the Na+ ion concentration reached 75 mM, the relative electrical conductivity of the roots of the two soybean cultivars under alkaline stress was lower than that under the 50 mM Na+ treatment, which may have been due to serious damage to the cell membrane in the 75 mM alkaline stress, resulting in the leakage of intracellular electrolytes into the salt treatment solution. Interestingly, when the two soybean cultivars were exposed to the same concentration of Na+ concentration (same type of salt), the salt-tolerant cultivar HH49 had a lower decrease in root activity and a lower increase in relative conductivity than the salt-sensitive cultivar HN95. These results indicated that alkaline stress caused a greater degree of cell membrane damage to soybean seedling roots than neutral salt stress at the same Na+ concentration. The degree of electrolyte exosmosis and the reduced degree of root activity in different soybean cultivars may be related to the salt tolerance of soybean cultivars.
Among the secondary salt damage to plant cells caused by salt stress, oxidative stress response caused by ROS accumulation is more common than other stress [58]. The accumulation of ROS in plant cells can produce oxidative effects on macromolecules, such as cell membranes, nucleic acids, and biological enzymes, thus disrupting normal physiological processes [59]. In this study, salt stress significantly impacted the H2O2, O2, and MDA contents in plant cells (Figure 3). H2O2 can form the more chemically active and aggressive ROS·OH with O2 by the Haber–Weiss reaction. Therefore, timely removal of H2O2 is crucial to prevent free radical poisoning. To eliminate or mitigate oxidative stress damage caused by ROS accumulation, plants activate enzymatic systems (e.g., SOD/POS/CAT/APX) and non-enzymatic systems (e.g., ascorbate pathway, ASA, glutathione, GSH). Superoxide anions react with hydrogen ions in plants under the action of SOD to formulas of hydrogen peroxide and oxygen, reducing the damage of O2 to the cell membrane. The high concentration of H2O2 in plant tissues is mainly scavenged by CAT and APX, while a lower concentration of H2O2 is mainly decomposed by POD [60,61]. Furthermore, APX is widely distributed in all cellular compartments and high affinity to H2O2, suggesting that APX plays a crucial role in controlling the ROS level in plants [60]. In this study, salt stress significantly changed the activities of SOD/POD/CAT and APX enzymes in the two soybean varieties, which contributed to the elimination of ROS accumulation (Figure 3 and Figure 4). However, when the production rate of intracellular ROS exceeded the scavenging capacity, oxidative stress response will be generated, resulting in the decline of antioxidant enzyme activity [62]. In this study, higher concentrations of alkaline stress could lead to the decrease in SOD/POD/CAT/APX activities in the two soybean cultivars, while higher concentrations of neutral salt stress could lead to the decrease in POD and CAT enzyme activities in the two soybean varieties (Figure 4). High concentrations of alkaline stress can induce the decrease in H2O2, O2, and MDA contents in HH49 and HN95 seedling roots, while high concentrations of neutral salt stress can increase them. This may due to the alkaline stress inducing a higher level of cell membrane damage than neutral salt stress, releasing more cytochylema into the treatment solution. In addition, the increase in membrane damage can also lead to the decrease in antioxidant enzyme activity. It is worth noting that when exposed to the same salt stress treatment, the activity of antioxidant enzymes in the salt-stress-tolerant cultivar HH49 was higher than that in the salt-sensitive cultivar, indicating a higher scavenging capacity of ROS and resulting in a lower accumulation of ROS. Previous studies have also shown that the scavenging capacity of ROS has a significant positive correlation with the tolerance of plants to abiotic stress [63].
Regardless of whether plants are exposed to neutral salt or alkaline stress, plants often accumulate a large number of inorganic ions in vacuoles to increase cell osmotic potential and reduce cell water potential [64]. Although it takes far less energy for plants to absorb and accumulate inorganic ions than it does to synthesize organic materials [65], excessive ion intake can cause ion toxicity in cells. Therefore, plants often synthesize organic matter, such as proline, betaine, choline, or organic acids, to regulate the osmotic potential inside and outside the cell [46]. In addition, some metabolic intermediates, such as sugars and their derivatives, also play an important role in plant resistance to osmotic stress caused by salt stress [57]. In this study, salt stress significantly affected the soluble sugar and proline content in the two soybean cultivars, which was consistent with previous studies (Figure 5). In the 75 mM Na+ alkaline salt treatment, the soluble sugar and proline content in the two soybean cultivars was significantly lower than that in the control. This may have been due to the membrane rupture of a large number of cells in soybean roots under the high concentration of alkaline salt treatment, resulting in the leakage of cytoplasmic substances. Several studies have shown that soluble proteins are important osmotic regulators and nutrients [57,66]. However, it should not be ignored that both ion toxicity and ROS stress response can lead to changes in some protein configurations and degradation, resulting in changes in soluble protein content [67]. Previous studies also showed that the content of soluble protein in maize seedlings showed a pattern of decrease with the increase in salt treatment concentration [66]. In this study, soluble protein content in HH49 and HN95 seedling roots under low concentrations of salt stress was higher than that under the control and other salt treatments, which may be an effective mechanism of soybean salt response to osmotic stress. However, the content of soluble protein in HH49 and HN95 seedling roots under neutral salt stress was dose-decreased with increasing salt concentration, which may have been due to a high concentration of neutral salt stress destroying the osmotic regulatory mechanism involved in soluble proteins. The degradation or configuration change of some proteins caused by abiotic stress can result in the increase in soluble protein content, which was the result of protein damage [67]. This may also have been the result of a higher soluble protein in HH49 under alkaline stress than that in the control. Conversely, the decrease in soluble protein content in HN95 roots under alkaline salt stress may have been the result of osmotic regulation mechanism destruction and membrane destruction.
DNA is one of the most common targets of oxidative stress in organisms [68]. Oxidative stress can destroy the DNA carbohydrate composition, purine, pyrimidine, and phosphodiester bonds, resulting in various types of DNA damage, including chromosome breaks, inter-strand and intra-strand cross-linking, and single base mutations [69,70]. DNA damage will lead to the increase in genomic instability, resulting in cytotoxicity and genotoxicity to the organism, thus affecting the normal physiological activities of the organism [43]. Studies have shown that persistent oxidative damage to DNA can induce programmed cell death, plant growth inhibition or death, and accelerated aging, as well as significantly promoting the occurrence of some common diseases in mammals, such as colon cancer, breast cancer, rectal cancer, prostate cancer, and Alzheimer’s disease [71,72]. In this study, compared with the control group, salt stress led to significant DNA oxidative damage in the roots of the two soybean cultivars (Figure 6). Under the same Na+ concentration treatment, RAPD polymorphisms in soybean roots under the NaHCO3 treatment were the highest and the GS was the lowest, indicating that DNA damage was the greatest in the NaHCO3 treatment, which may have been caused by the high pH value of NaHCO3. The degree of DNA damage in salt-tolerant cultivars was higher than that in salt-sensitive soybean cultivars when they were exposed to the same salt stress. This may have been due to the DDT mechanism, which allows more tolerant plants to carry on with slightly damaged DNA. The DTT mechanism allows plants to use slightly damaged DNA as a template for DNA replication, maintaining cell division and tissue growth, but resulting in the increase in DNA damage levels [43]. Previous studies have shown that the generation of DNA damage leads to cell cycle arrest [43,73]. In this study, a low concentration of alkaline stress and a low medium concentration of neutral salt stress significantly upregulated the expression levels of G1/S and G2/M phase management genes in the salt-tolerant soybean cultivar HH49, indicating that cell division was promoted. A moderate concentration of alkaline stress and a high concentration of all salt stress could significantly inhibit the cell cycle. However, in the salt-sensitive soybean cultivar HN95, even a low concentration of salt stress could lead to the decrease in the expression levels of G1/S management gene HISTONE H4 and G2/M phase management and marker genes, indicating that a low concentration of salt stress could lead to the arrest of the root cell cycle in the G1/S phase of HN95 seedlings. These results suggest that the degree of DNA damage and the period of cell cycle arrest might be related to the salt stress tolerance of soybean cultivars.

5. Conclusions

In this study, the different effects of neutral salt stress and alkaline salt stress on the growth of soybean seedlings under the same Na+ concentration were analyzed from the perspectives of electrolyte penetration, ROS accumulation and removal, osmoregulation, DNA damage, and cell cycle arrest. The results showed that alkaline stress caused more severe growth inhibition in plants under the same Na+ concentration, which was characterized by higher membrane damage, ROS accumulation, DNA damage, earlier cell cycle arrest, and lower root activity because alkaline stress could cause compounded high pH stress. At the same time, the differences in these regulatory mechanisms and abilities may also be responsible for the differences in salt tolerance of different soybean cultivars.

Supplementary Materials

The following supporting information can be downloaded at https://www.mdpi.com/article/10.3390/agronomy12112708/s1, Figure S1: RAPD polymorphism of HH49 seedling roots treated with different salt stress under SA stress were amplified using random primer. Figure S2: RAPD polymorphisms of HN95 seedling roots treated with different salt stresses under SA stress were amplified using random primer. Table S1: The pH values of different salt solutions. Table S2: Primer list.

Author Contributions

J.D. and Y.D. designed the experiments. G.W., W.S., Z.Z., S.G. and J.H. conducted the experiments. G.W., Y.D., Q.Z. and R.F. analyzed the data. G.W. and Y.D. wrote the manuscript. Q.Z., R.F. and J.D. revised the manuscript. All authors have read and agreed to the published version of the manuscript.

Funding

This work was supported by National Key Research and Development Program subproject (2021YFD1201603-3); Heilongjiang Bayi Agricultural University Support Program for San Heng San Zong (ZRCQC202102); and Talent Introduction Project of Heilongjiang Bayi Agricultural University (XYB202006, XYB202007).

Data Availability Statement

Not applicable.

Acknowledgments

We would like to thank the National Coarse Cereals Engineering Research Center for providing the laboratory.

Conflicts of Interest

The authors declare no conflict of interest.

References

  1. Wang, J.; Jiang, X.; Zhao, C.; Fang, Z.; Jiao, P. Transcriptomic and metabolomic analysis reveals the role of CoA in the salt tolerance of Zygophyllum spp. BMC Plant Biol. 2020, 20, 9. [Google Scholar] [CrossRef] [PubMed]
  2. Yuan, F.; Leng, B.; Wang, B. Progress in Studying Salt Secretion from the Salt Glands in Recretohalophytes: How Do Plants Secrete Salt? Front. Plant Sci. 2016, 7, 977. [Google Scholar] [CrossRef] [PubMed] [Green Version]
  3. Robles, P.; Quesada, V. Transcriptional and Post-transcriptional Regulation of Organellar Gene Expression (OGE) and Its Roles in Plant Salt Tolerance. Int. J. Mol. Sci. 2019, 20, 1056. [Google Scholar] [CrossRef] [PubMed] [Green Version]
  4. Liu, J.; Shen, F.; Xiao, Y.; Fang, H.; Qiu, C.; Li, W.; Wu, T.; Xu, X.; Wang, Y.; Zhang, X.; et al. Genomics-assisted prediction of salt and alkali tolerances and functional marker development in apple rootstocks. BMC Genom. 2020, 21, 550. [Google Scholar] [CrossRef]
  5. Zhang, B.; Chen, X.; Lu, X.; Shu, N.; Wang, X.; Yang, X.; Wang, S.; Wang, J.; Guo, L.; Wang, D.; et al. Transcriptome Analysis of Gossypium hirsutum L. Reveals Different Mechanisms among NaCl, NaOH and Na2CO3 Stress Tolerance. Sci. Rep. 2018, 8, 13527. [Google Scholar] [CrossRef] [Green Version]
  6. Zhu, J.K. Abiotic Stress Signaling and Responses in Plants. Cell 2016, 167, 313–324. [Google Scholar] [CrossRef] [Green Version]
  7. Li, J.; Cui, J.; Cheng, D.; Dai, C.; Liu, T.; Wang, C.; Luo, C. iTRAQ protein profile analysis of sugar beet under salt stress: Different coping mechanisms in leaves and roots. BMC Plant Biol. 2020, 20, 347. [Google Scholar] [CrossRef]
  8. Gul Jan, F.; Hamayun, M.; Hussain, A.; Jan, G.; Iqbal, A.; Khan, A.; Lee, I.J. An endophytic isolate of the fungus Yarrowia lipolytica produces metabolites that ameliorate the negative impact of salt stress on the physiology of maize. BMC Microbiol. 2019, 19, 3. [Google Scholar] [CrossRef] [Green Version]
  9. Li, H.; Tang, X.; Yang, X.; Zhang, H. Comprehensive transcriptome and metabolome profiling reveal metabolic mechanisms of Nitraria sibirica Pall. to salt stress. Sci. Rep. 2021, 11, 12878. [Google Scholar] [CrossRef]
  10. Darko, E.; Gierczik, K.; Hudak, O.; Forgo, P.; Pal, M.; Turkosi, E.; Kovacs, V.; Dulai, S.; Majlath, I.; Molnar, I.; et al. Differing metabolic responses to salt stress in wheat-barley addition lines containing different 7H chromosomal fragments. PLoS ONE 2017, 12, e0174170. [Google Scholar] [CrossRef]
  11. Chauhan, A.; AbuAmarah, B.A.; Kumar, A.; Verma, J.S.; Ghramh, H.A.; Khan, K.A.; Ansari, M.J. Influence of gibberellic acid and different salt concentrations on germination percentage and physiological parameters of oat cultivars. Saudi J. Biol. Sci. 2019, 26, 1298–1304. [Google Scholar] [CrossRef] [PubMed]
  12. Qiao, H.; Li, J.; Yong, L.; Ai, F. Research progress of salt stress physiology and its adaptive regulation mechanism in plants. Ningxia Agric. For. Sci. Technol. 2007, 24, 34–36. [Google Scholar]
  13. Liu, C.; Liu, Y.; Guo, K.; Wang, S.; Yang, Y. Concentrations and resorption patterns of 13 nutrients in different plant functional types in the karst region of south-western China. Ann. Bot. 2014, 113, 873–885. [Google Scholar] [CrossRef] [PubMed]
  14. Guo, J.; Liu, L.; Du, M.; Tian, H.; Wang, B. Cation and Zn Accumulation in Brown Seeds of the Euhalophyte Suaeda salsa Improves Germination Under Saline Conditions. Front. Plant Sci. 2020, 11, 602427. [Google Scholar] [CrossRef]
  15. Li, X.; Song, Z.; Dong, Z. Salt stress physiology of plants. J. Northwest. Norm. Univ. (Nat. Sci. Ed.) 2004, 3, 106–111. [Google Scholar] [CrossRef]
  16. Lin, J.; Hua, X.; Peng, X.; Dong, B.; Yan, X. Germination Responses of Ryegrass (Annual vs. Perennial) Seed to the Interactive Effects of Temperature and Salt-Alkali Stress. Front. Plant Sci. 2018, 9, 1458. [Google Scholar] [CrossRef]
  17. Chen, H.; Zhang, Q.; Cai, H.; Xu, F. Ethylene Mediates Alkaline-Induced Rice Growth Inhibition by Negatively Regulating Plasma Membrane H(+)-ATPase Activity in Roots. Front. Plant Sci. 2017, 8, 1839. [Google Scholar] [CrossRef] [Green Version]
  18. Guo, J.; Du, M.; Lu, C.; Wang, B. NaCl improves reproduction by enhancing starch accumulation in the ovules of the euhalophyte Suaeda salsa. BMC Plant Biol. 2020, 20, 262. [Google Scholar] [CrossRef]
  19. Chen, Z.; Zhao, X.; Hu, Z.; Leng, P. Nitric oxide modulating ion balance in Hylotelephium erythrostictum roots subjected to NaCl stress based on the analysis of transcriptome, fluorescence, and ion fluxes. Sci. Rep. 2019, 9, 18317. [Google Scholar] [CrossRef] [Green Version]
  20. Gao, H.J.; Yang, H.Y.; Bai, J.P.; Liang, X.Y.; Lou, Y.; Zhang, J.L.; Wang, D.; Zhang, J.L.; Niu, S.Q.; Chen, Y.L. Ultrastructural and physiological responses of potato (Solanum tuberosum L.) plantlets to gradient saline stress. Front. Plant Sci. 2014, 5, 787. [Google Scholar] [CrossRef]
  21. Hashem, A.; Abd Allah, E.F.; Alqarawi, A.A.; Al-Huqail, A.A.; Shah, M.A. Induction of Osmoregulation and Modulation of Salt Stress in Acacia gerrardii Benth. by Arbuscular Mycorrhizal Fungi and Bacillus subtilis (BERA 71). Biomed. Res. Int. 2016, 2016, 6294098. [Google Scholar] [CrossRef] [PubMed]
  22. Li, W.; Wang, L.; Sheng, X.; Yan, C.; Zhou, R.; Hang, J.; Yin, P.; Yan, N. Molecular basis for the selective and ABA-independent inhibition of PP2CA by PYL13. Cell Res. 2013, 23, 1369–1379. [Google Scholar] [CrossRef] [PubMed] [Green Version]
  23. Luo, H.; Zhang, T.; Zheng, A.; He, L.; Lai, R.; Liu, J.; Xing, P.; Tang, X. Exogenous proline induces regulation in 2-acetyl-1-pyrroline (2-AP) biosynthesis and quality characters in fragrant rice (Oryza sativa L.). Sci. Rep. 2020, 10, 13971. [Google Scholar] [CrossRef]
  24. Butt, M.; Sattar, A.; Abbas, T.; Hussain, R.; Ijaz, M.; Sher, A.; Shahzad, U.; Ullah, S.; Brestic, M.; Zivcak, M.; et al. Morpho-physiological and biochemical attributes of Chili (Capsicum annum L.) genotypes grown under varying salinity levels. PLoS ONE 2021, 16, e0257893. [Google Scholar] [CrossRef] [PubMed]
  25. Khan, H.A.; Siddique, K.H.M.; Colmer, T.D. Vegetative and reproductive growth of salt-stressed chickpea are carbon-limited: Sucrose infusion at the reproductive stage improves salt tolerance. J. Exp. Bot. 2017, 68, 2001–2011. [Google Scholar] [CrossRef]
  26. Wei, H.; Movahedi, A.; Xu, C.; Sun, W.; Wang, P.; Li, D.; Yin, T.; Zhuge, Q. Characterization, Expression Profiling, and Functional Analysis of PtDef, a Defensin-Encoding Gene From Populus trichocarpa. Front. Microbiol. 2020, 11, 106. [Google Scholar] [CrossRef]
  27. Hu, J.; Ren, B.; Dong, S.; Liu, P.; Zhao, B.; Zhang, J. Comparative proteomic analysis reveals that exogenous 6-benzyladenine (6-BA) improves the defense system activity of waterlogged summer maize. BMC Plant Biol. 2020, 20, 44. [Google Scholar] [CrossRef]
  28. Iwaniuk, P.; Borusiewicz, A.; Lozowicka, B. Fluazinam and its mixtures induce diversified changes of crucial biochemical and antioxidant profile in leafy vegetable. Sci. Hortic. 2022, 298, 110988. [Google Scholar] [CrossRef]
  29. Li, S.; Cong, Y.; Liu, Y.; Wang, T.; Shuai, Q.; Chen, N.; Gai, J.; Li, Y. Optimization of Agrobacterium-Mediated Transformation in Soybean. Front. Plant Sci. 2017, 8, 246. [Google Scholar] [CrossRef] [Green Version]
  30. Wang, L.; Yang, X.; Gao, Y.; Yang, S. Genome-Wide Identification and Characterization of TALE Superfamily Genes in Soybean (Glycine max L.). Int. J. Mol. Sci. 2021, 22, 4117. [Google Scholar] [CrossRef]
  31. Cao, D.; Li, Y.; Liu, B.; Kong, F.; Tran, L.-S.P. Adaptive Mechanisms of Soybean Grown on Salt-Affected Soils. Land Degrad. Dev. 2018, 29, 1054–1064. [Google Scholar] [CrossRef]
  32. Pan, W.J.; Tao, J.J.; Cheng, T.; Bian, X.H.; Wei, W.; Zhang, W.K.; Ma, B.; Chen, S.Y.; Zhang, J.S. Soybean miR172a Improves Salt Tolerance and Can Function as a Long-Distance Signal. Mol. Plant 2016, 9, 1337–1340. [Google Scholar] [CrossRef] [Green Version]
  33. Zeng, A.; Chen, P.; Korth, K.L.; Ping, J.; Thomas, J.; Wu, C.; Srivastava, S.; Pereira, A.; Hancock, F.; Brye, K.; et al. RNA sequencing analysis of salt tolerance in soybean (Glycine max). Genomics 2019, 111, 629–635. [Google Scholar] [CrossRef]
  34. Zhang, J.; Yang, D.; Li, M.; Shi, L. Metabolic Profiles Reveal Changes in Wild and Cultivated Soybean Seedling Leaves under Salt Stress. PLoS ONE 2016, 11, e0159622. [Google Scholar] [CrossRef] [Green Version]
  35. Du, Y.; Zhao, Q.; Chen, L.; Yao, X.; Xie, F. Effect of drought stress at reproductive stages on growth and nitrogen metabolism in soybean. Agronomy 2020, 10, 302. [Google Scholar] [CrossRef] [Green Version]
  36. Asada, K. Ascorbate peroxidase-a hydrogen peroxide-scavenging enzyme in plants. Physiol. Plant 1992, 85, 235–241. [Google Scholar] [CrossRef]
  37. Heupel, E.; A. Formation of hydrogen peroxide by isolated cell walls from horseradish (armoracia lapathifolia gilib.). Planta 1976, 130, 175–180. [Google Scholar]
  38. Velikova, V.; Yordanov, I.; Edreva, A. Oxidative stress and some antioxidant systems in acid rain-treated bean plants—Protective role of exogenous polyamines. Plant Sci. 2000, 151, 59–66. [Google Scholar] [CrossRef]
  39. Ji, W.; Cong, R.; Li, S.; Li, R.; Qin, Z.; Li, Y.; Zhou, X.; Chen, S.; Li, J. Comparative Proteomic Analysis of Soybean Leaves and Roots by iTRAQ Provides Insights into Response Mechanisms to Short-Term Salt Stress. Front. Plant Sci. 2016, 7, 573. [Google Scholar] [CrossRef] [PubMed] [Green Version]
  40. Zhang, Z.; Jin, H.; Suo, J.; Yu, W.; Zhou, M.; Dai, W.; Song, L.; Hu, Y.; Wu, J. Effect of Temperature and Humidity on Oil Quality of Harvested Torreya grandis cv. Merrillii Nuts During the after-Ripening Stage. Front. Plant Sci. 2020, 11, 573681. [Google Scholar] [CrossRef]
  41. Yuan, X.; Wang, H.; Cai, J.; Bi, Y.; Li, D.; Song, F. Rice NAC transcription factor ONAC066 functions as a positive regulator of drought and oxidative stress response. BMC Plant Biol. 2019, 19, 278. [Google Scholar] [CrossRef]
  42. Wang, H.; He, L.; Song, J.; Cui, W.; Zhang, Y.; Jia, C.; Francis, D.; Rogers, H.J.; Sun, L.; Tai, P.; et al. Cadmium-induced genomic instability in Arabidopsis: Molecular toxicological biomarkers for early diagnosis of cadmium stress. Chemosphere 2016, 150, 258–265. [Google Scholar] [CrossRef] [PubMed]
  43. Zhao, Q.; Wang, H.; Du, Y.; Rogers, H.J.; Wu, Z.; Jia, S.; Yao, X.; Xie, F.; Liu, W. MSH2 and MSH6 in Mismatch Repair System Account for Soybean (Glycine max (L.) Merr.) Tolerance to Cadmium Toxicity by Determining DNA Damage Response. J. Agric. Food Chem. 2020, 68, 1974–1985. [Google Scholar] [CrossRef]
  44. Livak, K.J.; Schmittgen, T.D. Analysis of relative gene expression data using real-time quantitative PCR and the 2(-Delta Delta C(T)) Method. Methods 2001, 25, 402–408. [Google Scholar] [CrossRef] [PubMed]
  45. Alavilli, H.; Awasthi, J.P.; Rout, G.R.; Sahoo, L.; Lee, B.H.; Panda, S.K. Overexpression of a Barley Aquaporin Gene, HvPIP2;5 Confers Salt and Osmotic Stress Tolerance in Yeast and Plants. Front. Plant Sci. 2016, 7, 1566. [Google Scholar] [CrossRef] [PubMed] [Green Version]
  46. Guo, H.; Huang, Z.; Li, M.; Hou, Z. Growth, ionic homeostasis, and physiological responses of cotton under different salt and alkali stresses. Sci. Rep. 2020, 10, 21844. [Google Scholar] [CrossRef]
  47. Munns, R. Comparative physiology of salt and water stress. Plant Cell Environ. 2002, 25, 239–250. [Google Scholar] [CrossRef] [Green Version]
  48. Zhao, S.; Zhang, Q.; Liu, M.; Zhou, H.; Ma, C.; Wang, P. Regulation of Plant Responses to Salt Stress. Int. J. Mol. Sci. 2021, 22, 4609. [Google Scholar] [CrossRef]
  49. Shumayla; Sharma, S.; Kumar, R.; Mendu, V.; Singh, K.; Upadhyay, S.K. Genomic Dissection and Expression Profiling Revealed Functional Divergence in Triticum aestivum Leucine Rich Repeat Receptor Like Kinases (TaLRRKs). Front. Plant Sci. 2016, 7, 1374. [Google Scholar] [CrossRef] [Green Version]
  50. Wawrzynska, A.; Sirko, A. The Role of Selective Protein Degradation in the Regulation of Iron and Sulfur Homeostasis in Plants. Int. J. Mol. Sci. 2020, 21, 2771. [Google Scholar] [CrossRef] [Green Version]
  51. Geng, G.; Li, R.; Stevanato, P.; Lv, C.; Lu, Z.; Yu, L.; Wang, Y. Physiological and Transcriptome Analysis of Sugar Beet Reveals Different Mechanisms of Response to Neutral Salt and Alkaline Salt Stresses. Front. Plant Sci. 2020, 11, 571864. [Google Scholar] [CrossRef] [PubMed]
  52. Wang, S.; Uddin, M.I.; Tanaka, K.; Yin, L.; Shi, Z.; Qi, Y.; Mano, J.; Matsui, K.; Shimomura, N.; Sakaki, T.; et al. Maintenance of Chloroplast Structure and Function by Overexpression of the Rice Monogalactosyldiacylglycerol Synthase Gene Leads to Enhanced Salt Tolerance in Tobacco. Plant Physiol. 2014, 165, 1144–1155. [Google Scholar] [CrossRef] [PubMed]
  53. Zhang, Y.; Li, D.; Zhou, R.; Wang, X.; Dossa, K.; Wang, L.; Zhang, Y.; Yu, J.; Gong, H.; Zhang, X.; et al. Transcriptome and metabolome analyses of two contrasting sesame genotypes reveal the crucial biological pathways involved in rapid adaptive response to salt stress. BMC Plant Biol. 2019, 19, 66. [Google Scholar] [CrossRef] [Green Version]
  54. Domingo, C.; Lalanne, E.; Catala, M.M.; Pla, E.; Reig-Valiente, J.L.; Talon, M. Physiological Basis and Transcriptional Profiling of Three Salt-Tolerant Mutant Lines of Rice. Front. Plant Sci. 2016, 7, 1462. [Google Scholar] [CrossRef] [PubMed] [Green Version]
  55. Fahy, D.; Sanad, M.; Duscha, K.; Lyons, M.; Liu, F.; Bozhkov, P.; Kunz, H.H.; Hu, J.; Neuhaus, H.E.; Steel, P.G.; et al. Impact of salt stress, cell death, and autophagy on peroxisomes: Quantitative and morphological analyses using small fluorescent probe N-BODIPY. Sci. Rep. 2017, 7, 39069. [Google Scholar] [CrossRef] [Green Version]
  56. Soni, S.; Kumar, A.; Sehrawat, N.; Kumar, A.; Kumar, N.; Lata, C.; Mann, A. Effect of saline irrigation on plant water traits, photosynthesis and ionic balance in durum wheat genotypes. Saudi J. Biol. Sci. 2021, 28, 2510–2517. [Google Scholar] [CrossRef]
  57. Guo, R.; Shi, L.; Yan, C.; Zhong, X.; Gu, F.; Liu, Q.; Xia, X.; Li, H. Ionomic and metabolic responses to neutral salt or alkaline salt stresses in maize (Zea mays L.) seedlings. BMC Plant Biol. 2017, 17, 41. [Google Scholar] [CrossRef] [PubMed] [Green Version]
  58. Wu, X.; Jia, Q.; Ji, S.; Gong, B.; Li, J.; Lu, G.; Gao, H. Gamma-aminobutyric acid (GABA) alleviates salt damage in tomato by modulating Na(+) uptake, the GAD gene, amino acid synthesis and reactive oxygen species metabolism. BMC Plant Biol. 2020, 20, 465. [Google Scholar] [CrossRef]
  59. Zhao, X.; Fang, J.; Li, S.; Gaur, U.; Xing, X.; Wang, H.; Zheng, W. Artemisinin Attenuated Hydrogen Peroxide (H2O2)-Induced Oxidative Injury in SH-SY5Y and Hippocampal Neurons via the Activation of AMPK Pathway. Int. J. Mol. Sci. 2019, 20, 2680. [Google Scholar] [CrossRef] [Green Version]
  60. Mittler, R. Oxidative stress, antioxidants and stress tolerance. Trends Plant Sci. 2002, 7, 405–410. [Google Scholar] [CrossRef]
  61. Kashyap, S.P.; Kumari, N.; Mishra, P.; Prasad Moharana, D.; Aamir, M.; Singh, B.; Prasanna, H.C. Transcriptional regulation-mediating ROS homeostasis and physio-biochemical changes in wild tomato (Solanum chilense) and cultivated tomato (Solanum lycopersicum) under high salinity. Saudi J. Biol. Sci. 2020, 27, 1999–2009. [Google Scholar] [CrossRef]
  62. Nan, X.; Huihui, Z.; Haixiu, Z.; Yining, W.; Jinbo, L.; Li, X.; Zepeng, Y.; Wenxu, Z.; Yi, Q.; Guangyu, S. The Response of Photosynthetic Functions of F1 Cutting Seedlings From Physocarpus amurensis Maxim (female symbol) × Physocarpus opulifolius “Diabolo” (male symbol) and the Parental Seedlings to Salt Stress. Front. Plant Sci. 2018, 9, 714. [Google Scholar] [CrossRef]
  63. Wang, Y.; Shen, W.; Chan, Z.; Wu, Y. Endogenous Cytokinin Overproduction Modulates ROS Homeostasis and Decreases Salt Stress Resistance in Arabidopsis Thaliana. Front. Plant Sci. 2015, 6, 1004. [Google Scholar] [CrossRef] [PubMed] [Green Version]
  64. Zhang, J.; Wang, J.; Jiang, W.; Liu, J.; Yang, S.; Gai, J.; Li, Y. Identification and Analysis of NaHCO3 Stress Responsive Genes in Wild Soybean (Glycine soja) Roots by RNA-seq. Front. Plant Sci. 2016, 7, 1842. [Google Scholar] [CrossRef] [Green Version]
  65. Lopez-Serrano, L.; Calatayud, A.; Lopez-Galarza, S.; Serrano, R.; Bueso, E. Uncovering salt tolerance mechanisms in pepper plants: A physiological and transcriptomic approach. BMC Plant Biol. 2021, 21, 169. [Google Scholar] [CrossRef]
  66. Jiang, Z.; Song, G.; Shan, X.; Wei, Z.; Liu, Y.; Jiang, C.; Jiang, Y.; Jin, F.; Li, Y. Association Analysis and Identification of ZmHKT1;5 Variation With Salt-Stress Tolerance. Front. Plant Sci. 2018, 9, 1485. [Google Scholar] [CrossRef]
  67. Wang, Z.; Wang, M.; Liu, L.; Meng, F. Physiological and proteomic responses of diploid and tetraploid black locust (Robinia pseudoacacia L.) subjected to salt stress. Int. J. Mol. Sci. 2013, 14, 20299–20325. [Google Scholar] [CrossRef] [Green Version]
  68. Gurunathan, S.; Jeyaraj, M.; Kang, M.H.; Kim, J.H. The Effects of Apigenin-Biosynthesized Ultra-Small Platinum Nanoparticles on the Human Monocytic THP-1 Cell Line. Cells 2019, 8, 444. [Google Scholar] [CrossRef] [PubMed] [Green Version]
  69. Pagano, A.; Araujo, S.S.; Macovei, A.; Leonetti, P.; Balestrazzi, A. The Seed Repair Response during Germination: Disclosing Correlations between DNA Repair, Antioxidant Response, and Chromatin Remodeling in Medicago truncatula. Front. Plant Sci. 2017, 8, 1972. [Google Scholar] [CrossRef] [PubMed]
  70. Reszka, E.; Lesicka, M.; Wieczorek, E.; Jablonska, E.; Janasik, B.; Stepnik, M.; Konecki, T.; Jablonowski, Z. Dysregulation of Redox Status in Urinary Bladder Cancer Patients. Cancers 2020, 12, 1296. [Google Scholar] [CrossRef]
  71. Buisson, R.; Dion-Cote, A.M.; Coulombe, Y.; Launay, H.; Cai, H.; Stasiak, A.Z.; Stasiak, A.; Xia, B.; Masson, J.Y. Cooperation of breast cancer proteins PALB2 and piccolo BRCA2 in stimulating homologous recombination. Nat. Struct. Mol. Biol. 2010, 17, 1247–1254. [Google Scholar] [CrossRef] [PubMed] [Green Version]
  72. Raymond, V.M.; Mukherjee, B.; Wang, F.; Huang, S.C.; Stoffel, E.M.; Kastrinos, F.; Syngal, S.; Cooney, K.A.; Gruber, S.B. Elevated risk of prostate cancer among men with Lynch syndrome. J. Clin. Oncol. 2013, 31, 1713–1718. [Google Scholar] [CrossRef] [PubMed]
  73. Renaud-Young, M.; Lloyd, D.C.; Chatfield-Reed, K.; George, I.; Chua, G.; Cobb, J. The NuA4 complex promotes translesion synthesis (TLS)-mediated DNA damage tolerance. Genetics 2015, 199, 1065–1076. [Google Scholar] [CrossRef] [PubMed]
Figure 1. The phenotypes of HH49 and HN95 seedling roots treated with different salt treatments for 3 days. (AH) Na+ concentrations of the treatments solutions were set as 0, 25, 50, and 75 mM in formulas of NaCl, Na2SO4, NaHCO3, and Na2CO3, separately, and Bar = 1 cm.
Agronomy 12 02708 g001
Figure 2. Root activity and relative conductivity of soybean seedling roots treated with different salt stress for 3 days. The TTC restoration amount of HH49 (A) and HN95 (B) seedling roots treated with different Na+ concentration solutions in the formulas of NaCl, Na2SO4, NaHCO3, and Na2CO3. The relative conductivity of HH49 (C) and HN95 (D) seedling roots treated with different Na+ concentration solutions in the formulas of NaCl, Na2SO4, NaHCO3, and Na2CO3. Dashed lines in (AD) indicate TTC restoration amount and relative conductivity of HH49 and HN95 seedling roots under the control conditions. Data are expressed as means ± SD of three independent experiments. Different letters indicate statistically significant differences (p < 0.05) among treatments.
Agronomy 12 02708 g002
Figure 3. The ROS and MDA accumulation of soybean seedling roots treated with different types of salt stress for 3 days. The content of O2 (A), H2O2 (C), and MDA (E) in HH49 seedling roots treated with different Na+ concentration solutions in formulas of NaCl, Na2SO4, NaHCO3, and Na2CO3. The content of O2 (B), H2O2 (D), and MDA (F) in HN95 seedling roots treated with different Na+ concentration solutions in formulas of NaCl, Na2SO4, NaHCO3, and Na2CO3. Dashed lines in (AF) indicate O2, H2O2, and MDA content of HH49 and HN95 seedling roots under the control conditions. Data are expressed as means ± SD of three independent experiments. Different letters indicate statistically significant differences (p < 0.05) among treatments.
Agronomy 12 02708 g003
Figure 4. The antioxidant enzyme activity of soybean seedling roots treated with different salt stresses for 3 days. The activities of SOD (A), POD (C), CAT (E), and APX (G) in HH49 seedling roots treated with different Na+ concentration solutions in formulas of NaCl, Na2SO4, NaHCO3, and Na2CO3. The activities of SOD (B), POD (D), CAT (F), and APX (H) in HN95 seedling roots treated with different Na+ concentrations solutions in formulas of NaCl, Na2SO4, NaHCO3, and Na2CO3. Dashed lines in (AH) indicate SOD, POD, CAT, and APX activities of HH49 and HN95 seedling roots under the control conditions. Data are expressed as means ± SD of three independent experiments. Different letters indicate statistically significant differences (p < 0.05) among treatments.
Agronomy 12 02708 g004
Figure 5. The osmotic regulation of soybean seedling roots treated with different salt stresses for 3 days. The content of soluble sugars (A), soluble protein (C), and proline (E) in HH49 seedling roots treated with different Na+ concentration solutions in formulas of NaCl, Na2SO4, NaHCO3, and Na2CO3. The content of soluble sugars (B), soluble protein (D), and proline (F) in HN95 seedling roots treated with different Na+ concentration solutions in formulas of NaCl, Na2SO4, NaHCO3, and Na2CO3. Dashed lines in (AF) indicate the content of soluble sugars, soluble protein, and proline in HH49 and HN95 seedling roots under the control conditions. Data are expressed as means ± SD of three independent experiments. Different letters indicate statistically significant differences (p < 0.05) among treatments.
Agronomy 12 02708 g005
Figure 6. DNA damage of soybean seedling roots treated with different salt stresses for 3 days. The RAPD polymorphism of HH49 (A) and HN95 (B) seedling roots were amplified using random primers. The genome template stability of HH49 (C) and HN95 (D) seedling roots. To assess RAPD, if the control and salt-treated PCR amplification products displayed different electrophoretic motilities (RAPD polymorphisms appeared or disappeared), the case was scored as positive for RAPD. For all treatments, bands were considered reproducible and were used for polymorphism analysis when simultaneously detected in at least two experimental replicates.
Agronomy 12 02708 g006
Figure 7. Relative expression levels of cell phase transition regulation/marker genes in soybean seedling roots treated with different salt stress conditions for 3 days. Relative expression levels of G1/S phase transition regulation/marker genes RBR1, E2Fa, and HISTONE H4; G2/M phase transition regulation/marker genes CYCB1;1, CDKA;1, and WEE1 in HH49 (AF) and HN95 (GL) seedling roots treated with different Na+ concentrations solutions in formulas of NaCl, Na2SO4, NaHCO3, and Na2CO3. Gene expression levels of HH49 in (AF) and HN95 in (GL) seedling roots under normal conditions were set to 1 as the normalization for qRT-PCR analysis using the operational formula 2−ΔΔCt and are indicated as dashed lines. Data are expressed as means ± SD. Different letters indicate statistically significant differences (p < 0.05) among treatments.
Agronomy 12 02708 g007aAgronomy 12 02708 g007b
Table 1. Effects of different salt treatments on root growth of HH49 and HN95 seedlings.
CultivarsTreatmentsNa+ Concentration
(mM)
Fresh Weight
(g)
Dry Weight
(g)
Length
(cm)
Superficial Area
(cm2)
Volume
(cm3)
Length Inhibition
Rate (%)
HH49CK01.34 ± 0.01 a92.41 ± 0.42 a37.97 ± 1.97 a73.71 ± 8.66 a16.25 ± 0.52 a0 h
NaCl251.29 ± 0.01 ab89.2 ± 0.69 ab30.95 ± 1.61 b55.54 ± 6.21 ab14.04 ± 1.32 abcd18.48 ± 0.01 g
501.20 ± 0.01 cd88.25 ± 0.67 b24.17 ± 1.14 b59.11 ± 5.2 ab11.19 ± 1.3 de36.34 ± 0.17 de
751.14 ± 0.01 de86.62 ± 0.43 b20.99 ± 1.06 b38.15 ± 7.51 b5.22 ± 0.34 f44.72 ± 0.04 ab
Na2SO4251.24 ± 0.02 bc85.84 ± 0.64 b26.86 ± 0.72 b56.41 ± 5.31 ab13.18 ± 1.53 abcd29.26 ± 1.03 f
501.19 ± 0.02 cde85.84 ± 0.23 b24.29 ± 0.89 b39.52 ± 3.84 b5.25 ± 0.87 f36.03 ± 0.56 e
751.13 ± 0.01 e79.66 ± 0.61 c22.87 ± 1.84 b34.61 ± 7.79 b3.62 ± 0.94 f39.77 ± 1.00 cd
NaHCO3251.21 ± 0.01 c88.63 ± 0.23 b26.49 ± 0.56 b60.98 ± 3.17 ab10.55 ± 0.76 de30.23 ± 1.24 f
501.01 ± 0.02 f85.61 ± 0.67 b22.60 ± 0.77 b51.30 ± 3.47 ab7.75 ± 0.50 ef40.48 ± 0.61 c
750.84 ± 0.01 g78.64 ± 1.21 c20.62 ± 0.71 b33.53 ± 1.56 b4.45 ± 0.48 f45.69 ± 0.55 a
Na2CO3251.25 ± 0.01 bc79.43 ± 0.62 c26.20 ± 0.62 b54.46 ± 6.7 ab11.89 ± 0.71 bcde31.00 ± 1.13 f
500.97 ± 0.01 f74.84 ± 0.87 d22.19 ± 1.34 b48.06 ± 4.89 ab6.35 ± 0.56 f41.56 ± 0.29 bc
750.88 ± 0.02 g66.85 ± 1.23 e20.55 ± 0.59 b37.66 ± 3.42 b3.19 ± 0.26 f45.88 ± 0.73 a
HN95CK01.45 ± 0.01 a89.21 ± 0.88 a38.38 ± 2.64 a87.95 ± 7.98 a13.35 ± 2.64 a0 i
NaCl251.18 ± 0.02 c77.20 ± 1.21 bc28.65 ± 1.29 b72.90 ± 8.01 a12.01 ± 3.07 abc25.35 ± 1.03 h
501.11 ± 0.02 cd75.40 ± 0.83 cd21.21 ± 0.63 bc35.55 ± 5.69 bc5.16 ± 1.59 abcd44.74 ± 1.25 fg
750.97 ± 0.01 e63.43 ± 1.23 fg16.25 ± 1.50 cd27.08 ± 5.15 bc3.77 ± 1.18 bcd57.66 ± 0.58 bc
Na2SO4251.07 ± 0.01 d75.20 ± 1.22 cd22.73 ± 1.07 bc46.53 ± 1.48 b5.46 ± 1.33 abcd40.78 ± 0.75 g
500.96 ± 0.02 e70.40 ± 1.26 de20.43 ± 1.22 bcd24.90 ± 2.00 bc3.49 ± 0.94 cd46.77 ± 0.28 f
750.72 ± 0.02 g55.10 ± 1.01 hi18.53 ± 0.77 cd22.39 ± 2.31 bc3.21 ± 1.00 d51.72 ± 0.76 de
NaHCO3251.27 ± 0.01 b82.86 ± 0.83 b19.73 ± 0.94 bcd37.40 ± 3.87 bc5.87 ± 1.18 abcd48.59 ± 0.63 ef
500.89 ± 0.01 f65.61 ± 1.81 ef16.85 ± 1.65 cd25.47 ± 2.45 bc3.93 ± 0.72 bcd56.10 ± 0.74 bc
750.76 ± 0.01 g58.70 ± 1.66 gh12.54 ± 1.09 d17.86 ± 2.07 c2.18 ± 0.53 d67.33 ± 0.34 a
Na2CO3250.86 ± 0.01 f65.46 ± 0.81 ef21.25 ± 1.04 bc38.23 ± 4.78 bc7.40 ± 1.87 abcd44.63 ± 0.64 fg
500.72 ± 0.01 g55.00 ± 1.41 hi17.76 ± 2.29 cd27.35 ± 3.23 bc3.56 ± 0.52 cd53.73 ± 1.62 cd
750.6 ± 0.02 h50.4 ± 1.28 i15.89 ± 1.23 cd16.03 ± 4.4 c2.34 ± 0.66 d58.60 ± 0.21 b
Data are expressed as means ± SD of three independent experiments. For the same cultivar, different letters indicate statistically significant differences (p < 0.05) among treatments.
Publisher’s Note: MDPI stays neutral with regard to jurisdictional claims in published maps and institutional affiliations.

