Article

Phosphorus Fractions in Temperate Grassland Soils and Their Interactions with Agronomic P Tests

1
Teagasc Crops, Environment and Land Use Programme, Johnstown Castle, Y35 Y521 Wexford, Ireland
2
Department of Biological Sciences, University of Limerick, V94 T9PX Limerick, Ireland
*
Author to whom correspondence should be addressed.
Agronomy 2022, 12(10), 2569; https://doi.org/10.3390/agronomy12102569
Submission received: 15 August 2022 / Revised: 4 October 2022 / Accepted: 13 October 2022 / Published: 19 October 2022

Abstract

:
Phosphorus (P) is a major nutrient for plant growth and animal health, and its availability in soil is influenced by agronomic management and soil properties. This study examined the distribution of labile and non-labile soil P fractions in grassland and the properties that influence their distribution in temperate grasslands. Eleven fractions were identified as, labile (H2O.P and NaHCO3.P), moderately labile (NaOH.P) and plant non-available (NaOH.P, HCl.P and residual P). The residual P, moderately labile organic (NaOH.Po) and inorganic (NaOH.Pi) fractions comprised 38%, 24% and 15% of the total P (TP), respectively. The residual and organic (Po) fractions were associated with extractable Fe, and the NaOH.Pi fraction was associated with extractable Al. Agronomic reagents (Morgan’s and Mehlich3) targeted specific fractions based on their affinity for different soil elements. Morgan’s P was associated with extractable and residual Ca and in high Ca soils, and overestimated plant-available P by extracting non-labile Ca.P forms (HCl.P). The Mehlich3 P test was associated with NaOH.Pi fraction and showed a preference for Al.P oxides. This study indicates that Mehlich3 reagent, which provides a wider suite of elements such as P, Ca, Al and Fe, will suit as a better indicator for soil P dynamics and improved P advice to farmers. The inclusion of additional soil chemico-physical characteristics would improve agronomic soil testing, benefitting farmers’ advice.

1. Introduction

The EU Green deal foresees the shift towards agro-ecological practices with headline targets towards fertiliser use efficiency, including cutting fertiliser use, such as phosphorous (P) by 20% before 2050 [1]. Phosphorus is a critical yield limiting macronutrient in agriculture and can be present in both organic and inorganic form in soil. Of the various soil P pools, plant-available P is the most dynamic and can build and deplete in response to fertiliser P addition and removal by crops. In pasture-based systems, less than 35% of P applied as fertiliser is exported as added value products, such as milk, wood or meat, [2], while the remaining P either remains in the soil [3] or gets lost by runoff or leaching. When applications exceed crop demand, agricultural soils can become reserves of P [4], resulting in stable P build up in soil [5]. Soil P concentration is a basis to identify fertiliser requirement to achieve optimal crop yield. Regular agronomic soil testing is recommended in intensive agricultural systems so that P removed by crops can be replaced and rates of added P are sufficient to build up or maintain the plant-available P. These tests are extremely dependent on the strength and type of the reagents used for extractions and the estimation of available P for crop uptake is normally based on the use of a single chemical extraction [6,7,8]. Reagents such as Morgan’s and Mehlich3 (M3.P) are pH dependent and their extraction efficiency can be influenced by the extent at which P is bounded to Ca, Al and Fe [9,10]. Furthermore, these extractants are assumed to be universal across different soils chemico-physical status. However, Barberis et al. [11], have reported that soil chemico-physical properties, and in particular the presence of certain macronutrients, can alter the performance of agronomic P tests. Based on this assumption a single P extractant-based test may not suit all soil conditions [10] and mostly might not be efficient enough to capture the distribution of P reserves.
In Ireland the agronomic soil test for P uses Morgan’s reagent to determine plant-available P for fertiliser recommendations and values are categorised into widely used indices for agronomic advice [12]. Morgan’s P index 1 (values 0–3 mg L−1) and 2 (3.1–5 mg L−1) represent P deficient soil status, indicative of soils requiring build-up with additional P fertiliser to reach the target index, P Index 3 (5.1–8 mg L−1) [12]. On the other hand, Morgan’s P index 4 (values > 8 mg L−1) indicate over application of P and pose a potential risk of P loss to water. The agronomic advice for these soils is to achieve the optimum P Index 3 to account for the P removed in crops and products [12]. The specific P pools that agronomic P tests can access and their interactions with other soil properties can influence P fertiliser management advises made on a daily basis and at global scale. Agronomic tests such as Morgan’s and Mehlich reagent are designed to extract the readily available and some physico-chemically bound P in soil, similar to how plant roots access P for nutrient uptake. As such, they do not describe other P fractions and pools in soil that are more difficult to extract, and potentially mineralisable forms of P bound up as organic or stable forms of soil P.
For decades, P reserves in the soil have been determined by sequential chemical P fractionation. This methodology consists of the use of increasingly stronger reagents to extract initially readily available P, and progressively less available P reserves until only the residual P fraction remains. All sequential fractionation schemes can quantify and characterise inorganic (Pi) and organic (Po) pools [13]. The modified Hedley fractionation scheme is still one of the most widely used methodology in the scientific community [14,15]. This procedure uses alkaline solutions to extract readily available P, followed by amorphous or crystalline aluminium (Al) and iron (Fe) bound P and a hydrochloric acid solution for the calcium (Ca) bound P, as it is more difficult to access [16]. The Hedley P fractionation scheme also determines the Po fractions by difference when each sequential fraction is digested. Microbial Po has been associated with Po fractions that play a role in plant availability, and are alkali extracts such NaHCO3 and NaOH [17]. Phosphate monoesters, such as inositol phosphates, have been widely reported as the major Po form in grassland soils, are highly stable and mostly associated with soil humic P [17] and residual P fractions [18].
The determination of different labile and non-labile P fractions would help the understanding of where the P is bound in the soil. This information is not available with the common agronomic tests and there is no full understanding of the efficiency of these tests when accounting for differences in the soil chemico-physical properties.
The objective of this study was to examine the apportionment of labile and non-labile P fractions in grassland soils and their influence on agronomic soil P testing for fertiliser advice. Furthermore, the study examined the relationship between two agronomic P tests, namely Morgan and Mehlich3 extracts, and their ability to discriminate between plant-available P (labile) and stable P (non-labile) pools in soils with different chemico-physical characteristics.

2. Material and Methods

2.1. Permanent Grassland Sites

Twenty-nine permanent grassland sites distributed within the five major agro-climatic regions of Ireland identified by Holden and Brereton, [19] representative of the main mineral soil subgroups [20] were selected (Supplementary Material Table S1). A sampling area representative of the field (30 m × 30 m) was selected where soil sampling was performed using an auger (5 cm diameter) to a depth of 10 cm, following a W sampling design. Nine points were sampled in the area, large stones and grass/roots removed on site, and the nine samples were bulked together in a composite sample per field (approx. 1 kg). Full description of the experimental design is available in Graça et al. [21] and Bondi et al. [22]. Composite soil samples were dried at 40 °C, sieved at 2 mm and stored for analysis of soil chemical properties. Field management data were recorded for each site by completing a questionnaire to provide information on the previous 5 years of farm management [22].

2.2. Case-Study Sites

An additional 18 case-study sites were included to test the influence of Ca in the performance of the commonly used agronomic tests specifically Morgan’s P and P extracted by Mehlich3 (M3.P) and Olsen (Olsen P) reagents. These sites comprised 14 grassland sites, and 4 sites were selected from commercial farms in Ireland within similar mineral soil subgroups as above. These sites had been previously classified as Calcareous Brown Earth and Surface Water Gley soils (Calcic cambisols and Stagnosols). Nine of the grassland sites were from the western region had received no commercial fertiliser P or lime applications in previous years and were used for light grazing for beef cattle. The four tillage sites located in the eastern region, received no lime applications and small applications of P for oats and beans (7 kg P ha−1 yr−1). Soils from these sites were analysed for agronomic P tests Morgan’s, Mehlich3 and Olsen, and Mehlich extractable metals, soil pH and total P (grassland only) and data are presented.

2.3. Soil Chemical and Physical Analyses

Dry matter content [23] was determined on the field-moist samples, immediately after sieving the soil. Soil texture and chemical properties were measured in the dried soil subsamples. Soil texture was determined by particle size analysis using the pipette method and content (%) of sand, silt and clay was determined. Soil pH was determined using 1:2.5 soil-to-water ratio [24] and organic matter (OM) measured as the loss-on-ignition of 4 g samples at 500 °C [25]. Total C (TC), soil organic C (SOC) and total N (TN) were determined in 0.2 g of grounded soil by dry combustion using a CN LECO FP 2000 analyser (LECO Corp., St. Joseph, MI, USA). Mehlich3 extraction was performed with the modified Mehlich test [26] in 1:10 soil-to-solution ratio. Mehlich3 extracts were measured by Varian VISTA Inductively coupled plasma-optical emission spectroscopy (ICP-OES) (Varian, Palo Alto, CA, USA). Morgan’s extractable P (Morgan’s P) and Morgan’s extractable K (Morgan’s K) were determined at a 1:5 (v/v) soil to Morgan’s solution (10% NaOAc, pH 4.8) ratio, extracting for 30 min [27]. Olsen P was determined at a 1:4 (w/v) soil to NaHCO3 (0.5 M mol L−1, pH 8.5) and shaking for 30 min [28]. In the case-study grassland samples, residual P was determined by ICP-OES after aqua regia digestion of the soil residue [29].

2.4. Sequential P Fractionation

Soils collected from the permanent grassland sites (Table S1) were sequentially fractionated using a modified Hedley et al., [14] method. This scheme comprised five Pi fractions, namely, H2O.Pi, NaHCO3.Pi, NaOH.Pi, NaOHsn.Pi and HCl.Pi. Organic P component in all P fractions was calculated by difference between TP and Pi, in each fraction. Five Po fractions (H2O.Po, NaHCO3.Po, NaOH.Po, NaOHsn.Po and HCl.Po were determined along with a residual P fraction. The H2O.P represents desorbable P, with Pi forms readily available for plant uptake and Po component considered of biological origin, characterised by rapid mineralisation. NaHCO3 extracted P represents loosely sorbed bioavailable Pi associated with Al and Fe oxides and easily mineralisable Po. NaOH.P fraction comprises Pi of lower plant-availability associated with amorphous and crystalline Fe and Al hydroxides and clay minerals and Po components linked to humic substances; NaOHsn.P comprises less stable Pi forms associated with the internal surfaces of soil aggregates associated with Al and Fe phosphates and resistant Po forms associated with humic substances and adsorbed to Al and Fe oxides and carbonate; HCl.P represents P within apatite minerals and calcium phosphates forms and associated with Fe and Al phosphates occluded within sesquioxides and Po related with Ca-bound hydrolysable Po; residual P corresponds to Pi and Po physically and chemically protected in minerals and associated with soil organic C [18,30,31].
The fractionation scheme used 2 g of soil, in triplicate, in 50 mL centrifuge plastic tubes and extracted with 40 mL of distilled water on an end-over-end shaker for 16 h. All extraction were conducted sequentially. Samples were centrifuged at 1500× g for 30 min and the supernatant filtered (Macherey-Nagel 640 w, Ø 125 mm). The remaining soil was then further extracted with 30 mL of NaHCO3 0.5 M mol L−1 (pH 8.5) for 16 h and supernatant was again collected as described above. Following this, a further chemical fractionation was carried out on the remaining soil with 30 mL of 0.1 M NaOH, 30 mL of 0.1 M NaOH following 5 min of sonication in a water bath to access occluded P, and HCl 1 M, collecting the supernatant at the end of each fraction. The remaining soil in the 50 mL tubes, after the P fractionation procedure, was dried for 48 h at 40 °C and manually ground.

2.5. Phosphorus Determination

The Pi and total P (TP) in the P fractionation extracts were determined colorimetrically [32] using an automated discrete analyser (Aquakem 600A, 01621, Vantaa, Finland) and a Ganimede P analyser (Hach Lange, UK) with integrated sample digestion, respectively. Alkali extracts (NaHCO3 and NaOH) were pH adjusted to 6.0 with acetic acid to extract carbonates and neutralise the alkalinity. Organic P concentration in all P fractions was calculated by difference between TP and Pi. Blank and control samples were used to ensure procedure reliability and P fractions concentrations were blank and weight corrected, which included correcting for soluble P entrained in the soil residue of the preceding extraction. All P concentrations were calculated on a soil dry weight basis (mg P kg−1 dry soil). Total soil P, the Sum of Pi and Sum of Po were calculated as described in Equations (1)–(3), respectively.
TP = Sum Pi + Sum Po + residual P
Sum Pi = H2O.Pi + NaHCO3.Pi + NaOH.Pi + NaOHsn.Pi + HCl.Pi
Sum Po = H2O.Po + NaHCO3.Po + NaOH.Po + NaOHsn.Po + HCl.Po

2.6. Residual Soil Analysis

The residual soil was dried at 40 °C and the amount of residual P and residual Al, Ca, Fe and S were determined by ICP-OES (Varian, Palo Alto, CA, USA) following aqua regia digestion of the soil residue [29]. Carbon and nitrogen were determined by dry combustion using a CN LECO FP 2000 analyser (LECO Corporation, St. Joseph, MI, USA).

2.7. Statistical Analysis

Spearman correlation was used to identify associations between soil P fractions and ancillary soil properties. Correlation was also used to examine the relationships between soil P fractions, expressed as a proportion of TP and soil properties. Data were tested for normality and analyses of variance were performed using ANOVA and Tukey’s HSD test (IBM SPSS Statistics version 24, Armonk, NY, USA). Principal component analysis (PCA) Function Prcomp in R (R Foundation for Statistical Computing version 3.3.1, Vienna, Austria) was used to visualise the variability in the data, identify the most represented P fractions and their associations with the agronomic P test. Significant explanatory principal components (PC) were selected through the broken stick model [33].
Redundancy detrended analysis (RDA) was carried out in the P fractions data, using the vegan package in R (R Foundation for Statistical Computing version 3.3.1, Vienna, Austria). Monte Carlo permutation tests (number of permutations = 9999) were then used to select significant explanatory redundancy detrended components (RD). Multi-collinearity among the set of explanatory variables (soil properties) was tested by the variance inflation factor (VIF) that was kept under 10 [34].

3. Results

3.1. Permanent Grasslands Soils Characteristics

The summary statistics of soil properties from our grassland sites are shown in Table 1. The parent material for these sites was balanced, ranging between limestone and sandstone or siliceous glacial drift (Table S1). Soil pH ranged from 5.0 to 7.3, and OM from 8% to 18%, respectively. Soil moisture ranged from 19 to 50% and was higher in soils with high clay content. Mehlich3 extractable Ca (M3. Ca) ranged from 525 to 4742 mg kg−1 and correlated with soil pH (r = 0.78, p < 0.05) with high M3.Ca concentrations (>1200 mg kg−1) associated in soils derived from limestone parental material. Mehlich extractable Al (M3.Al) concentrations ranged from 83 to 524 mg kg−1, and values were on average higher and more variable than M3.Fe that ranged from 104 to 273 mg kg−1. Total P at the sites ranged from 388.6 to 1752 mg kg−1, with an average value of 862 mg kg−1. Across the sites surveyed in this study, Morgan’s P values ranged from 1.2 to 29 mg L−1, with the mean and median values within the target agronomic Index 3.

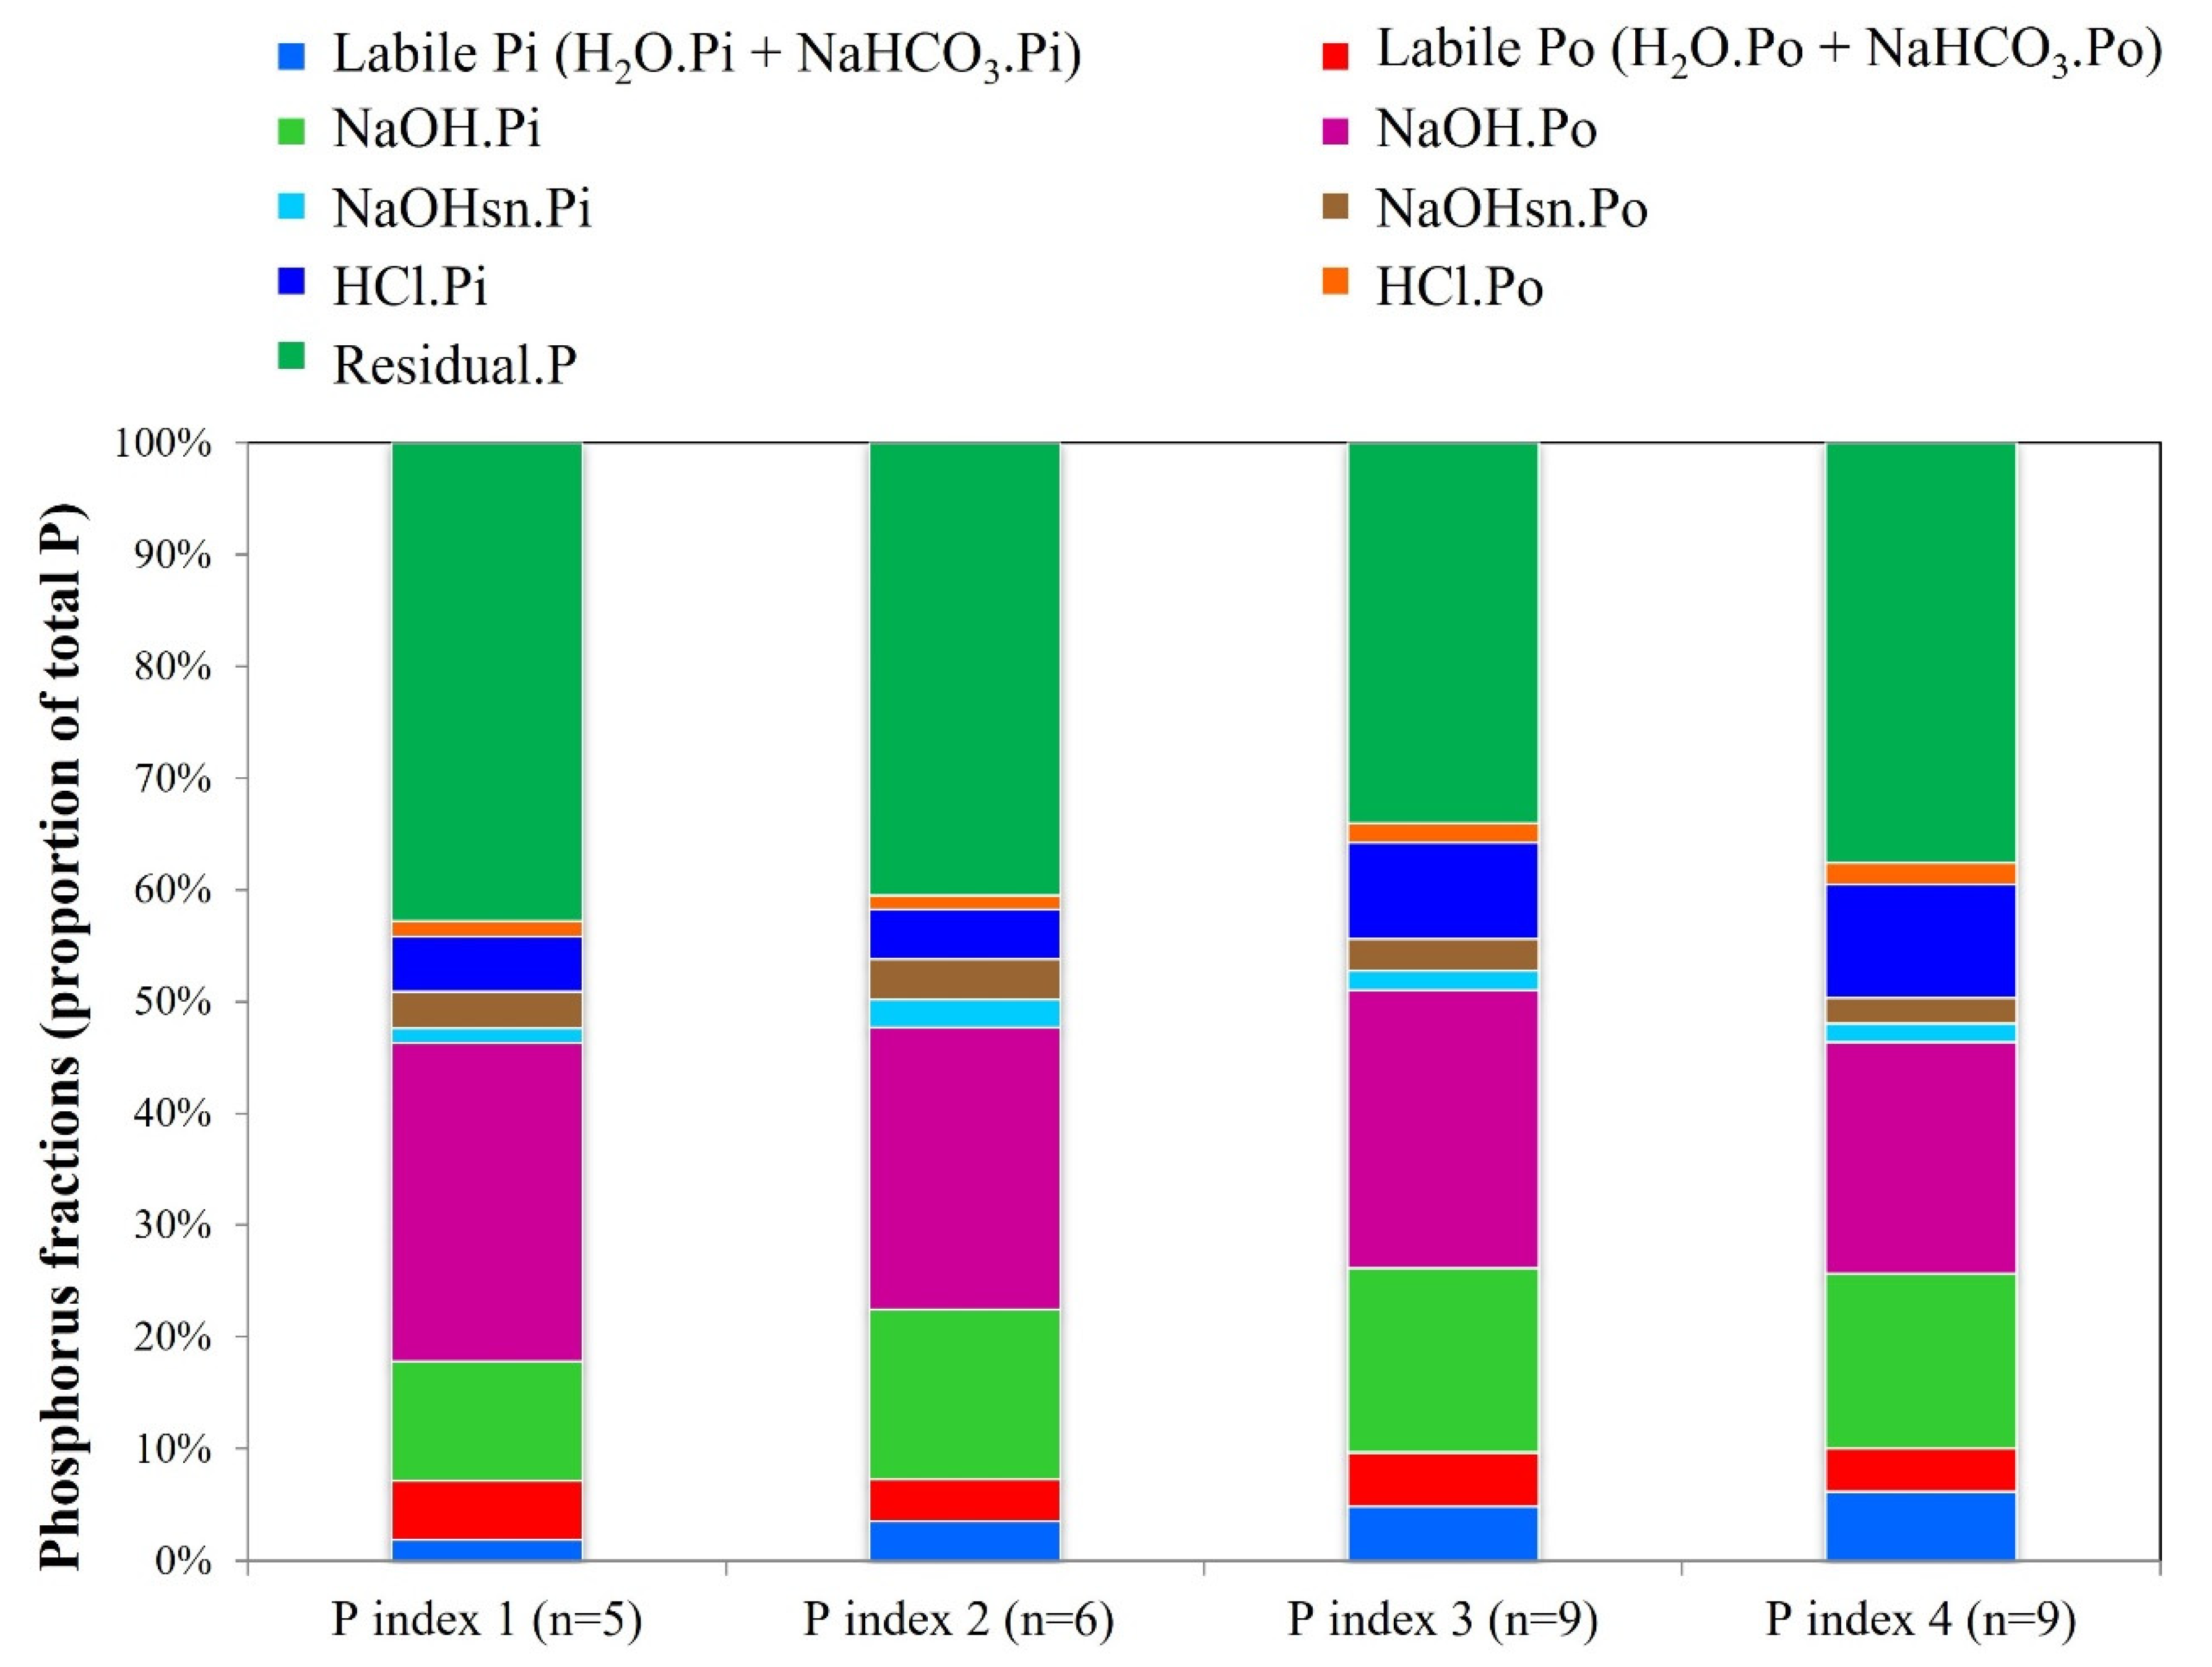
3.2. Distribution of Soil P Fractions in Grassland Soils

The descriptive statistics for each P fraction are summarised in Table 2. On average, the total organic P (Sum Po) and inorganic P (Sum Pi) comprised 33% and 29%, respectively, of the total P (TP). Residual P, NaOH.Po and NaOH.Pi fractions comprised the majority of soil P, with average values of 38%, 24% and 15% of the TP, respectively. The smallest fractions were represented by the labile P fractions (H2O.P, NaHCO3.P), associated with water soluble P. Calcium phosphates (HCl.P) and Fe and Al bound P associated with the internal surface of soil aggregates (NaOHsn.P) 9%, 9% and 5%, respectively (Table 1). In decreasing order, P fractions, were represented by residual P > NaOH.Po > NaOH.Pi > HCl.Pi > NaHCO3.Pi > NaHCO3.Po > NaOHsn.Po > NaOHsn.Pi > HCl.Po > H2O.Pi.
Total elemental analysis of the residual P fraction indicated that Fe, C, Al and N were the most abundant elements, followed by Ca and S (Table 2). Residual P was correlated with residual Fe (r = 0.44; p < 0.05). Residual-Ca concentrations were relatively lower in the residual fraction and were correlated with Morgan p values across the range from 1.2 to 29 mg P L−1 (r = 0.46; p < 0.05).
Figure 1 shows the apportionment of soil P fractions in each agronomic P index, based on Morgan’s P values. Only labile Pi (H2O.Pi + NaHCO3.Pi) showed a statistically significant increases from low Morgan’s P (Index 1 and 2) soils towards high Morgan’s P (Index 3 and 4) (F = 11,613; p < 0.001). Labile Pi ranged from 2 to 6% of TP, whilst labile Po ranged from 4 to 5 % of TP with highest proportions of this fraction in P deficient soils in Index 1. Across the range from deficient to excessive soil P status, residual P accounted for between 34 and 43% of TP. The organic P fractions (NaOH.Po) ranged between 21 and 29%. indicating significant reserves across all four P indices that could be potentially mineralised into available forms.

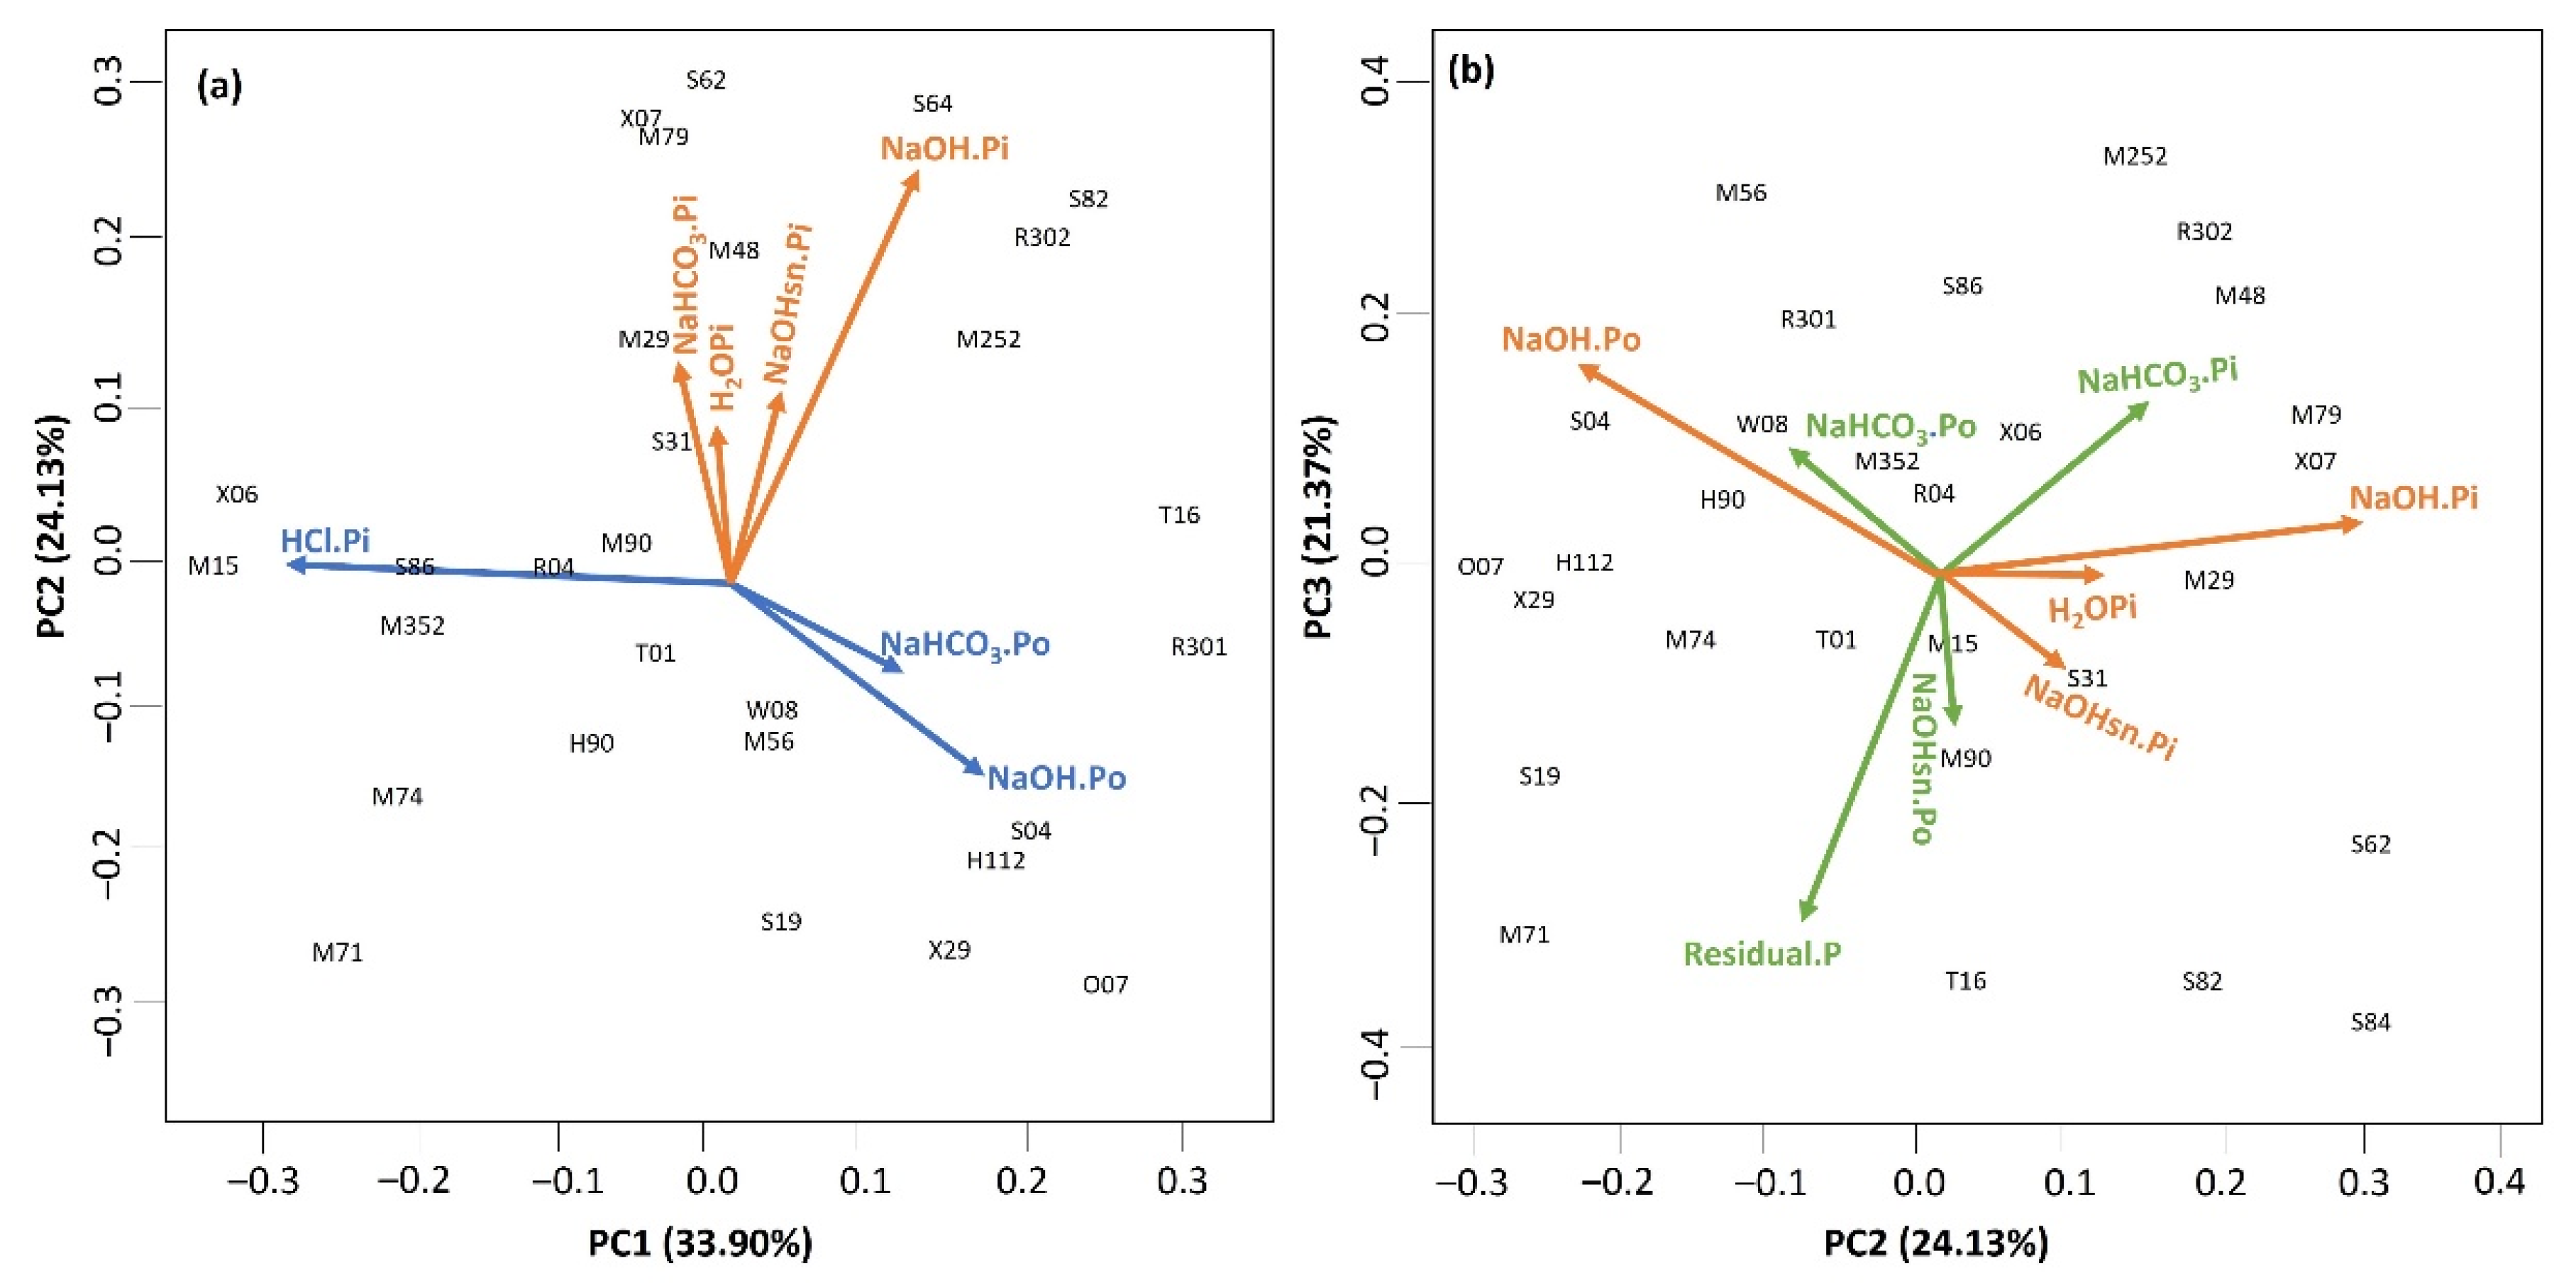
3.3. Influence of Soil Chemico-Physical Characteristics on Specific Soil P Fractions

Principal component analysis (PCA) was used to describe the variation in P fractions and across the 29 sites the first 3 principal components explained 79% of the total variance in the data (Table S2) and presented in Figure 2. The first component (PC), accounting for 34% of the total variation, clustered the organic P fractions (NaHCO3.Po, NaOH.Po) and oppose to the HCl.Pi fraction (Figure 2a). Redundancy analysis (RDA) applied to the PCA data and soil properties from the 29 grassland sites in Table 1. The RDA identified M3.Ca, M3.Fe and M3.Al as the main soil attributes to influence this distribution of the organic P fractions and HCl.Pi (Table 3). Soil M3.Ca was associated with HCl.Pi fraction and Residual P (Figure 2a). Positive correlations were present between both M3.Ca and HCl.Pi (r = 0.75; p < 0.01) and soil pH (r = 0.78; p < 0.01). Me3.Fe and Me3. Al were correlated organic NaHCO3 and NaOH.P fractions (Table 2). The second PC (Figure 2b) predominantly described the variation in inorganic P fractions which were associated with the agronomic soil P tests (Morgan’s P and M3.P) and TP (Table 3). Mehlich3 reagent was related with labile Pi (H2O.Pi and NaHCO3.Pi) and NaOH.Pi fraction, whereas Morgan’s P was generally closer to labile Pi and inorganic unavailable Pi (HCl.Pi). The PC 3 (Figure 2b), accounting for 21% of the total variation was only explained by M3.Fe. This soil property was positively correlated with labile NaHCO3.Pi (r = 0.42; p < 0.05) and NaHCO3.Po (r = 0.56; p < 0.05).

3.4. Case-Study Sites

The additional 18 case-study sites comprised permanent grassland and tillage fields (Table 4) that exhibited a range of soil pH and M3.Ca values, sampled from regions of high Ca soils. Soil pH ranged from 5.6 to 8.1, and M3.Ca ranged from 913 to 45,059 mg kg−1, respectively. Nine of these sites recorded with very high Ca values (36,870–45,059 mg kg−1) had received no fertiliser P or lime applications, as reflected in low TP values (141–200 mg kg−1). Available P in these soils was very low as expressed by Olsen P (2–11 mg kg−1) and M3.P values were below the limit of detection (2 mg kg−1). Both Olsen P and M3.P for the case study soils were below the agronomic target values, in line with soils that had never received P applications. However, Morgan’s P values recorded on these soils ranged from 8.3 to 26 mg L−1 exceeding the agronomic target P Index and indicating high risk of P loss to water. Four tillage sites received small applications of P (7 kg P ha−1 yr−1) and recorded Morgan’s P values ranging from 5.9 to 9 mg L−1, in the target range for tillage soils; however, M3-P were below the critical value of 50 mg kg−1 for crop growth.
For meaningful management implications case-study sites were combined with the fractionated soils to examine the compatibility of agronomic P tests in soils with varying Ca contents. The combined data (n = 47) were categorised by M3.Ca values as low-moderate (<2000 mg kg−1), high (>2000 mg kg−1) and very high (>20,000 mg kg−1), and the Morgan’s-P and M3.P relationship across a wider range of range of soil Ca values is illustrated in Figure 3.

4. Discussion

4.1. Soil P Reserves in Permanent Grasslands

Soils P fractions revealed that the residual P and NaOH.P fractions constituted 77% of the total P in grassland soils, regardless of the response of the agronomic P tests. P fixation in moderately labile fractions (NaOH.P) in grassland soils is driven by Al (contributing to the NaOH.Pi fraction) and by Fe concentrations (associated with NaOH.Po fractions and humic substances). The majority of Po forms could be associated with soil Fe complexes and drive their stabilisation in organo-metallo complexes. Monoester phosphates are the most abundant Po forms in soils [2,35], reported to be highly associated with oxalate-extractable Fe concentrations [9]. Stabilisation of organic phosphates is likely connected with mineral protection in Fe phosphates [35].
On the other hand, the Pi forms are bounded to Al and they are associated with hydroxide P fractions (NaOH.Pi and sonicated P). Similar findings were reported by Eriksson et al. [36] showing that Al hydroxides are important for fixing Pi in soils with implication for P mobility [37]. This mechanism reflects a potential for grassland soils to accumulate P and build up P reserves in moderate to inaccessible forms, stabilised in Fe and Al complexes [38] and recalcitrant organic compounds [18]. These reserves could constitute a potential for P harvest from less labile forms into plant-available one, under the right management conditions, leading to a more efficient P use in grassland farms and less dependence on chemical fertilisers.

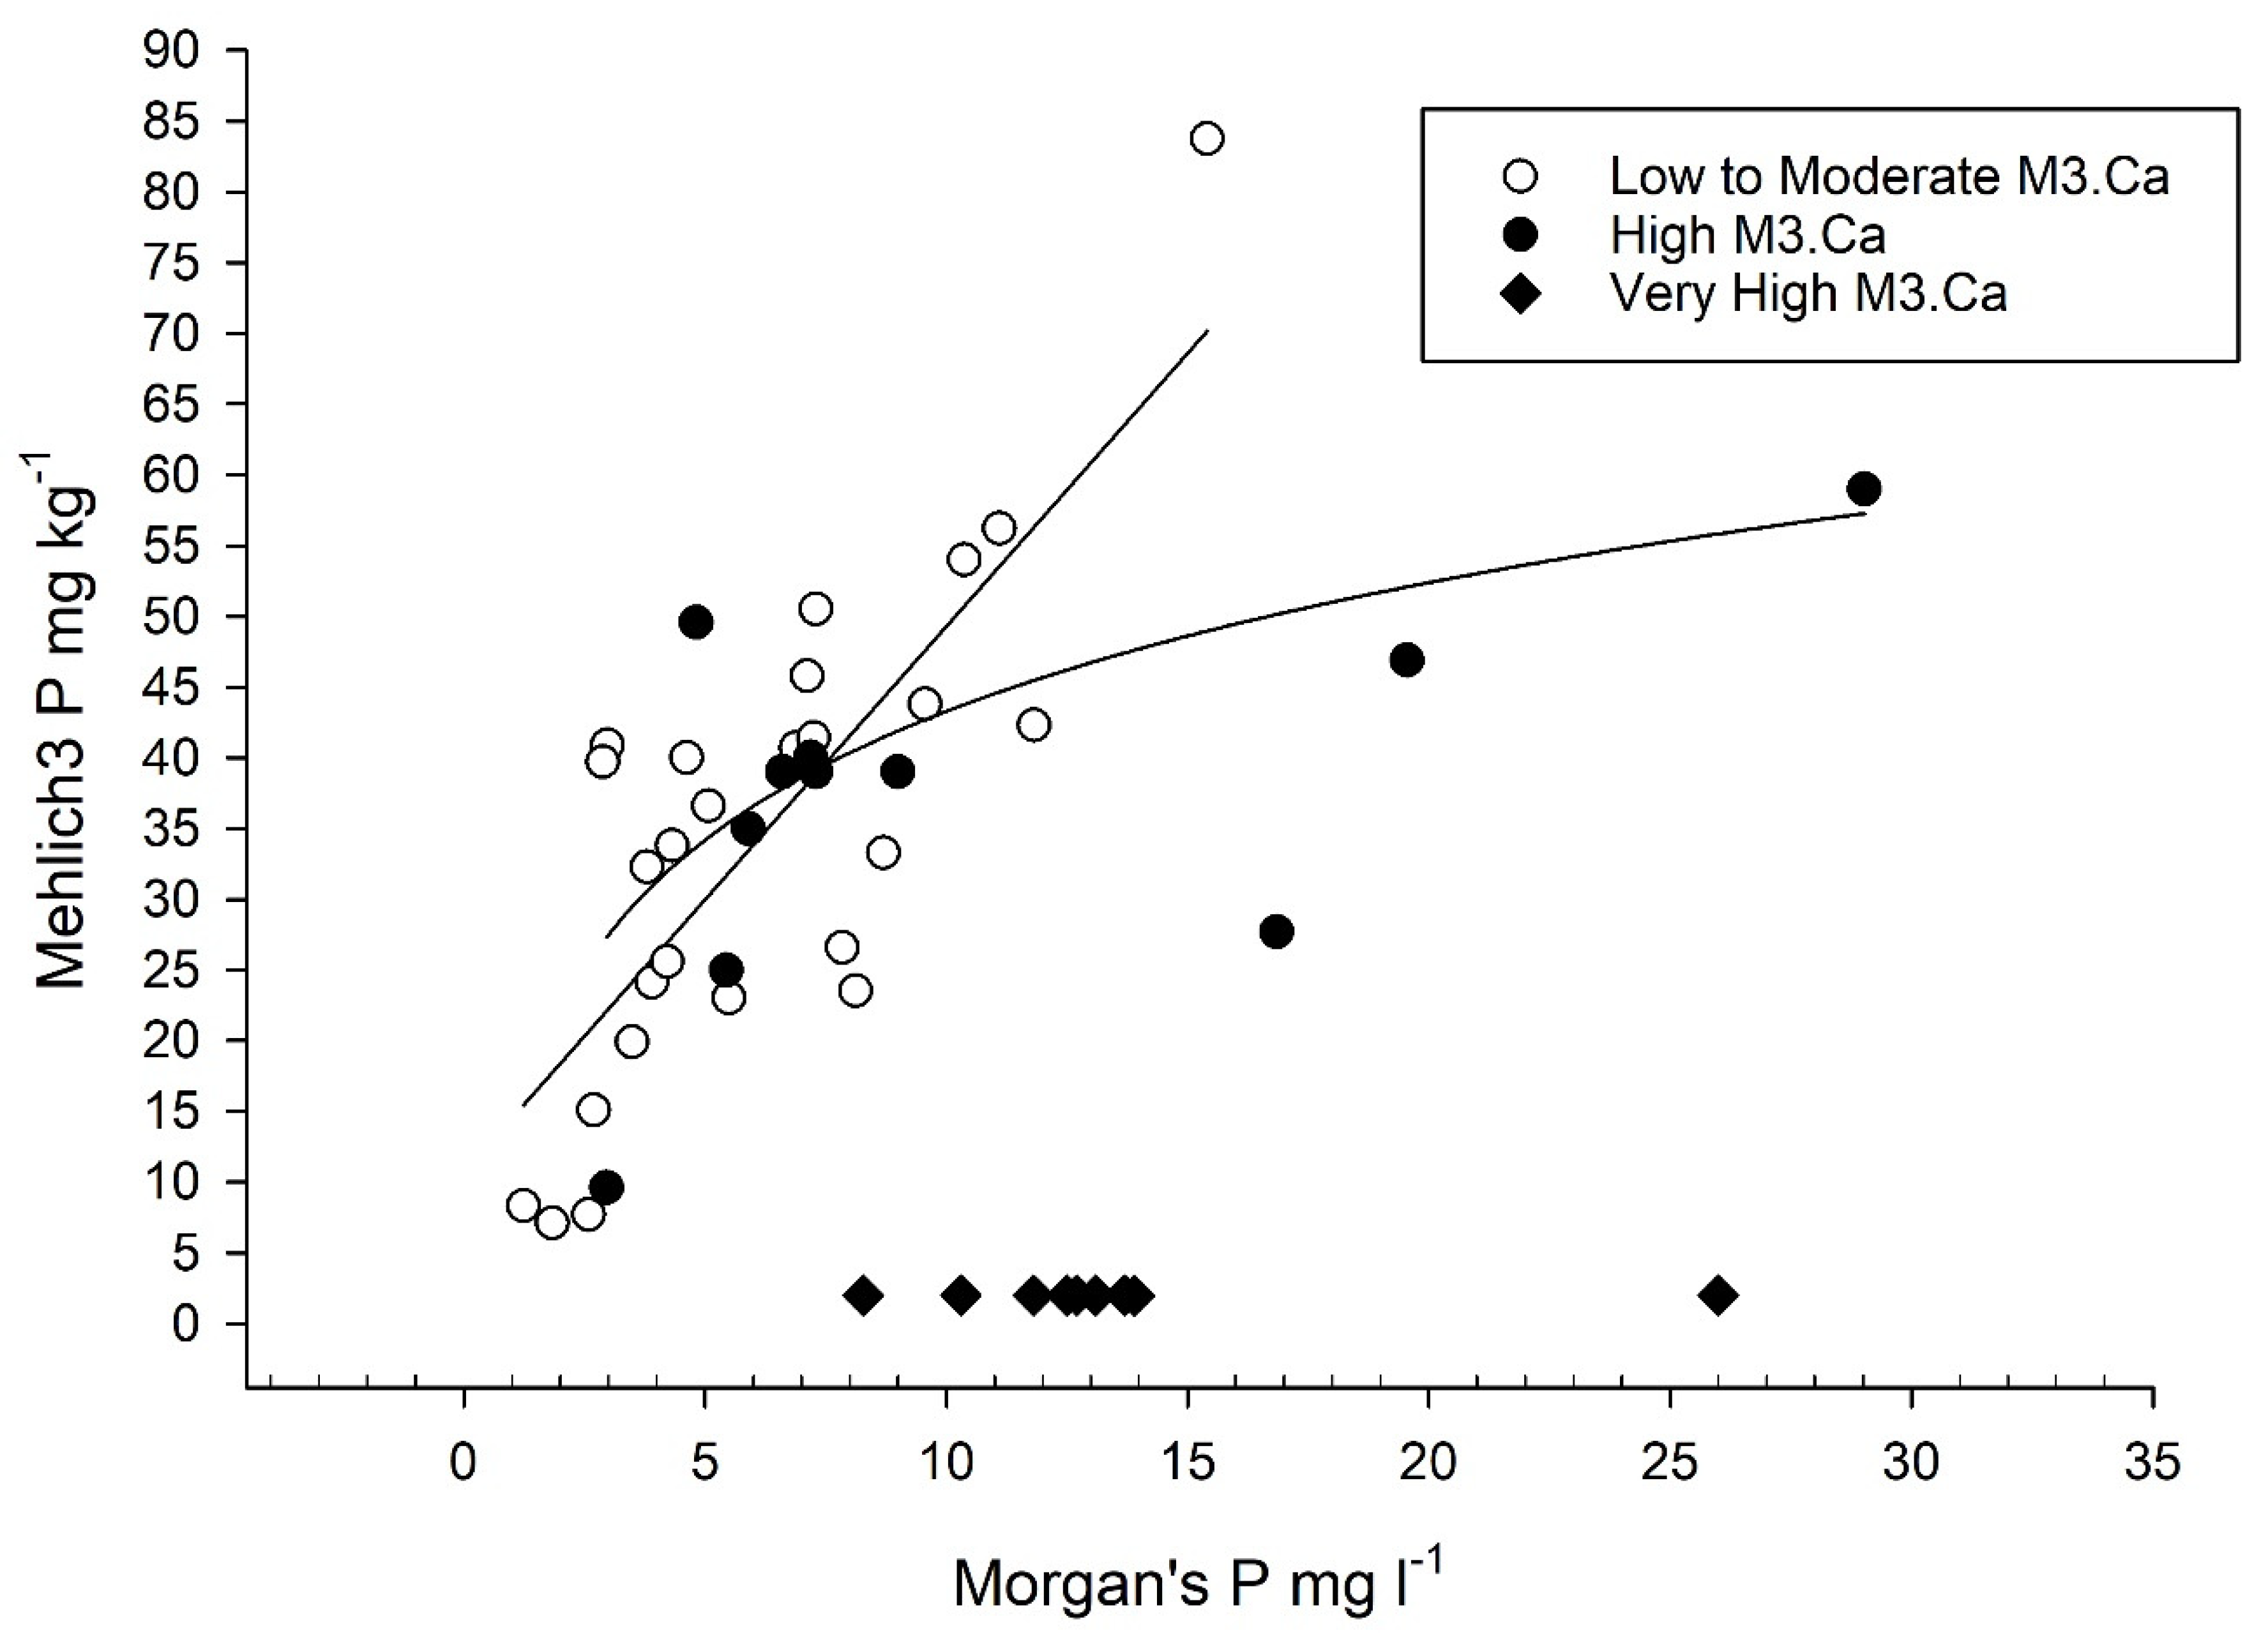
4.2. Implications of Soil Chemico-Physical Characteristics on Agronomic Tests

To improve P management in soils, soil P testing must give a reliable indication of plant-available P [37]. Agronomic soil P tests such as Morgan’s and Mehlich3 are designed to measure plant-available P to inform farmers and advisors on fertiliser recommendations [7]. These reagents are designed to simulate uptake of P and access the labile P fractions, with values linked to agronomic responses such as response to fertiliser applications and soil P status. Both Morgan’s and Mehlich3 P were associated with labile Pi fractions, and this fraction differed across the P Index system illustrated in Figure 1 while other stable non-labile forms of P did not vary with P Index.
The agronomic Morgan’s P test was highly related with HCl.Pi fraction, soil pH and soil Ca concentrations. Soil Ca-P forms were represented in the HCl.P fraction, accounting for 10% of the soil TP. The correlation between Morgan’s P and this fraction suggests that this agronomic test has the tendency to target pools that are not plant-available, which could create an over estimation of P index for agronomic advises. An observable shift towards HCl-P fraction for soils with high Ca concentrations was clearly detected. This indicates that calcium phosphates are being formed when soil pH increases in the presence of high Ca concentrations. The affinity for Morgan’s P towards HCl.Pi fraction shows its ability to dissolve Ca phosphates and extract Ca-P forms from unavailable fractions (HCl.Pi and Residual P). These findings are further supported by the case study soils and point towards an overestimation of Morgan P under high Ca concentrations.
Low P status soils that are extremely high in Ca content showed low Olsen P and non-detected M3.P; however, Morgan’s P for these sites is above 8 mg/L, indicating excessive plant-available P. This suggests that Morgan’s P is overestimated and not suited for high Ca soils.
The observation of the plot in Figure 3 indicates that relationship between both tests is different in each category of M3.Ca. For low to moderate Ca soils the relationship appears linear (R2 = 0.63) however this is non-linear (R2 = 0.32) as Ca increases to high values, and for very high Ca soils the relationship between both tests breaks down. For the case-study soils, unfertilised soil with very high Ca values with low M3.P and TP, recorded Morgan P values that placed them into Index 4 (>8 mg L−1) indicative of excessive P above agronomic and environmental thresholds This supports what was previously seen with the multivariate analysis of the P fractions; that Morgan-P extracts Ca.P forms from the HCl.Pi fractions and potentially the residual P fraction, thus overestimating available P in soils with high Ca levels. These soils require an alternative agronomic P test for fertiliser P management and water quality risk assessment, with additional data on Ca values.
Mehlich 3 was associated with moderately labile NaOH.Pi fraction that represented 15% of the soil TP. The strong association between M3-P and M3-Al with NaOH.Pi supports the importance of soil Al concentrations. These findings are of particular interest for P management in grasslands where soil nutrient and fertiliser advice are based on Morgan’s P agronomic test [12]. These data highlight the need to establish a threshold of Ca concentrations at which Morgan’s P overestimates plant-available P and adequately provide addition information to farmers regarding the soils P status. The Mehlich 3 agronomic test could provide further advice on soil P to farms where Morgan’s P is less accurate. The use of this agronomic test has the advantage of providing a wider range of soil chemical information, such as concentration of extractable Ca, Fe and Al. This work is the first step towards providing more soil type specific nutrient P management advise for farmers.

5. Conclusions

This study showed that a majority of the P contained in grassland soils was bounded into moderately labile or non-labile P fractions indicating that grassland soil can hold extensive P reserves. These reserves can be a source of plant-available P especially in P deficient soils during fertiliser shortages or price volatility.
Organic and inorganic P fractions are associated with different chemico-physical characteristics of the soil. Organic P was associated with Fe complexes in the NaOH.Po and residual P, whereas inorganic P was linked to Al complexes in the NaOH.Pi fraction.
Agronomic soil P testing using Morgan’s reagent overestimated plant-available P in high Ca soil, due to its strong affinity for Ca. High soil Ca concentrations influenced the formation of Ca-P forms that are insoluble and not plant-available. Soil P testing is used to provide specific fertiliser and P management advice for farmers. This study has shown that these tests can be influenced by the chemical nature and composition of the soil, through their affinity for elements and targeting of specific P fractions.
The use of Morgan’s P in soils with high Ca concentrations should be reconsidered regarding its efficiency to accurately estimate plant-available P. For these soils an alternative agronomic P test, such as Mehlich3, which supply a wider suite of elements such as Ca, Al and Fe, would be more appropriate for accurate fertiliser recommendations.
The inclusion of additional soil information on Ca and Al content as indicators of soil P retention should be part of a suite of soil attributes included in agronomic soil testing to improve the current advice. The inclusion of specific soil properties will allow for more accurate soil testing for sustainable management so that soil-type specific fertiliser and advice can be provided.

Supplementary Materials

The following supporting information can be downloaded at: https://www.mdpi.com/article/10.3390/agronomy12102569/s1, Table S1: Sites description and management information; Table S2: Principal Component Analysis (PCA) loadings.

Author Contributions

Conceptualization, K.D., A.S. and G.B; methodology, K.D. and J.G.; investigation, K.D., A.S., J.G. and G.B; resources, K.D.; data curation, K.D., A.S., J.G. and G.B.; writing—original draft preparation, J.G.; writing—review and editing, K.D., A.S., J.G. and G.B.; supervision, K.D., A.S. and G.B.; funding acquisition, K.D., A.S. and G.B. All authors have read and agreed to the published version of the manuscript.

Funding

This study was funded by the Irish Department of Agriculture (DAFM) Research Stimulus Fund (RSF) under the project reference number 13S468.

Data Availability Statement

The data presented in this study are available on request from the corresponding author.

Conflicts of Interest

The authors declare no conflict of interest.

References

  1. Montanarella, L.; Panagos, P. The relevance of sustainable soil management within the European Green Deal. Land Use Policy 2021, 100, 104950. [Google Scholar] [CrossRef]
  2. McLaren, T.I.; Smernik, R.J.; Simpson, R.J.; McLaughlin, M.J.; McBeath, T.M.; Guppy, C.N.; Richardson, A.E. The chemical nature of organic phosphorus that accumulates in fertilized soils of a temperate pasture as determined by solution 31P NMR spectroscopy. J. Plant Nutr. Soil Sci. 2016, 180, 27–38. [Google Scholar] [CrossRef]
  3. McLaren, T.I.; Simpson, R.J.; McLaughlin, M.J.; Smernik, R.J.; McBeath, T.M.; Guppy, C.N.; Richardson, A.E. An assessment of various measures of soil phosphorus and the net accumulation of phosphorus in fertilized soils under pasture. J. Plant Nutr. Soil Sci. 2015, 180, 27–38. [Google Scholar] [CrossRef]
  4. Liu, Y.; Villalba, G.; Ayres, R.U.; Schroder, H. Global phosphorus flows and environmental impacts from a consumption perspective. J. Ind. Ecol. 2008, 12, 229–247. [Google Scholar] [CrossRef]
  5. Roberts, W.M.; Gonzalez-Jimenez, J.L.; Doody, D.G.; Jordan, P.; Daly, K. Assessing the risk of phosphorus transfer to high ecological status rivers: Integration of nutrient management with soil geochemical and hydrological conditions. Sci. Total Environ. 2017, 589, 25–35. [Google Scholar] [CrossRef]
  6. Reijneveld, A.; Termorshuizen, A.; Vedder, H.; Oenema, O. Strategy for innovation in soil tests illustrated for P tests. Commun. Soil Sci. Plant Anal. 2014, 45, 498–515. [Google Scholar] [CrossRef]
  7. Sharpley, A.N.; Weld, J.L.; Beegle, D.B.; Kleinman, P.J.; Gburek, W.; Moore, P.; Mullins, G. Development of phosphorus indices for nutrient management planning strategies in the United States. J. Soil Water Conserv. 2003, 58, 137–152. [Google Scholar]
  8. Yli-Halla, M.; Schick, J.; Kratz, S.; Schnug, E. Determination of Plant Available P in Soil. In Phosphorus in Agriculture: 100% Zero; Schnug, E., De Kok, L.J., Eds.; Springer: Dordrecht, The Netherlands, 2016; pp. 63–93. [Google Scholar]
  9. Stutter, M.I.; Shand, C.A.; George, T.S.; Blackwell, M.S.; Dixon, L.; Bol, R.; MacKay, R.L.; Richardson, A.E.; Condron, L.M.; Haygarth, P.M. Land use and soil factors affecting accumulation of phosphorus species in temperate soils. Geoderma 2015, 257, 29–39. [Google Scholar] [CrossRef]
  10. Daly, K.; Styles, D.; Lalor, S.; Wall, D. Phosphorus sorption, supply potential and availability in soils with contrasting parent material and soil chemical properties. Eur. J. Soil Sci. 2015, 66, 1365–2389. [Google Scholar] [CrossRef]
  11. Barberis, E.; Ajmone Marsan, F.; Scalenghe, R.; Lammers, A.; Schwertmann, U.; Edwards, A.; Maguire, R.; Wilson, M.; Delgado, A.; Torrent, J. European soils overfertilized with phosphorus: Part 1. Basic properties. Nutr. Cycl. Agroecosyst. 1995, 45, 199–207. [Google Scholar] [CrossRef]
  12. Wall, D.P.; Plunkett, M. Major and Micro Nutrient Advice for Productive Agricultural Crops, 4th ed.; Teagasc: Wexford, Ireland, 2016; p. 180. [Google Scholar]
  13. Kruse, J.; Abraham, M.; Amelung, W.; Baum, C.; Bol, R.; Kühn, O.; Lewandowski, H.; Niederberger, J.; Oelmann, Y.; Rüger, C.; et al. Innovative methods in soil phosphorus research: A review. J. Plant Nutr. Soil Sci. 2015, 178, 1522–2624. [Google Scholar] [CrossRef]
  14. Hedley, M.J.; Stewart, J.W.B.; Chauhan, B.S. Changes in Inorganic and Organic Soil Phosphorus Fractions Induced by Cultivation Practices and by Laboratory Incubations1. Soil Sci. Soc. Am. J. 1982, 46, 970–976. [Google Scholar] [CrossRef]
  15. Sui, Y.; Thompson, M.L.; Shang, C. Fractionation of Phosphorus in a Mollisol Amended with Biosolids. Soil Sci. Soc. Am. J. 1999, 63, 1174–1180. [Google Scholar] [CrossRef]
  16. McDowell, R. Identification of phosphorus species in extracts of soils with contrasting management histories. Commun. Soil Sci. Plant Anal. 2003, 34, 1083–1095. [Google Scholar] [CrossRef]
  17. Makarov, M.; Haumaier, L.; Zech, W. The nature and origins of diester phosphates in soils: A 31P-NMR study. Biol. Fertil. Soils 2002, 35, 136–146. [Google Scholar]
  18. Velásquez, G.; Ngo, P.T.; Rumpel, C.; Calabi-Floody, M.; Redel, Y.; Turner, B.L.; Condron, L.M.; de la Luz Mora, M. Chemical nature of residual phosphorus in Andisols. Geoderma 2016, 271, 27–31. [Google Scholar] [CrossRef]
  19. Holden, N.M.; Brereton, A.J. Definition of agroclimatic regions in Ireland using hydro-thermal and crop yield data. Agric. For. Meteorol. 2006, 122, 175–191. [Google Scholar] [CrossRef]
  20. IUSS Working Group WRB. World Reference Base for Soil Resources—A framework for International Classification, Correlation and Communication; World Soil Resources Reports 103; FAO: Rome, Italy, 2006. [Google Scholar]
  21. Graça, J.; Daly, K.; Bondi, G.; Ikoyi, I.; Crispie, F.; Cabrera-Rubio, R.; Cotter, D.P.; Schmalenberger, A. Drainage class and soil phosphorus availability shape microbial communities in Irish grasslands. Eur. J. Soil Biol. 2021, 104, 103297. [Google Scholar] [CrossRef]
  22. Bondi, G.; O’Sullivan, L.; Fenton, O.; Creamer, R.; Marongiu, I.; Wall, D.P. Trafficking intensity index for soil compaction management in grasslands. Soil Use Manag. 2021, 37, 504–518. [Google Scholar] [CrossRef]
  23. Topp, G.; Parkin, G.; Ferré, T.P. Soil water content. In Soil Sampling and Methods of Analysis; Carter, M.R., Gregorich, E.G., Eds.; CRC Press: Boca Raton, FL, USA, 1993; pp. 541–544. [Google Scholar]
  24. Byrne, E. Chemical Analysis of Agricultural Materials; An Foras Taluntais: Dublin, Ireland, 1979. [Google Scholar]
  25. Storer, D.A. A simple high sample volume ashing procedure for determination of soil organic matter. Commun. Soil Sci. Plant Anal. 1984, 15, 759–772. [Google Scholar] [CrossRef]
  26. Mehlich, A. Mehlich 3 soil test extractant: A modification of Mehlich 2 extractant. Commun. Soil Sci. Plant Anal. 1984, 15, 1409–1416. [Google Scholar]
  27. Peech, M.; English, L. Rapid Microchemical Soil Tests. Soil Sci. 1944, 57, 167–196. [Google Scholar] [CrossRef]
  28. Olsen, S.R.; CCole, V.; Watanabe, F.S.; Dean, L.A. Estimation of Available Phosphorus in Soils by Extraction with Sodium Bicarbonate; US Department of Agriculture: Washington, DC, USA, 1954. [Google Scholar]
  29. EPA. Method 6010C (SW-846): Inductively Coupled Plasma-Atomic Emission Spectrometry; Environmental Protection Agency: Washington, DC, USA, 2007. [Google Scholar]
  30. McDowell, R.; Stewart, I. The phosphorus composition of contrasting soils in pastoral, native and forest management in Otago, New Zealand: Sequential extraction and 31P NMR. Geoderma 2006, 130, 176–189. [Google Scholar] [CrossRef]
  31. Pätzold, S.; Hejcman, M.; Barej, J.; Schellberg, J. Soil phosphorus fractions after seven decades of fertilizer application in the Rengen Grassland Experiment. J. Plant Nutr. Soil Sci. 2013, 176, 910–920. [Google Scholar] [CrossRef]
  32. Murphy, J.; Riley, J. A modified single solution method for the determination of phosphate in natural waters. Anal. Chim. Acta 1962, 27, 31–36. [Google Scholar] [CrossRef]
  33. Cangelosi, R.; Goriely, A. Component retention in principal component analysis with application to cDNA microarray data. Biol. Direct 2007, 2, 2. [Google Scholar] [CrossRef] [Green Version]
  34. Hair, J.F.; Black, W.C.; Babin, B.J.; Anderson, R.E.; Tatham, R.L. Multivariate Data Analysis, 5th ed.; Prentice-Hall International: Upper Saddle River, NJ, USA, 1998. [Google Scholar]
  35. Bourke, D.; Dowding, P.; Tunney, H.; O’Brien, J.E.; Jeffrey, D.W. The organic phosphorus composition of an Irish grassland soil. Biol. Environ. Proc. R. Ir. Acad. 2008, 108, 17–28. [Google Scholar] [CrossRef]
  36. Eriksson, A.K.; Gustafsson, J.P.; Hesterberg, D. Phosphorus speciation of clay fractions from long-term fertility experiments in Sweden. Geoderma 2015, 241, 68–74. [Google Scholar]
  37. Mellander, P.E.; Jordan, P.; Shore, M.; McDonald, N.; Wall, D.; Shortle, G.; Daly, K. Identifying contrasting influences and surface water signals for specific groundwater phosphorus vulnerability. Sci. Total Environ. 2016, 541, 292–302. [Google Scholar]
  38. Jiang, X.; Bol, R.; Willbold, S.; Vereecken, H.; Klumpp, E. Speciation and distribution of P associated with Fe and Al oxides in aggregate-sized fraction of an arable soil. Biogeosciences 2015, 12, 6443–6452. [Google Scholar] [CrossRef]
Figure 1. Soil phosphorus (P) fractions, expressed as proportion of soil total P, across grassland soils, as categorised by P index for grassland—P index 1 (0–3 mg P L−1), P index 2 (3.1–5 mg P L−1), P index 3 (5.1–8 mg P L−1) and P index 4 (above 8 mg P L−1).
Agronomy 12 02569 g001
Figure 2. Principal component analysis (PCA) biplots of the significant (p < 0.05) phosphorus (P) fractions distribution across the 29 Irish grassland soils. Individual grassland sites are marked with an individual code (e.g., M74). Soil properties for each site are presented in the Supplementary Material Table S1. Plot (a) represents the significant (p < 0.05) P fractions (arrows) for the sites distribution in the principal component (PC) 1 (blue) and 2 (orange); Plot (b) represents the significant (p < 0.05) P fractions (arrows) in the PC 2 (orange) and 3 (green). PC loadings are presented in the Supplementary Material Table S2.
Agronomy 12 02569 g002
Figure 3. The diverse relationships between Morgan’s and Mehlich3 extractable P across 47 sites based on soil Ca values, categorised as low to moderate M3-Ca (<2000 mg kg−1), high M3-Ca (<2000 mg kg−1) and very high M3-Ca (>20,000 mg kg−1) and illustrating the overestimation of available P as Ca increased. Regression lines plotted illustrate the linear relationship between both tests for low to moderate M3-Ca soils, and the non-linear relationship in high M3-Ca soils.
Agronomy 12 02569 g003
Table 1. Summary statistics of soil properties, soil pH, organic matter (OM), soil moisture and soil texture, agronomic Morgan’s extractable phosphorus (Morgan’s P) and potassium (Morgan’s K), soil Mehlich3 extractable phosphorus (M3.P), iron (M3.Fe), aluminium (M3.Al), calcium (M3.Ca) and magnesium (M3.Mg), Olsen extractable phosphorus (Olsen P) and total P from 29 Grasslands sites.
Soil PropertiesMeanMedianSDMinMax
Soil pH6.16.10.65.07.3
OM %11.811.63.07.518.2
Total P mg kg−1861.8768.4351.9388.61752.3
Olsen P mg kg−124.821.718.02.575.2
Morgan’s K mg L−1132.3106.178.827.5319.3
Morgan’s P mg L−17.66.95.91.229.0
M3.P mg kg−132.433.314.87.159.0
M3.Fe mg kg−1178.3169.739.3104.1273.0
M3.Al mg kg−1396.0389.5122.983.4569.1
M3.Ca mg kg−11361.81163.2893.4524.74742.3
M3.Mg mg kg−189.977.042.938.8207.8
Soil moisture %33.032.67.118.550.3
Sand %40.943.112.012.666.6
Silt %35.935.57.622.450.4
Clay %23.124.06.29.038.0
Table 2. Summary statistics of soil phosphorus (P) fractions (mg P kg−1) and residual soil elemental composition from grassland soils (n = 29). Values in brackets correspond to the proportion of each P fraction as percentage of total soil P in each P fraction.
MeanMedianSEMinMax
Sum.Pi 1260.2 (28.9)210.2 (28.3)147.1 (8.4)62.8 (15.9)556.2 (43.7)
Sum.Po 2268.9 (33.2)263.6 (30.9)86.7 (9.4)117.3 (18.8)503.2 (51.1)
H2O.Pi3.3 (0.3)2.4 (0.3)3.5 (0.3)0.3 (0.0 *)14.9 (1.0)
H2O.Po2.8 (0.4)2.5 (0.3)2.0 (0.3)0.1 (0.0 *)6.9 (1.0)
NaHCO3.Pi36.8 (4.2)33.9 (3.8)23.7 (1.9)5.8 (1.1)103.2 (8.6)
NaHCO3.Po31.5 (4.0)30.8 (3.7)12.7 (1.8)11.3 (1.4)62.6 (8.9)
NaOH.Pi135.7 (15.0)102.8 (13.1)87.8 (6.0)34.6 (5.2)333.0 (24.8)
NaOH.Po194.2 (24.3)190.5 (22.0)61.6 (7.6)86.0 (12.6)382.5 (38.6)
NaOHsn.Pi17.2 (1.8)12.5 (1.4)16.4 (1.1)2.0 (0.5)65.6 (4.9)
NaOHsn.Po25.8 (2.9)21.5 (2.7)16.4 (1.3)1.1 (0.3)67.0 (6.2)
HCl.Pi67.2 (7.6)54.9 (7.1)63.1 (5.2)2.4 (0.2)291.6 (18.8)
HCl.Po14.6 (1.6)11.7 (1.4)11.9 (1.0)−1.1 (0.0 *)46.6 (3.7)
Residual P333.8 (38.1)258.8 (38.9)174.5 (8.4)116.6 (21.0)839.1 (56.7)
Residual Al g kg−16.76.40.60.716.7
Residual Ca mg kg−1583.6293.0225.2160.06768.3
Residual Fe g kg−111.911.31.31.527.0
Residual S mg kg−1268.6241.725.7120.3821.2
Residual C g kg−128.527.91.812.552.2
Residual N g kg−12.52.20.21.24.5
* proportion of total P less than 0.05%. 1 Sum of organic P fractions (H2O.Po, NaHCO3.Po, NaOH.Po, NaOHsn.Po, HCl.Po). 2 Sum of inorganic P fractions (H2O.Pi, NaHCO3.Pi, NaOH.Pi, NaOHsn.Pi, HCl.Pi).
Table 3. Percentage of constrained and unconstrained variance in the redundancy detrended analysis (RDA). Numbers in brackets correspond to the RDA loadings. Bold numbers represent a significant (p < 0.05) correlation coefficient (r).
RD1RD2RD3
Total constrained (%)-----------66.09---------
Eigenvalue1.160.720.48
Variation explained (%)45.4027.9618.81
Explanatory variablesCorrelation coefficient (loadings)
OM0.03 (−0.14)−0.05 (−0.13)0.15 (0.09)
M3.P−0.04 (−0.07)0.81 (0.78)−0.01 (−0.05)
M3.Fe0.49 (0.53)0.04 (0.11)0.63 (0.62)
M3.Al0.44 (0.74)0.20 (0.16)−0.29 (−0.14)
M3.Ca−0.72 (−0.85)0.17 (0.10)0.25 (0.10)
M3.Mg0.32 (0.11)0.19 (0.14)−0.16 (−0.77)
Morgan’s P−0.23 (−0.50)0.64 (0.53)0.25 (0.12)
Morgan’s K0.34 (0.31)0.63 (0.64)−0.31 (−0.38)
Moisture0.28 (0.23)−0.09 (−0.15)0.33 (0.27)
TP0.01 (0.12)0.55 (0.79)−0.34 (−0.25)
Table 4. Soil type and chemical properties of the 18 case-study soils with a wide range of Ca values from low to very high.
Soil IDSoil ClassificationSoil pHMorgan-P
(mg L−1)
P
Index 1
Olsen P
(mg kg−1)
Mehlich3 P
(mg kg−1)
Mehlich3 Ca
(mg kg−1)
Total P
(mg kg−1)
Irish Soil
Classification
World Reference Base
T08Typical Brown EarthHaplic Cambisol5.83.0133.64112971401
T162Typical Surface Water GleyHaplic Stagnosol5.62.9118.140913753
O196.87.2312.1403383678
H1116.315.4414.0841993462
M351Humic Brown EarthHumic Cambisol5.74.8226.15036031014
G1Calcareous Brown
Earth
Calcic
Cambisol
8.126.0411.0<245,059148
G27.713.943.0<243,036181
G38.113.745.0<242,478184
G47.812.543.0<238,373175
G58.110.343.0<236,870210
G68.011.843.0<237,527156
G78.08.345.0<240,182141
G88.012.742.0<244,880143
G98.013.144.0<238,143200
T1Brown EarthCambisol7.55.93NI353683NI
T27.27.33NI393242NI
T37.56.63NI393035NI
T47.59.04NI393245NI
1 [12]. NI: No Information.
Publisher’s Note: MDPI stays neutral with regard to jurisdictional claims in published maps and institutional affiliations.

