Article

Soil Properties of Different Planting Combinations of Zanthoxylum planispinum var. dintanensis Plantations and Their Effect on Stoichiometry

School of Karst Science, State Engineering Technology Institute for Karst Decertification Control, Guizhou Normal University, Guiyang 550001, China
*
Author to whom correspondence should be addressed.
Agronomy 2022, 12(10), 2562; https://doi.org/10.3390/agronomy12102562
Submission received: 13 September 2022 / Revised: 3 October 2022 / Accepted: 14 October 2022 / Published: 19 October 2022

Abstract

:
The soil quality of plantations with different planting patterns and the effect of soil quality on stoichiometry provide a theoretical basis for the selection of Zanthoxylum planispinum var. dintanensis (hereafter Z. planispinum) planting patterns and nutrient management. Four mixed plantations: Z. planispinum + Prunus salicina, Z. planispinum + Sophora tonkinensis, Z. planispinum + Arachis hypogaea, and Z. planispinum + Lonicera japonica, and a monoculture Z. planispinum plantation were selected to clarify the effect of soil quality on stoichiometry. The results showed that the soil quality index (SQI) of Z. planispinum + L. japonica (1.678) was the highest, indicating that it was the preferred planting combination and that it was significantly limited by soil water content (SWC). The nutrient forms, SWC, and pH all have significant effects on processes such as nutrient transformation and cycling. The contributions of total Ca and total Mg in soil nutrients to stoichiometry were relatively high, while the effect of SQI on stoichiometry was not significant. The microbial stoichiometry ratio was mainly influenced by microbial biomass phosphorus, reflecting that microorganisms have strong internal stability. Strong interactions among soil factors occur, affecting elemental geochemical processes. The regulatory effects of different soil factors on their stoichiometry should be emphasized.

1. Introduction

The deciduous shrub Zanthoxylum planispinum var. dintanensis (hereafter Z. planispinum) has the advantages of fragrance and numbing taste, calcium (Ca) preference, drought tolerance, and easy management [1]. Because it is suitable for a dry and hot karst climate and Ca-rich soil, it has become the main planting species in Guizhou Province, with both ecological and economic benefits [2]. Plantations of Z. planispinum are mainly monocultures, and it has been confirmed that continuous monoculture planting can easily lead to the decline of soil fertility and productivity [3]. It has been shown that scientific plant combinations can effectively improve biodiversity and change nutrient delivery to the soil by changing the quantity and quality of litter and root secretions [4,5]. Ecological stoichiometry is the science that unifies different ecological levels to study the interaction of energy and multiple elements in ecosystems and is an important method for diagnosing nutrient limitation and balance [6]. There is a strong link between the physical properties, pH, and nutrient elements of soils, the relative components of which can drive the microbial community to secrete extracellular enzymes to obtain limiting nutrients from the soil, ultimately changing the soil ecological stoichiometric ratio [7]. Since soil quality influences soil stoichiometry, studying their intrinsic relationship can help to accurately quantify soil quality in both content and stoichiometric dimensions [8]. Therefore, combining ecological stoichiometry to explore the effects of plant combinations on soil quality and dissecting soil nutrient balance mechanisms can provide a theoretical basis for soil nutrient diagnosis of composite plantings and serve the selection and breeding of Z. planispinum plantations in karst.
Companion planting is an organic combination of various plants based on the physiological and ecological characteristics of different species, with the aim of improving the biodiversity of the community and promoting soil nutrient cycling. Researchers have chosen simple, sensitive, and representative indicators to assess the impact of planting patterns on soil quality. Stocker et al. [9] found that an agroforestry system in southern Brazil improved physical properties such as soil bulk density and total porosity. Ma et al. [10] elucidated that intercropping of Chinese chestnut trees (Castanea mollissima) with tea (Camellia sinensis) in temperate regions of China increased soil organic matter, nitrogen (N), phosphorus (P), and potassium (K) content as well as enzyme activity. Zhou et al. [11] concluded that the Chinese fir (Cunninghamia lanceolata) mix produced some improvement in soil quality, especially soil chemical properties, providing preliminary data for further research on the effect of tree species combination proportions on soil properties. Z. planispinum interplanting largely increased the content of trace elements in the soil and improved soil fertility [12]. Therefore, the scientific combination of species is conducive to improving soil fertility, the stability of forest stands, and ecological functions [13]. However, previous studies have focused on soil physicochemical indicators, with less attention paid to microorganisms [14], and the Ca and magnesium (Mg) in karst areas have rarely been addressed [15,16]. In addition, vegetation type affects soil quality, which in turn changes stoichiometry, but there are fewer reports on the relationship between soil quality and stoichiometry in mixed Z. planispinum forests [17,18]. Therefore, studying the soil quality of Z. planispinum plantations with different companion plants and its driving effect on stoichiometry can reveal the nutrient limitation status from the microscopic perspective of soil components and screen for more stable vegetation types.
Soil water content (SWC) and temperature (ST) are easy to measure as physical indicators and have direct and indirect effects on nutrient cycling. Carbon (C), N, P, and K are important biogenic elements in the soil. Z. planispinum is a Ca preference plant, so Ca plays a regulatory role in plant growth and development, while Ca and Mg are characteristic elements with high content in karst areas. Microbial concentration, biomass, and extracellular enzyme activity are sensitive to chemical reactions and play an important role in the nutrient cycling process. Based on this, we comprehensively studied the soil quality and its intrinsic correlation with stoichiometry in different planting patterns of Z. planispinum through soil physical and chemical properties, as well as microbial concentration, biomass C, N, P, and extracellular enzyme activity measurements. We aimed to analyze the extent to which soil physical, chemical, and biological properties affect the overall soil quality and identify important indicators for evaluating soil fertility. In addition, we intended to dissect the changes in the pattern of soil quality with planting pattern and to clarify the driving effect of soil quality on stoichiometry. Theoretically, we clarified the influence of species combinations on soil quality and revealed the driving mechanism of soil quality on stoichiometry; in practice, the best species combination was selected to improve the stability and ecological function of a plantation.

2. Materials and Methods

2.1. Overview of the Research Site

The study area is located in Beipanjiang Town, Guizhou Province, China (105°38′35″ E, 25°39′37″ N), with a typical river valley topography, 530–1473 m above sea level. On a long-term scale, the climate type is mainly subtropical humid monsoon climate. The region is rich in heat resources, with an average annual temperature of 18.4 °C and a total annual accumulated temperature of 6542.9 °C. The seasonal distribution of rainfall is uneven, with an average annual rainfall of 1100 mm and severe droughts in winter and spring. The site has serious rock desertification. The soil type mainly consists of limestone and marl as the parent material of soil formation with the exposed area of bedrock exceeding 70% [19]. Soil pH value is >6.5, and the soil exchangeable Ca and Mg content is high. The sampling year was 2020, in which the average temperature was 16.5 °C, the maximum and minimum temperatures were 36.0 and 0.0 °C, respectively, and the total annual accumulated temperature reached 5998.4 °C, with an annual precipitation of 1221.1 mm. Based on previous research results, we ascertained that the regional soil organic carbon, total N, fast-acting N, total P, and fast-acting P contents were in the order of 26.16, 4.58, 0.77, 1.62, and 0.01 g·kg−1.
Since 1992, the area of Z. planispinum cultivation has been gradually extended in the dry and hot karst valley area of Guizhou Province and now covers more than 10,000 ha. The yield of Z. planispinum is 4–5 kg·plant−1 and 4800 kg·ha−1. The output value reached RMB 120 million in 2007 and currently exceeds RMB 700 million (data not publicly available). Because of its excellent quality traits, it has become a protected geographical indication product and has been given a geographical indication certification trademark. Due to the development of stone desertification, a “stitch-and-shoot” planting method was adopted. In order to increase biodiversity and ecosystem stability, and to improve land use efficiency for economic gain, a number of composite planting patterns have gradually emerged [20]. However, due to the complexity of interspecific relationships, there is an urgent need to carry out research into planting pattern preferences.

2.2. Sample Plot Setting

Four common planting combinations were selected, namely, Z. planispinum + Prunus salicina, Z. planispinum + Sophora tonkinensis, Z. planispinum + Arachis hypogaea, and Z. planispinum + Lonicera japonica. A monoculture stand of Z. planispinum plantation was used as a control. One sample plot with similar environmental factors was set up for each of the five selected plantations. The Z. planispinum used in all five plantations was guaranteed to be of the same age, and the survey factors of the sample plots are shown in Table 1. At 5 years after planting Z. planispinum, Prunus salicina, Sophora tonkinensis, Arachis hypogaea, and Lonicera japonica were planted around them and grown for a further 3 years. The planting density was 600–750, 1500–1800, 2500, or 450–600 plants/ha. Before planting Z. planispinum, all the plots had been mainly planted with maize (Zea mays) and had the same management level and thus can be regarded as having similar soil fertility in space. The sample plots were set up with more consistent management measures such as shaping and pruning and fertilization to avoid affecting soil biology and to control the homogeneity of experimental results. The detailed management measures used for the five plantation species were as described previously [21], based on discussion of the effects of the species combinations on soil elements, microorganisms, and extracellular enzymes as a continuum, and the intrinsic interconnections between the three, to explore the effect of the plant combinations on soil quality, and its effect on stoichiometry by analyzing single soil factors and composite indices.

2.3. Soil Sample Collection

Soil samples were collected between 19 and 21 November 2020. The average values of meteorological data during the period were: sunshine hours 6.3 h, average temperature 14.3 °C, precipitation 0 mm, evaporation 0.5 mm, and wind speed 1.2 m·s−1. At this time of year, the material exchange between plants and soil is weak and the soil material composition is relatively stable. This facilitates better evaluation of the effect of the planting combination on soil quality. Sunny weather for more than 15 days prior to sampling ensured a low level of soil variability and a smaller number of tests to characterize the levels under prolonged drought conditions. Three 10 m × 10 m sample squares (with sufficient buffer strips between squares) were set up in each sample plot. Multiple sampling points were laid along S-shaped lines in the sample squares, and at each sample point equal amounts of soil from 0–10 and 10–20 cm soil layers (less than 20 cm to the actual depth), mixed evenly, were collected. Because of the shallow soil layer in karst areas, the thickness of the soil layer was mainly less than 20 cm, which is also the concentrated distribution area of fibrous roots. Therefore, only soil samples within the top 20 cm were collected in this study. Fertilization areas of 10–30 cm around the tree trunks were avoided as much as possible during sampling to minimize human interference. A total of 30 soil samples, each of about 500 g, were collected, and the fresh soil samples were divided into two parts after removing gravel (mass ratio about 15–20%), plant roots, and plant and animal residues. One part was passed through a 2 mm sieve and stored at 4 °C to determine the microbial concentration, biomass, and extracellular enzyme activity as soon as possible. The other part was air-dried and ground through a 0.15 mm sieve to determine the soil nutrient content. The determinations were completed within 7 and 30 days, respectively, after sample collection.

2.4. Index Analysis Methods

SWC and ST were measured with a TR-6 soil temperature and humidity meter. The pH value was determined by the potentiometric method [22]; available N by the alkaline diffusion method; available P by the HCl-H2SO4 leaching method; available K by flame photometry; and the contents of available Ca and available Mg were determined by atomic absorption spectrophotometry [23]. Soil total nutrients and microbial properties were determined as described by Li et al. [21], with the following data (Table 2 and Table 3).

2.5. Data Processing

The stoichiometry was calculated with reference to Sinsabaugh et al. [24] Microsoft Excel 2013 (version 2013, Microsoft, Redmond, WA, USA) was used to pre-process the data. One-way analysis of variance (ANOVA) at 95% confidence level was performed using SPSS 20.0 (version 20.0, IBM SPSS, Armonk, NY, USA) to test the variability of soil physicochemical properties. The mean values were separated by using the least significance difference test (LSD) in all cases [25,26]. Principal component analysis (PCA) was used to comprehensively evaluate the soil quality index (SQI) of the Z. planispinum plantation ecosystem with different planting combinations, and the indicators were standardized and pre-treated before evaluation. The weighted method was used to calculate the SQI, with the expression [27]:
SQI = ΣWi × Fi
where Wi is the contribution rate of each principal component, and Fi is the principal component score of each planting combination. Weighting the variance contribution rate (Wi) and factor score (Fi) of each principal component factor, the SQI of different planting combinations was obtained.
Redundancy analysis (RDA) was performed with Canoco 4.5 software to investigate the main factors affecting soil quality and its effect on stoichiometry in different planting combinations of Z. planispinum plantations [28]. Due to the different dimensions of the data, the data were first pre-processed using normalization and centralization for data normalization before sorting. Data are presented as mean ± standard deviation. Column charts were created using Origin 8.6 (version 8.6, OriginLab Corporation, Northampton, MA, USA).

3. Results

3.1. Soil Properties of Z. planispinum Plantations with Different Planting Combinations

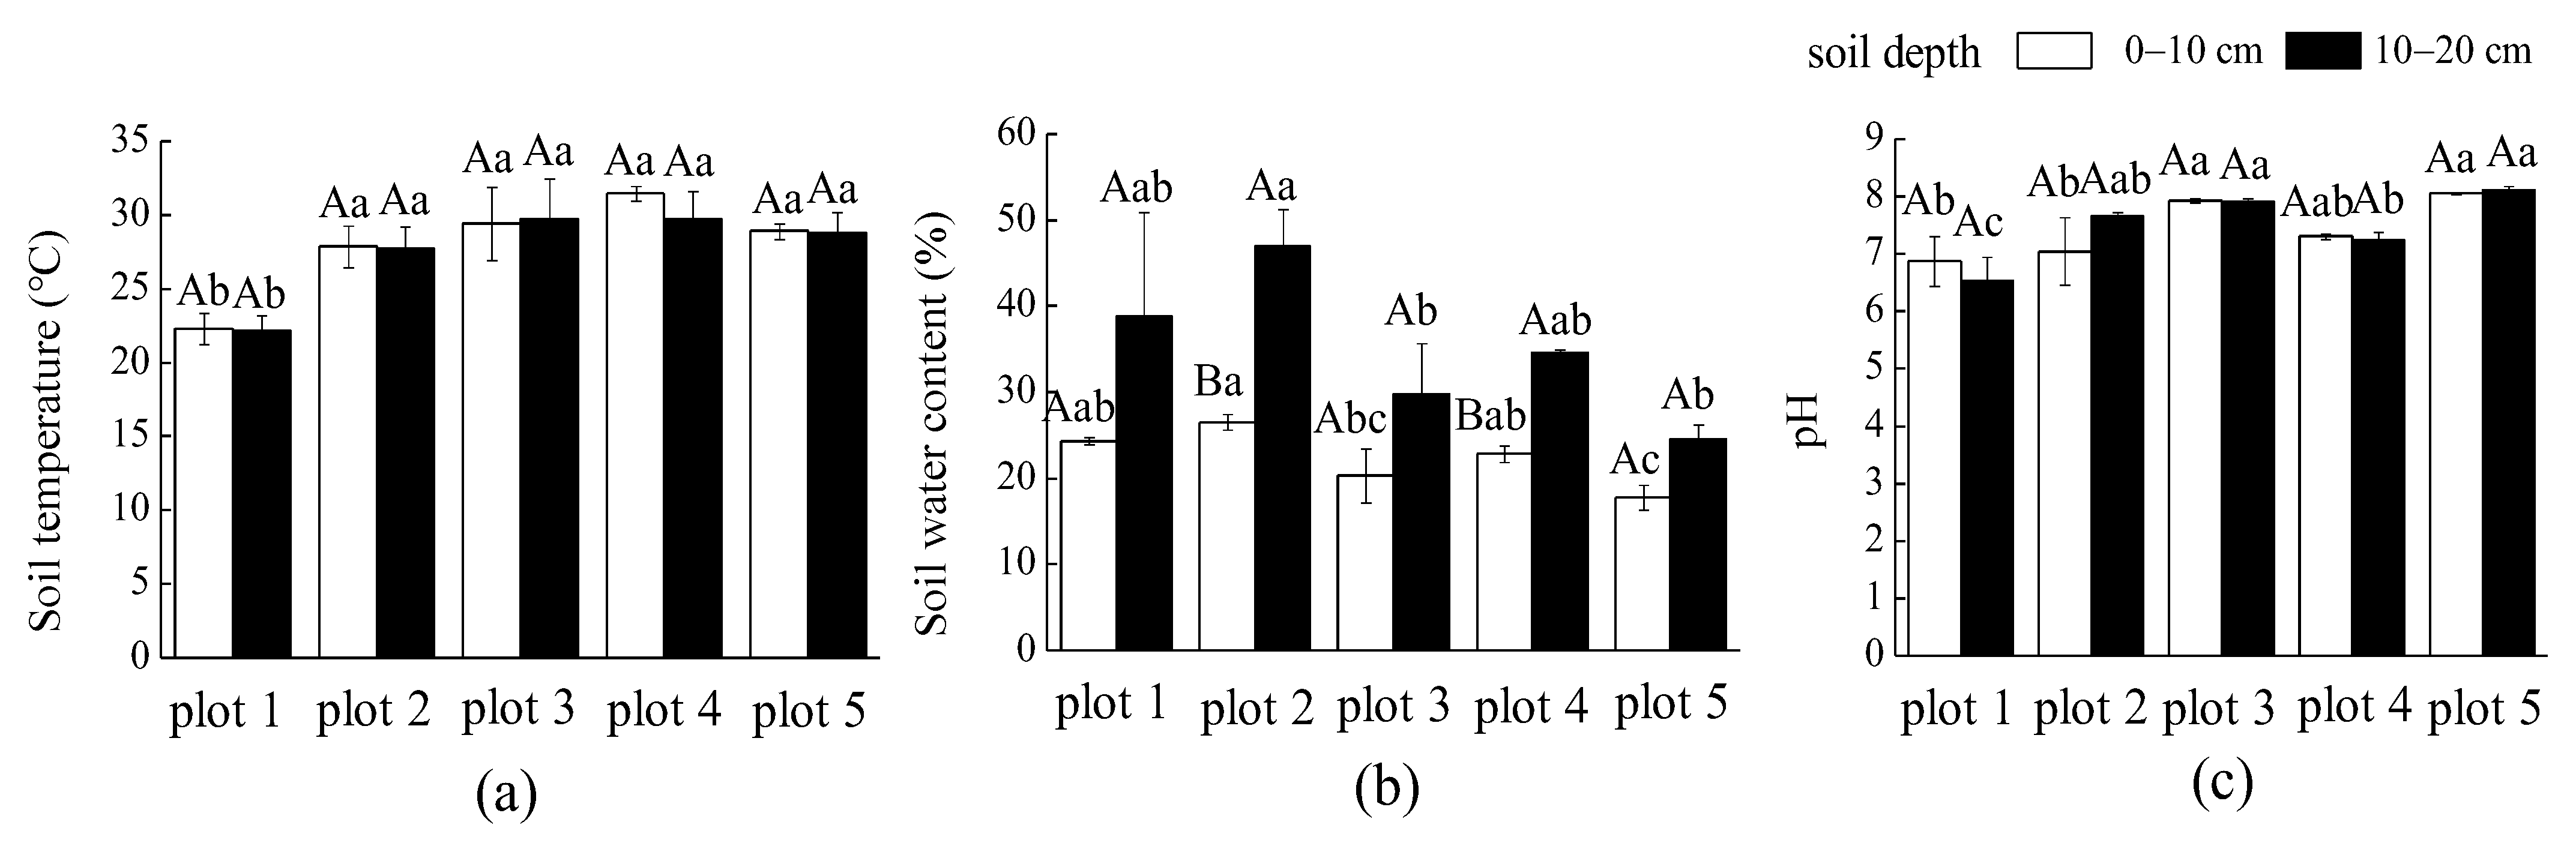
3.1.1. Soil Temperature, Water Content, and pH Value

Soil temperature (ST) was significantly lower in both soil layers in plot 1, but there was no significant difference between the rest of the plots. SWC values in both soil layers showed that plot 2 > plot 1 > plot 4 > plot 3 > plot 5, and the values were significantly higher in plot 2 than in plots 3 and 5 and increased with the deepening of the soil layer, indicating that the allocation of P. salicina could improve SWC. The pH values in the 0–10 cm soil layer were significantly higher in plots 3 and 5 than in plots 1 and 2 and significantly lower in plot 1 in the 10–20 cm soil layer, indicating that the combination with P. salicina had a certain effect on pH improvement (Figure 1).

3.1.2. Soil Available Nutrient Elements

Analysis of available N and available P contents in the 0–10 cm soil layer showed that both were higher in plots 1 and 4 than the other plots, and plot 5 was the lowest. The available K contents were plot 1 > plot 4 > plot 2 > plot 3 > plot 5. The available Ca contents were the highest in plot 4 and the lowest in plot 1, with significant differences between them. The available Mg contents were significantly higher in plots 4 and 5. The change law of the 10–20 cm soil layer was similar. In general, it seemed that the effect of the planting pattern on available nutrients was greater than that of total nutrients, especially on available Ca and available Mg. The combination with P. salicina and L. japonica was beneficial to the accumulation of available N, available P, and available K (Figure 2).

3.2. Comprehensive Evaluation of Soil Quality of Z. planispinum Plantations with Different Planting Combinations

Principal component analysis was conducted based on 24 soil quality indicators. According to the principle of eigenvalue > 1 and cumulative variance contribution rate > 85%, six principal components were extracted, with a cumulative contribution rate of 86.19%, indicating that they could explain the original variables. Therefore, further analysis was carried out for each principal component group loading factor (Table 4). Among them, the first principal component was significantly positively correlated with SOC, total N, total P, and available N, representing the soil mass elements C, N, and P. The second principal component had a large load on total Ca, total Mg, and available Mg, which are characteristic elements of karst areas. The third principal component had a large load on β-1,4-glucosidase (BG), β-1,4-N-acetylglucosaminidase (NAG), and acid phosphatase (AP), mainly due to soil extracellular enzyme activity. The main dominant index of the fourth principal component was microbial biomass (MB) P, which represented soil microbial biomass. The fifth principal component had a large load with bacteria, actinomycete concentration, and MBN, which represented soil microorganisms. The sixth principal component was mainly controlled by SWC and indicated the soil’s physical properties.
According to Table 5, the SQIs of different plantations were obtained by weighting the variance contribution of each principal component factor and the factor scores as plot 4 > plot 5 > plot 3 > plot 2 > plot 1. The positive SQI values of plots 4 and 5 indicated that the soil fertility of these two plantations was higher than the average, and the Z. planispinum + L. japonica plantation had the best soil quality, which was higher than the other plantations.

3.3. Soil Stoichiometry of Z. planispinum Plantations with Different Planting Combinations

The variation of C:N in the same soil layer was not significant, and the trends of C:P and N:P were similar, with the highest values in plot 2 and the lowest values in plot 5. C:K, N:K, and P:K were generally the highest in plot 1 and the lowest in plot 3. The differences of soil microbial stoichiometry ratios were only reflected in the MBC:MBP in the 0–10 cm soil layer, which was significantly higher in plot 1 than in plots 2–4. The three extracellular enzyme stoichiometry ratios did not differ significantly among different sites in the same soil layer or among different soil layers in the same site (Table 6).

3.4. Effect of Soil Quality on Stoichiometry

After taking the minimum dataset to filter the factor ranking, more than 20% of information was lost. It also caused the contribution of individual factors to be reduced again due to secondary dimensionality reduction. Therefore, we tried to select all indicators for RDA. The 24 soil quality factors and SQI, totaling 25 indicators involved in the PCA, were subjected to RDA as environmental variables. The final amount of variability explained by environmental factors on 14 stoichiometric ratios was obtained. As shown in Figure 3, the explanation rate of axis1 and axis2 were 39.50% and 17.20%, respectively, with a cumulative explanation rate of 56.7%, indicating that axis1 and axis2 could explain more than half of the information. The red and blue arrows in the figure represent soil quality indicators (explanatory variables) and soil stoichiometry (response variables), respectively. A longer length of arrows indicates a greater effect of the explanatory variables. A longer projection of a dashed arrow line on the solid arrow line indicates a greater effect on the soil stoichiometric ratio.
The content of soil available nutrients and microbial concentrations had positive effects on element stoichiometry, but the effect of total nutrients was negative, suggesting that the balance relationships of elements were more governed by their available forms and quantities. There was a significant enhancement effect of SWC on C:N, C:P, N:P, and BG:(NAG + LAP), indicating that SWC weighed more on a large number of limiting elements such as C and N. The contribution of Ca and Mg elements to soil stoichiometry was relatively high in karst areas (Table 7), and the response of Ca:Mg to the explanatory variables was mostly negative compared with other stoichiometric ratios. SQI had little effect on soil stoichiometry (Table 7) and mainly showed inhibition, which indicated that attention should be paid to the action mechanism of different soil elements, especially nutrient elements. Soil microbial biomass stoichiometry ratios were relatively little influenced by soil habitat and tended to be internally stable mechanisms (Figure 3).

4. Discussion

4.1. Comparison of Soil Quality of Z. planispinum Plantations with Different Planting Combinations

The soil SOC, total N, total P, available N, total Ca, total Mg, and available Mg were evaluated to represent the comprehensive level of soil fertility through principal component analysis (Table 4). At the same time, soil extracellular enzyme activity, microbial concentration and biomass also had a large effect, indicating that soil microorganisms can drive nutrient transformation and cycling, indirectly reflecting the level of comprehensive soil fertility [29].
The soil quality of Z. planispinum + L. japonica was the highest among the five plantations (Table 5). The reasons are as follows: 1, L. japonica produces a large amount of soft and easily decomposed litter [30], which is conducive to nutrient return and improves the content of soil C, N, P, K and other nutrients (Table 2, Figure 2); 2, L. japonica covers the soil and its shallow root system creates more suitable hydrothermal conditions for microbial mineralization of nutrients and increases the dynamic circulation of available nutrients in the soil [31]; and 3, the pH value of this plantation is close to neutral (Figure 1c), which facilitates the activation of effective soil nutrients [32]. The comprehensive results showed that Z. planispinum + L. japonica formed a vertical distribution pattern and a semi-closed soil environment, improved the spatial utilization efficiency and the surface microenvironment, and would be the optimal allocation pattern in a dry and hot karst valley.
Z. planispinum + L. japonica had the lowest factor score for factor 6 (Table 5), which was known to have low SWC (28.69%) from Figure 1b. The reason for this is that L. japonica has a high canopy density, and the canopy requires a large amount of water, which greatly reduces the water available in the soil. It is also because L. japonica has a higher demand for soil water during growth in order to maintain a high biomass. Therefore, in order to improve the soil quality of the plantation, the SWC needs to be increased to a suitable level. However, in a long-term arid environment, plants in karst areas form a physiological structure suitable for the habitat [33], so the appropriate soil water threshold needs to be further studied. Z. planispinum + A. hypogaea and monoculture Z. planispinum plantations had the lowest factor scores for factor 1 (Table 5), indicating that their soil quality was closely related to soil C, N, and P nutrient deficits. Meanwhile, Z. planispinum + P. salicina and Z. planispinum + S. tonkinensis plantations had the lowest factor scores for factor 2 (Table 5), indicating that both were influenced by the content of Ca and Mg elements. Ca and Mg are essential nutrient elements for plant growth and development and also participate in photosynthesis, senescence, and other physiological metabolic processes [16,34]. Since the contents of total Ca, total Mg and available Mg in the soil of the two plantations were lower than those of other plantations (Table 2, Figure 2e), additional Ca and Mg inputs were needed. According to Table 5, the SQI of monoculture Z. planispinum plantation was higher than that of Z. planispinum + P. salicina, Z. planispinum + S. tonkinensis or Z. planispinum + A. hypogaea, which was inconsistent with the conclusion that mixed forest can effectively increase soil fertility and improve the soil nutrient distribution pattern [35,36]. The reasons are as follows. First, the low nutrient return of the configured trees, coupled with their relatively concentrated root distribution, makes them compete with the Z. planispinum for nutrients, eventually leading to low soil nutrient content. In addition, among the three plantations, P. salicina and A. hypogaea both extracted a large amount of nutrients due to harvesting for consumption (for L. japonica, only a small number of flowers was removed), while S. tonkinensis formed a low perennial shrub with limited nitrogen fixation. Finally, soil fertility is also related to the production of specific root secretions by the configured trees, which affected the mutually beneficial relationship between plants and microorganisms [37,38]. It is clear that the selection of configured trees is crucial for improving soil quality. From the perspective of biodiversity maintenance and ecosystem function enhancement, organic carbon and organic nitrogen components can also be added in the future to assist in the screening of species.

4.2. The Driving Force of Soil Quality on Stoichiometry of Z. planispinum Plantations with Different Planting Combinations

Total nutrients characterize the potential of soil to supply nutrients to plants and are direct factors for calculating stoichiometric ratio. Available nutrients are the proportion that can be directly absorbed and utilized by microorganisms. As important nutrients for microbial growth, available nutrients affect the leaching and extraction of nutrients by microorganisms, indicate the chemical and biological processes of soil microorganisms, and regulate the proportion of elements in the soil [39]. As shown in Figure 3, available K had a synergistic effect on stoichiometry, while total K had the opposite effect, indicating that the effects of nutrient forms on ecological processes were different. The reason for this phenomenon may be that the deficiency of available nutrients stimulates the mineralization process of microorganisms so as to quickly provide nutrients required for the growth of plants and microorganisms [40]. Total nutrient deficiency accelerates the humification process to form a pattern of “intensive utilization” of nutrients [41], but the specific mechanism needs further research.
SWC affects nutrient dissolution, transport, and microbial activity, which in turn limits soil quality and vegetation growth. The SWC in this study was proportional to C:N, which was a key index affecting stoichiometry (Figure 3). This finding indicated that increased SWC led to slower soil mineralization rates and increased SOC content. This is consistent with the conclusion of Muhammad et al. [41] that SWC plays a catalytic role in SOC content, indicating that in dry environments where soil water is a limiting factor, high SWC can regulate the soil microenvironment and increase SOC accumulation through microbial activity. The SWC in this study was also proportional to both C:P and N:P (Figure 3), indicating that the increase of SWC promoted P fixation by soil microorganisms, resulting in the decrease of total P content accompanied by the decrease of P availability. The contributions of total Ca and total Mg were relatively highest among the soil nutrients affecting stoichiometry (Table 7), because Ca and Mg contents are high in the karst limestone geological background. Z. planispinum has developed a specific Ca-dependent mechanism through long-term evolution in this environment, and thus Ca and Mg have become the key dominant factors for its growth. The pH value can affect chemical reactions such as oxidation–reduction, neutralization, dissolution and precipitation in the soil, as well as the activity of microorganisms, and change the balance of soil elements [42]. In this study, pH was inversely proportional to C:N, indicating that the lower the pH the slower the mineralization of organic matter within a certain range. This is due to the fact that a suitable pH promotes microbial activities and accelerates organic matter decomposition, which in turn increases SOC [43]. The microbial biomass stoichiometric ratios were less influenced by elements and were mainly influenced by MBP (Figure 3). According to the homeostasis hypothesis, this phenomenon indicates that when the nutrient balance in the external environment changes, microorganisms adjust the community structure and metabolic process to maintain their own stoichiometric stability [44]. In this study, SQI has little effect on stoichiometry (Table 7). This is because soil is a “black-box” system, and the material exchange and nutrient circulation between plants and soil is a complex open system [45]. This suggests that it is important to consider not only the impact of the integrated soil quality on stoichiometry but also the trade-offs and synergistic relationships among the soil elements. Therefore, soil managers should not only pay attention to comprehensiveness but also strengthen the control of different elements, which has reference significance for the next step of soil quality regulation.

5. Conclusions

The order of SQI was Z. planispinum + L. japonica (1.678) > Z. planispinum monoculture (0.206) > Z. planispinum + A. hypogaea (−0.098) > Z. planispinum + S. tonkinensis (−0.845) > Z. planispinum + P. salicina (−0.939), indicating that Z. planispinum + L. japonica was the preferred planting combination. Redundancy analysis showed that SWC, pH, and other factors have a greater impact on stoichiometry, while SQI has a smaller impact. This indicates that there are strong interactions among the soil’s physical, chemical and biological factors, which affects the geochemical processes of elements. Attention should be paid to the regulatory effect of different soil factors on their stoichiometry.

Author Contributions

Conceptualization, Y.Y.; formal analysis, Y.L.; software, Y.L.; investigation, Y.L. and Y.S.; writing—original draft preparation, Y.L.; writing—review and editing, Y.Y. All authors have read and agreed to the published version of the manuscript.

Funding

This research was funded by the Guizhou Province Science and Technology Support Plan Project (Qian-ke-he Zhicheng [2022] Yiban 103) and Special Forestry Science and Technology Promotion Project (Gui [2021] TSLY01).

Institutional Review Board Statement

Not applicable.

Informed Consent Statement

Not applicable.

Data Availability Statement

The data are not publicly available due to privacy.

Acknowledgments

Authors are thankful to editors and anonymous reviewers for providing valuable comments and suggestions for the improvement of the manuscript.

Conflicts of Interest

The authors declare no conflict of interest.

References

  1. Bao, Q.; Yang, R.; Li, W.H.; Nie, C.J.; Lu, F.J. Soil ecological effects of different restoration models in the karst plateau gorge region. J. Soil Water Conserv. 2017, 31, 154–161. (In Chinese) [Google Scholar] [CrossRef]
  2. Wang, Y.; Zhang, L.T.; Feng, Y.X.; Guo, S.S.; Pang, X.; Zhang, D.; Geng, Z.F.; Du, S.S. Insecticidal and repellent efficacy against stored-product insects of oxygenated monoterpenes and 2-dodecanone of the essential oil from Zanthoxyium planispinum var. dintanensis. Environ. Sci. Pollut. Res. 2019, 26, 24988–24997. [Google Scholar] [CrossRef] [PubMed]
  3. Huuskonena, S.; Domischb, T.; Finérb, L.; Hantulaa, J.; Hynynena, J.; Matalab, J.; Miinab, J.; Neuvonenc, S.; Nevalainenb, S.; Niemistöd, P.; et al. What is the potential for replacing monocultures with mixed-species stands to enhance ecosystem services in boreal forests in Fennoscandia? For. Ecol. Manag. 2021, 479, 118558. [Google Scholar] [CrossRef]
  4. Thoms, C.; Gattinger, A.; Jacob, M.; Thomas, F.M.; Gleixner, G. Direct and indirect effects of tree diversity drive soil microbial diversity in temperate deciduous forest. Soil Biol. Biochem. 2010, 42, 1558–1565. [Google Scholar] [CrossRef]
  5. Wang, L.X.; Pang, X.Y.; Li, N.; Qi, K.B.; Huang, J.S.; Yin, C.Y. Effects of vegetation type, fine and coarse roots on soil microbial communities and enzyme activities in eastern Tibetan plateau. Catena 2020, 194, 104694. [Google Scholar] [CrossRef]
  6. Zeng, Q.C.; Li, X.; Dong, Y.H.; An, S.S.; Darboux, F. Soil and plant components ecological stoichiometry in four steppe communities in the Loess Plateau of China. Catena 2016, 147, 481–488. [Google Scholar] [CrossRef]
  7. Ren, Z.; Niu, D.C.; Ma, P.P.; Wang, Y.; Fu, H.; Elser, J.J. Cascading influences of grassland degradation on nutrient limitation in a high mountain lake and its inflow streams. Ecology 2019, 100, e02755. [Google Scholar] [CrossRef]
  8. Lu, L.H.; Li, H.; Chen, L.; Ming, A.G.; Yang, Y.J. Effects of management patterns on soil physicochemical properties and ecological stoichiometric ratio in Pinus massoniana near-mature forest. Chin. J. Ecol. 2021, 40, 654–663. (In Chinese) [Google Scholar] [CrossRef]
  9. Stocker, C.M.; Bamberg, A.L.; Stumpf, L.; Monteiro, A.B.; Cardoso, J.H.; de Lima, A.C.R. Short-term soil physical quality improvements promoted by an agroforestry system. Agrofor. Syst. 2020, 94, 2053–2064. [Google Scholar] [CrossRef]
  10. Ma, Y.H.; Fu, S.L.; Zhang, X.P.; Zhao, K.; Chen, H.Y.H. Intercropping improves soil nutrient availability, soil enzyme activity and tea quantity and quality. Appl. Soil Ecol. 2017, 119, 171–178. [Google Scholar] [CrossRef]
  11. Zhou, L.; Sun, Y.J.; Saeed, S.; Zhang, B.; Luo, M. The difference of soil properties between pure and mixed Chinese fir (Cunninghamia lanceolata) plantations depends on tree species. Glob. Ecol. Conserv. 2020, 22, e01009. [Google Scholar] [CrossRef]
  12. Chen, J.Z.; Rong, L.; Xiong, K.N. Effect of Interplanting Patterns on Concentrations of Soil Mineral Elements of Zanthoxylum bungeanum. Southwest China J. Agric. Sci. 2019, 32, 763–769. (In Chinese) [Google Scholar] [CrossRef]
  13. Hou, X.L.; Han, H.; Tigabu, M.; Cai, L.P.; Meng, F.R.; Liu, A.Q.; Ma, X.Q. Changes in soil physico-chemical properties following vegetation restoration mediate bacterial community composition and diversity in Changting, China. Ecol. Eng. 2019, 138, 171–179. [Google Scholar] [CrossRef]
  14. Raiesi, F. A minimum data set and soil quality index to quantify the effect of land use conversion on soil quality and degradation in native rangelands of upland arid and semiarid regions. Ecol. Indic. 2017, 75, 307–320. [Google Scholar] [CrossRef]
  15. Rowley, M.C.; Grand, S.; Verrecchia, E.P. Calcium-mediated stabilisation of soil organic carbon. Biogeochemistry 2018, 137, 27–49. [Google Scholar] [CrossRef] [Green Version]
  16. Wang, Z.; Ul Hassan, M.; Nadeem, F.; Wu, L.Q.; Zhang, F.S.; Li, X.X. Magnesium Fertilization Improves Crop Yield in Most Production Systems: A Meta-Analysis. Front. Plant Sci. 2020, 10, 1727. [Google Scholar] [CrossRef] [PubMed] [Green Version]
  17. He, Q.Q.; Wu, Y.H.; Bing, H.J.; Zhou, J.; Wang, J.P. Vegetation type rather than climate modulates the variation in soil enzyme activities and stoichiometry in subalpine forests in the eastern Tibetan Plateau. Geoderma 2020, 374, 114424. [Google Scholar] [CrossRef]
  18. Huang, R.; Lan, T.; Song, X.; Li, J.; Ling, J.; Deng, O.P.; Wang, C.Q.; Gao, X.S.; Li, Q.Q.; Tang, X.Y.; et al. Soil labile organic carbon impacts C:N:P stoichiometry in urban park green spaces depending on vegetation types and time after planting. Appl. Soil Ecol. 2021, 163, 103926. [Google Scholar] [CrossRef]
  19. Zou, J.; Yu, L.F.; Huang, Z.S. Variation of Leaf Carbon Isotope in Plants in Different Lithological Habitats in a Karst Area. Forest 2019, 10, 356. [Google Scholar] [CrossRef] [Green Version]
  20. Wei, C.S.; Zuo, Z.L. Analysis and countermeasure research on the cause of the decline of Zanthoxyhum planispiunum var dingtanensis industry. Guizhou For. Sci. Technol. 2016, 44, 60–64. (In Chinese) [Google Scholar] [CrossRef]
  21. Li, Y.T.; Yu, Y.H.; Song, Y.P. Stoichiometry of Soil, Microorganisms, and Extracellular Enzymes of Zanthoxylum planispinum var. dintanensis Plantations for Different Allocations. Agronomy 2022, 12, 1709. [Google Scholar] [CrossRef]
  22. Bao, S.D. Soil Agrochemical Analysis, 3rd ed.; China Agriculture Press: Beijing, China, 2000; pp. 22–173. (In Chinese) [Google Scholar]
  23. Lu, R.K. Methods for Soil and Agriculture Chemistry Analysis, 1st ed.; Chinese Agricultural Science and Technology Press: Beijing, China, 1999. (In Chinese) [Google Scholar]
  24. Sinsabaugh, R.L.; Hill, B.H.; Shah, J.J.F. Ecoenzymatic stoichiometry of microbial organic nutrient acquisition in soil and sediment. Nature 2009, 462, 795–798. [Google Scholar] [CrossRef] [PubMed]
  25. Ferrara, G.; Loffredo, E.; Senesi, N. Anticlastogenic, antitoxic and sorption effects of humic substances on the mutagen maleic hydrazide tested in leguminous plants. Eur. J. Soil Sci. 2004, 55, 449–458. [Google Scholar] [CrossRef]
  26. Ferrara, G.; Loffredo, E.; Simeone, R.; Senesi, N. Evaluation of Antimutagenic and Desmutagenic Effects of Humic and Fulvic Acids on Root Tips of Vicia faba. Environ. Toxicol. 2000, 15, 513–517. [Google Scholar] [CrossRef]
  27. Jin, Z.Z.; Lei, J.Q.; Xu, X.W.; Li, S.Y.; Zhao, S.F.; Qiu, Y.Z.; Xu, B. Evaluation of soil fertility of the shelter-Forest land along the Tarim Desert Highway. Chin. Sci. Bull. 2008, 53, 125–136. [Google Scholar] [CrossRef] [Green Version]
  28. Joswig, J.S.; Wirth, C.; Schuman, M.C.; Kattge, J.; Reu, B.; Wright, I.J.; Sippel, S.D.; Rüger, N.; Richter, R.; Schaepman, M.E.; et al. Climatic and soil factors explain thetwo-dimensional spectrum of global planttrait variation. Nat. Ecol. Evol. 2022, 6, 36–50. [Google Scholar] [CrossRef]
  29. Schloter, M.; Nannipieri, P.; Sørensen, S.J.; van Elsas, J.D. Microbial indicators for soil quality. Biol. Fertil. Soils 2018, 54, 1–10. [Google Scholar] [CrossRef] [Green Version]
  30. Smith, M.S.; Fridley, J.D.; Goebe, M.; Bauerle, T.L. Links between Belowground and Aboveground Resource-Related Traits Reveal Species Growth Strategies that Promote Invasive Advantages. PLoS ONE 2014, 9, e104189. [Google Scholar] [CrossRef]
  31. López-Vicente, M.; Calvo-Seas, E.; Álvarez, S.; Cerdà, A. Effectiveness of Cover Crops to Reduce Loss of Soil Organic Matter in a Rainfed Vineyard. Land 2020, 9, 230. [Google Scholar] [CrossRef]
  32. Ch’ng, H.Y.; Ahmed, O.H.; Majid, N.M.A. Improving phosphorus availability in an acid soil using organic amendments produced from agroindustrial wastes. Sci. World J. 2014, 506356, 1–6. [Google Scholar] [CrossRef]
  33. Green, S.M.; Dungait, J.A.J.; Tu, C.L.; Buss, H.L.; Sanderson, N.; Hawkes, S.J.; Xing, K.X.; Yue, F.J.; Hussey, V.L.; Peng, J.; et al. Soil functions and ecosystem services research in the Chinese karst Critical Zone. Chem. Geol. 2019, 527, 119107. [Google Scholar] [CrossRef] [Green Version]
  34. White, P.J.; Broadley, M.R. Calcium in plants. Ann. Bot. 2003, 92, 487–511. [Google Scholar] [CrossRef] [PubMed]
  35. Wang, Q.K.; Wang, S.L. Soil microbial properties and nutrients in pure and mixed Chinese fir plantations. J. For. Res. 2008, 19, 131–135. [Google Scholar] [CrossRef]
  36. Udawatta, R.P.; Kremer, R.J.; Nelson, K.A.; Jose, S.; Bardhan, S. Soil quality of a mature alley cropping agroforestry system in temperate North America. Commun. Soil Sci. Plant Anal. 2014, 45, 1539–2551. [Google Scholar] [CrossRef]
  37. Qi, K.B.; Pang, X.Y.; Yang, B.; Bao, W.K. Soil carbon, nitrogen and phosphorus ecological stoichiometry shifts with tree species in subalpine plantations. PeerJ 2020, 8, e9702. [Google Scholar] [CrossRef]
  38. Rawata, M.; Arunachalam, K.; Arunachalam, A.; Alatalo, J.M.; Kumar, U.; Simon, B.; Hufnagel, L.; Micheli, E.; Pandey, R. Relative contribution of plant traits and soil properties to the functioning of a temperate forest ecosystem in the Indian Himalayas. Catena 2020, 194, 104671. [Google Scholar] [CrossRef]
  39. Tian, L.M.; Zhao, L.; Wu, X.D.; Hu, G.J.; Fang, H.B.; Zhao, Y.H.; Shen, Y.; Chen, J.; Wu, J.C.; Li, W.P.; et al. Variations in soil nutrient availability across Tibetan grassland from the 1980s to 2010s. Geoderma 2019, 338, 197–205. [Google Scholar] [CrossRef]
  40. Tian, D.S.; Reich, P.B.; Chen, H.Y.H.; Xiang, Y.Z.; Luo, Y.Q.; Shen, Y.; Meng, C.; Han, W.X.; Niu, S.L. Global changes alter plant multi-element stoichiometric coupling. New Phytol. 2019, 221, 807–817. [Google Scholar] [CrossRef]
  41. Muhammad, I.; Yang, L.; Ahmad, S.; Zeeshan, M.; Farooq, S.; Ali, I.; Khan, A.; Zhou, X.B. Irrigation and Nitrogen Fertilization Alter Soil Bacterial Communities, Soil Enzyme Activities, and Nutrient Availability in Maize Crop. Front. Microbiol. 2022, 13, 833758. [Google Scholar] [CrossRef]
  42. Palansooriya, K.N.; Shaheen, S.M.; Chen, S.S.; Tsang, D.C.W.; Hashimoto, Y.; Hou, D.Y.; Bolan, N.S.; Rinklebe, J.; Ok, Y.S. Soil amendments for immobilization of potentially toxic elements in contaminated soils: A critical review. Environ. Int. 2020, 134, 105046. [Google Scholar] [CrossRef]
  43. Wei, L.; Ge, T.D.; Zhu, Z.K.; Luo, Y.; Yang, Y.H.; Xiao, M.L.; Yan, Z.F.; Li, Y.H.; Wu, J.S.; Kuzyakov, Y. Comparing carbon and nitrogen stocks in paddy and upland soils: Accumulation, stabilization mechanisms, and environmental drivers. Geoderma 2021, 398, 115121. [Google Scholar] [CrossRef]
  44. Khan, K.S.; Joergensen, R.G. Stoichiometry of the soil microbial biomass in response to amendments with varying C/N/P/S ratios. Biol. Fertil. Soils 2019, 55, 265–274. [Google Scholar] [CrossRef]
  45. Wu, L.K.; Lin, X.M.; Lin, W.X. Advances and perspective in research on plant-soil-microbe interactions mediated by root exudates. Chin. J. Plant Ecol. 2014, 38, 298–310. (In Chinese) [Google Scholar] [CrossRef]
Figure 1. Soil temperature (a), water content (b) and pH value (c) of Z. planispinum plantations with different planting combinations. Plot 1, Z. planispinum + P. salicina; plot 2, Z. planispinum + S. tonkinensis; plot 3, Z. planispinum + A. hypogaea; plot 4, Z. planispinum + L. japonica; plot 5, Z. planispinum monoculture plantation. The vertical line on each bar is the error line, that is, the error range of the statistical results. The upper part is a positive error, and the lower part is a negative error. Lower case letters indicate significant differences between different plantation types of the same depth at p < 0.05; upper case letters indicate significant differences between different depths of the same plantation types at p < 0.05. One-way ANOVA was used to calculate the differences, p = 0.05, n = 15.
Agronomy 12 02562 g001
Figure 2. Soil available nitrogen (a), available phosphorus (b), available potassium (c), available calcium (d), available magnesium (e) of Z. planispinum plantations with different planting combinations. Plot 1, Z. planispinum + P. salicina; plot 2, Z. planispinum + S. tonkinensis; plot 3, Z. planispinum + A. hypogaea; plot 4, Z. planispinum + L. japonica; plot 5, Z. planispinum monoculture plantation. The vertical line on each bar is the error line, that is, the error range of the statistical results. The upper part is a positive error, and the lower part is a negative error. Lower case letters indicate significant differences between different plantation types of the same depth at p < 0.05; upper case letters indicate significant differences between different depths of the same plantation types at p < 0.05. One-way ANOVA was used to calculate the differences, p = 0.05, n = 15.
Agronomy 12 02562 g002
Figure 3. Two-dimensional sequence of the RDA analysis of soil quality and stoichiometry. ST, soil temperature; SWC, soil water content; SOC, soil organic carbon; TN, total nitrogen; TP, total phosphorus; TK, total potassium; TCa, total calcium; TMg, total magnesium; AN, available nitrogen; SAP, soil available phosphorus; AK, available potassium; ACa, available calcium; AMg, available magnesium; FUN, fungi concentration; BAC, bacterial concentration; ACT, actinomycetes concentration; MBC, microbial biomass carbon; MBN, microbial biomass nitrogen; MBP, microbial biomass phosphorus; BG, β-1,4-glucosidase; NAG, β-1,4-N-acetylglucosaminidase; LAP, leucine aminopeptidase; AP, acid phosphatase; SQI, soil quality index.
Agronomy 12 02562 g003
Table 1. General information of plots.
Plantation TypeSpecies CombinationsLongitudeLatitudeGrowing Area (ha)Altitude (m asl)Density
(m)
Height (m)Crown Width
(m)
Coverage
(%)
Plot 1Z. planispinum + P. salicina105°40′28.33″ E25°37′57.41″ N1.347643 × 33.52 × 2.370
Plot 2Z. planispinum + S. tonkinensis105°40′19.79″ E25°39′25.75″ N0.677282 × 22.01.2 × 1.860
Plot 3Z. planispinum + A. hypogaea105°38′36.32″ E25°39′23.64″ N0.677912 × 22.52.5 × 2.885
Plot 4Z. planispinum + L. japonica105°38′36.35″ E25°39′22.29″ N6.678143.5 × 32.51.5 × 2.570
Plot 5Z. planispinum105°38′35.64″ E25°39′23.35″ N33.357883 × 42.22.5 × 2.365
Table 2. Soil total nutrients of Z. planispinum plantation in different planting combinations.
Soil ParametersSoil Depth (cm)Plot 1Plot 2Plot 3Plot 4Plot 5
Soil organic carbon
(g·kg−1)
0–1036.05 ± 9.83 Aab32.45 ± 2.05 Aab28.75 ± 15.49 Ab59.55 ± 16.48 Aa27.05 ± 1.34 Ab
10–2039.40 ± 4.81 Aa26.35 ± 0.92 Aa27.60 ± 12.59 Aa42.10 ± 10.18 Aa25.95 ± 3.04 Aa
Total nitrogen
(g·kg−1)
0–1036.05 ± 9.83 Aab2.78 ± 0.04 Ab2.79 ± 0.93 Ab5.07 ± 0.25 Aa2.84 ± 0.23 Ab
10–2039.40 ± 4.81 Aa2.51 ± 0.11 Ab2.78 ± 0.56 Ab4.13 ± 0.64 Aa2.69 ± 0.23 Ab
Total phosphorus
(g·kg−1)
0–101.46 ± 0.13 Aab0.99 ± 0.21 Ab1.17 ± 0.52 Aab1.73 ± 0.20 Aa1.32 ± 0.01 Aab
10–201.27 ± 0.08 Aa0.66 ± 0.13 Ab1.04 ± 0.35 Aab1.32 ± 0.15 Aa1.21 ± 0.06 Aa
Total potassium
(g·kg−1)
0–107.15 ± 0.35 Ab6.64 ± 2.79 Ab11.65 ± 0.78 Aa11.65 ± 0.50 Aa11.80 ± 0.57 Aa
10–206.75 ± 1.04 Ac5.58 ± 0.23 Ac13.00 ± 0.28 Aa12.10 ± 0.57 Aa9.96 ± 0.62 Ab
Total calcium
(g·kg−1)
0–101.20 ± 0.85 Aa2.35 ± 2.05 Aa6.05 ± 6.72 Aa1.65 ± 0.21 Aa9.40 ± 5.37 Aa
10–201.25 ± 0.50 Ab1.95 ± 1.34 Ab4.65 ± 4.60 Aab2.10 ± 0.57 Ab8.90 ± 2.97 Aa
Total magnesium
(g·kg−1)
0–105.30 ± 2.55 Ab5.65 ± 3.32 Ab7.85 ± 1.91 Ab8.45 ± 1.06 Ab15.45 ± 0.21 Aa
10–205.10 ± 0.57 Ab4.25 ± 0.21 Ab11.45 ± 4.88 Aa8.75 ± 1.20 Aab12.25 ± 2.05 Aa
Plot 1, Z. planispinum + P. salicina; plot 2, Z. planispinum + S. tonkinensis; plot 3, Z. planispinum + A. hypogaea; plot 4, Z. planispinum + L. japonica; plot 5, Z. planispinum monoculture plantation. Lower case letters indicate significant differences between different plantation types of the same depth at p < 0.05; upper case letters indicate significant differences between different depths of the same plantation types at p < 0.05. One-way ANOVA was used to calculate the differences, p = 0.05, n = 15. Data are presented as mean ± standard deviation.
Table 3. Soil microbial concentration, biomass, and extracellular enzyme activity of Z. planispinum plantation in different planting combinations.
Soil ParametersSoil Depth (cm)Plot 1Plot 2Plot 3Plot 4Plot 5
Fungal concentration
(×103 CFU·g−1)
0–1011.75 ± 4.60 Aa11.00 ± 1.41 Aa9.60 ± 4.81 Aa12.00 ± 1.41 Aa8.40 ± 2.26 Aa
10–2012.50 ± 3.54 Aa9.00 ± 2.83 Aa5.95 ± 0.21 Aa12.20 ± 5.37 Aa7.45 ± 3.61 Aa
Bacterial concentration
(×106 CFU·g−1)
0–102.35 ± 0.09 Abc5.30 ± 0.71 Aa3.00 ± 0.99 Abc3.15 ± 0.49 Ab1.20 ± 0.00 Ac
10–204.85 ± 1.06 Aa1.80 ± 0.42 Bbc2.20 ± 1.56 Aabc4.40 ± 1.13 Aab1.55 ± 0.78 Ac
Actinomycete concentration
(×105 CFU·g−1)
0–1021.50 ± 12.02 Aa26.50 ± 0.71 Aa14.65 ± 6.15 Aa25.00 ± 7.07 Aa9.30 ± 0.57 Aa
10–2026.50 ± 13.44 Aa9.95 ± 0.07 Ba15.00 ± 7.07 Aa32.15 ± 11.10 Aa10.10 ± 5.52 Aa
Microbial biomass carbon
(mg·kg−1)
0–10265.00 ± 15.56 Aa252.00 ± 8.49 Aa249.50 ± 20.51 Aa245.00 ± 19.80 Aa262.00 ± 9.90 Aa
10–20221.00 ± 5.66 Ab257.50 ± 3.54 Aab254.50 ± 14.85 Aab280.50 ± 23.33 Aa262.50 ± 43.13 Aab
Microbial biomass nitrogen
(mg·kg−1)
0–1012.75 ± 3.18 Aa14.90 ± 1.27 Aa15.65 ± 0.35 Aa13.70 ± 0.42 Aa13.30 ± 1.56 Aa
10–2012.05 ± 0.21 Aa12.25 ± 1.34 Aa13.10 ± 1.56 Aa14.10 ± 1.70 Aa14.85 ± 1.91 Aa
Microbial biomass phosphorus
(mg·kg−1)
0–10120.00 ± 21.21 Ab150.00 ± 5.66 Aab152.00 ± 14.14 Aab161.00 ± 9.90 Aa126.00 ± 11.31 Ab
10–20136.00 ± 25.46 Aa139.00 ± 4.24 Aa144.00 ± 2.83 Aa148.00 ± 16.97 Aa152.00 ± 4.24 Aa
β-1,4-glucosidase
[μmol·(min·g)−1]
0–106.38 ± 0.03 Aa6.24 ± 0.33 Aa6.49 ± 0.32 Aa6.38 ± 0.74 Aa6.28 ± 0.74 Aa
10–205.67 ± 0.02 Bb6.05 ± 0.17 Ab6.18 ± 0.28 Ab6.96 ± 0.02 Aa6.30 ± 0.45 Ab
β-1,4-N-acetylglucosaminidase
[μmol·(min·g)−1]
0–1035.39 ± 0.17 Aa34.41 ± 2.25 Aa36.12 ± 2.25 Aa35.39 ± 5.19 Aa34.66 ± 5.20 Aa
10–2030.37 ± 0.17 Bb33.07 ± 1.21 Ab33.98 ± 1.99 Ab39.43 ± 0.18 Aa34.78 ± 3.12 Ab
Leucine aminopeptidase
[μmol·(min·g)−1]
0–1030.14 ± 0.12 Aa29.47 ± 1.55 Aa30.64 ± 1.54 Aa30.14 ± 3.56 Aa34.63 ± 3.51 Aa
10–2026.70 ± 0.12 Bb28.54 ± 0.83 Ab29.18 ± 1.36 Ab32.91 ± 0.12 Aa29.72 ± 2.14 Ab
Acid phosphatase
[μmol·(min·g)−1]
0–107.51 ± 0.03 Aa7.35 ± 0.35 Aa7.63 ± 0.36 Aa7.51 ± 0.83 Aa7.39 ± 0.83 Aa
10–206.70 ± 0.03 Bb7.14 ± 0.19 Ab7.29 ± 0.32 Ab8.15 ± 0.03 Aa7.41 ± 0.50 Ab
Plot 1, Z. planispinum + P. salicina; plot 2, Z. planispinum + S. tonkinensis; plot 3, Z. planispinum + A. hypogaea; plot 4, Z. planispinum + L. japonica; plot 5, Z. planispinum monoculture plantation. Lower case letters indicate significant differences between different plantation types of the same depth at p < 0.05; upper case letters indicate significant differences between different depths of the same plantation types at p < 0.05. One-way ANOVA was used to calculate the differences, p = 0.05, n = 15. Data are presented as mean ± standard deviation.
Table 4. Load matrix of principal component analysis of soil quality of Z. planispinum plantations with different planting combinations.
Soil ParametersLoad Matrix of Principal Components
PC1PC2PC3PC4PC5PC6
pH−0.5790.6730.0810.194−0.036−0.016
Soil water content−0.178−0.423−0.2580.0730.0310.768
Soil temperature−0.0200.5260.3030.6480.1450.060
Soil organic carbon0.916−0.003−0.0970.2790.1550.042
Total nitrogen0.9240.0670.0390.2670.1200.043
Total phosphorus0.8280.3520.056−0.0350.155−0.279
Total potassium0.0750.5640.3590.415−0.041−0.341
Total calcium−0.2480.8650.015−0.112−0.108−0.013
Total magnesium−0.1080.8740.0960.074−0.073−0.303
Available nitrogen0.939−0.0860.0540.1640.0720.058
Soil available phosphorus0.745−0.2460.062−0.241−0.194−0.146
Available potassium0.616−0.3610.042−0.413−0.482−0.138
Available calcium0.1890.6220.0310.6020.3250.206
Available magnesium0.1690.8500.2240.2220.014−0.005
Fungi concentration0.636−0.2350.177−0.1840.1890.455
Bacterial concentration0.314−0.410−0.0350.0350.7930.120
Actinomycetes concentration0.527−0.2070.071−0.0870.7460.216
Microbial biomass carbon0.0770.3640.505−0.225−0.0440.525
Microbial biomass nitrogen−0.1690.3080.2360.0160.729−0.253
Microbial biomass phosphorus0.140−0.0680.1540.844−0.111−0.119
β-1,4-glucosidase0.0380.0930.9690.1450.059−0.027
β-1,4-N-acetylglucosaminidase0.0370.0920.9690.1440.061−0.028
Leucine aminopeptidase−0.0280.5610.562−0.1680.038−0.140
Acid phosphatase0.0350.0930.9690.1430.059−0.029
Eigenvalue6.9185.8832.6292.4041.5871.266
Variance contribution rate (%)23.10420.89916.1769.8649.4306.721
Cumulative variance contribution rate (%)23.10444.00260.17970.04379.47386.194
Bold font is the relatively large influence factor of each main component load factor.
Table 5. Soil quality evaluation of Z. planispinum plantations with different planting combinations.
Plantation TypeFactor ScoreSoil Quality ParametersRank
F1F2F3F4F5F6
Plot 11.589−3.042−2.419−2.678−0.6250.652−0.9395
Plot 2−1.198−1.746−1.471−0.7030.0011.542−0.8454
Plot 3−1.2350.6300.4300.801−0.260−1.023−0.0983
Plot 42.5871.0462.5782.2372.0950.3861.6781
Plot 5−1.7423.1130.8820.343−1.210−1.5580.2062
Bold font is the factor with the lowest score.
Table 6. Soil stoichiometric characteristics of Z. planispinum plantations with different planting combinations.
Soil ParametersSoil Depth (cm)Plot 1Plot 2Plot 3Plot 4Plot 5
C:N0–1010.15 ± 1.49 Aa11.70 ± 0.89 Aa10.51 ± 1.05 Aa11.69 ± 2.68 Aa9.54 ± 0.29 Aa
10–2011.15 ± 0.09 Aa10.50 ± 0.11 Aa9.69 ± 2.59 Aa10.12 ± 0.91 Aa9.65 ± 0.29 Aa
C:P0–1025.08 ± 8.92 Aab33.45 ± 4.88 Aab25.70 ± 0.57 Aab34.10 ± 5.62 Aa20.50 ± 1.24 Ab
10–2030.97 ± 1.72 Aab40.85 ± 7.13 Aa26.08 ± 3.45 Ab31.78 ± 4.15 Aab21.63 ± 3.67 Ab
N:P0–102.43 ± 0.52 Aa2.88 ± 0.64 Aa2.46 ± 0.30 Aa2.94 ± 0.19 Aa2.15 ± 0.19 Aa
10–202.78 ± 0.18 Ab3.89 ± 0.64 Aa2.74 ± 0.38 Ab3.13 ± 0.13 Aab2.24 ± 0.31 Ab
C:K0–105.08 ± 1.63 Aa5.29 ± 1.91 Aa2.60 ± 1.26 Aa5.15 ± 1.63 Aa2.30 ± 0.22 Aa
10–205.86 ± 0.19 Aa4.73 ± 0.36 Aab2.11 ± 0.92 Ac3.50 ± 1.01 Abc2.60 ± 0.14 Ac
N:K0–100.49 ± 0.09 Aa0.46 ± 0.20 Aa0.24 ± 0.10 Aa0.44 ± 0.04 Aa0.24 ± 0.03 Aa
10–200.53 ± 0.01 Aa0.45 ± 0.04 Aa0.21 ± 0.04 Ac0.34 ± 0.07 Ab0.27 ± 0.01 Abc
P:K0–100.20 ± 0.01 Aa0.16 ± 0.03 Aab0.10 ± 0.05 Ab0.15 ± 0.02 Aab0.11 ± 0.00 Ab
10–200.19 ± 0.02 Aa0.12 ± 0.03 Ab0.08 ± 0.02 Ab0.11 ± 0.02 Ab0.12 ± 0.01 Ab
C:Ca0–1050.38 ± 15.96 Aa25.39 ± 3.95 Aabc16.41 ± 0.58 Abc37.04 ± 14.75 Aab4.59 ± 0.10 Ac
10–2037.62 ± 14.05 Aa16.81 ± 5.60 Ab14.28 ± 1.31 Ab20.12 ± 0.57 Aab4.26 ± 1.07 Ab
Ca:Mg0–100.16 ± 0.02 Ac0.24 ± 0.03 Ab0.23 ± 0.04 Abc0.20 ± 0.00 Abc0.38 ± 0.03 Aa
10–200.22 ± 0.08 Ab0.39 ± 0.10 Aab0.20 ± 0.03 Ab0.25 ± 0.10 Ab0.52 ± 0.16 Aa
MBC:MBN0–1021.61 ± 6.62 Aa16.95 ± 0.88 Aa15.96 ± 1.67 Aa17.87 ± 0.89 Aa19.88 ± 3.07 Aa
10–2018.34 ± 0.14 Aa21.17 ± 2.61 Aa19.63 ± 3.46 Aa19.94 ± 0.75 Aa17.64 ± 0.64 Aa
MBC:MBP0–102.23 ± 0.27 Aa1.69 ± 0.12 Abc1.64 ± 0.01 Ac1.53 ± 0.21 Ac2.09 ± 0.11 Aab
10–201.66 ± 0.35 Aa1.86 ± 0.04 Aa1.77 ± 0.14 Aa1.92 ± 0.37 Aa1.74 ± 0.33 Aa
MBN:MBP0–100.11 ± 0.04 Aa0.10 ± 0.01 Aa0.11 ± 0.01 Aa0.09 ± 0.01 Aa0.11 ± 0.02 Aa
10–200.09 ± 0.01 Aa0.09 ± 0.01 Aa0.09 ± 0.01 Aa0.10 ± 0.02 Aa0.10 ± 0.01 Aa
BG:(NAG + LAP)0–100.10 ± 0.00 Aa0.10 ± 0.00 Aa0.10 ± 0.00 Aa0.10 ± 0.00 Aa0.09 ± 0.01 Aa
10–200.10 ± 0.00 Aa0.10 ± 0.00 Aa0.10 ± 0.00 Aa0.10 ± 0.00 Aa0.10 ± 0.00 Aa
BG:AP0–100.85 ± 0.00 Aa0.85 ± 0.00 Aa0.85 ± 0.00 Aa0.85 ± 0.00 Aa0.85 ± 0.00 Aa
10–200.85 ± 0.00 Aa0.85 ± 0.00 Aa0.85 ± 0.00 Aa0.85 ± 0.00 Aa0.85 ± 0.00 Aa
(NAG + LAP):AP0–108.73 ± 0.01 Aa8.69 ± 0.10 Aa8.75 ± 0.08 Aa8.72 ± 0.20 Aa9.42 ± 0.83 Aa
10–208.52 ± 0.01 Bb8.63 ± 0.06 Ab8.67 ± 0.08 Ab8.88 ± 0.01 Aa8.7 ± 0.13 Aab
Plot 1, Z. planispinum + P. salicina; plot 2, Z. planispinum + S. tonkinensis; plot 3, Z. planispinum + A. hypogaea; plot 4, Z. planispinum + L. japonica; plot 5, Z. planispinum monoculture plantation. C:N, soil C:N ratio; C:P, soil C:P ratio; N:P, soil N:P ratio; C:K, soil C:K ratio; N:K, soil N:K ratio; P:K, soil P:K ratio; C:Ca, soil C:Ca ratio; Ca:Mg, soil Ca:Mg ratio; MBC:MBN, soil microbial biomass carbon to microbial biomass nitrogen ratio; MBC:MBP, soil microbial biomass carbon to microbial biomass phosphorus ratio; MBN:MBP, soil microbial biomass nitrogen to microbial biomass phosphorus ratio; BG:(NAG + LAP), ratio of β-1,4-glucosidase to the sum of β-1,4-n-acetylglucosaminidase and leu-cine aminopeptidase; BG:AP, β-1,4-glucosidase to acid phosphatase ratio; (NAG + LAP):AP, ratio of the sum of β-1,4-n-acetylglucosaminidase and leucine aminopeptidase to acid phosphatase. Lower case letters indicate significant differences between different plantation types of the same depth at p < 0.05; upper case letters indicate significant differences between different depths of the same plantation types at p < 0.05. One-way ANOVA was used to calculate the differences, p = 0.05, n = 15. Data are presented as mean ± standard deviation.
Table 7. Importance ranking and significance test of soil quality index.
Soil ParametersImportance RankingFactor Interpretation (%)pF
Total magnesium127.30.00210.5
Total calcium226.00.0029.8
pH323.90.0028.8
Leucine aminopeptidase423.40.0028.6
Available potassium518.90.0026.5
Total potassium618.90.0026.5
Soil organic carbon715.20.0025.0
Fungi concentration815.10.0025.0
Bacterial concentration914.70.0024.8
Available magnesium1014.10.0024.6
Available nitrogen1114.10.0064.6
Microbial biomass phosphorus1213.20.0024.2
Soil water content1313.10.0044.2
Soil available phosphorus1413.00.0084.2
Actinomycetes concentration1512.60.0064.0
Microbial biomass nitrogen1611.80.0063.7
Acid phosphatase1710.50.0103.3
β-1,4-glucosidase1810.50.0123.3
β-1,4-N-acetylglucosaminidase1910.50.0123.3
Total nitrogen2010.10.0063.2
Soil temperature2110.10.0103.2
Microbial biomass carbon229.20.0302.8
Total phosphorus236.20.0861.9
Soil quality index246.20.0881.9
Available calcium256.00.1141.8
Publisher’s Note: MDPI stays neutral with regard to jurisdictional claims in published maps and institutional affiliations.

