1. Introduction
Iron is an essential element for the human body and its main function is related to the synthesis of hemoglobin and myoglobin, proteins that are responsible for blood oxygenation. It is essential in metabolic processes such as the synthesis of deoxyribonucleic acid and heme enzymes involved in electron transport in redox reactions [
1,
2].
Most people depend on plants as their primary source of Fe [
3] and a low intake of Fe and its low bioavailability in food lead to deficiency in organisms [
4]. It is estimated that more than two billion people in the world are anemic [
5] and about 50% of these cases are due to Fe deficiency. Anemia affects the cognitive development of children and can reduce physical performance in adults and cause problems during pregnancy [
6]. Other symptoms of this disease include pallor, fatigue, headaches and alopecia. In addition, it can cause changes in thyroid metabolism, increased irritability, muscle weakness and susceptibility to infections [
7].
Fe deficiency affects several classes of the population, but is more common in low-income ones due to insufficient intake and low bioavailability of the nutrient in food. This is the result of cereal-dominated diets that have a high calorie content and low micronutrient content [
4]. The recommended daily intake of Fe for men and women ranges from 8 to 18 mg day
−1; this amount is age-dependent. For pregnant women, this value increases to 27 mg day
−1 [
8].
However, with a limited diet in relation to the amount of food available and foods with low nutrient contents, populations cannot meet their daily needs. Techniques that increase the levels of nutrients in vegetables are promising strategies to help in the solution of hidden hunger [
9]. Thus, among the ways of increasing micronutrient content in vegetables, agronomic biofortification is an alternative, as it has been effective in increasing nutrient contents in the edible parts of plants [
10]—making it an excellent strategy to help combat malnutrition in the world population. Research on agronomic biofortification with Fe has been carried out with several crops [
11,
12,
13]. In lettuce crops, the use of Fe at a concentration of 1.0 mM (55.8 mg L
−1) increases the content of this nutrient in leaves by 21% when compared to plants receiving a control treatment (0.015 mM or 0.84 mg L
−1) [
14]. Gioia et al. [
15] reported that small amounts of arugula, red cabbage and red mustard microgreens biofortified with 20 mg L
−1 Fe could help meet the daily need for Fe intake of an adult.
Developing foods with higher nutrient contents is a challenge, as the ranges for levels beneficial to plant growth and the biofortification of products and for toxicity are usually narrow [
16], and excessive amounts of Fe can lead to phytotoxicity and growth inhibition [
14]. In this sense, hydroponic cultivation of leafy vegetables has gained prominence due to its advantages, such as allowing the management of a plant’s nutritional status during its growth through the effective control of water and nutrient supplies [
14], with larger yields and better quality of vegetables [
17,
18]. According to Giordano et al. [
14], nothing is known about Fe biofortification under closed soil-less cultivation (i.e., the nutrient film technique, NFT) where the constant exposure of the root system to an Fe-fortified nutrient solution could maximize Fe uptake, translocation and accumulation in edible parts. Therefore, collard greens (
Brassica oleracea var.
acephala), belonging to the Brassicaceae family, were chosen for this study on agronomic biofortification. This crop has gained prominence in the vegetable market due to its nutritional properties and can be consumed raw in salads or in soups, stews and juices [
19].
In view of the above, the present study aimed to evaluate the effect of Fe concentrations on the production, nutrition, biofortification and quality of collard greens grown in hydroponics.
2. Materials and Methods
2.1. Experimental Area Characterization and Location
The experiment was carried out from 31 March to 9 July 2021 in a nutrient film technique (NFT) hydroponic system inside a greenhouse at the São Paulo State University, Jaboticabal campus, Brazil, located at 21°15′22″ S, 48°18′58″ W and an altitude of 575 m above sea level.
The region’s climate is classified as subtropical, with rainy summers and relatively dry winters, with an annual average rainfall of 1423.9 mm and an average temperature of 22.3 °C. Minimum, maximum and average temperatures and the relative air humidity for the experimental period are presented in
Figure 1.
2.2. Experiment Installation and Conduction
‘HS-20’ collard greens (Horticeres Seeds®) were sown on 31 March 2021 in phenolic foam sheets with 5 × 5 × 3.8 cm cells, which were previously washed under running water for approximately 10 min. During the germination period, these sheets were kept in a greenhouse and were irrigated with a sprinkler system. This period was called phase 1. At 10 days after sowing (DAS), when the seedlings showed expanded cotyledons, the phenolic foam sheets were individualized and the cells with the seedlings were transferred to a structure called a nursery in an NFT system, which had polypropylene channels at 5 cm width and 5% slope. Nutrient solution supply in this phase was intermittent, alternating between 15 min with circulation and 15 min without circulation. This period was called phase 2 and corresponded to the initial growth of the seedlings until they were taken to the definitive channels. When the plants had two fully expanded leaves, 22 DAS, they were transferred to the definitive channels (Phase 3). The spacing used was 0.50 m between plants in the channel and 1.10 m between channels. The channels (0.15 m diameter and 2 m length) were constructed with PVC tubes cut lengthwise and covered with Tetra Pak®. Each channel had a 100 L reservoir and a Chosen® Power Head CX 300 pump with a flow rate of 1000 L h−1 for pumping the nutrient solution through hoses to the channels. Pump actuation was controlled by a timer, with continuous circulation of the nutrient solution from 7 to 18 h. The treatments were applied at 45 DAS.
The water used in the hydroponic cultivation in phases 1, 2 and 3 was subjected to quality analysis, and the following concentrations were found, in mg L
−1: 0.07 of N-nitrate, 2.0 of K, 15.95 of Ca and 0.45 of Mg. The other nutrients were not detected in the water, because the concentrations were below the detection limits, which were lower than 1.0, 0.003, 0.005, 0.003 and 0.02 mg L
−1 for S, Cu, Fe, Mn and Zn, respectively. The nutrient solution used was the one recommended by Furlani et al. [
20] for leafy vegetables, which has the following concentrations of nutrients, in mg L
−1: 24 of N-NH
4+; 174 of N-NO
3−; 39 of P; 183 of K; 142 of Ca; 38 of Mg; 52 of S; 0.3 of B; 0.02 of Cu; 2.0 of Fe; 0.40 of Mn; 0.06 of Mo and 0.06 of Zn.
The pH and electrical conductivity (EC) were monitored using a pH meter and conductivity meter, respectively. The initial EC of the solutions was 2.2 dS m−1. The pH was maintained between 5.5 and 6.8, using sodium hydroxide or phosphoric acid to increase or reduce its value, respectively. Water was replaced daily to restore the initial reservoir volume (100 L). The nutrient solutions were renewed whenever they reached an EC lower than 50% of the initial EC.
2.3. Treatments and Experimental Design
Five Fe concentrations in the nutrient solution (2, 4, 6, 8 and 10 mg L
−1) were evaluated in a completely randomized experimental design, with four replications. No nutrient solution has been found for collard greens, so the nutrient solution recommended by Furlani et al. [
20] for growing leafy vegetables—which has a 2 mg L
−1 iron concentration (control treatment)—was used. Ferrilene
® (6% Fe-EDDHA) was used to supply the iron. The experimental unit corresponded to five plants in a cultivation channel, and the three central plants were used for data collection (usable area).
At 45 DAS or 23 days after the beginning of phase 3 of cultivation, the leaves were harvested, leaving only five leaves per plant. The Fe concentration in the nutrient solution, which until then was 2 mg L
−1—as recommended by Furlani et al. [
20]—was replaced with the Fe concentrations established in the treatments.
2.4. Evaluated Characteristics
At 45 DAS, before applying the treatments, the collard greens leaves were harvested and the following parameters were evaluated: (a) Fresh mass of leaves immediately after the harvests, which were carried out until 7:30 am—the leaves were weighed and the results were expressed in g plant
−1; (b) Dry mass of leaves—leaves were dried in a forced air circulation oven at 65 °C until they reached a constant mass and were then weighed, with the results expressed in g plant
−1; (c) Leaf Fe content (mg kg
−1)—leaves were washed in running water, water plus detergent, and then in deionized water, dried in the oven and then milled. The procedures to analyze the leaf Fe content were performed according to the methodology proposed by Miyazawa et al. [
21].
Leaves that reached 25 cm in length began to be harvested at 52 DAS. In addition to the fresh mass and dry mass of leaves, as previously described, the following parameters were evaluated: (a) Contents of macronutrients (g kg
−1) and micronutrients (mg kg
−1)—a leaf of intermediate position among those on the plant was harvested and subjected to the same procedures to evaluate leaf Fe content; (b) Contents of the pigments chlorophyll
a,
b,
a +
b and carotenoids (μg g
−1)—leaf discs of 0.025 to 0.030 g were collected from intermediate leaves and transferred to an Eppendorf
® flask containing 1.5 mL of 80% acetone, protected from light; after 48 h, spectrophotometer readings were performed at 663 nm (Chlorophyll
a), 647 nm (Chlorophyll
b) and 470 nm (Carotenoids), according to the methodology proposed by Lichenthaler [
22]; (c) Ascorbic acid (mg 100 g
−1)—1 g of collard green leaves were mixed with 10 mL of cold 0.5% oxalic acid solution, and this mixture was filtered; in triplicate, 1 mL of the filtered extract and 4 mL of 0.5% oxalic acid were transferred to an Erlenmeyer
® flask, mixed, and titrated with 2,6-dichlorophenol indophenol (DCPIP; 0.02%) up to the turning point, as described by Strohecker et al. [
23].
For the fresh and dry mass of leaves, the quantities corresponded to the sum of the harvests carried out for 14 days; the accumulated quantities were expressed as harvests at 14, 28, 42 and 56 days after application of the treatments (DAT). Contents of macronutrients, micronutrients, pigments and ascorbic acid were evaluated at 14, 28, 42 and 56 DAT using the largest leaf at the time.
The quality of collard green leaves was estimated for the four harvests based on the leaves’ contents of nutrients, pigments and ascorbic acid as a function of Fe concentration in the nutrient solution. Given the objective of the study of obtaining collard greens biofortified with Fe, this nutrient received a higher score for the intervals proposed in the evaluation of collard green leaf quality. When there were increments of 10 to 20%, 20.01 to 30%, 30.01 to 40% and more than 40.01% in leaf Fe content, compared to Fe content in the control treatment (2 mg L−1), +5, +10, +15 and +20 points were assigned to leaf quality, respectively. For other nutrients, pigments and ascorbic acid, the increases or decreases for the same intervals received +1, +2, +3 and +4 or −1, −2, −3 and −4 points, respectively. A zero value was assigned to increases or decreases lower than 10%. Leaf quality in each treatment and time evaluated was determined by summing the scores of the components. The Fe concentration which promoted the best leaf quality was determined by calculating the average of the scores of each treatment (Fe concentration) obtained at the four times.
2.5. Statistical Analysis
Analysis of variance and polynomial regression analysis were performed using the AgroEstat program [
24]. Significant equations with the highest coefficients of determination were selected.
3. Results
The fresh mass of leaves (FML) and dry mass of leaves (DML) of collard greens obtained in the harvests at 14, 28, 42 and 56 DAT were not influenced by the increase in Fe concentration in the nutrient solution. On the other hand, the leaf contents of macronutrients were influenced by the Fe concentration in the nutrient solution (
Figure 2).
N and P contents were not influenced at 14 and 28 DAT. At 56 DAT, these nutrients were influenced by Fe concentration in the nutrient solution, with maximum contents of 50.9 and 7.1 g kg
−1 with 7.7 and 10 mg L
−1 of Fe, respectively (
Figure 2). Regarding K, it was influenced only at 14 DAT, with a maximum content of 30.0 g kg
−1 obtained with 5.5 mg L
−1 of Fe (
Figure 2). Ca, Mg and S were the macronutrients most affected by the treatments and, in general, their leaf contents decreased with increases in Fe in the nutrient solution—with maximum values observed with 2 mg L
−1 of Fe (
Figure 2).
As for micronutrients, there was an increase in the leaf contents of Fe as a function of the increase in its concentration in the nutrient solution in all evaluations. The maximum contents—152.6, 153, 153.5 and 150.5 mg kg
−1 of Fe—were obtained with concentrations of 7.0, 10.0, 6.7 and 10.0 mg L
−1 of Fe at 14, 28, 42 and 56 DAT, respectively (
Figure 3). On the other hand, leaf contents of Cu, Mn and Zn decreased with increasing Fe concentrations in the nutrient solution. The lowest leaf contents of Cu (6.0 mg kg
−1), Mn (57.5 mg kg
−1) and Zn (195.2 mg kg
−1) were obtained with 7.9, 10 and 10 mg L
−1 of Fe at 56 DAT, respectively (
Figure 3).
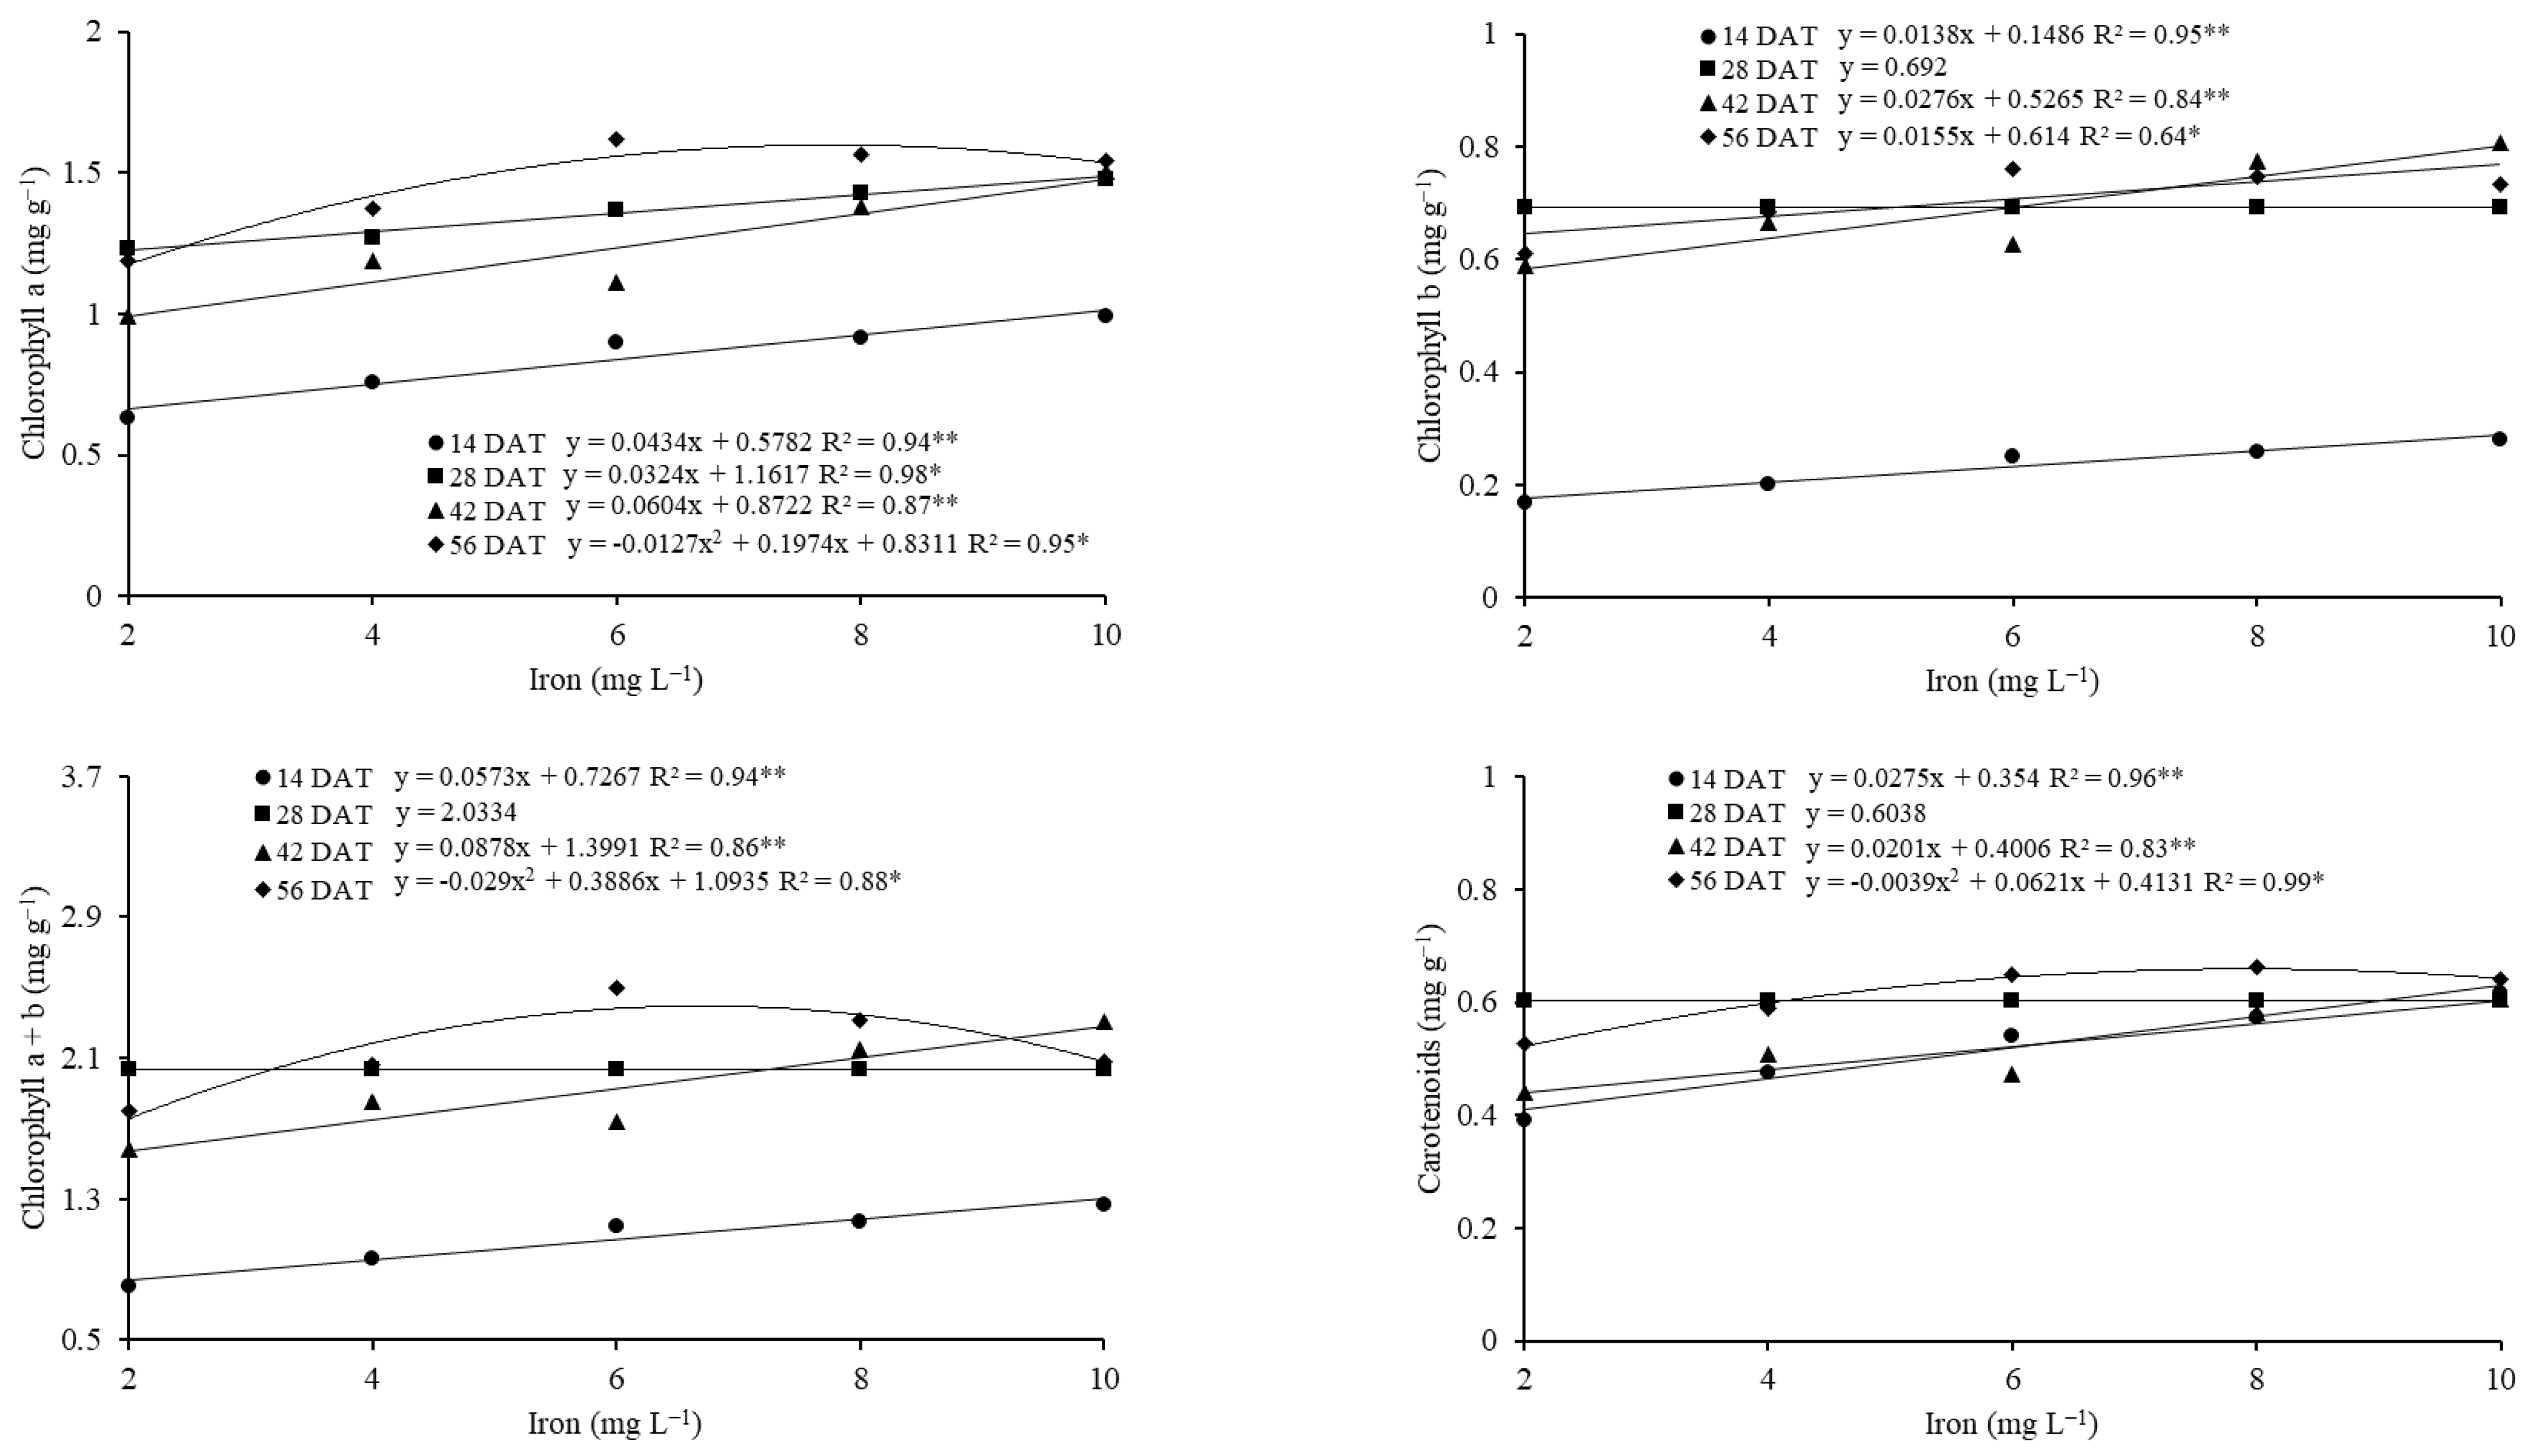
The chlorophyll
a,
b and carotenoid contents were also influenced by Fe concentrations in nutrient solution. For chlorophyll
a, linear increases were observed in the harvests performed at 14, 28 and 42 DAT. At 56 DAT; there was a quadratic fit of the equation and the maximum estimated content was 1.60 μg g
−1 at the Fe concentration of 7.8 mg L
−1 (
Figure 4). For chlorophyll
b, linear increases were observed at 14, 42 and 56 DAT, whereas at 28 DAT there was no effect of the treatments (
Figure 4). Total chlorophyll (chlorophyll a + b) showed an increasing linear fit at 14 and 42 DAT, while at 56 DAT there was a quadratic fit with a maximum value of 2.4 μg g
−1 at the Fe concentration of 6.7 mg L
−1 (
Figure 4). For carotenoids, there was a positive linear response at 14 and 42 DAT and a quadratic fit of the equation at 56 DAT, with a maximum value of 0.66 μg g
−1 at the Fe concentration of 8.0 mg L
−1 (
Figure 4).
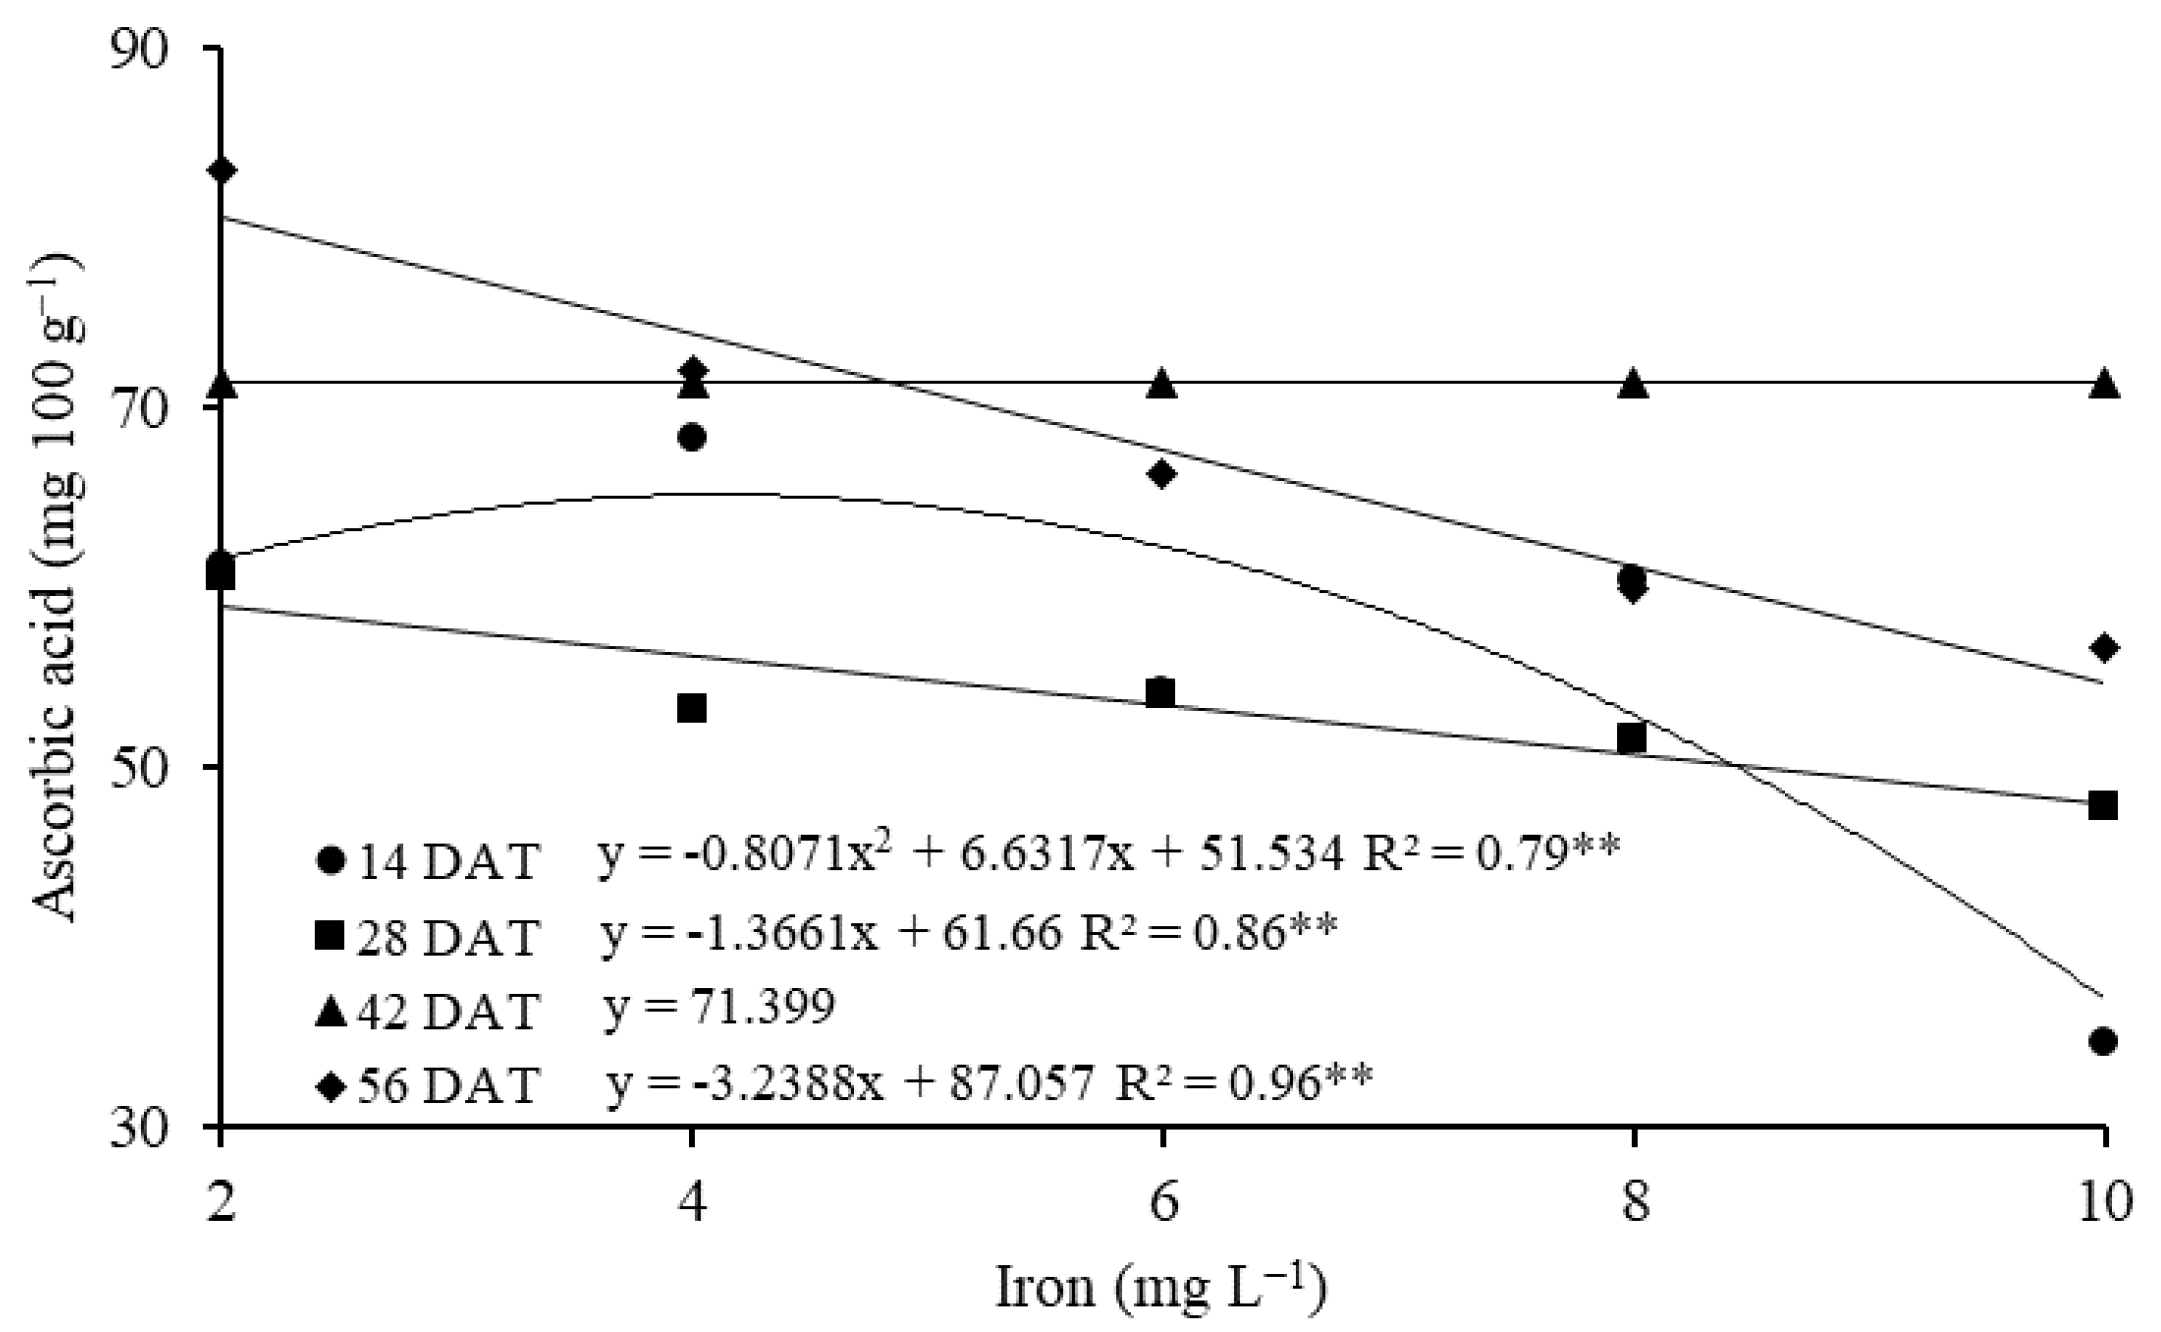
The ascorbic acid (AA) content was also influenced by increasing concentrations of Fe. A quadratic fit was observed at 14 DAT, with the highest value of 65.16 mg 100 g
−1 of AA at the Fe concentration of 4.1 mg L
−1. At 28 and 56 DAT, the equation fits were decreasing linearly, with the highest values of 60.63 and 83.15 mg 100 g
−1 of AA at the Fe concentration of 2 mg L
−1 (
Figure 5).
Regarding leaf quality, according to the average of the four harvests, the nutrient solution with a Fe concentration of 8 mg L
−1 promoted a better average score (11.5;
Table 1).
4. Discussion
Increases in Fe concentration in the nutrient solution promoted increments of 22.6, 37.0, 40.7 and 49.8% in leaf Fe contents at 14, 28, 42 and 56 DAT, respectively, compared to the contents observed in plants cultivated with 2 mg L
−1 Fe (
Figure 3). The leaf Fe contents—even at the highest Fe concentrations in the nutrient solution—were within the range of 60 to 300 mg kg
−1 considered suitable for collard greens, according to Trani et al. [
25]. The absence of leaf contents above the appropriate range can be attributed to the rapid accumulation of biomass (leaf growth) and to the weekly harvest of leaves, which reached 25 cm in length, not allowing the continued accumulation of Fe in older leaves. Therefore, even at a concentration five times higher than 2 mg L
−1—recommended by Furlani et al. [
20] for leafy vegetables—which was used as a control in this experiment, the highest leaf content of Fe in the dry mass of collard greens (159.5 mg kg
−1) did not exceed the adequate range (
Figure 3).
Despite being negatively or positively influenced by the increase in Fe concentration in the nutrient solution (
Figure 2 and
Figure 3), the contents of K (26.8–32.2 g kg
−1), Mg (3.4–5.5 g kg
−1), S (7.1–10.6 g kg
−1), Cu (6.8–17.7 mg kg
−1), Fe (150.5–153.5 mg kg
−1) and Mn (57.5–197.1 mg kg
−1) were within the respective ranges considered suitable for collard greens, according to Trani et al. [
25]. The content of N (47.5–58.4 g kg
−1), P (5.8–7.1 g kg
−1), Ca (26.8–29.9 g kg
−1) and Zn (126.7–255.8 mg kg
−1) were above the appropriate limits of 55, 7, 25 and 150 g kg
−1, respectively. Since no symptoms of toxicity were observed, these contents can be considered as luxury consumption, with no damage to metabolism and yield.
In view of the increments observed in Fe content at all the evaluated times, there was biofortification of collard greens with Fe (
Figure 3 and
Table 1). However, considering the entire harvest period, the highest mean with the lowest standard deviation of the scores obtained was 13.8 ± 3.8 mg kg
−1, which corresponded to the nutrient solution with 8 mg L
−1 Fe. Considering the average content of dry mass for the collard green leaves (9.0%) and the average Fe content of the biofortified leaves (147.3 mg kg
−1) in this solution containing 8 mg L
−1 of Fe, and of the leaf in standard solution (111.4 mg kg
−1), there are 13.3 and 10.0 mg of Fe per kilogram of fresh leaves, respectively. The amount of Fe required by the human body daily ranges between 7 and 27 mg [
26]. Thus, for boys (14–18 years old), the amount of collard greens to be ingested to meet 50% of the daily demand would be 413 and 550 g of biofortified and non-biofortified collard greens, respectively. For girls of the same age, 36% more would be need. For a pregnant woman, who has the greatest need for Fe of any human, the amount would be 1015 and 1350 g of biofortified and non-biofortified collard greens, respectively. Considering the use of dehydrated collard greens in the preparation of enriched food for malnourished children (1–3 years old), to meet 100% of daily demand, only 47.5 g would be needed.
Regarding the nutritional quality of collard green leaves, it was influenced by increases in Fe concentration in the nutrient solution. Among the nutrients considered most relevant in this study for leaf quality, S was the one that had its absorption least impacted by increases in Fe in the nutrient solution (
Figure 2). Collard greens, like other species of the Brassicaceae family, are characterized by being rich in S, which is functionally important for the biosynthesis of amino acids in plants [
27] and of compounds for human health, such as glucosinolate [
28]. Thus, the reduction in S content must be considered a loss in quality—even if such compounds have not been quantified.
The loss of quality due to the reduction in S is in addition to the reductions in the contents of Cu, Mn, Zn (
Figure 3,
Table 1). Competitive relationships of Fe with Zn and Mn have also been reported by Becker and Asch [
29] and Tewari et al. [
30]. In this last-mentioned study, the authors report that Zn transporters have affinity for Fe due to their similarities in ionic radii, showing the competition in absorption when Fe concentrations were increased. Ghasemi-Fasaei and Ronaghi [
31] observed in wheat a 21% reduction in Mn absorption when 8 mg kg
−1 of Fe was added to the soil in the form of Fe-EDDHA. Adiloğlu [
32] evaluated five concentrations of Fe-EDDHA on basil and observed a reduction in these micronutrients from concentrations of 50 mg kg
−1, with an antagonistic effect on Fe.
Photosynthetic pigments also influenced the quality of collard green leaves (
Table 1). Higher concentrations of Fe caused an increase in chlorophyll and carotenoid content (
Figure 4). This occurred due to the participation of Fe in chlorophyll synthesis [
33] and because chloroplasts represent the main Fe reservoir in plants [
34]. These results confirm that the increases observed in Fe content in the collard green leaves were within the appropriate range; at high concentrations, it would negatively affect chlorophyll synthesis and photosynthesis light reactions [
35,
36], in addition to favoring increases in reactive oxygen species, leading to decreases in pigments [
37].
Ascorbic acid content is also an important criterion for the quality of plant foods, especially those biofortified with Fe, as it is considered a component that facilitates Fe absorption in food [
38]. However, there was a decrease in AA with the increase in Fe concentrations in the solution (
Figure 5)—negatively affecting leaf quality (
Table 1). According to Lee and Kader [
39], several factors can influence the variation in vitamin C content in fruits and vegetables, such as the cultivar, climatic conditions and form of cultivation. Ascorbic acid is an antioxidant that can be used to reduce the deleterious effects caused by oxidative stress [
40]. As it is believed that the plants were not under stressful conditions, even when considering the Fe contents, there was no increase in AA in the collard greens leaves—probably favoring other metabolic processes of the plant such as rapid leaf growth, which enabled weekly harvests.
Thus, despite the reductions in the contents of some nutrients and ascorbic acid, collard greens proved to be an interesting species for agronomic biofortification with Fe in hydroponics, since there were increments in the leaf contents of this micronutrient and pigments without reaching toxic levels and causing a loss of yield. The best quality was observed when the collard greens were grown in a nutrient solution with Fe concentrations of 8 mg L
−1 (
Table 1).

 ,
, 


