Article

Microbial Consortium Inoculum with Rock Minerals Increased Wheat Grain Yield, Nitrogen-Use Efficiency, and Protein Yield Due to Larger Root Growth and Architecture

1
UWA School of Agriculture and Environment, and The UWA Institute of Agriculture, The University of Western Australia, Perth, WA 6009, Australia
2
Agriculture Production Division, Department of Agriculture, Ministry of Agriculture and Forests, Thimphu 11001, Bhutan
3
Troforte Innovations Pty Ltd., Wangara, WA 6065, Australia
*
Author to whom correspondence should be addressed.
Agronomy 2022, 12(10), 2481; https://doi.org/10.3390/agronomy12102481
Submission received: 30 August 2022 / Revised: 9 October 2022 / Accepted: 10 October 2022 / Published: 12 October 2022
(This article belongs to the Special Issue Use of Bio-Fertilizers to Improve Crop Quality and Yield)

Abstract

:
Polymer-coated rock mineral fertiliser (RMF) has the potential to increase wheat growth and yield; however, its effect on grain protein concentration (GPC) and nitrogen-use efficiency (NUE) remains unclear. Therefore, we examined the efficacy of slow-release RMF combined with microbial consortium inoculant (MI) compared with inorganic fertiliser (IF) with or without the MI to explore their effects on wheat growth, NUE, GPC, grain protein yield and grain yield. The glasshouse experiment was conducted with three factors (fertiliser type (control, RMF and IF), fertiliser rate (0, 23 and 46 mg N kg−1 soil), and MI (with or without)) replicated four times and harvested twice (anthesis and maturity). The treatments were arranged in a randomised complete block design. NUE was higher in plants treated with RMF plus MI compared to IF (with or without MI), likely due to extensive root system, higher shoot N content (at anthesis and maturity) and grain N content in plants treated with RMF plus MI than IF. The application of RMF enhanced grain yield and GPC compared with IF. The grain yield increased due to more grains in RMF-treated than IF-treated plants. The RMF application increased N content in shoots at anthesis and maturity and grain N content, which increased GPC compared to IF-treated plants. RMF in combination with MI can be viewed as a practical approach to assist RMF in supplying nutrients to improve NUE, grain yield and GPC in wheat.

1. Introduction

Wheat (Triticum aestivum L.) production worldwide can be improved by increasing grain yield and improving grain quality, particularly its protein content [1], as it provides 20% of the calories and protein in the human diet globally [2]. Nitrogen (N) is the utmost input for increasing grain yield and grain protein concentration (GPC) in wheat [3]. Inorganic fertiliser use in agriculture globally was about 190 million tonnes of nutrients in 2019, of which 57% was N [4]. However, the N-use efficiency (NUE) in cropping systems is only around 47% of N applied [5]. The excessive and inefficient N fertiliser use is a global problem underpinned by high production costs and increased environmental pollution [6,7]. Therefore, it is widely known that the improvement of NUE is crucial [5,8], and optimisation of N fertiliser use has received significant attention in recent agricultural research [9]. The NUE is an essential parameter in evaluating wheat production and is vastly affected by fertiliser management practices [7]. NUE is commonly defined as the grain yield produced per unit of N available to the plant from soil and fertiliser (NUE; kg grain produced per kg N available emphasising grain production) [10] or N recovered in grain relative to N available (NUpEgrain; kg grain N kg−1 N available emphasising grain quality) [11].
NUE can be boosted by applying slow-release fertilisers [12,13] and can gain similar or higher yield with comparatively lower quantities than conventional fertilisers [12,14] due to the balancing act of nutrient retaining and nutrient dissolution [15]. In general, slow-release fertiliser is likely to increase fertiliser-use efficiency due to controlled release rate of nutrient in soil [16] and decrease the frequency of field applications by reducing N leaching and gaseous loss of N via denitrification, especially in sandy soil [17]. Therefore, there has been substantial awareness of using slow-release fertiliser to reduce nutrient loss and increase economic benefits [18]. The rock mineral fertiliser (RMF) is a slow-release fertiliser containing macro- and micronutrients and was as active as synthetic fertiliser in improving wheat grain yield and, the polymer-coated form had performed better in terms of soil nutrient availability [19]. Likewise, the RMF increased shoot growth and grain yield of wheat as conventional soluble fertiliser at equal rates of N and P [20]. It was also noted that RMF increased shoot biomass, root biomass and nutrient uptake in pasture grasses [21,22].
An alternate approach to rise fertiliser-use efficiency is the use of plant biostimulants for example, microbial consortium inoculants (MIs) [20,22,23]. MIs are essential for sustainable agriculture [24] and are increasingly utilised [25,26,27]. The MI ensured a positive effect in improving shoot growth and grain yield of wheat [20] and growth of pasture in low phosphorus soil through enhancing length and surface area of root [28].
Wheat grain yield, GPC and NUE need to increase to sustain a growing population without significant increases in fertiliser N usage [8]. The polymer-coated RMF, with or without MI, increased wheat grain yield [19]; however, its effect on GPC and NUE needs to be clarified. Therefore, this study was conducted of investigating the efficacies of RMF and inorganic fertiliser with and without MI on growth, NUE, grain yield and GPC of wheat grown in nutrient-poor soil. We hypothesised that slow-release polymer-coated RMF applied with MI would be more effective in increasing wheat growth, grain yield, NUE and GPC than inorganic fertiliser with or without MI.

2. Materials and Methods

2.1. Soil Properties

Sandy soil, named Karrakatta sand which was classified as Dystric Xeropsamments [29], was collected (0–10 cm depth) from the The University of Western Australia’s Field Station at Shenton Park (31°56′54″ S, 115°47′49″ E). The collected soil was air-dried and sieved to ≤2 mm. The soil had the following basic properties measured rendering to the methods described by Rayment et al. [30]: 5.3 pH (CaCl2), 3.3 mg nitrate N kg−1, 2.7 mg ammonium N kg−1, 6.7 mg P kg−1 soil, 27.3 mg K kg−1, and 3.7 mg S kg−1 soil.

2.2. Experimental Design and Treatments

A microbial consortium inoculant (MI) and two fertilisers, a rock mineral fertiliser (RMF) and inorganic fertiliser (IF) were applied to the soil before sowing wheat seeds. The MI (branded as Troforte Microbes blend “Cropping”) was a talc-based formulation encompassing Agrobacterium, Azotobacter, Azospirillum, Bacillus, Pseudomonas, Streptomyces, Trichoderma and Rhizophagus irregularis spores. The RMF (branded as Troforte NPK Cropping Plus) had a proprietary combination of ground minerals, such as micas, feldspars, soft rock phosphate, dolomite, basalt, granite and crystalline silica blended with various sulphates (ammonium, potassium, manganese, copper and zinc) containing nutrients (in %, w/w): N 10.0, P 7.0, K 4.5, S 4.6, Mg 0.07, Fe 2.7, Si 6.4, Ca 4.0, Mn 0.43, Zn 0.04, Cu 0.034, Co 0.004, Ni 0.002, B 0.001 and Mo 0.0001 [31]. The MI and RMF were provided by Troforte Innovations Pty Ltd., Wangara, WA 6065, Australia.
The modern cultivar wheat named Scepter was grown in 10 treatments which included: (i) control (no amendments), (ii) MI applied at 1 g pot−1, (iii) IF applied at 23 mg N kg−1 soil, (iv) MI and IF at 23 mg N kg−1 soil, (v) RMF applied at 23 mg N kg−1 soil, (vi) MI and RMF at 23 mg N kg−1 soil, (vii) IF applied at 46 mg N kg−1 soil, (viii) MI and IF at 46 mg N kg−1 soil, (ix) RMF applied at 46 mg N kg−1 soil and (x) MI and RMF at 46 mg N kg−1 soil. In addition, the amounts of P, K, S, Ca, Mg, Fe and Zn equivalent to those in RMF (using lab-grade chemical compounds) were applied to the IF treatments. The modern wheat cultivar named Scepter popularly grown in Western Australia, is an Australian hard short mid maturity variety with high yield and grain protein concentration [31].
Treatments were organized in a randomised complete block design with three factors; fertiliser type (control, RMF and IF), fertiliser rate (0, 23 and 46 mg N kg−1 soil) and MI (with or without MI) along with four replications. The pots in a glasshouse were re-randomised once a week during the plant growth and development to minimise the impact of environmental gradients.

2.3. Plant Growth Conditions and Harvest

Plants were grown in pots of 165 mm inner diameter and 170 mm deep lined with a polyethylene bag holding 4 kg of sieved air-dry soil. The treatments were applied separately via homogeneously mingling with soil in pot before sowing seeds, as described elsewhere [19,31]. Uniform-size seeds were sown 2 cm depth and thinned to three plants per pot at the Zadoks 11 stage [32]. The plants were maintained in a glasshouse under ambient light conditions with a photoperiod of 16/8 h and a temperature of 22/17 °C (day/night). Plants were watered with deionised water every second day by weighing to maintain 70% field capacity. There were two harvests anthesis stage (Zadoks 65) and the grain maturity stage (Zadoks 92). Shoots were sampled by the cut at the soil surface in each harvest. Shoots and grains were oven-dried at 65 °C in a forced-air oven for 72 h, weighed and recorded.

2.4. Plant Growth and Yield

The length of the third leaf on the main stem was measured daily using a ruler (starting from the day the third leaf emerged from the sheath). The leaf extension rate (LER, mm day−1) was calculated as the slope of linear increase in leaf length [33,34]. Leaf chlorophyll content was measured by using a Minolta® SPAD (chlorophyll metre SPAD-502, Konica Minolta, Tokyo, Japan) at the anthesis stage (Zadoks 65). The SPAD measurements were performed at three points (tip, middle and near the base of each leaf) on 10 fully emerged leaves per pot [35].
The yield contributing parameters assessed were grain number, 1000-grain weight, grain yield and harvest index. The harvest index was calculated as per the grain yield divided by the sum of grain yield and straw yield [36].

2.5. Root Sampling and Assessment

Roots were cleaned under running tap water at each harvest to get rid of organic matter and soil particles. For the first harvest, the roots were cut, spread in water and sub-sampled [37] to determine root morphology. Then, the leftover roots were oven-dried at 65 °C for 72 h and weighed. For the second harvest, all roots were oven-dried at 65 °C for 72 h and weighed for total biomass.
Roots samples for morphology assessment were preserved in 70% (v/v) ethanol [38]. The roots were floated in water in a transparent tray and scanned in greyscale at 400 dpi per mm via an EPSON Perfection V700 root scanner, Long Beach, CA, USA. The scanned root images were evaluated with WinRHIZO software (v2009, Regent Instrument, Quebec, QC G1V 1V4, Canada) [39]. Specific root length was calculated as per the root length per unit root dry mass. The roots were considered as fine roots (diameter ≤ 0.2 mm) and coarse roots (>0.2 mm) [28]. After scanning, roots were dried in an oven at 65 °C for 72 h, weighed, and the data were summed up with dry biomass of the remaining roots.

2.6. Nitrogen Concentration, N-Use Efficiency and Grain Protein Concentration

The oven-dried shoots and grains were milled to powder, dried at 70 °C and analysed for N concentration with an Elemental Analyser (VARIO MACRO CN; Elementar, Analysensysteme GmbH, Hanau, Germany) by dry combustion and thermal conductivity [30]. Shoot and grain N contents were calculated as per the product of dry mass and corresponding N concentration [40].
For the first harvest (Zadoks 65), N uptake efficiency of shoot (NUpEshoot) was calculated using Equation (1). At maturity stage (Zadoks 92), N-use efficiency (NUE) and N uptake efficiency of grain (NUpEgrain) were calculated using Equations (2) and (3) [10].
NUpEshoot   = Shoot   N   content   ( x )   Shoot   N   content   ( control ) Total   N   available   ( x )
NUE   = Grain   yield   ( x )   Grain   yield   ( control ) Total   N   available   ( x )
NUpEgrain   = Grain   N   content   ( x )   Grain   N   content   ( control ) Total   N   available   ( x )
where x stands for the treatment for which the NUE was calculated. The control in the equations refers to the treatment with 0 mg N fertiliser without MI. The total available N for the specific treatment was calculated by summing up soil mineral-N (NH4+-N and NO3-N) measured in control, and the amount of N applied as fertiliser to the specific treatments.
Grain protein concentration was calculated as per N concentration in grain multiplied by the conversion factor of 5.7 [31], and protein yield as per grain yield multiplied by protein concentration [41].

2.7. Statistical Analysis

The data were confirmed for normality via the Shapiro–Wilk test and were log-transformed when obligatory to achieve the homogeneity of variances. Three-way analysis of variance (ANOVA) was performed using Genstat 19th edition software (VSN International Ltd., Rothamsted, UK) to test the effect of fertiliser rate, fertiliser type, microbial inoculant and their interactions on all recorded variables. Means were presented with standard errors, separated by Tukey’s honest significance difference (HSD) test at p < 0.05 as per the threshold value for significance. Pearson’s correlation analysis was performed, and graphs were produced via the R statistical software (R version 4.1.2, http://www.r-project.org, accessed on 30 April 2022).

3. Results

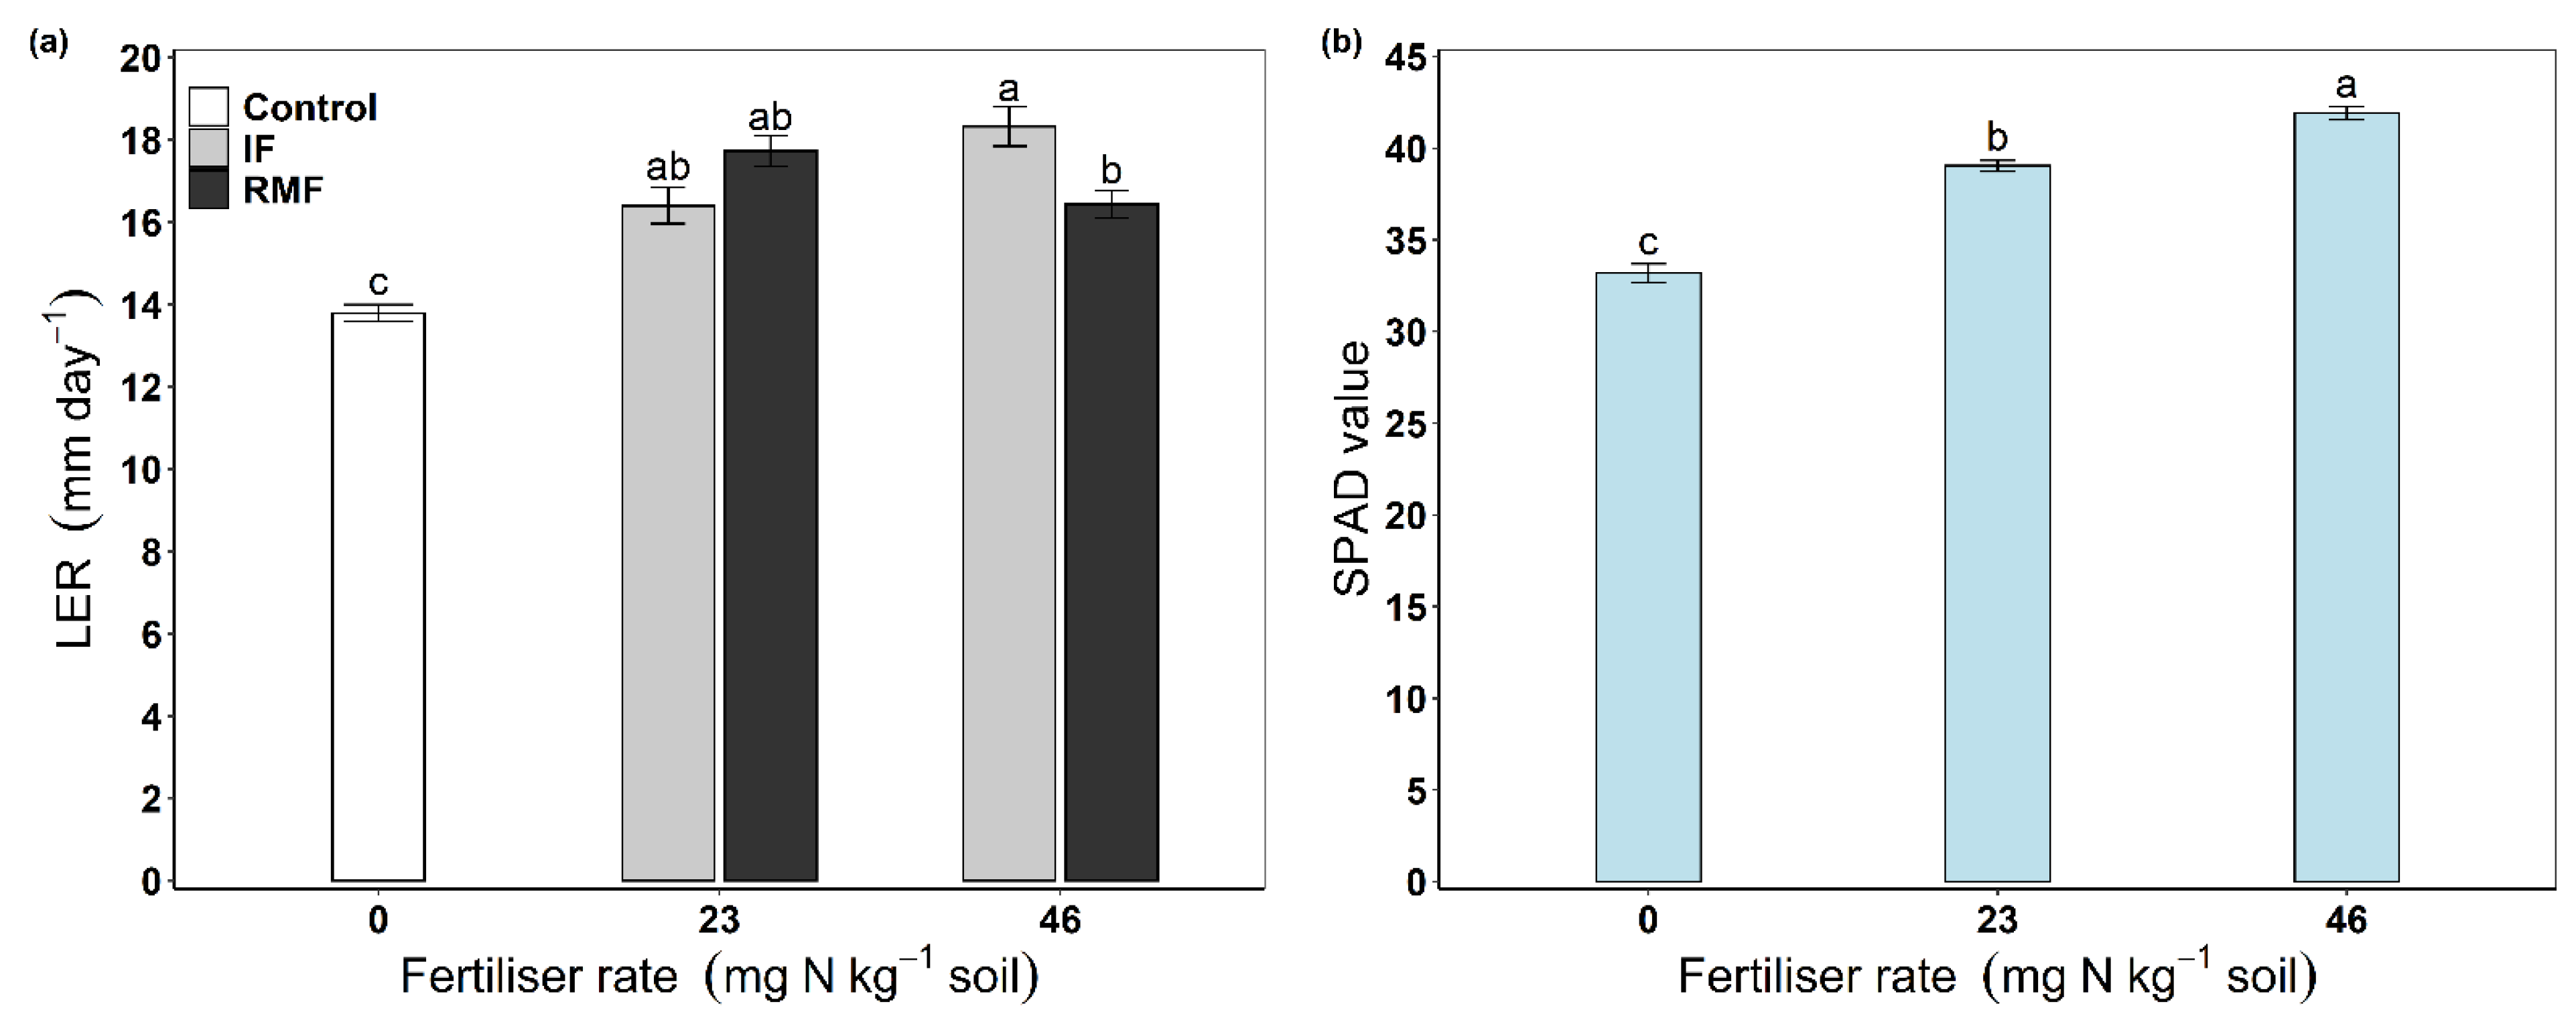
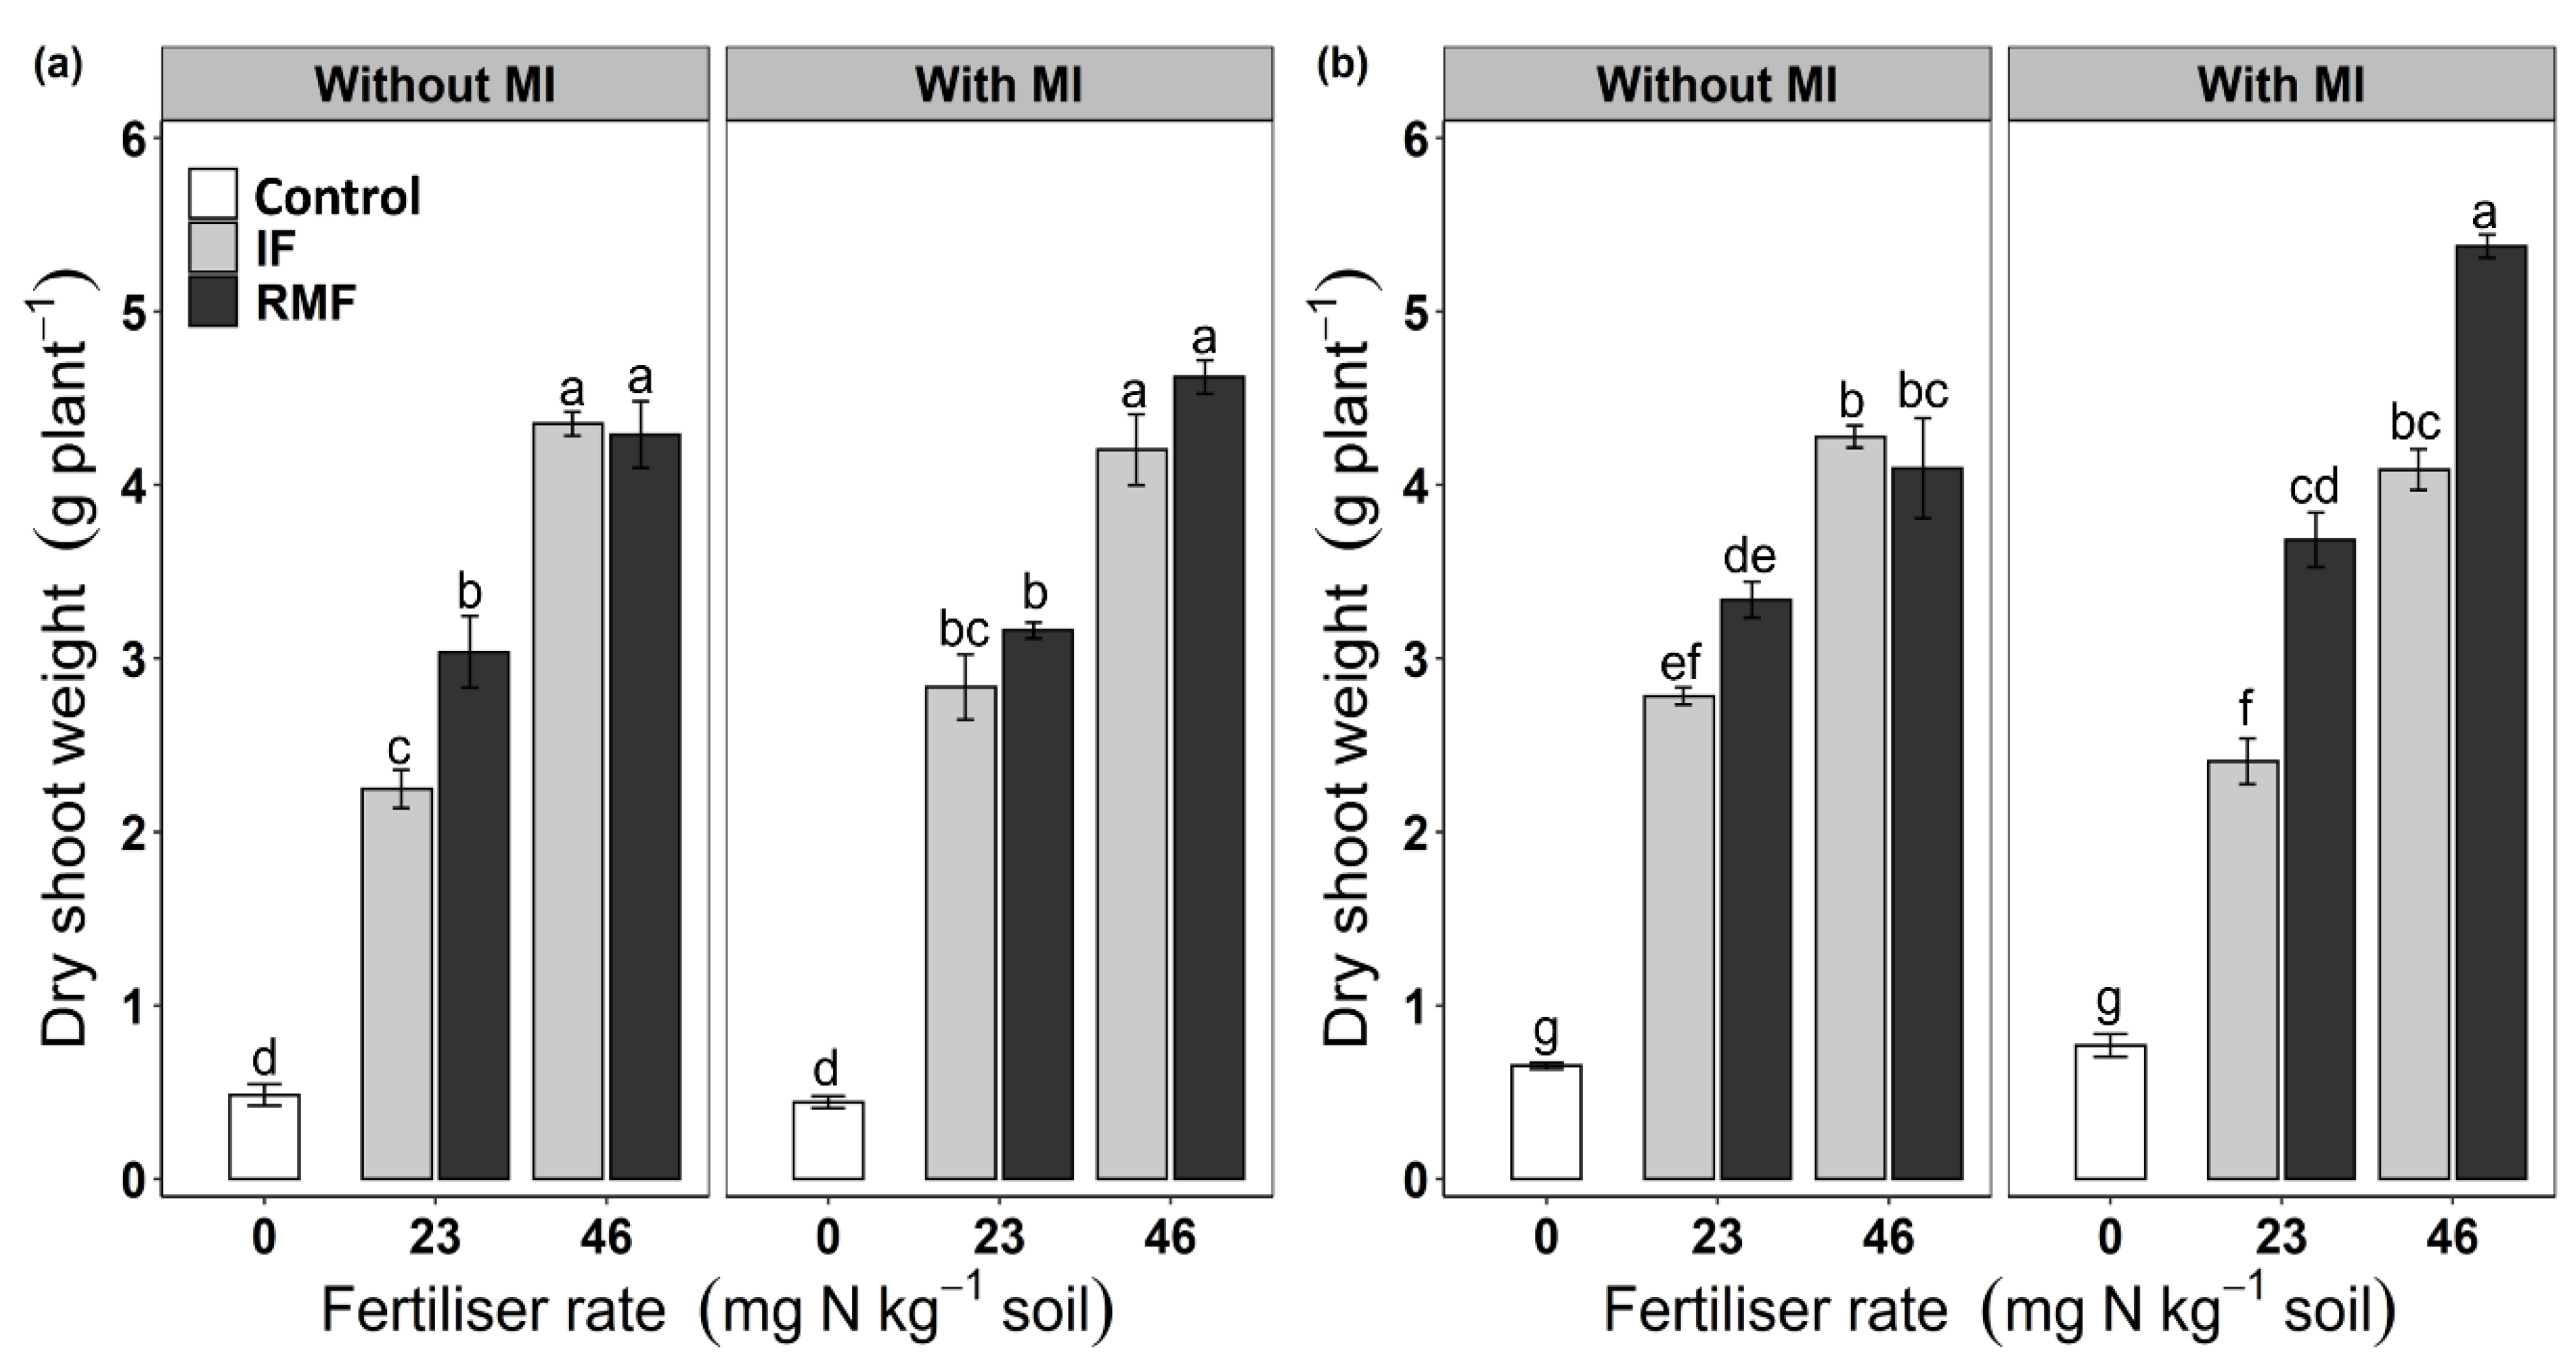
3.1. Leaf Extension Rate, Leaf Chlorophyll Content (SPAD Value) and Plant Biomass

The third leaf extension rate (LER) was affected by the interaction effect of fertiliser type × fertiliser rate (p ≤ 0.001; Table 1). The interaction effect was due to higher LER in IF-treated than RMF-treated plants at 46 mg N kg−1 soil, with no difference observed between the fertiliser types at the other application rate (Figure 1a). Leaf chlorophyll content (SPAD value) varied depending on fertiliser application rate (p ≤ 0.001), with no significant interaction effect (Table 1). Leaf chlorophyll content increased with increasing fertiliser rate, with 26% higher chlorophyll content in plants treated with 46 mg N kg−1 than 0 mg N kg−1 (Figure 1b).
At both growth stages, shoot dry weight was affected by the significant three-way interaction fertiliser type × fertiliser rate × MI (p = 0.042 at anthesis and p ≤ 0.001 at maturity) (Table 1). At anthesis, the interaction effect was because of greater shoot dry weight in RMF than IF at 23 mg N kg−1 soil without MI, with no fertiliser type differences with MI inoculation (Figure 2a). At maturity, the interaction effect was observed because of the higher shoot dry weight in RMF than IF at 23 and 46 mg N kg−1 soil with (but not without) MI (Figure 2b).
The dry root weight was significantly affected by the interaction effect of fertiliser type × fertiliser rate × MI (p = 0.032) at anthesis and fertiliser rate × MI (p = 0.041) at maturity (Table 1). At anthesis stage, the interaction effect was observed because of dry root weight being higher in IF than RMF at 46 mg N kg−1 soil treated with MI (Figure 3a) and higher in RMF than IF at 23 mg N kg−1 soil without MI. By contrast, at maturity, the interaction effect of Fr × MI was observed due to increased root biomass of plants treated with than without MI at 46 mg N kg−1 soil, but not at 0 and 23 mg N kg−1 soil (Figure 3b).

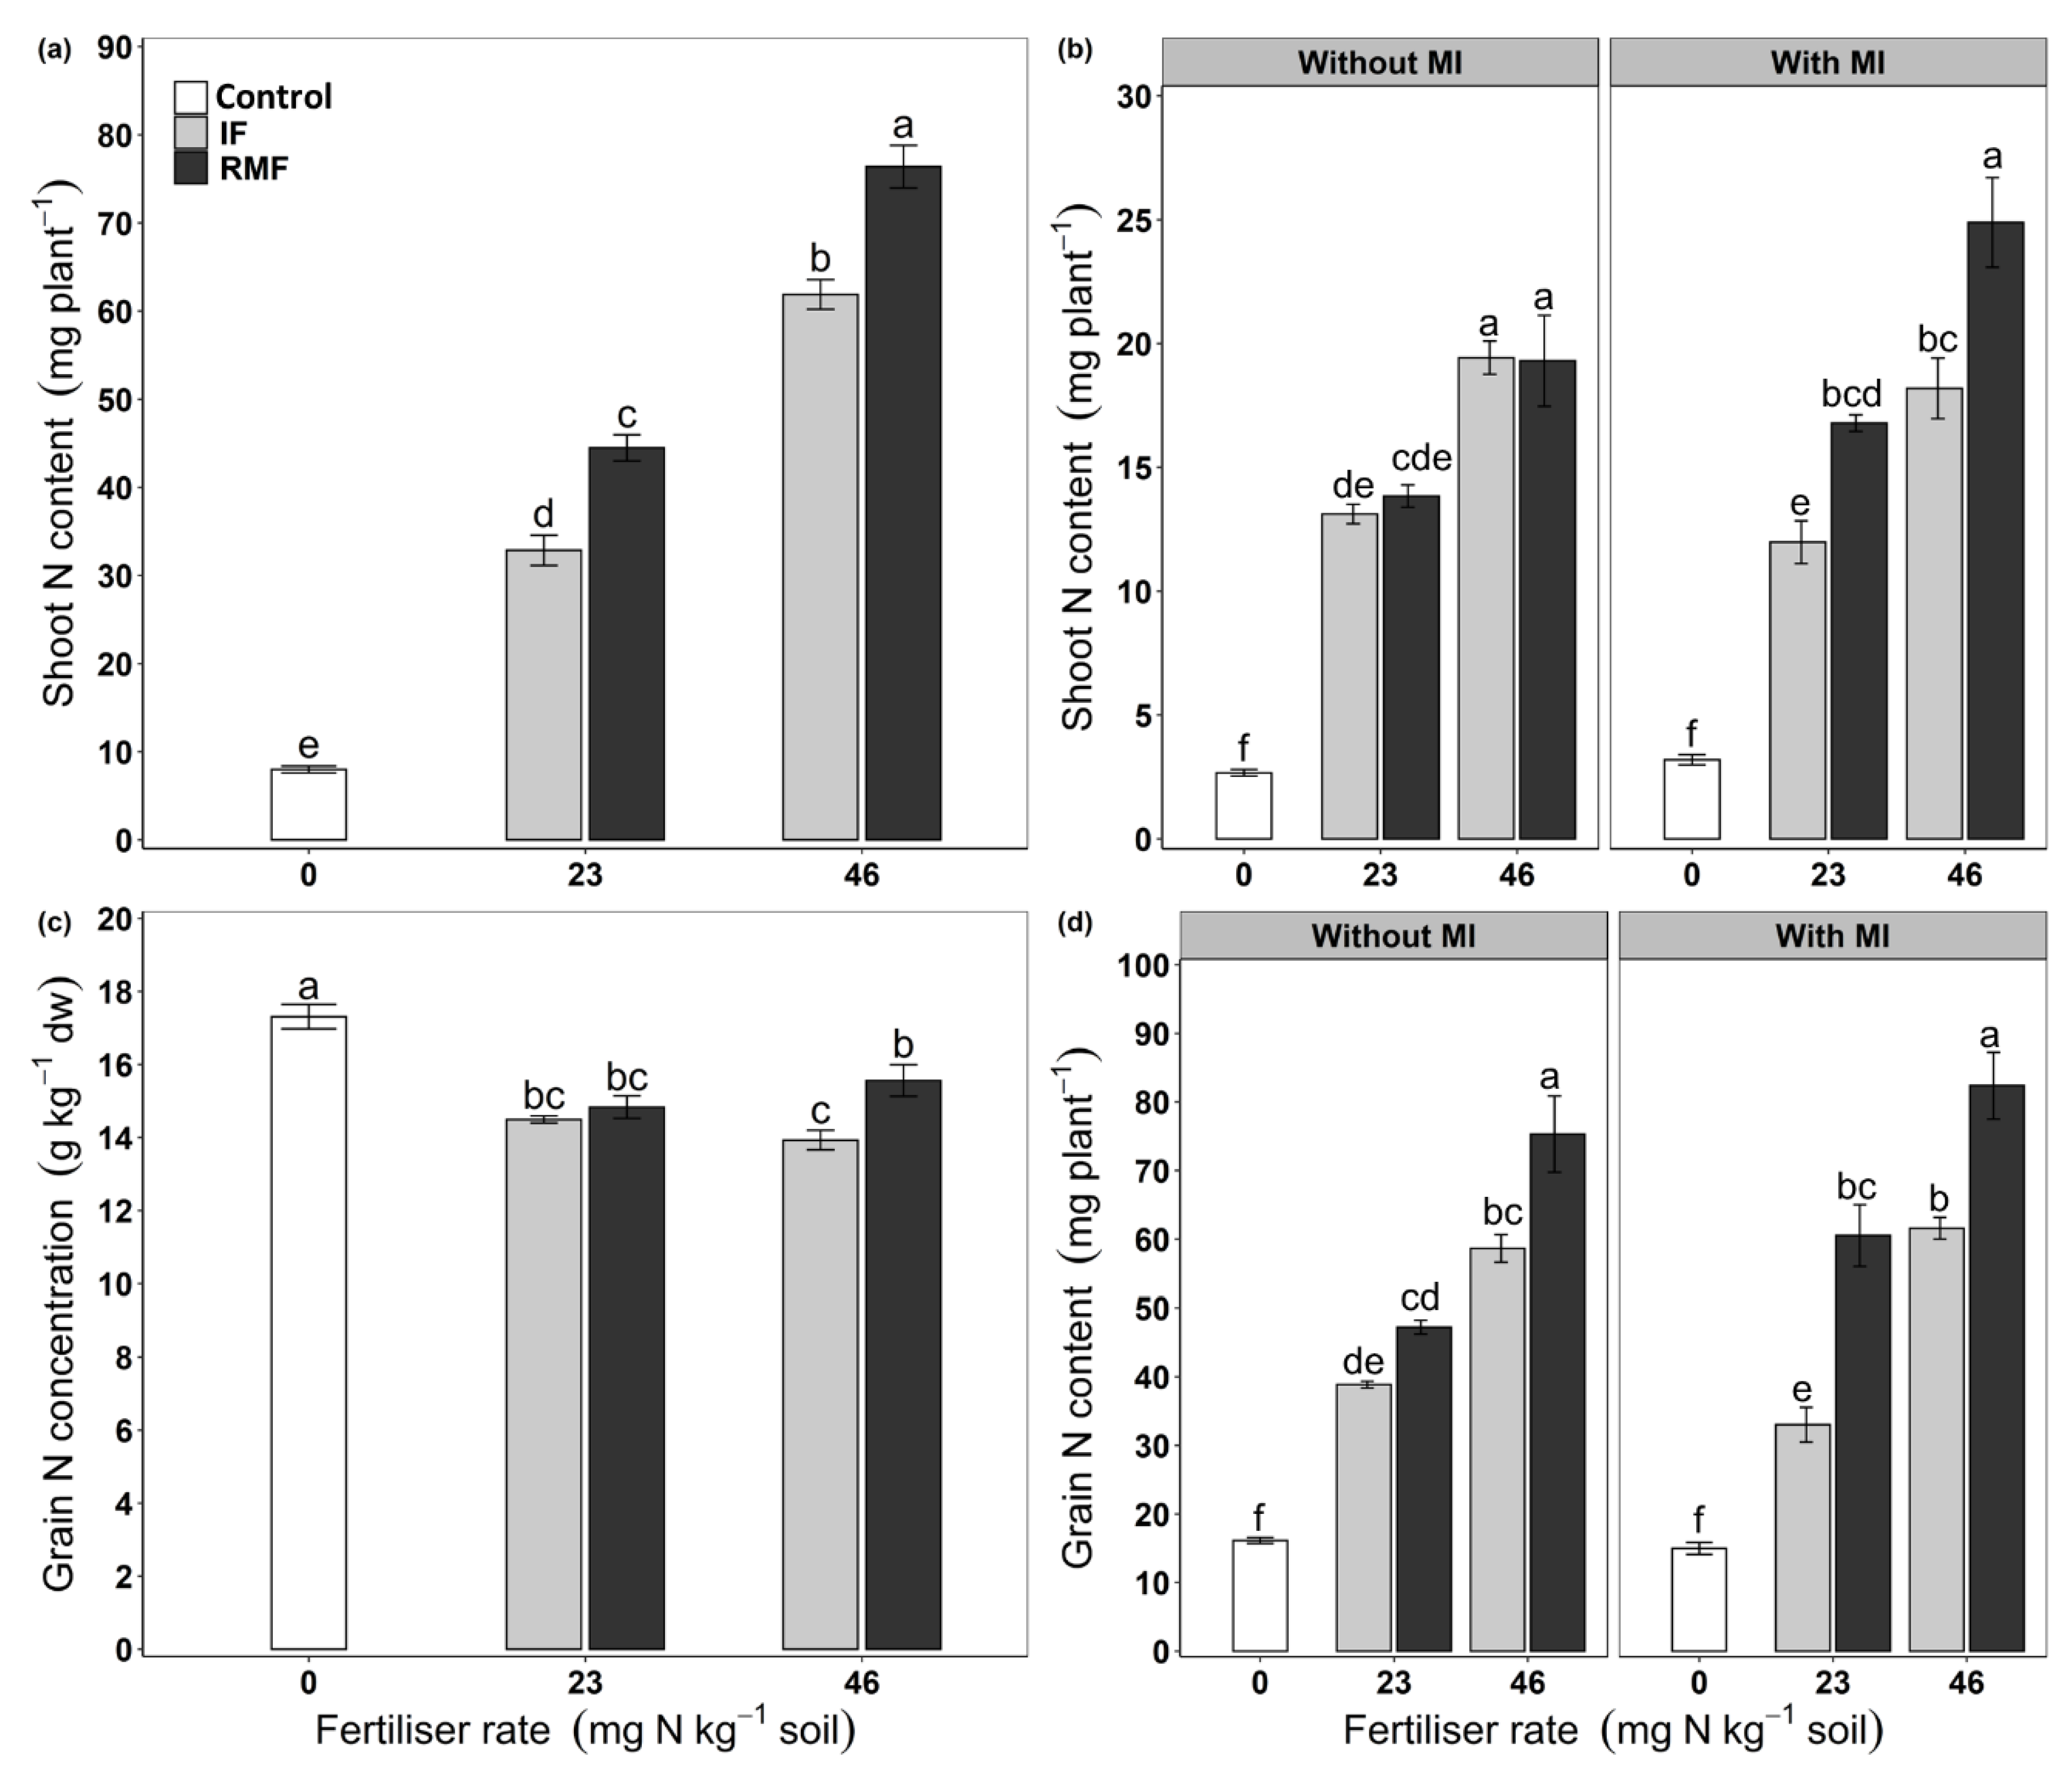
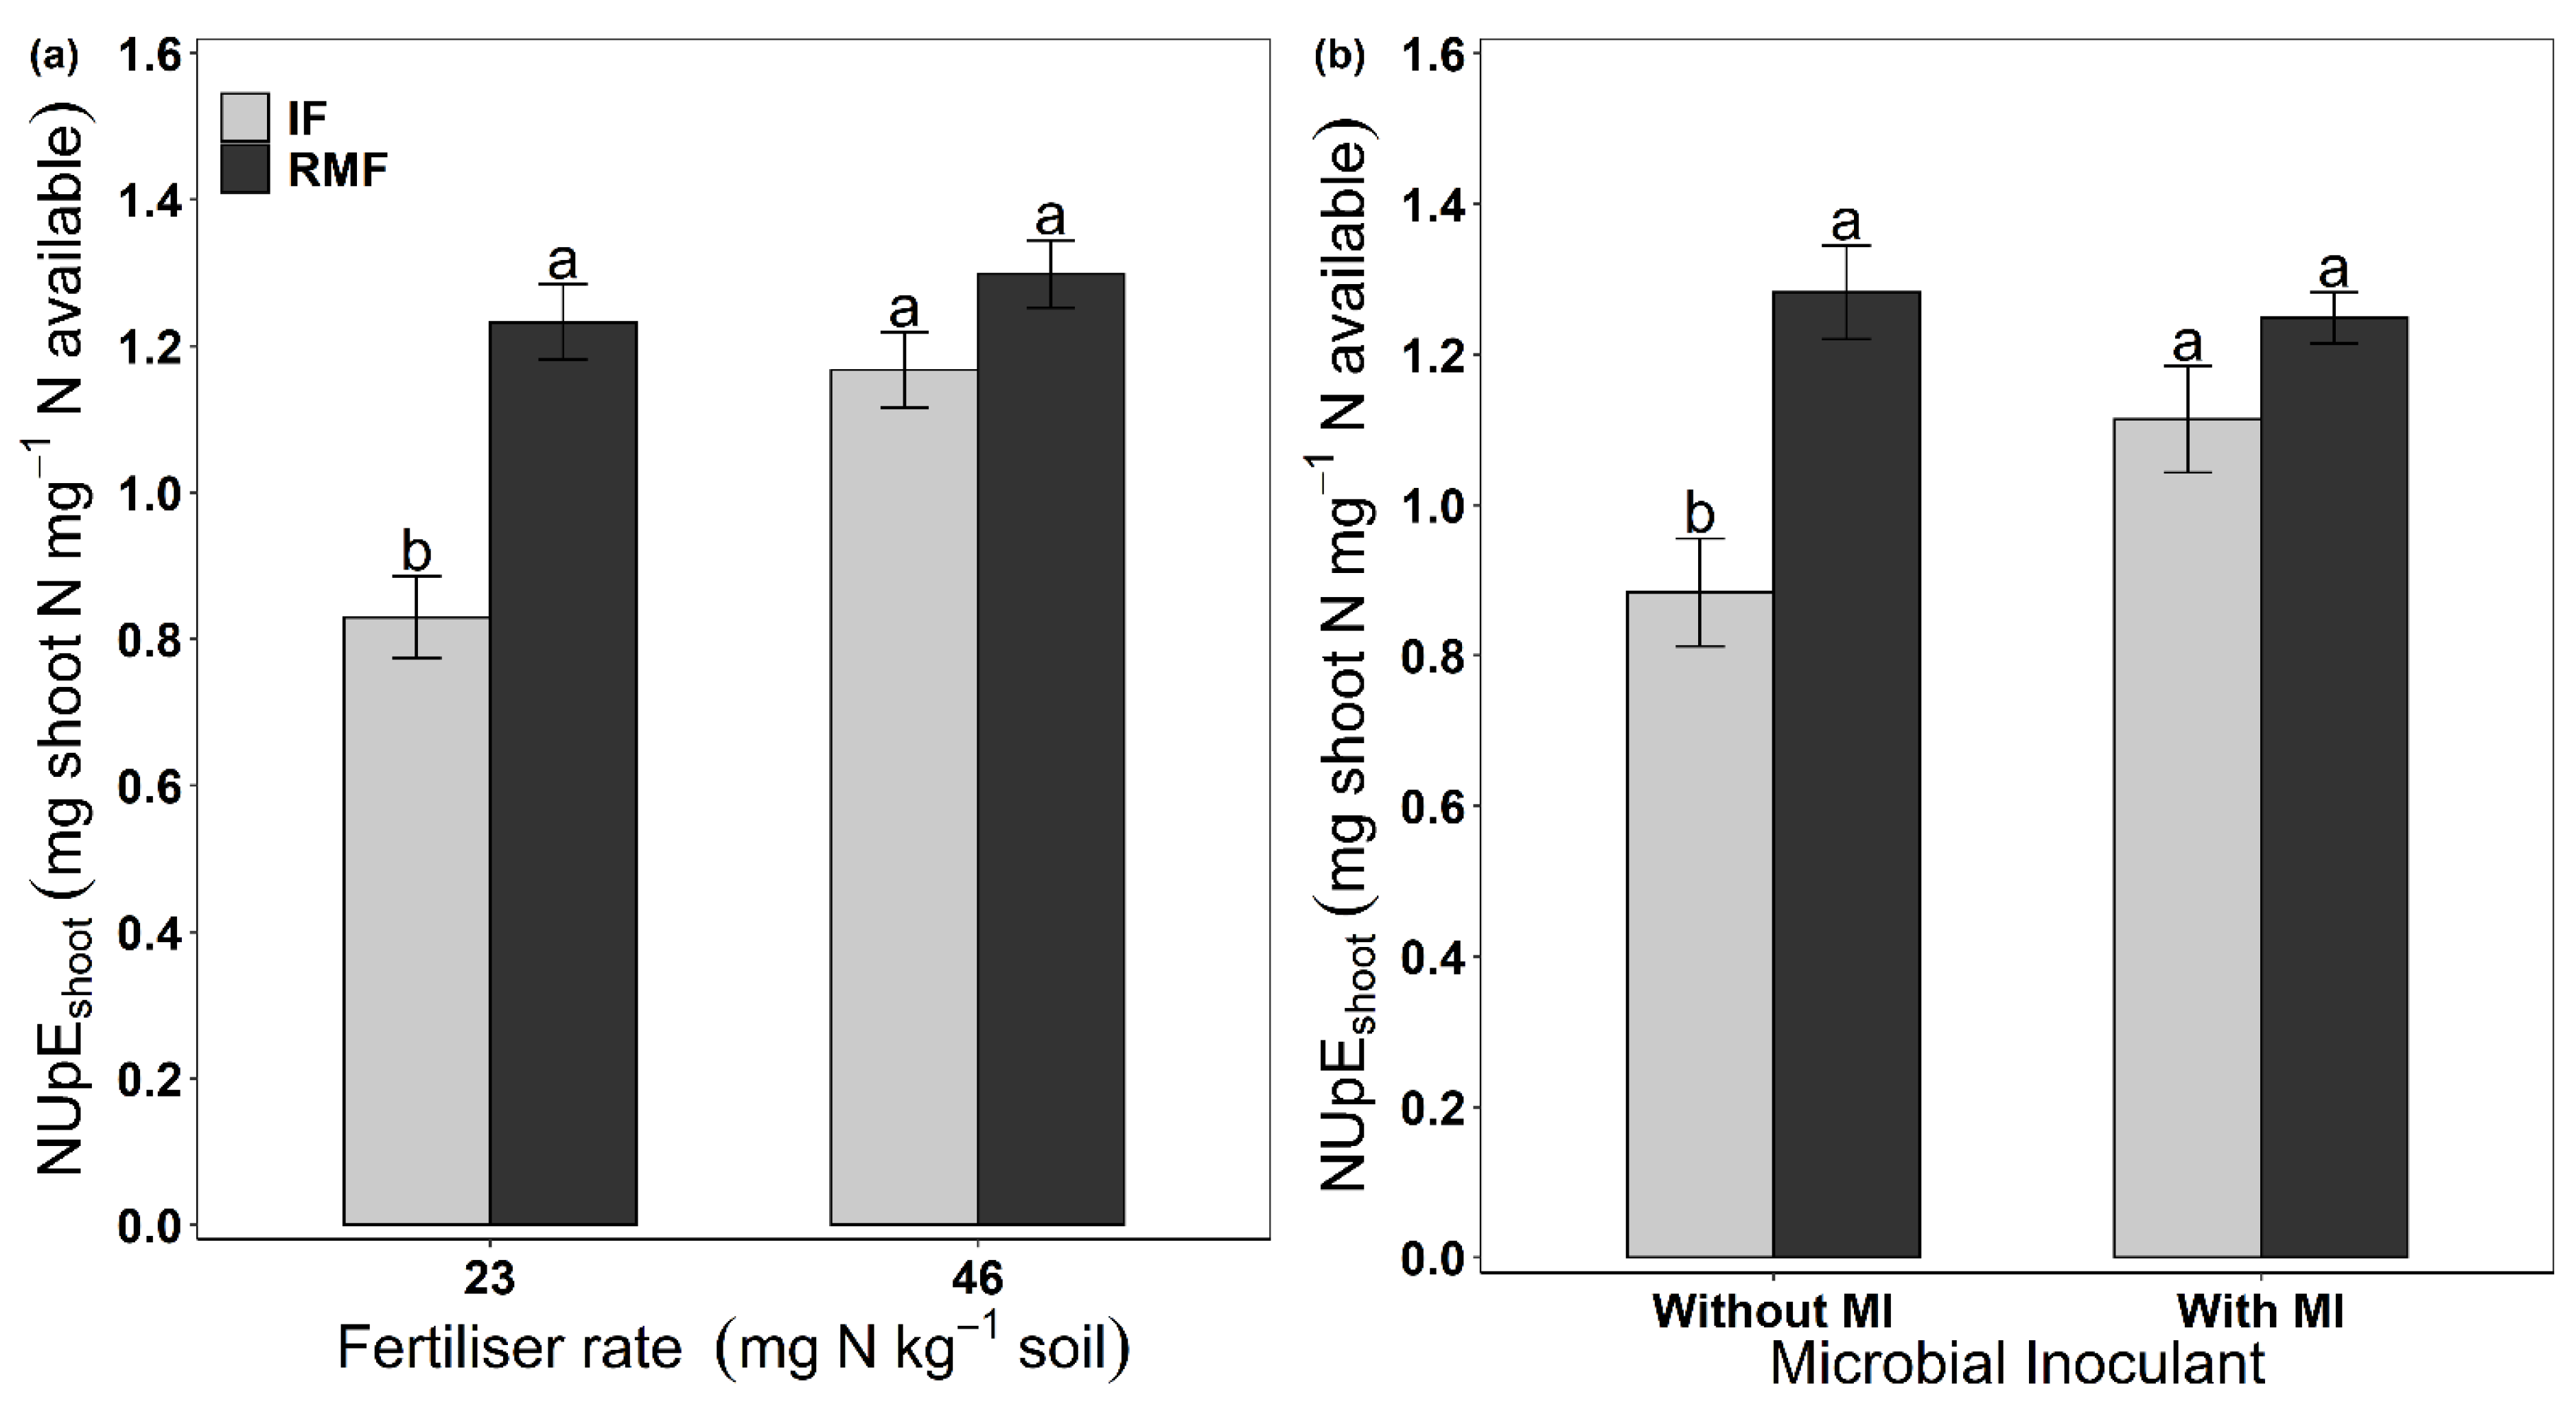
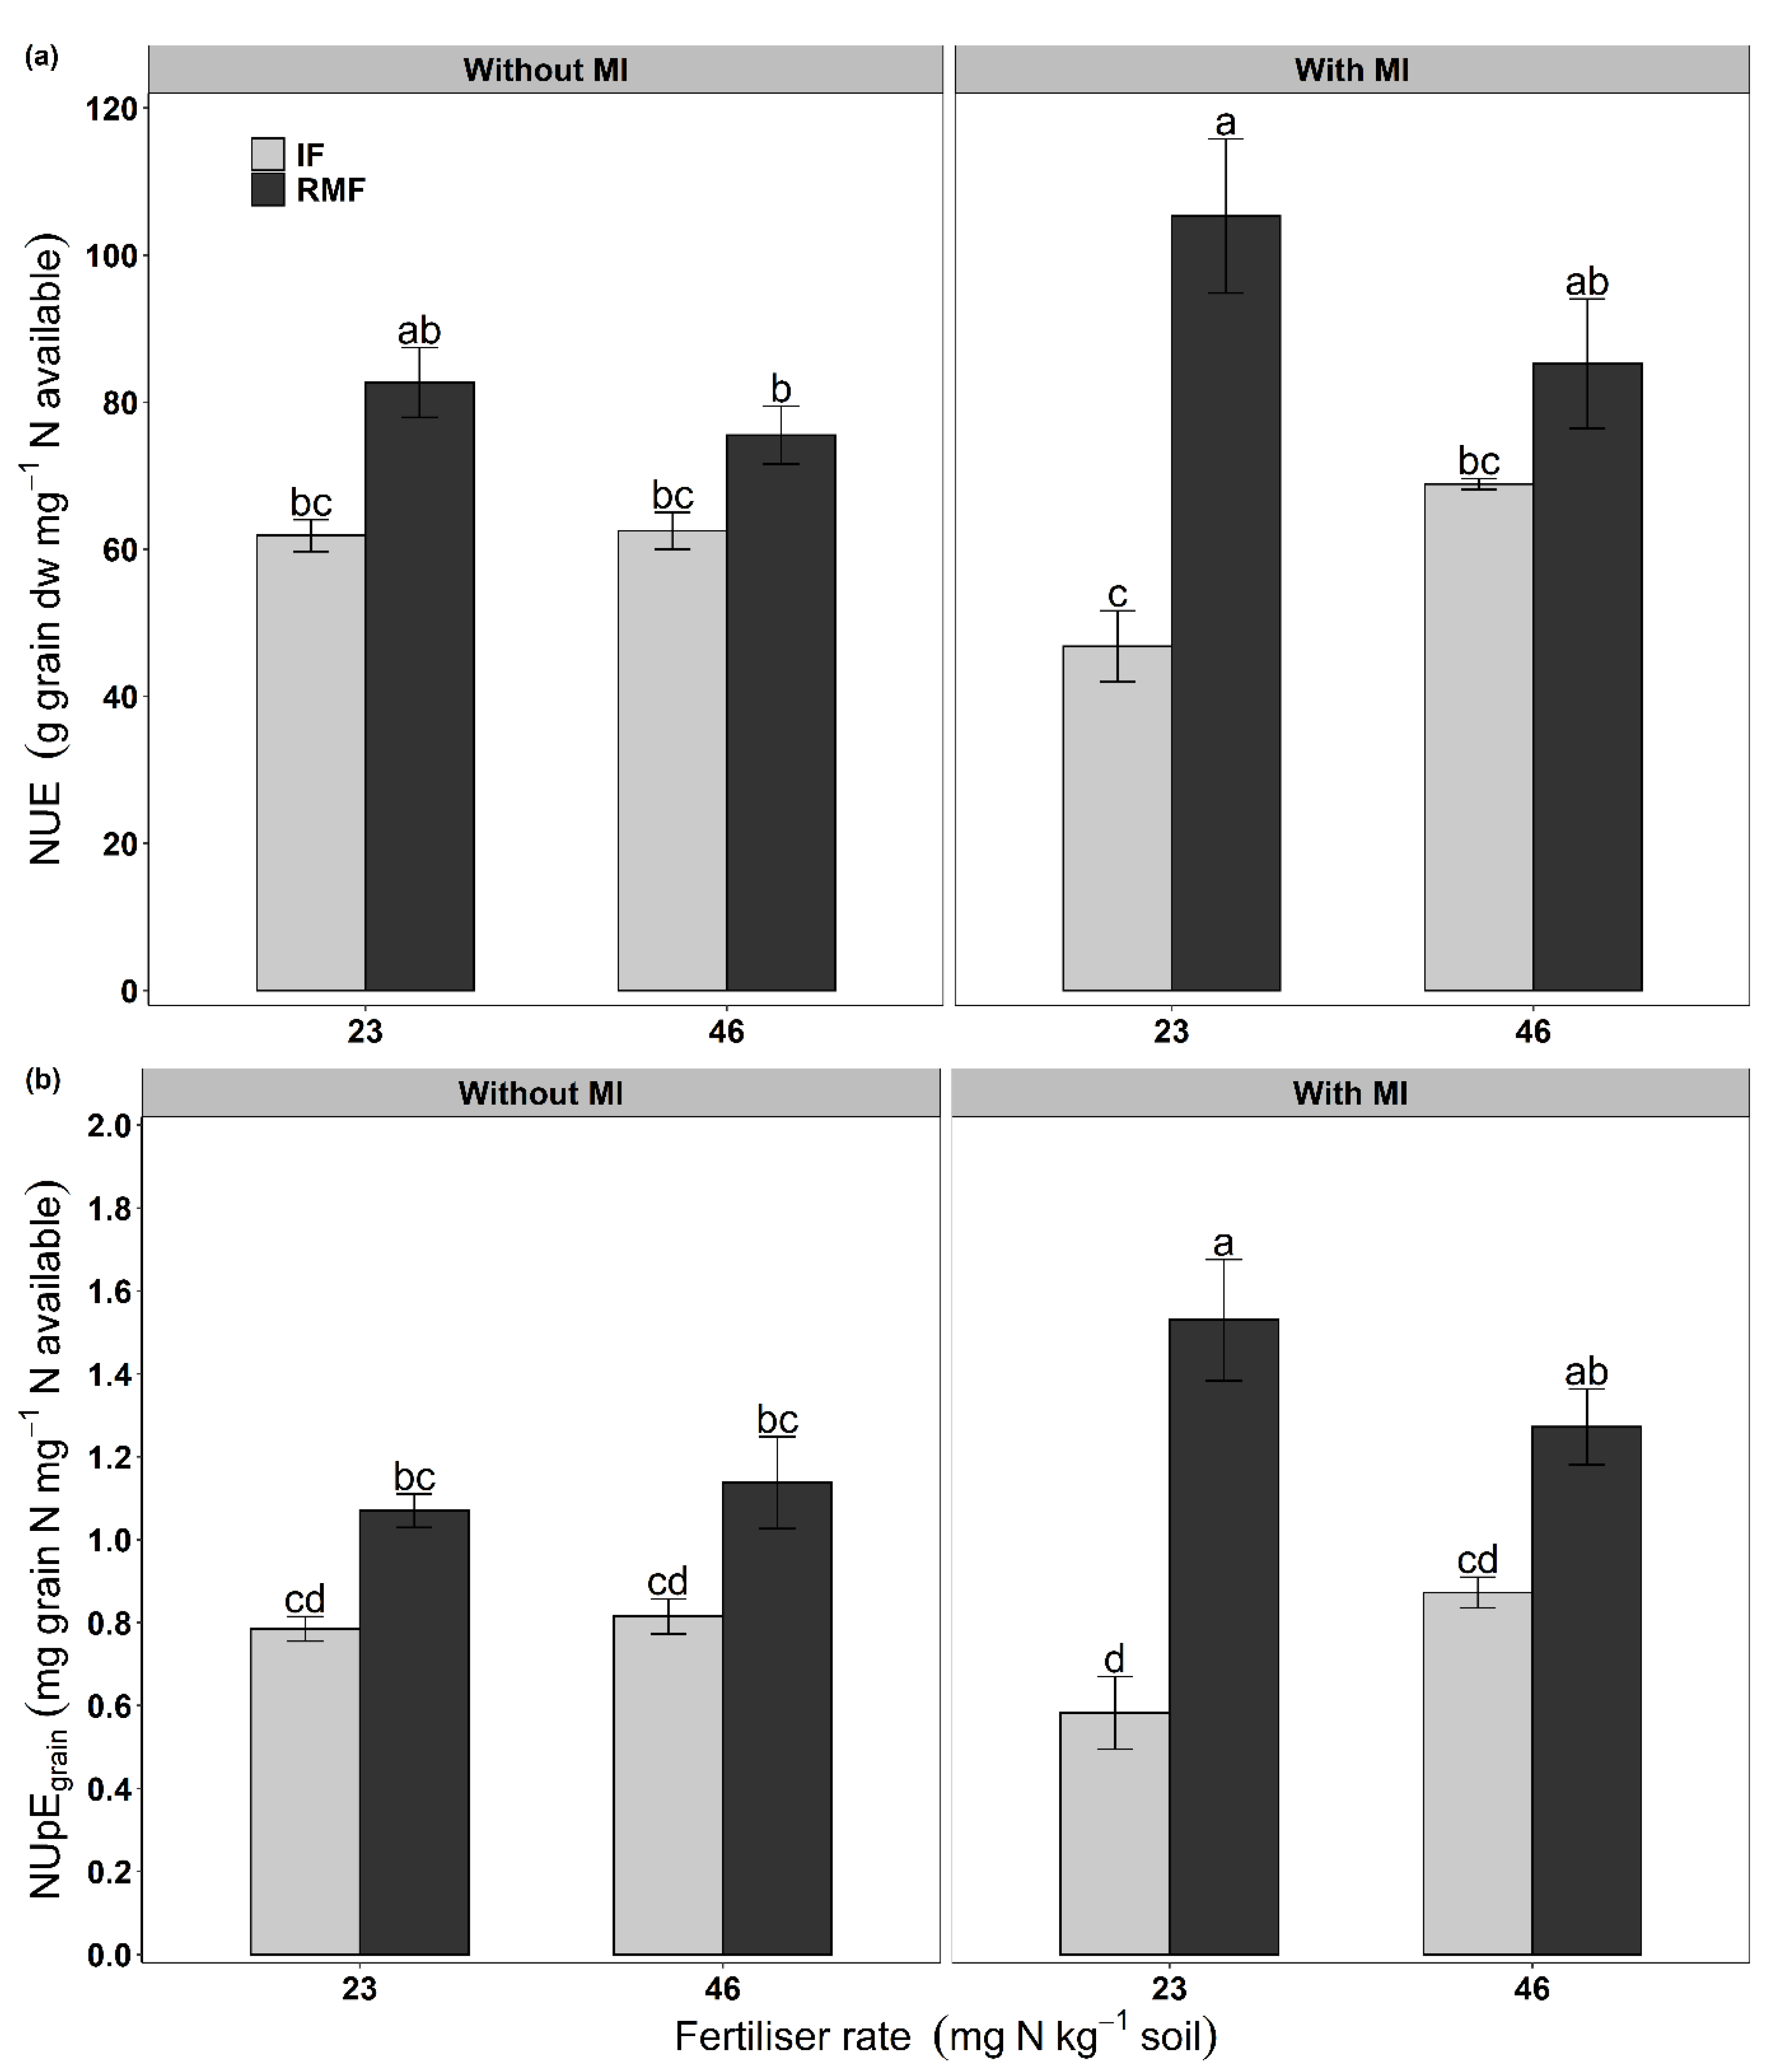
3.2. Nitrogen Content and N-Use Efficiency

At anthesis, the main effects of fertiliser rate (p ≤ 0.001) and MI (p = 0.014) were significant for shoot N concentration, and the interaction effect of fertiliser type × fertiliser rate (p ≤ 0.001) was significant for shoot N content (Table 1 and Table 2). At anthesis stage, the shoot N concentration was higher in plants treated with 0 and 46 mg N kg−1 than 23 mg N kg−1 soil, and there was no difference between 0 and 46 mg N kg−1 (Table 2). The shoot N concentration was higher in plants treated with than without MI (Table 2). The interaction effect was significant because of the increase in shoot N content was greater with increasing fertilisation rate in the case of RMF than IF (Figure 4a).
At maturity, the shoot N concentration was significantly affected only by the fertiliser rate (p = 0.012), whereas shoot N content showed a significant interaction effect of fertiliser type × fertiliser rate × MI (p = 0.039) (Table 1). The shoot N concentration was higher in plants treated with 23 and 46 mg N kg−1 soil than the control, but there was no difference between 23 and 46 mg N kg−1 soil (Table 2). The interaction effect on shoot N content was due to higher N content in RMF than IF at 23 and 46 mg N kg−1 soil treated with (but not without) MI (Figure 4b).
Grain N concentration was significantly affected by the interaction fertiliser type × fertiliser rate (p = 0.025), whereas grain N content showed a significant 3-way interaction fertiliser type × fertiliser rate × MI (p = 0.047) (Table 1). The grain N concentration was greater in plants supplied with RMF compared to IF only at 46 mg N kg−1 soil (Figure 4c). The three-way interaction effect on grain N content was due to higher N content in (i) RMF than IF at 46 mg N kg−1 soil irrespective of MI treatment, and (ii) in RMF than IF at 23 mg N kg−1 soil, but only in MI-treated plants (Figure 4d).
The NUpEshoot was significantly influenced by interaction effect of fertiliser type × fertiliser rate (p = 0.005) and fertiliser type × MI (p = 0.006) (Table 1). The interaction was due to higher NUpEshoot in RMF-treated than IF-treated plants at 23 mg N kg−1 soil, with no difference between the fertiliser types at the other application rate (Figure 5a). The NUpEshoot was higher in RMF-treated than IF-treated plants without MI, but with no differences between the fertiliser types in plants treated with MI (Figure 5b). The 3-way interaction effect of fertiliser type × fertiliser rate × MI significantly influenced NUE (p = 0.044) and NUpEgrain (p = 0.038) (Table 1). The interaction effect stood due to higher NUE (Figure 6a) and NUpEgrain (Figure 6b) in plants supplied with RMF compared to IF at 23 g N kg−1 soil with (but not without) MI. There was a positive correlation between NUpEshoot with grain protein yield, grain yield, NUE and NUpEgrain. The relationship was significant between NUpEshoot and grain protein yield or grain yield (Figure 7).

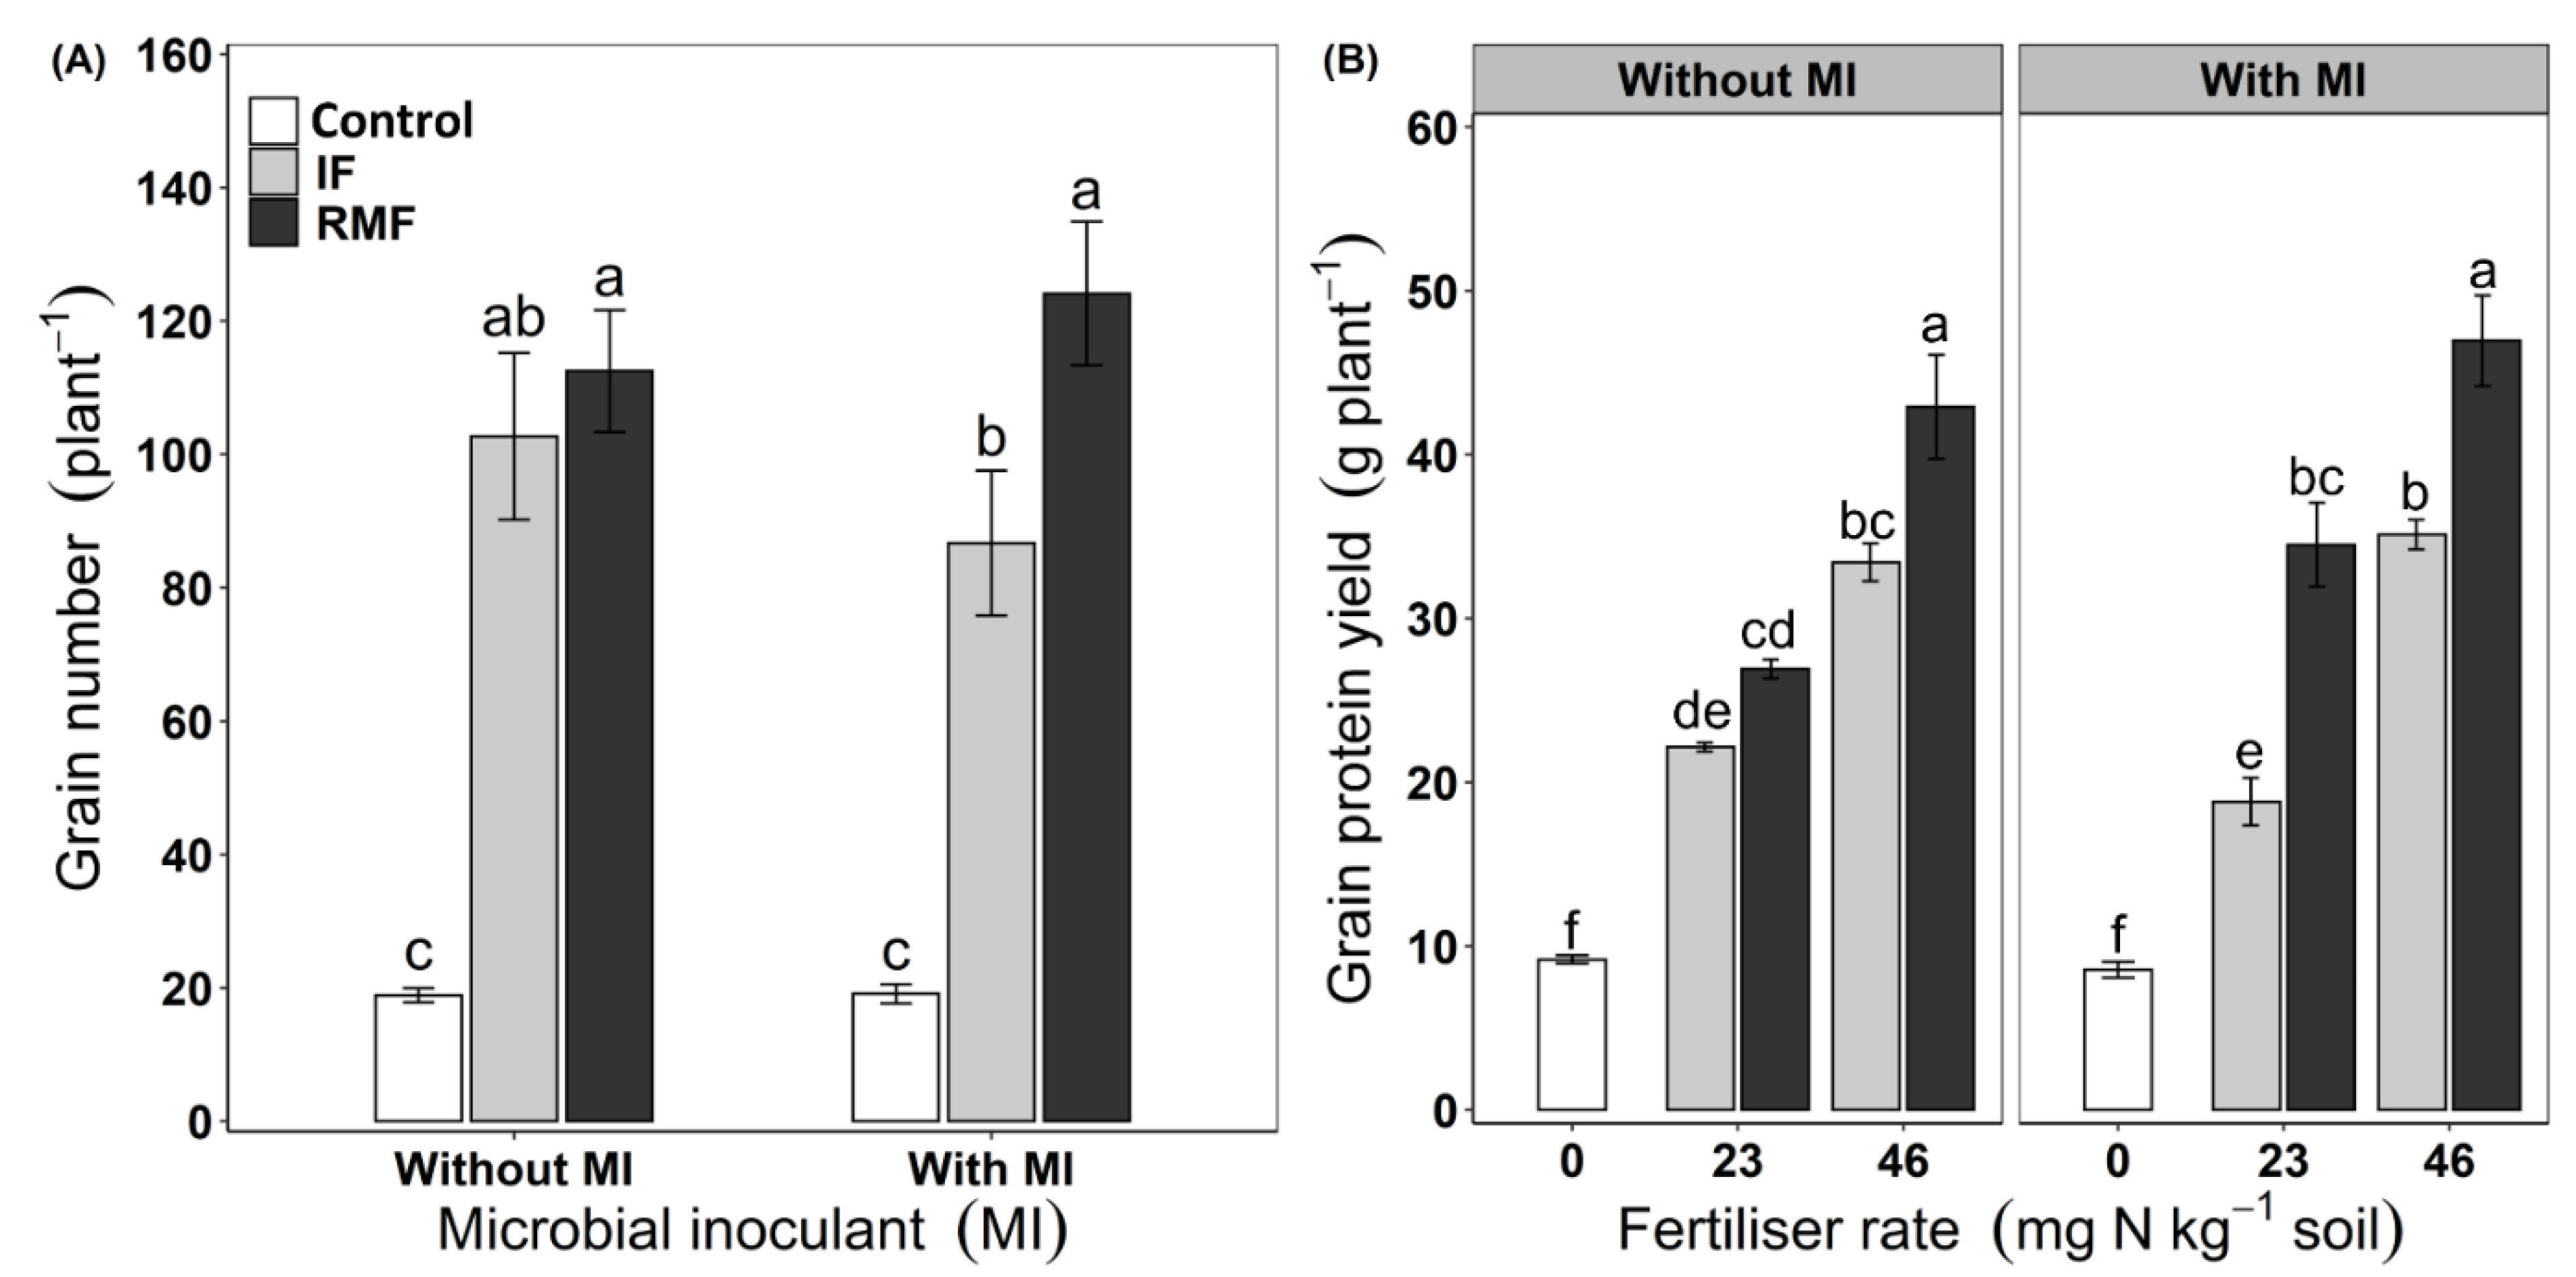
3.3. Grain Yield and Grain Protein Content

The grain yield and grain number were significantly influenced by the interaction effect of fertiliser type × fertiliser rate (p ≤ 0.001 and p = 0.008, respectively), whereas for 1000-grain weight and harvest index, only the main effect of fertiliser rate was significant (p ≤ 0.001) (Table 3). The interaction effect for grain number was due to more grains in RMF than IF at 23 mg N kg−1, but there was no difference at 46 mg N kg−1 (Table 4). Grain number was also influenced by the significant interaction of fertiliser type × MI (p = 0.04) (Table 3) because there were more grains in RMF-treated than IF-treated plants but only in the presence of MI (Figure 8A). Grain yield was increased with the increase in the fertiliser rate, with a higher yield produced by the plants treated with RMF than IF (Table 4).
The plants at 0 mg N produced higher 1000-grain weight (48 ± 0.8 g) than those treated with 23 (36 ± 0.6 g) and 46 mg N kg−1 soil (37 ± 1.8 g). The harvest index was greater in plants treated with 46 mg N (46.1 ± 0.2%) than in 23 mg N kg−1 soil (44.6 ± 0.1%).
The significant fertiliser type × fertiliser rate interaction (p = 0.025) influenced GPC, whereas the 3-way interaction fertiliser type × fertiliser rate × MI (p = 0.047) influenced grain protein yield (GPY) (Table 3). Regarding GPC, there was a higher protein concentration in RMF-treated than in IF-treated plants at 46 mg N but not at 23 mg N kg−1 soil (Table 4). The GPY was higher in plants supplied with RMF than IF at 46 mg N kg−1 without MI and at both N addition rates with MI (Figure 8B).

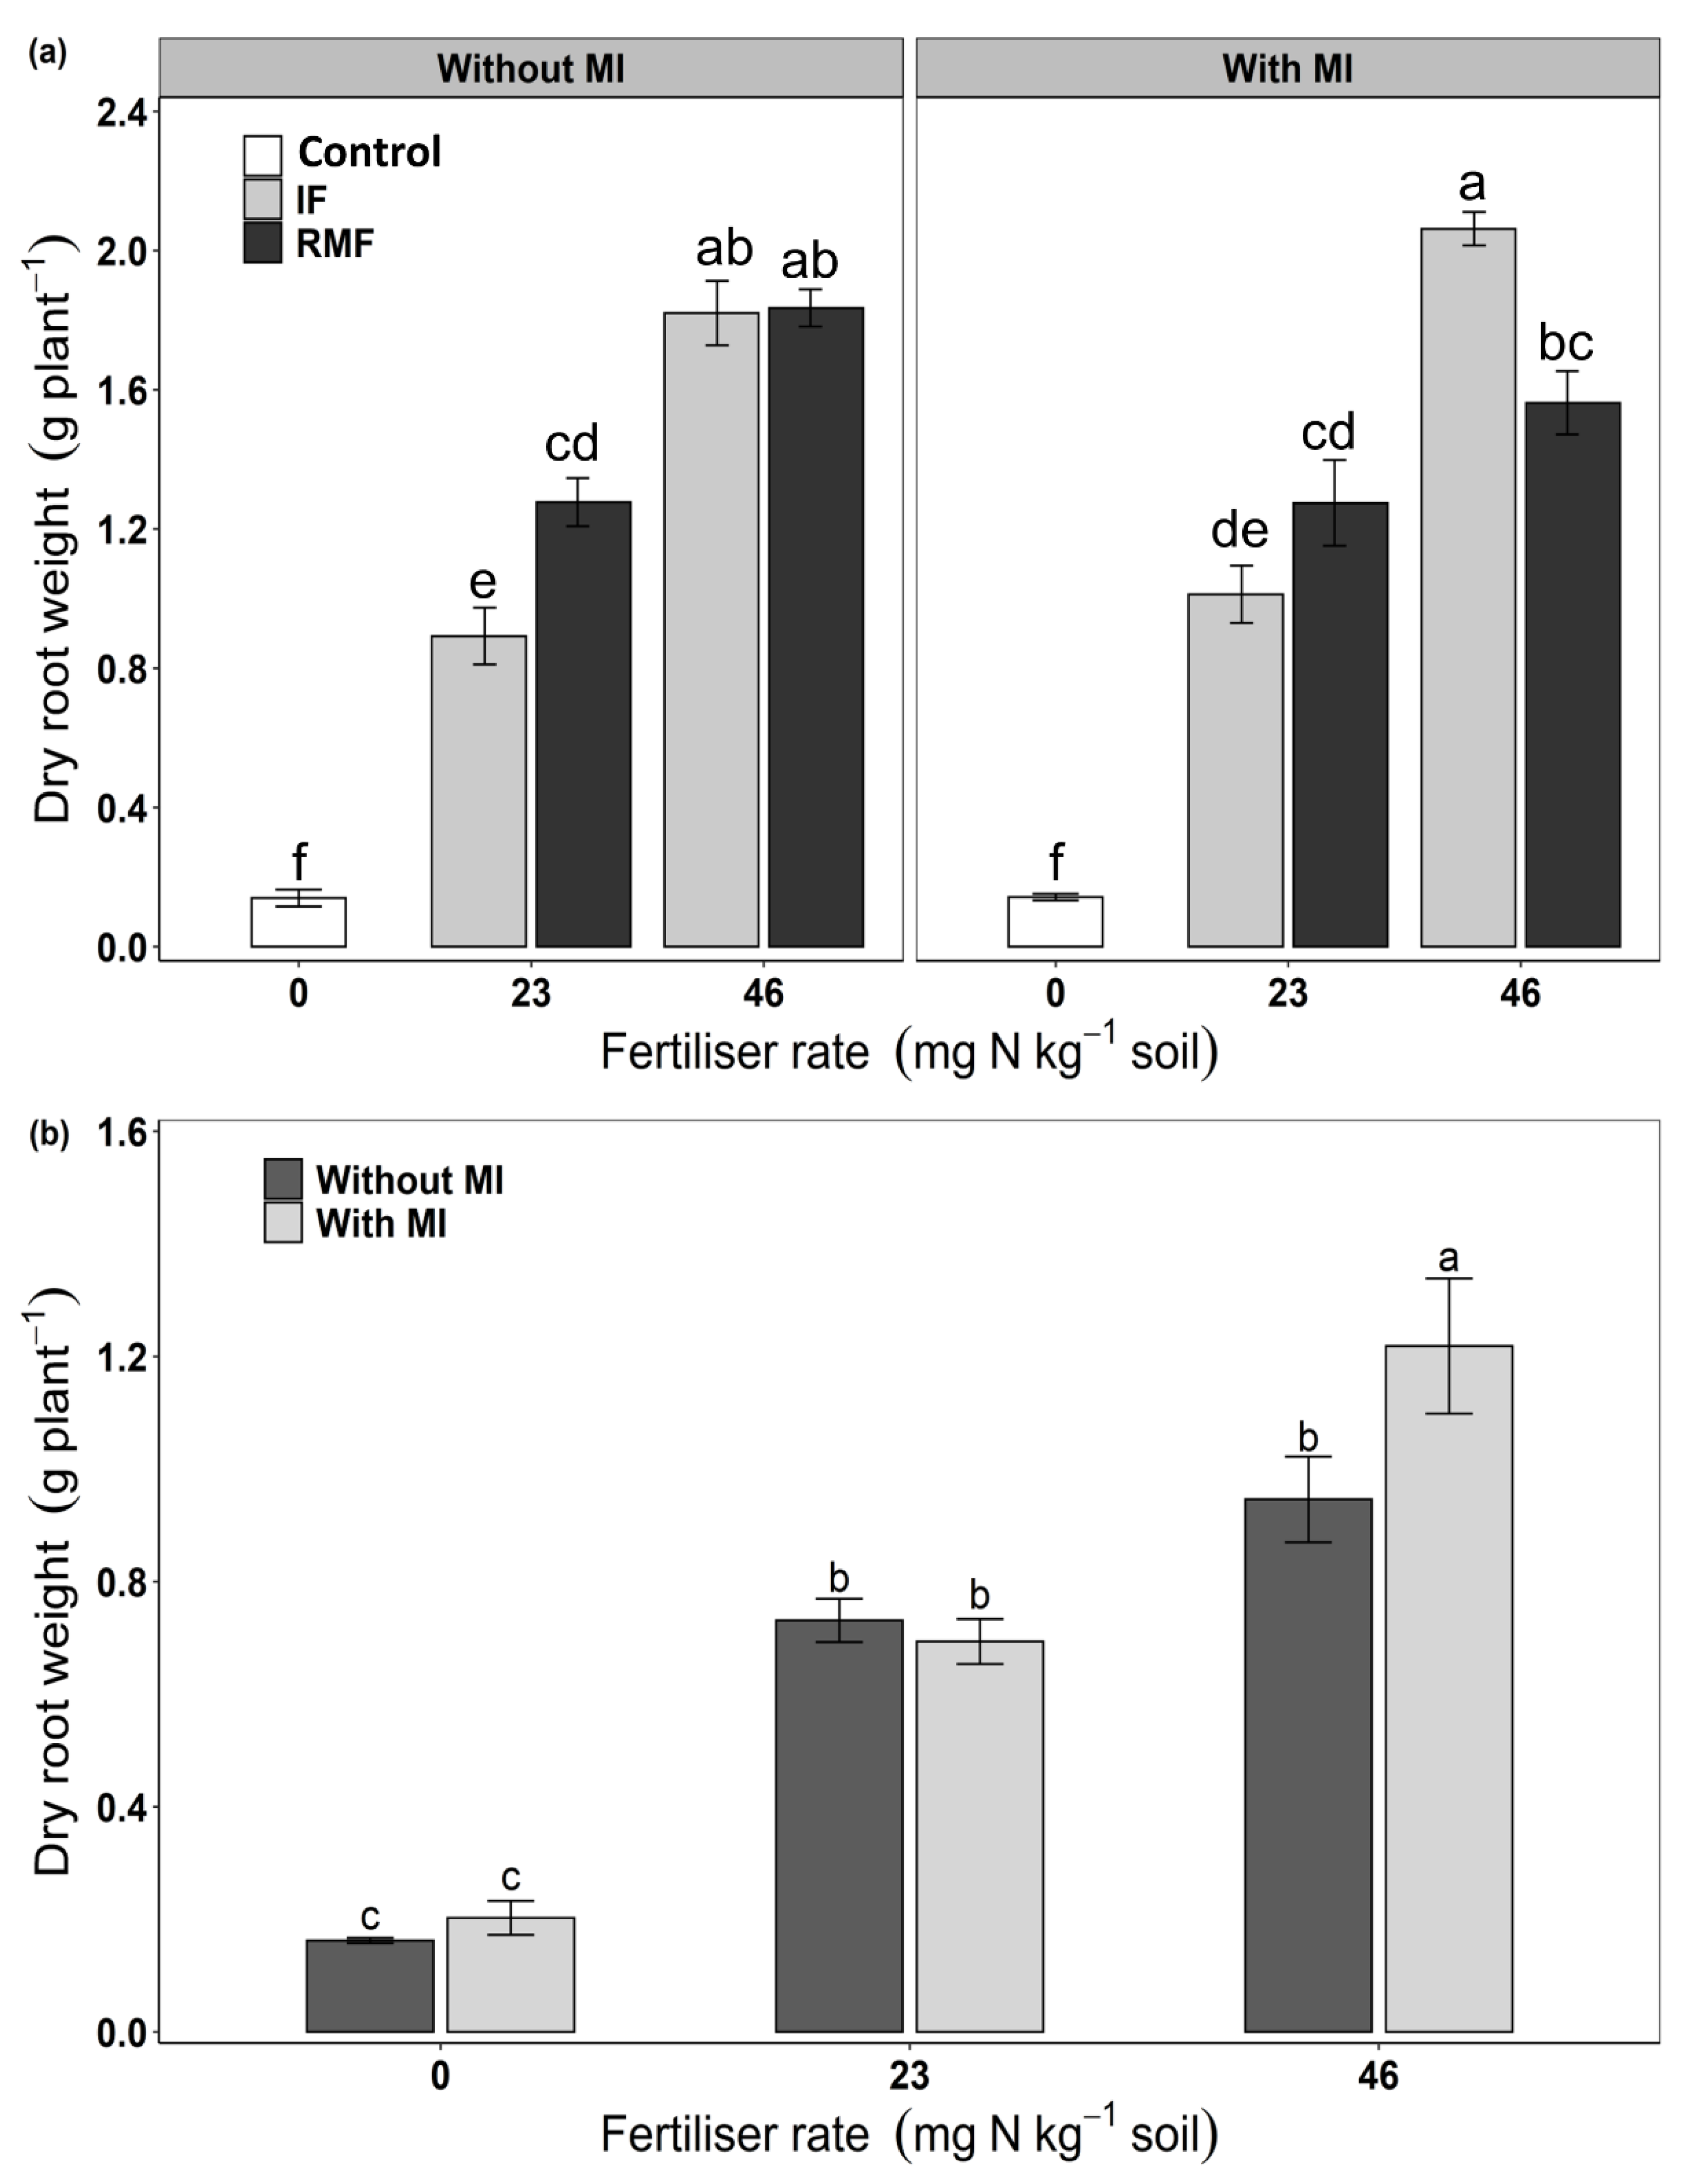
3.4. Root Morphology

The interaction between fertiliser type × fertiliser rate (p ≤ 0.001) significantly influenced total root length, root surface area and fine root length (diameter ≤ 0.2 mm) (Table 3). However, the specific root length, root diameter and coarse root length (diameter > 0.2 mm) were influenced by the fertiliser rate only, with no significant interaction effect (Table 3). There were opposite differences between the fertiliser types on total root length at fertiliser rates of 23 (longer root length with RMF than IF) and 46 mg N kg−1 (shorter root length with RMF than IF) (Table 5). The differences in root surface area and length of fine roots were observed at 23 mg N kg−1 (RMF outperforming IF) but not at 46 mg N kg−1 (Table 5).
The specific root length was more in unfertilised plants and there were no significant differences between the 23 and 46 mg N kg−1 (Table 6). The coarse root length increased with an increase in fertiliser rate; a similar relationship was evident for the average root diameter (but the increase from 23 to 46 mg N kg−1 was non-significant) (Table 6).

4. Discussion

Slow-release polymer-coated rock mineral fertiliser (RMF) inoculated with beneficial soil microbes could supplement inorganic fertiliser (IF) in increasing wheat yield and nutrient uptake [19]. However, nitrogen-use efficiency (NUE), grain protein concentration (GPC) and grain protein yield (GPY) have not been considered in earlier studies. Therefore, in the current experiment, we applied a microbial consortium inoculant (MI) with RMF and examined its efficacy compared to IF with or without the same MI, to study their effects on wheat growth, NUE, N content, grain yield, GPC and GPY.
We hypothesised that RMF combined with MI would be more effective in improving wheat growth, grain yield, NUE, GPC and GPY than IF. However, we observed that the combined application of RMF and MI was positive for shoot growth, shoot N content at maturity, grain N content, NUE and GPY, but root growth, grain yield and GPC were influenced mainly by RMF alone than IF regardless of MI. These findings are supported by other studies where slow-release fertiliser can attain the similar or even higher yield when used in relatively lower quantities than conventional fertiliser [12,14] and also increases NUE [13].
NUE is a critically essential parameter in evaluating wheat production and is highly influenced by fertiliser management [7]. The current study showed higher NUpEshoot (Figure 5a), NUE (Figure 6a) and NUpEgrain (Figure 6b) in RMF-treated than IF-treated plants at 23 mg N kg−1 soil. The NUE and NUpEgrain were high in plants supplied with RMF and treated with MI (Figure 6a,b). The increase in NUE was probably due to greater total root length, root surface area, and fine root length in plants treated with RMF than IF at 23 mg N kg−1 soil (Table 5). In addition, the shoot N content at anthesis and maturity (Figure 4a,b) and grain N content (Figure 4d) were also higher in plants applied with RMF than IF with MI. Thus, our results were in line with the vital trait for wheat NUE being denoted by the capacity of the crop to uptake N, which is a role of root structure, architecture and function [42]. It was also reported that the increase in the length and biomass of the root system improved plant N uptake and NUE in wheat [43].
Slow-release fertiliser has a prolonged nutrient supply capability, which enhances the NUE of the crop because of the balancing act of nutrient retention and nutrient dissolution [15]. Wheat grain yield and NUE were improved significantly by using polymer-coated urea because of the longer duration of nutrient release [44]. Similarly, the slow-release fertiliser was superior to standard fertiliser in improving NUE under the same N rates in spring maize [45]. Plant-growth promoting rhizobacteria [7] and microbial consortia [46] have also been reported to increase N content and NUE in wheat. The MI used in the current study consists of a consortium of beneficial microorganisms that promote plant growth and nutrient uptake, leading to increased shoot and grain N content and NUE in the MI-treated treatments.
Nitrogen fertilisation significantly affects wheat grain yield and protein content [17,47]. In the current study, grain yield increased with an increase in the fertiliser rate, with a higher yield in plants treated with RMF than IF (Table 4). The grain yield increased due to more grains in RMF treated plants (Table 4), as grain yield in wheat depended on the number of grains per unit area [48]. Similarly, several investigations stated the increase in wheat grain yield owing to the application of slow-release fertiliser [13,31,49,50,51] by decreasing nutrient losses via volatilisation and leaching and with precise nutrient release benefitting physiological and biochemical aspects of plant growth [15]. The dry matter build-up at maturity is the key factor affecting the final grain yield [3], contributing more than two-thirds to grain yield [50]; later, greater grain yield was attained in plants treated with a higher rate of RMF (Table 4).
The GPC largely depends on the remobilisation of accumulated N before anthesis and the N absorbed after anthesis [3,52]. In the current study, the GPC was significantly influenced by the interaction effect of fertiliser type and fertiliser rate (Table 3), and GPY by the 3-way interaction effect of fertiliser type, fertiliser rate and MI (Table 3), with higher GPC and GPY in RMF-treated than IF-treated plants at 46 mg kg−1 soil (Table 4 and Figure 8B). The RMF application increased N content in shoots at anthesis and maturity (Figure 4a,b) and grain N content (Figure 4d), increasing the GPC compared to IF-treated plants. Similarly, the RMF increased wheat’s plant nutrient and grain protein content [31]. Furthermore, the application of polymer-coated urea [44,53] and a combination of controlled-release urea plus typical urea [3] increased GPC in wheat owing to increased N availability in the later part of the growing season. The increase in grain N content must be more significant than the increase in grain yield to concurrently achieve an increase in grain yield and GPC [54]. When compared to IF, RMF application increased the grain yield by 29% (RMF 4.4 ± 0.2 g and IF 3.4 ± 0.2 g plant−1) and the grain N content by 37% (RMF 66 ± 4 and IF 48 ± 3 g kg−1 dw). Therefore, the RMF application simultaneously increased wheat grain yield and GPC compared to IF.

5. Conclusions

NUE was higher in plants treated with RMF (with MI) compared to IF (with or without MI), likely due to extensive root growth, more shoot N content (at anthesis and maturity) and grain N content in plants treated with RMF with MI. The application of RMF with MI also improved grain yield and GPC compared to IF-treated plants. Therefore, RMF in combination with MI can be viewed as a practical approach to assist RMF in supplying nutrients to improve NUE, grain yield and GPC in winter wheat.

Author Contributions

K.T. and Z.M.S. designed the study in consultation with Z.R. and K.T. conducted the experiment, analysed the data, and wrote the first draft of the manuscript. Z.R. and Z.M.S. supervised the work, contributed to the writing and revised the manuscript. P.S. contributed to the writing and revised the manuscript. All authors have read and agreed to the published version of the manuscript.

Funding

The University of Western Australia funded this research through the Australian Government Research Training Program (RTP) Fee Offset Scholarship and the University Postgraduate Awards program to KT.

Institutional Review Board Statement

Not applicable.

Informed Consent Statement

Not applicable.

Data Availability Statement

The dataset generated in this study is available from the corresponding author upon reasonable request.

Acknowledgments

The authors acknowledge Troforte Innovations Pty Ltd., Wangara, WA 6065, Australia, for supplying microbial consortium inoculant and polymer-coated rock mineral fertiliser.

Conflicts of Interest

The authors declare no conflict of interest.

References

  1. Zhang, G.; Zhao, D.; Liu, S.; Liao, Y.; Han, J. Can controlled-release urea replace the split application of normal urea in China? A meta-analysis based on crop grain yield and nitrogen use efficiency. Field Crops Res. 2022, 275, 108343. [Google Scholar] [CrossRef]
  2. Teng, W.; He, X.; Tong, Y. Genetic control of efficient nitrogen use for high yield and grain protein concentration in wheat: A review. Plants 2022, 11, 492. [Google Scholar] [CrossRef] [PubMed]
  3. Zhang, G.; Liu, S.; Liao, Y.; Han, J. A nitrogen fertilizer strategy for simultaneously increasing wheat grain yield and protein content: Mixed application of controlled-release urea and normal urea. Field Crops Res. 2022, 277, 108405. [Google Scholar] [CrossRef]
  4. Food and Agriculture Organization. World Food and Agricultur-Statistical Yearbook 2021; FAO: Rome, Italy, 2021. [Google Scholar]
  5. Manschadi, A.M.; Soltani, A. Variation in traits contributing to improved use of nitrogen in wheat: Implications for genotype by environment interaction. Field Crops Res. 2021, 270, 108211. [Google Scholar] [CrossRef]
  6. Koryagin, Y.; Kulikova, E.; Efremova, S.; Sukhova, N. The influence of microbiological fertilisers on the productivity and quality of winter wheat. Plant Soil Environ. 2020, 66, 564–568. [Google Scholar] [CrossRef]
  7. Mălinaş, A.; Vidican, R.; Rotar, I.; Mălinaş, C.; Moldovan, C.M.; Proorocu, M. Current status and future prospective for nitrogen use efficiency in wheat (Triticum aestivum L.). Plants 2022, 11, 217. [Google Scholar] [CrossRef]
  8. Lollato, R.P.; Jaenisch, B.R.; Silva, S.R. Genotype-specific nitrogen uptake dynamics and fertilizer management explain contrasting wheat protein concentration. Crop Sci. 2021, 61, 2048–2066. [Google Scholar] [CrossRef]
  9. Tabak, M.; Lepiarczyk, A.; Filipek-Mazur, B.; Lisowska, A. Efficiency of nitrogen fertilization of winter wheat depending on sulfur fertilization. Agronomy 2020, 10, 1304. [Google Scholar] [CrossRef]
  10. Dawson, J.C.; Huggins, D.R.; Jones, S.S. Characterizing nitrogen use efficiency in natural and agricultural ecosystems to improve the performance of cereal crops in low-input and organic agricultural systems. Field Crops Res. 2008, 107, 89–101. [Google Scholar] [CrossRef]
  11. Raun, W.R.; Johnson, G.V. Improving nitrogen use efficiency for cereal production. Agron. J. 1999, 91, 357–363. [Google Scholar] [CrossRef]
  12. Trenkel, M.E. Slow-and Controlled-Release and Stabilized Fertilizers: An Option For Enhancing Nutrient Use Efficiency in Agriculture; IFA, International fertilizer industry association: Paris, France, 2010. [Google Scholar]
  13. Ghafoor, I.; Habib-ur-Rahman, M.; Ali, M.; Afzal, M.; Ahmed, W.; Gaiser, T.; Ghaffar, A. Slow-release nitrogen fertilizers enhance growth, yield, NUE in wheat crop and reduce nitrogen losses under an arid environment. Environ. Sci. Pollut. Res. 2021, 28, 43528–43543. [Google Scholar] [CrossRef] [PubMed]
  14. Feng, X.; Zhan, X.; Han, X.; Chen, K.; Peng, J.; Wang, X.; Shang, D. Slow-release nitrogen fertiliser suitable for one-time fertilisation of spring maize in Northeast China. Plant Soil Environ. 2021, 67, 164–172. [Google Scholar] [CrossRef]
  15. Vejan, P.; Khadiran, T.; Abdullah, R.; Ahmad, N. Controlled release fertilizer: A review on developments, applications and potential in agriculture. J. Control. Release 2021, 339, 321–334. [Google Scholar] [CrossRef]
  16. Beig, B.; Niazi, M.B.K.; Jahan, Z.; Hussain, A.; Zia, M.H.; Mehran, M.T. Coating materials for slow release of nitrogen from urea fertilizer: A review. J. Plant Nutr. 2020, 43, 1510–1533. [Google Scholar] [CrossRef]
  17. De Santis, M.A.; Giuliani, M.M.; Flagella, Z.; Reyneri, A.; Blandino, M. Impact of nitrogen fertilisation strategies on the protein content, gluten composition and rheological properties of wheat for biscuit production. Field Crops Res. 2020, 254, 1–10. [Google Scholar] [CrossRef]
  18. Adesemoye, A.O.; Torbert, H.A.; Kloepper, J.W. Enhanced plant nutrient use efficiency with PGPR and AMF in an integrated nutrient management system. Can. J. Microbiol. 2008, 54, 876–886. [Google Scholar] [CrossRef] [Green Version]
  19. Assainar, S.K.; Abbott, L.K.; Mickan, B.S.; Storer, P.J.; Whiteley, A.S.; Siddique, K.H.M.; Solaiman, Z.M. Polymer-coated rock mineral fertilizer has potential to substitute soluble fertilizer for increasing growth, nutrient uptake, and yield of wheat. Biol. Fertil. Soils 2020, 56, 381–394. [Google Scholar] [CrossRef]
  20. Assainar, S.K.; Abbott, L.K.; Mickan, B.S.; Whiteley, A.S.; Siddique, K.H.M.; Solaiman, Z.M. Response of wheat to a multiple species microbial inoculant compared to fertilizer application. Front. Plant Sci. 2018, 9, 1601. [Google Scholar] [CrossRef] [Green Version]
  21. Tshewang, S.; Rengel, Z.; Siddique, K.H.M.; Solaiman, Z.M. Growth and nutrient uptake of temperate perennial pastures are influenced by grass species and fertilisation with a microbial consortium inoculant. J. Plant Nutr. Soil Sci. 2020, 183, 530–538. [Google Scholar] [CrossRef]
  22. Mickan, B.S.; Alsharmani, A.R.; Solaiman, Z.M.; Leopold, M.; Abbott, L.K. Plant-dependent soil bacterial responses following amendment with a multispecies microbial biostimulant compared to rock mineral and chemical fertilizers. Front. Plant Sci. 2020, 11, 1–13. [Google Scholar] [CrossRef]
  23. Bashan, Y.; Holguin, G. Proposal for the division of plant growth-promoting Rhizobacteria into two classifications: Biocontrol-PGPB (Plant Growth-Promoting Bacteria) and PGPB. Soil Biol. Biochem. 1998, 30, 1225–1228. [Google Scholar] [CrossRef]
  24. Owen, D.; Williams, A.P.; Griffith, G.W.; Withers, P.J.A. Use of commercial bio-inoculants to increase agricultural production through improved phosphrous acquisition. Appl. Soil Ecol. 2015, 86, 41–54. [Google Scholar] [CrossRef]
  25. Calvo, P.; Nelson, L.; Kloepper, J.W. Agricultural uses of plant biostimulants. Plant Soil 2014, 383, 3–41. [Google Scholar] [CrossRef] [Green Version]
  26. Caradonia, F.; Battaglia, V.; Righi, L.; Pascali, G.; La Torre, A. Plant biostimulant regulatory framework: Prospects in Europe and current situation at international level. J. Plant Growth Regul. 2019, 38, 438–448. [Google Scholar] [CrossRef]
  27. Sible, C.N.; Seebauer, J.R.; Below, F.E. Plant biostimulants: A categorical review, their implications for row crop production, and relation to soil health Indicators. Agronomy 2021, 11, 1297. [Google Scholar] [CrossRef]
  28. Tshewang, S.; Rengel, Z.; Siddique, K.H.M.; Solaiman, Z.M. Microbial consortium inoculant increases pasture grasses yield in low-phosphorus soil by influencing root morphology, rhizosphere carboxylate exudation and mycorrhizal colonisation. J. Sci. Food Agric. 2021, 102, 540–549. [Google Scholar] [CrossRef] [PubMed]
  29. Barton, L.; Flottmann, S.J.; Stefanovia, K.T.; Colmer, T.D. Approaches to scheduling water allocations to kikuyugrass grown on a water repellent soil in drying-climate. Agric. Water Manag. 2020, 230. [Google Scholar] [CrossRef]
  30. Rayment, G.E.; Lyons, D.J.; Shelley, B. Soil chemical methods-Australasia. In Australian Soil and Land Survey Handbooks Series; CSIRO Publishing: Melbourne, VIC, Australia, 2011. [Google Scholar]
  31. Tshering, K.; Rengel, Z.; Storer, P.J.; Solaiman, Z.M. Novel rock mineral fertiliser application with microbial consurtium inoculant enhances growth, yield and grain protein content of wheat (Triticum aestivum L.) in sandy soil. Arch. Agron. Soil Sci. 2022, 1–16. [Google Scholar] [CrossRef]
  32. Zadoks, J.C.; Chang, T.T.; Konzak, C.F. A decimal code for growth stages of cereals. Weed Res. 1974, 14, 415–421. [Google Scholar] [CrossRef]
  33. Malik, A.I.; Veres, S.; Rengel, Z. Differential nitrogen-use efficiency in wheat parents of doubled-haploid mapping populations. Plant Soil 2016, 408, 311–325. [Google Scholar] [CrossRef]
  34. Xu, Q.; Krishnan, S.; Merewitz, E.; Xu, J.; Huang, B. Gibberellin-regulation and genetic variations in leaf elongation for tall fescue in association with differential gene expression controlling cell expansion. Sci. Rep. 2016, 6, 30258. [Google Scholar] [CrossRef]
  35. Khan, M.S.A.; Abbott, L.K.; Solaiman, Z.M.; Mawson, P.R.; Waite, I.S.; Jenkins, S.N. Complementary effect of zoo compost with mineral nitrogen fertilization increases wheat yield and nutrition in a low-nutrient soil. Pedosphere 2022, 32, 339–347. [Google Scholar] [CrossRef]
  36. Jensen, S.M.; Svensgaard, J.; Ritz, C. Estimation of the harvest index and the relative water content—Two examples of composite variables in agronomy. Eur. J. Agron. 2020, 112, 1–8. [Google Scholar] [CrossRef]
  37. McGonigle, T.P.; Miller, M.H.; Evans, D.G.; Fairchild, G.L.; Swan, J.A. A new method which gives an objective measure of colonization of roots by vesicular-arbuscular mycorrhizal fungi. New Phytol. 1990, 115, 495–501. [Google Scholar] [CrossRef]
  38. Kibria, M.G.; Barton, L.; Rengel, Z. Foliar application of magnesium mitigates soil acidity stress in wheat. J. Agron. Crop Sci. 2021, 207, 378–389. [Google Scholar] [CrossRef]
  39. Bouma, T.J.; Nielsen, K.L.; Koutstaal, B.A.S. Sample preparation and scanning protocol for computerised analysis of root length and diameter. Plant Soil 2000, 218, 185–196. [Google Scholar] [CrossRef]
  40. Dhillon, J.; Eickhoff, E.; Aula, L.; Omara, P.; Weymeyer, G.; Nambi, E.; Oyebiyi, F.; Carpenter, T.; Raun, W. Nitrogen management impact on winter wheat grain yield and estimated plant nitrogen loss. Agron. J. 2020, 112, 564–577. [Google Scholar] [CrossRef] [Green Version]
  41. Metho, L.A.; Taylor, J.R.N.; Hammes, P.S.; Randall, P.G. Effects of cultivar and soil fertility on grain protein yield, grain protein content, flour yield and breadmaking quality of wheat. J. Sci. Food Agric. 1999, 79, 1823–1831. [Google Scholar] [CrossRef]
  42. Hawkesford, M.J.; Griffiths, S. Exploiting genetic variation in nitrogen use efficiency for cereal crop improvement. Curr. Opin. Plant Biol. 2019, 49, 35–42. [Google Scholar] [CrossRef]
  43. Duncan, E.G.; O’ Sullivan, C.A.; Roper, M.M.; Palta, J.; Whisson, K.; Peoples, M.B. Yield and nitrogen use efficiency of wheat increased with root length and biomass due to nitrogen, phosphorus, and potassium interactions. J. Plant Nutri. Soil Sci. 2018, 181, 364–373. [Google Scholar] [CrossRef]
  44. Yang, Y.-C.; Zhang, M.; Zheng, L.; Cheng, D.-D.; Liu, M.; Geng, Y.-Q. Controlled release urea improved nitrogen use efficiency, yield, and quality of wheat. Agron. J. 2011, 103, 479–485. [Google Scholar] [CrossRef]
  45. Li, G.-H.; Cheng, G.-G.; Lu, W.-P.; Lu, D.-L. Differences of yield and nitrogen use efficiency under different applications of slow release fertilizer in spring maize. J. Integr. Agric. 2021, 20, 554–564. [Google Scholar] [CrossRef]
  46. Hett, J.; Neuhoff, D.; Döring, T.F.; Masoero, G.; Ercole, E.; Bevivino, A. Effects of multi-species mcrobial inoculants on early wheat growth and litterbag microbial activity. Agronomy 2022, 12, 899. [Google Scholar] [CrossRef]
  47. Rekowski, A.; Wimmer, M.A.; Hitzmann, B.; Hermannseder, B.; Hahn, H.; Zörb, C. Application of urease inhibitor improves protein composition and bread-baking quality of urea fertilized winter wheat. J. Plant Nutr. Soil Sci. 2020, 183, 260–270. [Google Scholar] [CrossRef] [Green Version]
  48. Zhang, H.; Turner, N.C.; Poole, M.L. Source-sink balance and manipulating sink-source relations of wheat indicate that the yield potential of wheat is sink-limited in high-rainfall zones. Crop Pasture Sci. 2010, 61, 852–861. [Google Scholar] [CrossRef]
  49. Zheng, W.; Liu, Z.; Zhang, M.; Shi, Y.; Zhu, Q.; Sun, Y.; Zhou, H.; Li, C.; Yang, Y.; Geng, J. Improving crop yields, nitrogen use efficiencies, and profits by using mixtures of coated controlled-released and uncoated urea in a wheat-maize system. Field Crops Res. 2017, 205, 106–115. [Google Scholar] [CrossRef]
  50. Ma, Q.; Wang, M.; Zheng, G.; Yao, Y.; Tao, R.; Zhu, M.; Ding, J.; Li, C.; Guo, W.; Zhu, X. Twice-split application of controlled-release nitrogen fertilizer met the nitrogen demand of winter wheat. Field Crops Res. 2021, 267, 108163. [Google Scholar] [CrossRef]
  51. Geng, J.; Chen, J.; Sun, Y.; Zheng, W.; Tian, X.; Yang, Y.; Li, C.; Zhang, M. Controlled release urea improved nitrogen use efficiency and yield of wheat and corn. Agron. J. 2016, 108, 1666–1673. [Google Scholar] [CrossRef]
  52. Zörb, C.; Ludewig, U.; Hawkesford, M.J. Perspective on wheat yield and quality with reduced nitrogen supply. Trends Plant Sci. 2018, 23, 1029–1037. [Google Scholar] [CrossRef] [Green Version]
  53. Farmaha, B.S.; Sims, A.L. The influence of polymer-coated urea and urea fertilizer mixtures on spring wheat protein concentrations and economic returns. Agron. J. 2013, 105, 1328–1334. [Google Scholar] [CrossRef]
  54. Li, J.; Wang, Z.; Yao, C.; Zhang, Z.; Liu, Y.; Zhang, Y. Micro-sprinkling irrigation simultaneously improves grain yield and protein concentration of winter wheat in the North China Plain. Crop J. 2021, 9, 1397–1407. [Google Scholar] [CrossRef]
Figure 1. (a) Effect of fertiliser type (Ft) × fertiliser rate (Fr) (mean ± SE, n = 8) on 3rd leaf extension rate (LER) and (b) main effect of Fr (mean ± SE, n = 16) on chlorophyll content (SPAD value). Mean values followed by the same letter are not statistically different as per Tukey’s HSD at p ≤ 0.05. Three-way ANOVA (Table 1) showed the significant interaction effect of Ft × Fr (p =< 0.001) on LER and only the significant main effect of Fr (p =< 0.001) regarding chlorophyll content. Control, no fertiliser; IF, inorganic fertiliser; RMF, rock mineral fertiliser.
Agronomy 12 02481 g001
Figure 2. The interaction effect of fertiliser type (Ft) × fertiliser rate (Fr) × microbial inoculant (MI) (mean ± SE, n = 12) on dry shoot weight (a) at anthesis and (b) at maturity. In (a) and (b) separately, mean values followed by the same letter are not statistically different as per Tukey’s HSD test at p ≤ 0.05. Three-way ANOVA (Table 1) showed significant interaction of Ft × Fr × MI at both growth stages. Control, no fertiliser; IF, inorganic fertiliser; RMF, rock mineral fertiliser.
Agronomy 12 02481 g002
Figure 3. The effect of (a) fertiliser type (Ft) × fertiliser rate (Fr) × microbial inoculant (MI) (mean ± SE, n = 12) on dry root weight at anthesis and (b) Fr × MI (mean ± SE, n = 8) at maturity. In (a) and (b) separately, means followed by the same letter are not statistically different as per Tukey’s HSD test at p ≤ 0.05. Three-way ANOVA showed significant interaction of Ft × Fr × MI (p = 0.032) on dry root weight at anthesis and Fr × MI (p = 0.041) at maturity (Table 1). Control, no fertiliser; IF, inorganic fertiliser; RMF, rock mineral fertiliser.
Agronomy 12 02481 g003
Figure 4. Shoot N content as influenced by the effect of (a) fertiliser type (Ft) × fertiliser rate (Fr) (mean ± SE, n = 8) at anthesis, and (b) Ft × Fr × microbial inoculant (MI) (mean ± SE, n = 12) at maturity. Grain N concentration (c) as influenced by Ft × Fr (mean ± SE, n = 8), and grain N content (d) as influenced by the significant 3-way interaction Ft × Fr × MI (mean ± SE, n = 12). In each of a-d, mean values followed by the same letter are not statistically different as per Tukey’s HSD test at p ≤ 0.05. Three-way ANOVA (Table 1) showed significant interaction of Ft × Fr (p < 0.001) on shoot N content at anthesis and Ft × Fr × MI (p = 0.039) at maturity, Ft × Fr (p = 0.025) on grain N concentration and Ft × Fr × MI (p = 0.047) on grain N content. Control, no fertiliser; IF, inorganic fertiliser; RMF, rock mineral fertiliser; dw, dry weight.
Agronomy 12 02481 g004
Figure 5. Shoot N uptake efficiency (NUpEshoot) as influenced by the effect of (a) fertiliser type (Ft) × fertiliser rate (Fr) (mean ± SE, n = 8), and (b) Ft × microbial inoculant (MI) (mean ± SE, n = 8). In (a) and (b) separately, mean values followed by the same letter are not statistically different as per Tukey’s HSD test at p ≤ 0.05. Three-way ANOVA (Table 1) showed significant interaction of Ft × Fr (p = 0.005) and Ft × MI (p = 0.006) on NUpEshoot. IF, inorganic fertiliser; RMF, rock mineral fertiliser.
Agronomy 12 02481 g005
Figure 6. Effect of fertiliser type (Ft) × fertiliser rate (Fr) × microbial inoculant (MI) (mean ± SE, n = 12) on (a) N-use efficiency (NUE) and (b) grain N uptake efficiency (NUpEgrain). In (a) and (b) separately, mean values followed by the same letter are not statistically different as per Tukey’s HSD test at p ≤ 0.05. Three-way ANOVA (Table 1) showed significant interaction of Ft × Fr × MI on NUE (p = 0.044) and NUpEgrain (p = 0.038). IF, inorganic fertiliser; RMF, rock mineral fertiliser; MT, microbial inoculant.
Agronomy 12 02481 g006
Figure 7. Correlation coefficients of different N-use efficiency indices with grain yield and grain protein yield. The shaded circle area shows the absolute value of the corresponding correlation coefficients. All the relationships were positive. An asterisk (*) indicates the significance at p < 0.01. GY, grain yield; GPY, grain protein yield; NUpEshoot, Shoot N uptake efficiency; NUE, N-use efficiency; NUpEgrain, grain N uptake efficiency.
Agronomy 12 02481 g007
Figure 8. (A) Fertiliser type (Ft) × microbial inoculant (MI) (mean ± SE, n = 12) effect on grain number and (B) Ft × Fr (fertiliser rate) × MI (mean ± SE, n = 4) effect on grain protein yield (GPY). Means followed by the same letter are not statistically different as par Tukey’s HSD at p ≤ 0.05. Three-way ANOVA (Table 3) showed a significant interaction of Ft × MI (p = 0.04) on grain number and Ft × Fr × MI (p = 0.047) on GPY. Control, no fertiliser; IF, inorganic fertiliser; RMF, rock mineral fertiliser.
Agronomy 12 02481 g008
Table 1. Analysis of variance (ANOVA) summary for wheat growth, N concentration and NUE parameters as influenced by fertiliser type (Ft), fertiliser rate (Fr), microbial inoculant (MI) and their interactions at anthesis and maturity. *, ** and *** denote significance at p ≤ 0.05, 0.01 and 0.001, respectively; ns, non-significant at p > 0.05.
VariablesFtFrMIFt × FrFt × MIFr × MIFt × Fr × MI
Anthesis
Shoot dry weight *****ns*nsns*
Root dry weight ns***ns***ns**
Leaf chlorophyll content (SPAD value)ns***nsnsnsnsns
3rd leaf extension rate nsnsns***nsnsns
Shoot N concentration ns****nsnsnsns
Shoot N content ******ns***nsnsns
Maturity
Shoot dry weight *******************
Root dry weightns***nsnsns*ns
Shoot N concentrationns*nsnsnsnsns
Shoot N content **********ns*
Grain N concentration ****ns*nsnsns
Grain N content ******ns****ns*
NUE parameters
NUE (mg grain mg−1 N available)***nsns***ns*
NUpEshoot (mg N in shoot mg−1 N available)************nsns
NUpEgrain (mg N in grain mg−1 N available)***nsns***ns*
Table 2. Shoot N concentration as influenced by fertiliser rate and microbial inoculant (MI) (mean ± SE) at anthesis and maturity. Mean values for a given treatment factor within a column followed by different letters differ significantly. Three-way ANOVA (Table 1) showed no significant interaction, with the main effects of fertiliser rate and MI being significant at anthesis and only fertiliser rate at maturity. The data on each fertiliser rate were averaged across two fertiliser types and two MI treatments (n = 16). The data on individual MI were averaged across three fertiliser rates and two fertiliser types (n = 24). dw, dry weight.
FactorFactor LevelsShoot N Concentration (g kg−1 dw)
Anthesis (Zadoks 65)Maturity (Zadoks 92)
Fertiliser rate (mg N kg−1 soil)017 ± 0.7 a4 ± 0.1 b
2313 ± 0.3 b5 ± 0.1 a
4616 ± 0.6 a5 ± 0.1 a
p value<0.0010.012
Microbial inoculant (MI)With MI17 ± 0.6 a
Without MI15 ± 0.4 b
p value0.0140.377
Table 3. Analysis of variance (ANOVA) summary assessing the effects of fertiliser type (Ft), fertiliser rate (Fr), microbial inoculant (MI) and their interactions on yield components, protein concentration and yield, and root morphology of wheat. *, ** and *** denote significance at p ≤ 0.05, 0.01 and 0.001, respectively; ns, non-significant at p > 0.05.
VariablesFtFrMIFt × FrFt × MIFr × MIFt × Fr × MI
Grain number******ns***nsns
Grain yield******ns***nsnsns
1000-grain weightns***nsnsnsnsns
Harvest indexns***nsnsnsnsns
Grain protein concentration*****ns*nsnsns
Grain protein yield******ns****ns*
Total root lengthns***ns***nsnsns
Specific root length ns***nsnsnsnsns
Root surface area ns***ns***nsnsns
Average root diameter (D) ns***nsnsnsnsns
Fine root (0 < D ≤ 0.2 mm) lengthns***ns***nsnsns
Coarse root (D > 0.2 mm) length ns***nsnsnsnsns
Table 4. Grain number, yield and protein concentration as influenced by the interaction effect of fertiliser type (Ft) and fertiliser rate (Fr). Three-way ANOVA (Table 3) showed significant interaction effect of Ft × Fr (mean ± SE, n = 8). Means within a column followed by different letters differ significantly. Control, no fertiliser; IF, inorganic fertiliser; RMF, rock mineral fertiliser; dw, dry weight.
Factor Level
(mg N kg−1 Soil)
Grain Number
(Plant−1)
Grain Yield
(g Plant−1)
Grain Protein
Concentration
(g kg−1 dw)
Control19 ± 0.8 d0.9 ± 0.03 e98 ± 1.9 a
IF at 2366 ± 3.5 c2.5 ± 0.11 d83 ± 0.6 bc
RMF at 23101 ± 6.4 b3.6 ± 0.20 c85 ± 1.8 bc
IF at 46123 ± 6.7 a4.3 ± 0.08 b79 ± 1.5 c
RMF at 46136 ± 8.9 a5.1 ± 0.25 a89 ± 2.5 b
p value0.008<0.0010.025
Table 5. Total root length, root surface area and fine root length as influenced by the interaction effect of fertiliser type (Ft) and fertiliser rate (Fr). Three-way ANOVA (Table 3) showed significant interaction effect of Ft × Fr (mean ± SE, n = 8). Means within a column followed by different letters differ significantly. Control, no fertiliser; IF, inorganic fertiliser; RMF, rock mineral fertiliser; D, average root diameter.
Factor Level
(mg N kg−1 Soil)
Total Root Length (m pot−1)Root Surface Area (cm2 pot−1)Fine Root (0 < D ≤ 0.2 mm) Length (m pot−1)
Control 147 ± 14 e85 ± 8 d125 ± 12 d
IF at 23465 ± 40 d499 ± 41 c330 ± 30 c
RMF at 23665 ± 24 c730 ± 35 b487 ± 24 b
IF at 46961 ± 34 a1052 ± 60 a674 ± 47 a
RMF at 46802 ± 43 b900 ± 75 ab528 ± 58 ab
p value<0.001<0.001<0.001
Table 6. Specific root length, root diameter and coarse root length as influenced by fertiliser rate (mean ± SE). Mean values within a column followed by different letters differ significantly. Three-way ANOVA (Table 3) showed no significant interaction, with the main effects of fertiliser rate being significant. The data on each fertiliser rate were averaged across two fertiliser types and two microbial inoculant treatments (n = 16). D, average root diameter.
Fertiliser Rate (mg N kg−1 Soil)Specific Root Length
(m g−1)
Average Root
Diameter (mm)
Coarse Root (D > 0.2 mm) Length (m pot−1)
0529 ± 24 a0.18 ± 0.003 b22 ± 2 c
23254 ± 9 b0.23 ± 0.002 a157 ± 9 b
46242 ± 6 b0.24 ± 0.004 a261 ± 9 a
p value<0.001<0.001<0.001
Publisher’s Note: MDPI stays neutral with regard to jurisdictional claims in published maps and institutional affiliations.

