Article

Agronomic Efficiency of Phosphorus Fertilisers Recovered from Milk Processing Waste

Faculty of Science and Engineering, Southern Cross University, Lismore, NSW 2480, Australia
*
Author to whom correspondence should be addressed.
Agronomy 2022, 12(10), 2341; https://doi.org/10.3390/agronomy12102341
Submission received: 6 September 2022 / Revised: 27 September 2022 / Accepted: 27 September 2022 / Published: 28 September 2022

Abstract

:
The recovery of phosphorus (P) from milk processing flotation sludges (MFS) using pyrolysis can contribute to a sustainable reuse of P by converting waste to fertiliser. The objectives of this study were to quantify the recovery and transformation of P following MFS pyrolysis and compare the efficacy of raw and pyrolysed MFS as organic P fertilisers. Phosphorus retention in biochars was high (98 ± 0.73% yield), leading to the enrichment of P relative to the raw MFS by a factor of 4.3–4.5. Pyrolysis of the MFS at 450 °C led to a 3-fold increase in the proportion of P in the HCl-extractable fraction (65 ± 0.32%), a 2-fold reduction in NaOH-P (30 ± 2.1%), and negligible amounts of P in the H2O-P and NaHCO3-P fractions. The bioavailability of P in raw MFS and 450 °C biochar was compared to a soluble P fertiliser in P-limiting plant bioassays. In the short-term (70 day) trial where ryegrass was grown on three soil types (Arenosol, Vertisol or Ferralsol), biochar MFS showed higher efficacy as a P fertiliser than raw MFS in the acidic Ferralsol, whereas the opposite response was observed in the near-neutral Arenosol. In the Vertisol, neither the raw MFS nor biochar produced more cumulative biomass or P uptake than any of the nil P controls. Over a longer 200-day period, raw MFS and biochar applied to the Arenosol were about 20% as efficient at providing P to ryegrass plants as the water-soluble K2PO4, suggesting that higher application rates of MFS or biochar would be required to match synthetic fertilisers in the short term.

Graphical Abstract

1. Introduction

The dairy processing industry produces large amounts of wastewater globally, as well as solid processing sludge [1]. The solid wastes are carbon (C)-rich, but are also high in both phosphorus (P) and nitrogen (N) [2]. While this can be problematic for waste disposal, it also presents an opportunity for energy capture from these wastes and the potential to generate nutrient-rich amendments for use in agriculture [3].
Dairy processing sludges are commonly recovered from biochemical activation, dissolved air flotation (DAF), and anaerobic digestion wastewater treatment processes. Typical reported nutrient values in dairy sludges are in the range of 19–70 mg kg−1 (N), 14–65 mg kg−1 (P), and 6–15 mg kg−1 (K), with P concentrations routinely higher in DAF sludges [2,4]. Elevated levels of aluminium, iron, or calcium may also be found in DAF sludges depending on the flocculent agents used. Sludge compositions ultimately depend on the dairy products produced and the wastewater treatments employed [4]. While raw sludges may have value as a fertiliser product, in their raw form they can contain pathogens and pharmaceuticals and also have a relatively high moisture content that restricts transport distances and hampers spreading on fields [5]. As such, numerous sludge treatment methods have been configured either as disposal mechanisms or to derive additional value-added products. Sludge anaerobic digestion [6] for bioenergy generation (biomethane) and composting [7] to recover nutrients in a more useable biofertiliser form have been exploited. More recently, the pyrolysis or thermal decomposition of sludge organics has gained attention as an alternative sludge treatment process, in part because multiple value-added products can be produced. Pyrolysis also offers sludge sterilisation, thereby reducing health and environmental risk, and a significant reduction in sludge volume [5]. Pyrolysis typically yields a C and nutrient dense solid (biochar) for potential agricultural applications, along with condensable- (biooils) and non-condensable gases (syngas) for the production of bioenergy. Both the operating conditions and the nature of feedstock diversity heavily influence the complexity and yield of the final products [8,9]. Two studies to date have demonstrated the use of DAF sludge from milk processing (milk flotation sludge—MFS) and pyrolysis processing for generating both bioenergy and biochars products [10,11]. While both of these studies focused exclusively on the potential of bioenergy production, they only speculate on the likely application and value of the nutrient dense biochars.
At present, little is known about the agronomic efficiency of dairy MFS or corresponding pyrolysed sludge as a potential P fertiliser. In studies with biosolid-, woody waste-, and crop residue-derived biochar, the P in biochars appears relatively bioavailable in the short-to-medium term [12,13] although the bioavailability is affected by feedstock and biochar synthesis conditions [14,15,16]. With increasing pyrolysis temperature, biochars tend to have decreasing organic P concentrations, decreasing NaOH-extractable inorganic P concentrations, and increasing concentrations of ‘residual’ P when assessed using Hedley fractionation procedures [17]. Roberts et al. [18] also reported that over 90% of P in pyrolysed biosolids containing aluminium (flocculating agent in wastewater treatment) was plant-available, despite the raw biosolids with aluminium having negligible plant-available P. While dairy MFS also frequently contain aluminium, large amount of fats, protein and other volatile carbon materials, the bioavailability of P in raw solids and behaviour when pyrolysed is uncertain.
Australia is the world’s third largest exporter of raw milk, behind New Zealand and the European Union, and also produces over 92 kt of butter, 377 kt of cheese, and 273 kt of milk powder [19]. Owing to the export of large volumes of agricultural product overseas, Australia has a large P deficit that is currently met through the importation of non-renewable rock phosphate [20]. The waste generated by Australian dairy processing industries presents a key opportunity for the development of regionally based recycled P fertiliser. The aim of the present study was to investigate the recovery and bioavailability of P in MFS biochars compared to the raw MFS. We started by producing biochar from MFS under a range of operational temperatures to maximise biochar yields and P recovery. The P in resulting biochars were characterised using chemical extractability, and finally assessed for plant P bioavailability by conducting short- and medium-term plant bioassays in multiple soil types using ryegrass (Lolium perenne) as the test crop.

2. Materials and Methods

2.1. Materials

MFS was supplied by NORCO Foods Ltd. (Lismore, Australia) from their dissolved air floatation (DAF) unit treating milk processing effluents premixed with a flocculent agent (Core-Shell® 71303, Nalco, IL, USA). The physicochemical composition of MFS used in this study is presented in Table 1. The recovered MFS was dried at 50 °C for 48 h to reduce the moisture content prior to pyrolysis. To achieve better uniformity and further size reduction, samples were coarsely ground (≤10 mm) using mortar and pestle. All other chemicals including acids, bases, salts, solvents and analytical standards were of reagent grade or higher and purchased from Sigma Chemical Co. (St. Louis, MO, USA).

2.2. Pyrolysis of MFS

MFS was pyrolysed using slow pyrolysis at three target temperatures of 450 °C, 550 °C, and 650 °C in a 1 L-capacity laboratory scale fixed-bed reactor and externally heated using a laboratory furnace. These pyrolysis temperatures were selected based on a preliminary testes which showed temperature <450 °C failed to pyrolyse the MFS to completion, whereas, >650 °C resulted in significant losses in recovery yields of biochar and P. Typically, 200 g of dried MFS was sealed in the reactor and was heated from room temperature at a ramping rate of ~10 °C/min. Pyrolysis was performed under a constant flow of N as carrier gas to provide inert conditions and flush all gases produced during pyrolysis. After 45 min at the target temperature, the pyrolysis reactor was passively cooled. All pyrolysis experiments were performed in triplicate. During pyrolysis, all gases passed through two condensers in series where condensable liquids were quantitatively captured. The condensed pyrolytic liquids, including both the bottom phase (aqueous) and top phase (organic-rich bio-oils), were recovered together and weights recorded gravimetrically. The biochar and element yields were determined from the amount of initial pyrolysis feedstock and its elemental composition. The yield of non-condensable gases (NCG) was estimated by difference where: NCG (%) = 100 − (char mass + liquid mass).

2.3. Analytical Methods

Characterisation of raw MFS, biochars and soils were performed according to the following Rayment and Lyons [21] standard methods: pH (method—4A1); total C and N (method—6B2b) on a LECO TruMac Analyser (MI, USA); electrical conductivity (method —3A1); Bray and Colwell-P (method—9B2); exchangeable cations (method—15D3); DTPA extractable elements (method—12A1); elemental analysis (method—17C1) with an Inductively Coupled Plasma—Optical Emission Spectrophotometer (Perkin Elmer ICPOES Avio 500, Waltham, MA, USA) and estimated organic matter (calculated by Total C × 1.75). Total oils and greases according to the method (APHA 5520-D; hexane extractible) [22]. Volatile fatty acids (VFA) quantified according to HACH instrument method 8196, (https://de.hach.com/, accessed 29 June 2020) using a DR2700 spectrophotometer (Hach Lange GmbH, Düsseldorf, Germany). The ash and volatile solids (VS) were determined using the modified thermal analysis method [23] as follows: the CS and ash content was calculated as the weight loss after heating the samples at 450 °C for 1 h and the residue weight after then heating at 750 °C for 6 h, respectively.

2.4. Sequential P Extraction

Sequential P extraction was conducted to characterise the P fractions in the raw MFS and corresponding biochars produced at 450 °C based on the method described by Guppy et al. [24]. In brief, 0.5 g of dried solid material was sequentially extracted at a solid to liquid ratio of 1:60 (w/w) by H2O (H2O-P), 0.5 M NaHCO3 at pH 8.5 (NaHCO3-P), 0.1 M NaOH (NaOH-P) and 1 M HCl (HCl-P). Anion exchange resin strips were not used in the H2O extraction step. After 16 h of shaking incubation at 22 °C samples were centrifuged at 900 g/30 min and filtrate was recovered by filtration through glass microfiber grade 453 (Filtech, Wollongong, NSW, Australia). Total P concentration in filtrates was quantified by ICP-OES as described previously. Remaining P in the solid residue (Residual-P) quantified by digesting 0.2 g of solids in 5 mL aqua regia, then the P concentration assayed by ICP-OES.

2.5. Phosphorus-Limiting Plant Bioassays

To investigate both the short- and medium-term plant bioavailability of P in raw sludges and corresponding biochars, plant bioassays were conducted using ryegrass (Lolium perenne) as the test crop. In the short-term P bioavailability trial, raw MFS and the 450 °C MFS biochar were evaluated for their effect on plant growth in three soil types; a near-neutral Arenosol with low native P levels and a low P buffering index, an alkaline Vertisol and an acidic Ferralsol [25] over 70 days (10 weeks) of plant growth (two harvest cycles) (see Table 2 for major soil properties). For the medium-term P trial only the near-neutral Arenosol was used over a 200-day growth period (five harvest cycles).
For all plant experiments, free draining, 2 L black plastic pots were filled with 2 kg of air-dried soil. Other plant nutrients (except P) were added to the soil in excess, to ensure that P was the only limiting nutrient, by pipetting basal nutrients onto the surface of each pot and thoroughly mixing into the soil as per Rose et al. [26]. After 24 h, 1 kg of soil was removed from each pot and either raw MFS or biochar was thoroughly mixed at the necessary dose required to provide 100 mg total P kg−1 soil. Control pots either received 100 mg P in the top 1 kg of soil as water-soluble KH2PO4 (positive P control) or nil P (negative P control). Given that biochar can have a liming effect that influences availability of P in soil [27] additional control treatments were included to account for any potential pH-induced P mobilisation with raw or pyrolysed MFS additions. Additional pH-adjusted positive (K2HPO4) and negative (nil P) treatments were included with lime rates equivalent to those added by raw MFS and biochar MFS. The pH adjusted controls received either lime (positive pH control) or nil lime (negative pH control). Eight treatments were therefore imposed: nil P, nil P + biochar-equivalent lime (nil + BLE), nil P + raw-equivalent lime (nil P + RLE), raw MFS, biochar MFS, K2HPO4, K2HPO4 + biochar-equivalent lime (K2HPO4 +BLE) and K2HPO4 + raw-equivalent lime (K2HPO4 + RLE). Four replicate pots of all treatments were prepared and laid out in a randomised block design in a glasshouse at Southern Cross University, Lismore, NSW, Australia. Ryegrass seeds were sown 10 mm deep at 15 seeds per pot. Pots were watered to 70% soil field capacity. Plants were thinned to 10 plants per pot 10 days after sowing.
Ryegrass shoots were harvested when sufficient biomass was produced for analysis, which corresponded to 28 and 70 days post sowing for the short-term P-trial and at ~40-day intervals for the medium-term P-trial. Ryegrass shoots were harvested by cutting plants 10 mm from the soil surface. Nitrogen (NH4NO3 at 15 mg N kg−1 soil) was added after each harvest in dilute solution to ensure plant growth was not limited by N. Shoot samples were dried at 40 °C for 5 days when constant weight was reached. After drying, weights were recorded as biomass yields, plant material was finely ground and 0.2 g of subsample digested with 5 mL aqua regia, then the P concentration assayed by ICP-OES as detailed above. Plant P uptake was calculated by multiplying the biomass by the respective P concentration.
To estimate the recovery of applied P for the 200-day study and enable comparisons of our data with other published data, we calculated the apparent P fertiliser recovery (APFR) and net relative P uptake (NRPU) as per Kratz et al. [28]. The equations used to derive APFR and NRPU were:
APFR   ( % ) = ( P t P n ) ( P applied ) × 100 %  
where Pt is the P accumulation (mg) of tested product, Pn is P accumulation of the nil P control, and Papplied is the amount of P added per pot (mg).
NRPU   ( % ) = ( P t P n ) ( P p P n ) × 100 %
where Pt is the P accumulation (mg) of tested product, Pn is P accumulation of the nil P control, and Pp is the P accumulation of the +P control. Both APFR and NRPU remove any effects of native soil P supply and P in the ryegrass seeds sown. For statistical analysis treatment means were compared with a general linear model after data were screened for homogeneity of variances. Significant differences (at the 5% confidence level) were further interrogated using least significant difference testing in SPSS25 (https://www.ibm.com/products/spss-statistics, accessed 15 June 2022).

3. Results

3.1. Pyrolysis Distribution Products and Physiochemical Properties of Biochars

Major chemical compositions of the raw MFS and resulting biochars are presented in Table 1. Raw MFS had a high C content (55.6%) along with N (3.6%) and P (1.1%) relative to typical sludges and manure slurries [4]. From elemental analysis a range of plant micronutrients are also present in the MFS. Aluminium and iron were present in relatively high concentrations (3.6% and 1.1%, respectively) as a result of the flocculating agent used in the DAF process. A high VS fraction (82.4%) and low ash content (10%) is likely to result in a comparatively low pyrolysis biochar component. In fact, biochar mass yields ranged from about 21–23%, whereas condensable biooils were the main distribution product (~65–70%) (Supplementary Material Table S1). Increasing pyrolysis temperatures tended to decrease biochar yields and promote greater non-condensable gas production. A similar reduction in the recovery yields of most key elements at higher temperature settings was observed (Supplementary Material Table S2). Phosphorus retention in biochars was high, leading to enrichment of P relative to the raw sludge by factors of 4.3–4.5 (Table 1), reaching about 5% of biochar mass. Most other elemental components were enriched in the biochars although some key elements such as C and N were not well retained in the biochar with recoveries around 15% and 27%, respectively. In general, biochar produced at 450 °C had the greatest P and essential plant nutrient recoveries, and was used for ensuing experiments.

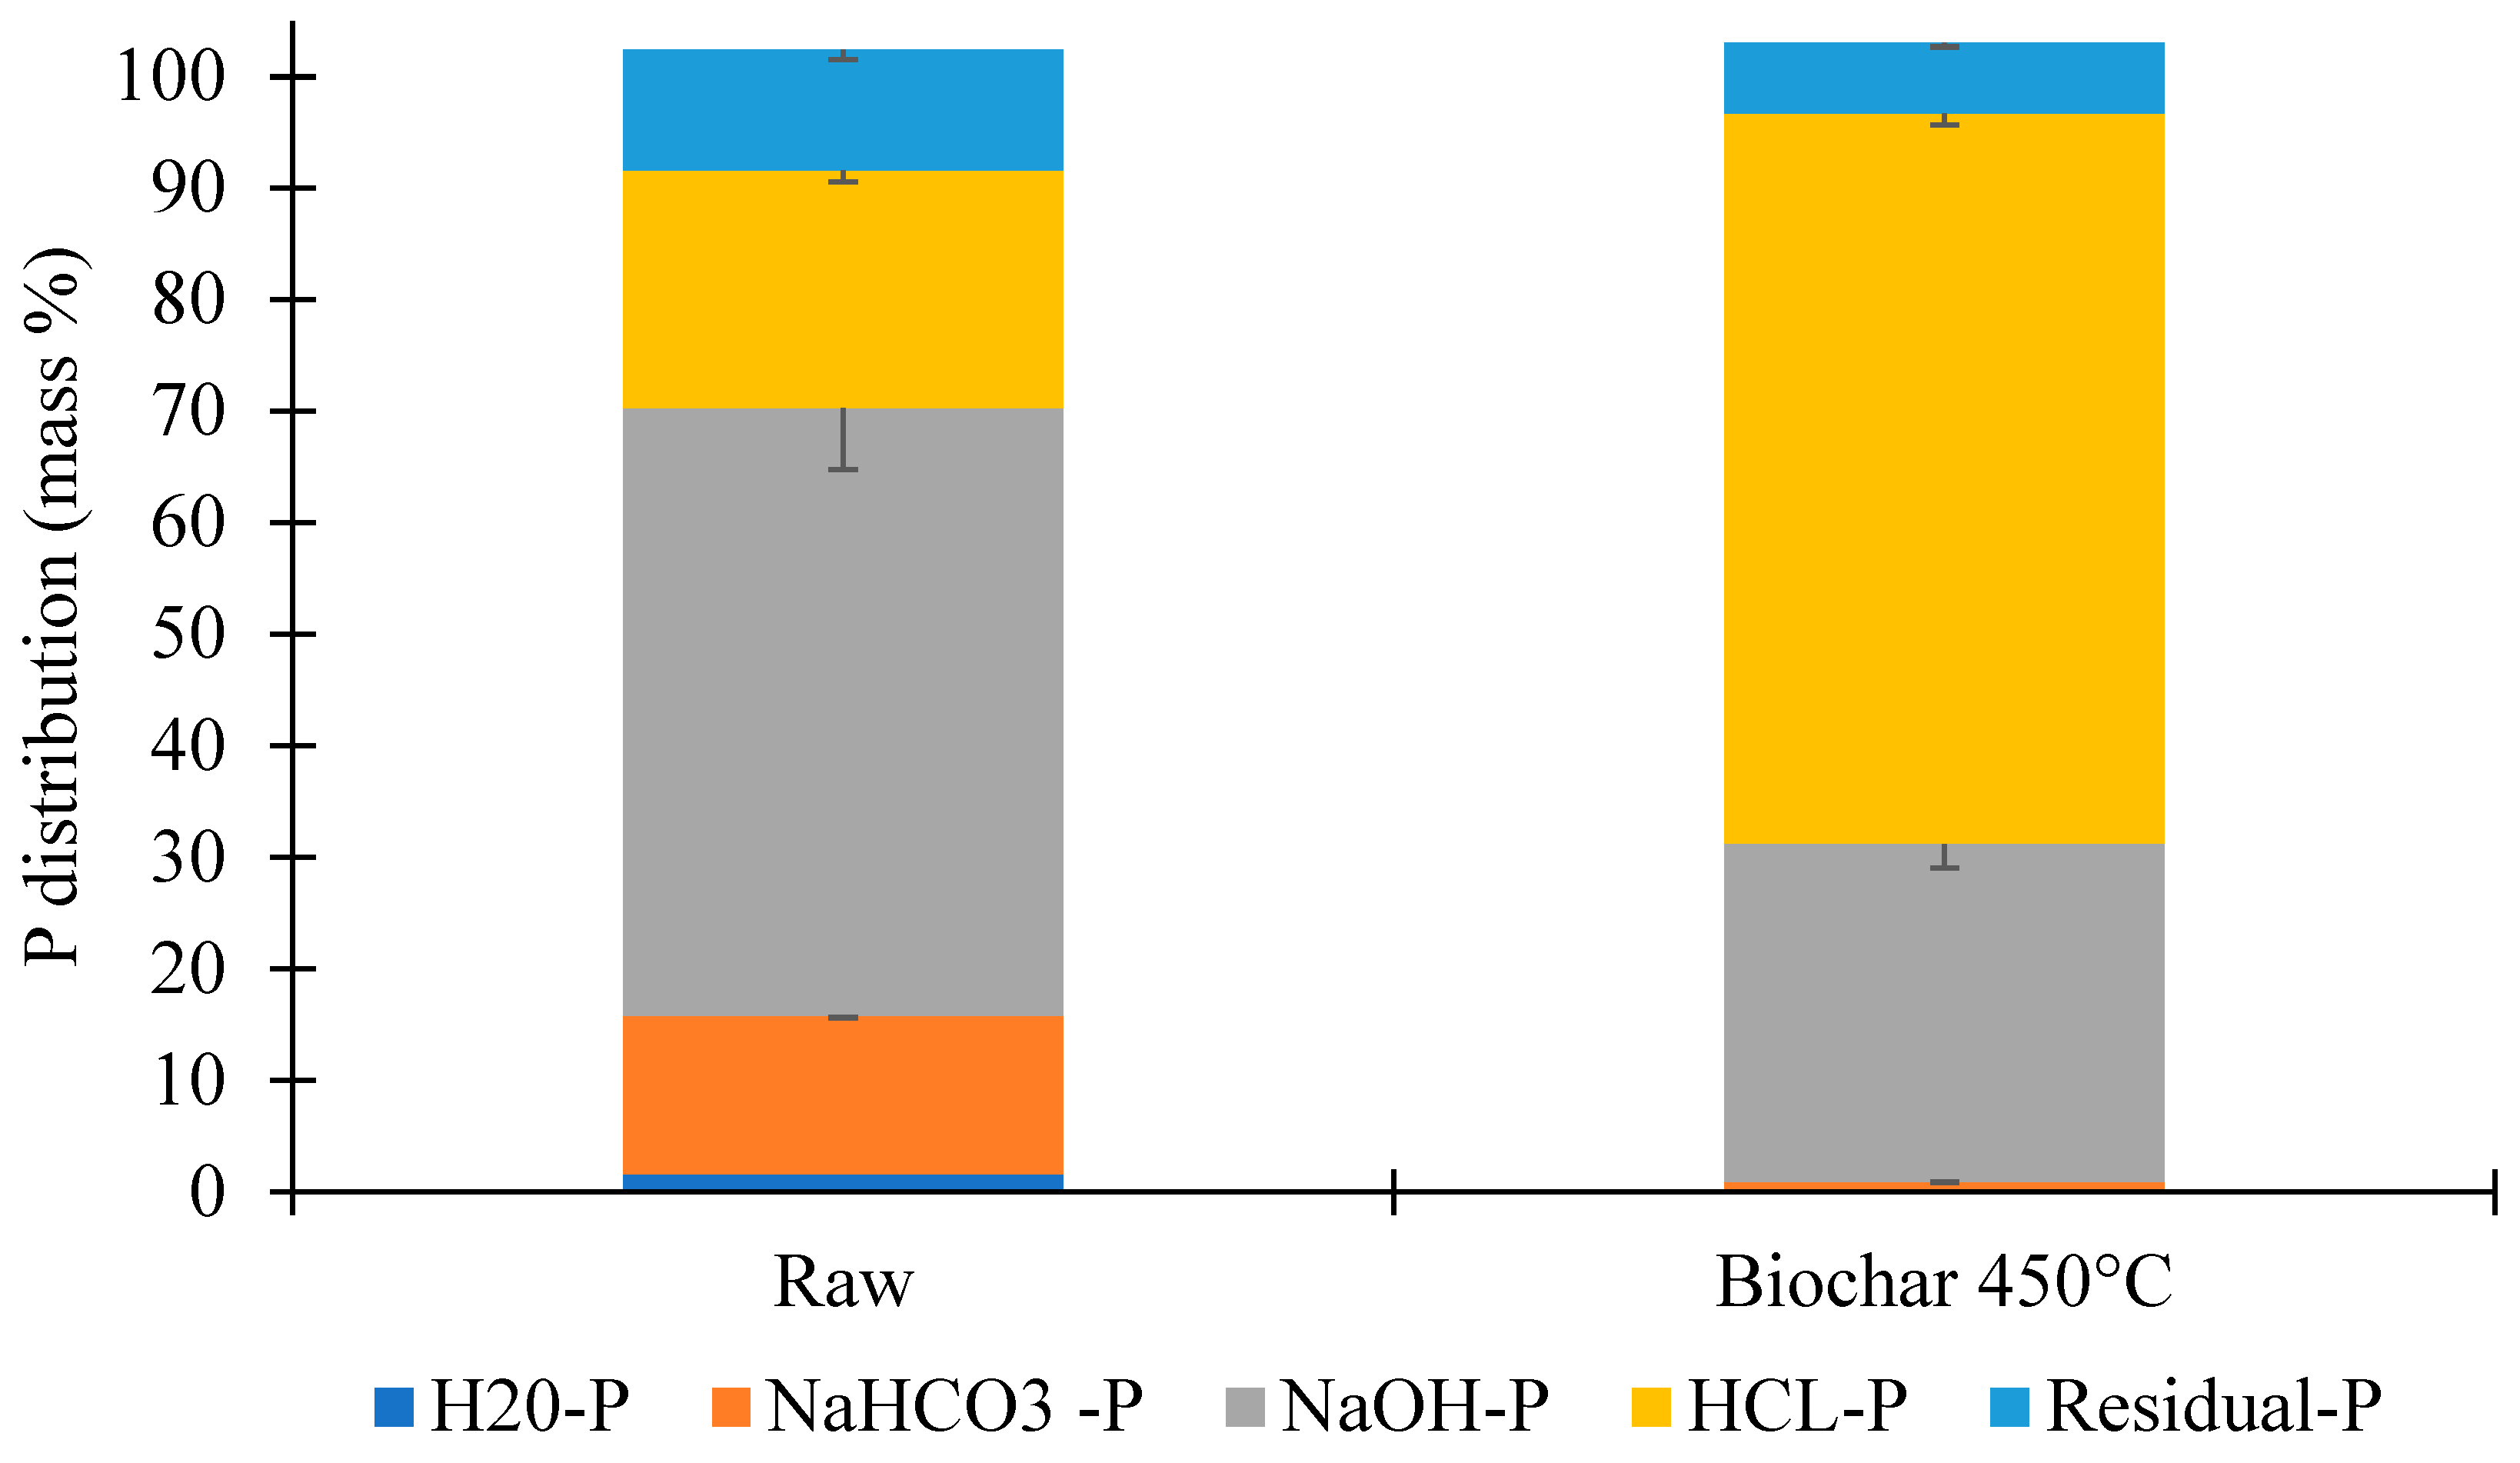
3.2. Transformation of Phosphorus Fractions

The effects of pyrolysis on the redistribution of P fractions based on sequential chemical extraction is summarised in Figure 1. In the raw MFS more than 50% of the P was recovered in the NaOH-extractable fraction with the remaining distributed between HCl-P (21%), NaHCO3-P (14%), H2O-P (2%) and residual-P (11%) fractions. Pyrolysis of the MFS at 450 °C led to an increase in the proportion of P in the HCl-extractable fraction (>60%), resulting in a 2-fold reduction in NaOH-P (30%) and negligible amounts of P in the H2O-P and NaHCO3-P fractions.

3.3. Short Term P Limiting Plant Bioassay

At 4 weeks after sowing, biomass and P accumulation in the nil-P treatment plus lime (either RLE or BLE) and raw MFS treatments were not significantly higher than the Nil-P treatment in any soil (Figure 2a–f). Biochar MFS had significantly greater biomass production than the nil P treatment at 4 weeks in all soil types, but P uptake was only significantly greater than the nil P treatment in the Vertisol and Arenosol. The K2HPO4 and K2HPO4 plus lime treatments had significantly greater biomass and P accumulation in shoots at 4 weeks than the nil and all other treatments in all soil types, with the exception of biomass accumulation in the Vertisol, where the biochar MFS was not significantly different to any of the K2HPO4 treatments.
At 10 weeks after sowing, cumulative biomass production (<1500 mg pot−1) and P uptake (<2000 μg pot−1) in the nil P treatments (with or without lime) in the Arenosol were significantly lower than in all other treatments (Figure 2a,d). Biomass production in the biochar MFS treatment (around 3000 mg pot−1) was significantly lower than biomass in the raw MFS and + P control treatments (with or without lime) of around 3500 mg pot−1 (Figure 2a). Despite biomass in the raw MFS being similar to that in the + P control treatments, P uptake in the raw MFS (around 7000 μg pot−1) was significantly lower than the +P control treatments (>18,000 μg pot−1) (Figure 2d) but still significantly higher than the biochar MFS treatment (<5000 μg pot−1).
In the Vertisol at 10 weeks, neither the raw MFS nor biochar MFS produced more cumulative biomass or P uptake than any of the nil P controls (Figure 2b,e) while all +P controls (with or without lime) had significantly higher P uptake than all other treatments (Figure 2e). Notably, while lime had no effect on P uptake in the nil P treatments, both nil P + RLE and nil P + BLE had significantly higher cumulative biomass production at 10 weeks than the un-limed nil P control (Figure 2b).
In the acidic Ferralsol at 10 weeks after sowing, the raw MFS did not produce more biomass or P uptake than any nil P treatments (Figure 2c,f). The biochar MFS treatment had significantly higher biomass production (around 400 mg pot−1) and P uptake (around 4000 μg pot−1) than the raw MFS and nil P control, but lower biomass and P uptake than all +P control treatments (Figure 2c,f). The K2HPO4 + BLE treatment accumulated significantly more P than the K2HPO4 and K2HPO4 + RLE treatments.

3.4. Medium-Term P Limiting Plant Bioassay

Cumulative biomass in the raw MFS and biochar MFS showed a similar trend to that of the K2HPO4 control over time, but total accumulated biomass after 200 days was highest in the K2HPO4 control treatment (approximately 16 g pot−1), compared to 15 g pot−1 and 13 g pot−1 in the raw and pyrolysed MFS, respectively (Figure 3a). Cumulative biomass after 200 days was only 4.4 g pot−1 in the nil-P control (Figure 3a). Cumulative P accumulation after 200 days was four-fold higher in the +P control pots (around 54 mg pot−1) than the raw and pyrolysed MFS-treated pots (13–14 mg pot−1) (Figure 3b). Cumulative P accumulation in the nil-P treatment was minimal with only 3 mg P pot−1 taken up by ryegrass plants over the five harvests.
The APFU of raw MFS and biochar MFS were low at all harvest points, and by 200 days only around 10% of the P added in the amendments had been recovered in ryegrass shoots, compared to around 50% of P applied as K2HPO4 (Table 3). The NRPU was substantially higher in the biochar MFS than raw MFS up to 87 day after sowing but was similar (about 20%) by 200 days after sowing.

4. Discussion

The recycling of P from waste products is essential for sustainable agriculture. Little is known about the agronomic value of raw or pyrolysed MFS from dairy processing as a P fertiliser. Given the unique composition of MFS, slow pyrolysis processing using different temperature variables was examined to maximise the partitioning of P in biochars. The high rates of P recovery (98%) and enrichment (>4-fold) obtained are in good agreement with earlier studies which report the vast majority of P being recoverable in chars [13,29]. Despite the low operational temperatures (450 °C) suited to MFS pyrolysis, elements such as C and N were not well retained, which is not ideal given any effective recycling strategy should aim to maximise the full spectrum of valuable elements. However, recent studies have demonstrated mineral modification during pyrolysis increased C retention (e.g., modified with Ca, Si, Fe, Na, Mg, K) and N retention (modified with CaO) in biochars [30], and warrants further investigation as a promising strategy for improving MFS biochar fertiliser value.

4.1. Impact of Pyrolysis on P Bioavailability from MFS

The increase in HCl-extractable P observed in the biochar MFS compared to raw MFS is consistent with many studies that have shown pyrolysis results in conversion of organic P into hydroxyapatites and oxyapatites that are insoluble in water but are soluble in mild acids [16,29]. While pyrolysis of MFS at 450 °C reduced labile P (H2O-P and NaHCO3-P) fractions to negligible levels, ryegrass amended with biochar MFS accumulated significantly more biomass and P in the acidic Ferralsol than ryegrass amended with raw MFS in the short term (70 days). This increased P accumulation was likely partially due to lime-induced P mobilisation in the Ferralsol [27] since the K2HPO4 + BLE treatment accrued significantly more P in shoots (10,722 μg pot−1) than K2HPO4 alone (9186 μg pot−1). However, given that P accumulation in the biochar MFS treatment at 10 weeks was around 1900 μg pot−1 higher than the nil P + BLE treatment, this suggests that a proportion of P in the HCl-P fraction (>60% of total biochar-P) was relatively bioavailable in the acidic soil. Perhaps unsurprisingly, the increase in the HCl-P fraction in the biochar MFS did not improve P bioavailability in the alkaline Vertisol compared to raw MFS. Similar findings are presented in two recent meta-analysis on biochar-P bioavailability which concluded the greatest positive effect occurs in acidic soils (pH < 6.5), whereas, in alkaline soils (pH > 7.5) no significant response to P bioavailability is observed [31,32].
Raw MFS showed higher efficacy as a P fertiliser than biochar MFS in the near-neutral Arenosol. This was unlikely due to greater availability of other nutrients in the raw MFS than the biochar MFS, since basal nutrients were added equally to all pots. Heat-treated waste products including hydrochars [33] and biochars [34] can induce phytotoxicity and inhibit plant growth. However, no toxicity symptoms were observed with biochar MFS (Supplementary Material Figure S1) and the higher biomass production with raw MFS at 10 weeks was associated with higher P uptake, suggesting that P bioavailability impacted growth.
While raw MFS had higher efficacy than biochar MFS in the short-term (10 weeks) experiment in the Arenosol, raw MFS was not superior to biochar MFS in terms of biomass or P accumulation in the Arenosol at 87 d in the longer-term trial, and both amendments had a NRPU of around 20% at 200 days.

4.2. Agronomic Efficacy of Raw MFS and Biochar MFS

While plant biomass response to P amendments are useful assays for assessing efficacy of P fertilisers or amendments, plant growth may not be as useful as P uptake because plants reach saturation [28]. For example, in an assessment of a range of biochars compared to their raw products vs. chemical P fertilisers, Wang et al. [35] reported that biochars were as effective as the inorganic P fertiliser for producing ryegrass shoot biomass after 6 harvests, but shoot P accumulation was higher in plants amended with synthetic P fertiliser. The same phenomenon was observed in our study, where biochar and raw MFS were almost as effective at producing ryegrass biomass as the +P control after 200 days, but both were only 20% as effective as the +P control for P uptake (APFU around 10% for MFS and biochar vs. 50% for +P control). As such, this study confirms that P uptake is a much better predictor of agronomic P fertiliser value.

5. Conclusions

This study establishes milk DAF sludges as a rich source of P and plant essential nutrients. The fact that MFS are typically concentrated at processing sites and current infrastructure further adds merit as a low-cost feedstock for P recycling. Virtually all P from the raw feedstock was successfully recovered and concentrated more than four-fold in biochars. The resulting biochar-P was poorly water soluble and largely extractable in the mild acid HCl-P fraction, which was at least partly bioavailable in the acidic Ferralsol, where total P accumulation and apparent P fertiliser recovery were 2.3-fold and 12- fold, respectively, higher for biochar compared to raw MFS-P. Ultimately, MFS and biochar were about 20% as efficient at providing P to ryegrass plants as the water-soluble K2PO4 over a 200-day period, suggesting that for short-term crops, higher application rates of MFS or biochar would be required to match synthetic fertilisers, or the supplementary use of synthetic fertiliser would be needed in the short term. Further long-term studies are required to determine whether P in MFS and biochar becomes available to plants over a number of years or whether a proportion of the P remains recalcitrant. Ultimately, our study indicated that recycled P from dairy processing waste can supplement agricultural P inputs and support a more sustainable global P cycle.

Supplementary Materials

The following supporting information can be downloaded at: https://www.mdpi.com/article/10.3390/agronomy12102341/s1. This manuscript has data included as electronic Supplementary Material.

Author Contributions

All authors listed have made a substantial and direct contribution to the work and have approved it for publication. S.M.: Conceptualisation, Methodology, Investigation, Writing—Original Draft; T.R.: Conceptualisation, Methodology, Writing—Original Draft; L.K.: Methodology, Investigation; A.R.: Formal analysis, Methodology, Writing—Review and Editing; D.E.: Validation, Writing—Review and Editing, Funding Acquisition, Project Administration. All authors have read and agreed to the published version of the manuscript.

Funding

This study was funded by The Cooperative Research Centre for Contamination Assessment and Remediation of the Environment (Research project; 4.3.05.17.18).

Acknowledgments

The authors express their gratitude to The Cooperative Research Centre for Contamination Assessment and Remediation of the Environment (CRC CARE) for financial support (Research project; 4.3.05.17.18), as well as Southern Cross University for supporting this work.

Conflicts of Interest

The authors declare no conflict of interest.

References

  1. Shi, W.; Healy, M.G.; Ashekuzzaman, S.M.; Daly, K.; Leahy, J.J.; Fenton, O. Dairy processing sludge and co-products: A review of present and future re-use pathways in agriculture. J. Clean. Prod. 2021, 314, 128035. [Google Scholar] [CrossRef]
  2. Ashekuzzaman, S.M.; Forrestal, P.; Richards, K.; Fenton, O. Dairy industry derived wastewater treatment sludge: Generation, type and characterization of nutrients and metals for agricultural reuse. J. Clean. Prod. 2019, 230, 1266–1275. [Google Scholar] [CrossRef]
  3. Arefin, M.A.; Nabi, M.N.; McIntosh, S. Harnessing energy from Australian dairy waste: Utilizing five methodologies. Biofuels Bioprod. Biorefining 2020, 14, 1180–1196. [Google Scholar] [CrossRef]
  4. Hu, Y.; Khomenko, O.; Shi, W.; Velasco-Sánchez, Á.; Ashekuzzaman, S.M.; Bennegadi-Laurent, N.; Daly, K.; Fenton, O.; Healy, M.G.; Leahy, J.J.; et al. Systematic Review of Dairy Processing Sludge and Secondary STRUBIAS Products Used in Agriculture. Front. Sustain. Food Syst. 2021, 5, 1–24. [Google Scholar] [CrossRef]
  5. Kwapinska, M.; Horvat, A.; Liu, Y.; Leahy, J.J. Pilot Scale Pyrolysis of Activated Sludge Waste from Milk Processing Factory. Waste Biomass Valorization 2020, 11, 2887–2903. [Google Scholar] [CrossRef]
  6. Akhtar, N.; Tayal, P.K.; Manderna, S.; Akhtar, M.N. Dairy effluent scum: A resourceful material for biogas. Int. J. Interdiscip. Res. 2017, 3, 1. [Google Scholar]
  7. Bernal, M.P.; Sommer, S.G.; Chadwick, D.; Qing, C.; Guoxue, L.; Michel, F.C., Jr. Current approaches and future trends in compost quality criteria for agronomic, environmental, and human health benefits. Adv. Agron. 2017, 144, 143–233. [Google Scholar]
  8. Van de Velden, M.; Baeyens, J.; Brems, A.; Janssens, B.; Dewil, R. Fundamentals, kinetics and endothermicity of the biomass pyrolysis reaction. Renew. Energy 2010, 35, 232–242. [Google Scholar] [CrossRef]
  9. Carpenter, D.; Westover, T.L.; Czernik, S.; Jablonski, W. Biomass feedstocks for renewable fuel production: A review of the impacts of feedstock and pretreatment on the yield and product distribution of fast pyrolysis bio-oils and vapors. Green Chem. 2014, 16, 384–406. [Google Scholar] [CrossRef]
  10. Kwapinska, M.; Leahy, J.J. Pyrolysis—A way of recovering energy from wastewater sludge from milk processing factories. In Proceedings of the 5th international Conference on Sustainable Solid Waste Management, Athens, Greece, 21–24 June 2017. [Google Scholar]
  11. McIntosh, S.; Nabi, M.N.; Moghaddam, L.; Brooks, P.; Ghandehari, P.S.; Erler, D. Combined pyrolysis and sulphided NiMo/Al2O3 catalysed hydroprocessing in a multistage strategy for the production of biofuels from milk processing waste. Fuel 2021, 295, 120602. [Google Scholar] [CrossRef]
  12. Zwetsloot, M.J.; Lehmann, J.; Solomon, D. Recycling slaughterhouse waste into fertilizer: How do pyrolysis temperature and biomass additions affect phosphorus availability and chemistry? J. Sci. Food Agric. 2015, 95, 281–288. [Google Scholar] [CrossRef] [PubMed]
  13. Mackay, J.E.; Cavagnaro, T.R.; Jakobsen, I.; Macdonald, L.M.; Grønlund, M.; Thomsen, T.P.; Müller-Stöver, D.S. Evaluation of phosphorus in thermally converted sewage sludge: P pools and availability to wheat. Plant Soil 2017, 418, 307–317. [Google Scholar] [CrossRef]
  14. Christel, W.; Bruun, S.; Magid, J.; Kwapinski, W.; Jensen, L.S. Pig slurry acidification, separation technology and thermal conversion affect phosphorus availability in soil amended with the derived solid fractions, chars or ashes. Plant Soil 2016, 401, 93–107. [Google Scholar] [CrossRef]
  15. Adhikari, S.; Gascó, G.; Méndez, A.; Surapaneni, A.; Jegatheesan, V.; Shah, K.; Paz-Ferreiro, J. Influence of pyrolysis parameters on phosphorus fractions of biosolids derived biochar. Sci. Total Environ. 2019, 695, 133846. [Google Scholar] [CrossRef]
  16. Rose, T.J.; Schefe, C.; Weng, Z.; Rose, M.Y.; Van Zwieten, L.; Liu, L.; Rose, A.L. Phosphorus speciation and bioavailability in diverse biochars. Plant Soil 2019, 443, 233–244. [Google Scholar] [CrossRef]
  17. Xu, G.; Zhang, Y.; Shao, H.; Junna, S. Prolysis temperature affects phosphorus transformation in biochar: Chemical fractionation and 31P NMR analysis. Sci. Total Environ. 2016, 569–570, 65–72. [Google Scholar] [CrossRef]
  18. Roberts, D.A.; Cole, A.J.; Whelan, A.; de Nys, R.; Paul, N.A. Slow pyrolysis enhances the recovery and reuse of phosphorus and reduces metal leaching from biosolids. Waste Manag. 2017, 64, 133–139. [Google Scholar] [CrossRef]
  19. Australian Dairy Industry In Focus. Victoria, Australia. 2018, 1383. Available online: https://www.dairyaustralia.com.au/ja-jp/resource-repository/2020/07/09/australian-dairy-industry-in-focus-2018#.YzQK2ghMb7g.link (accessed on 5 September 2022).
  20. Rose, T.J.; Thompson-Brewster, E.; Cornish, P.S. Phosphorus constraints to potential land area cropped under organic and regenerative systems in Australia. Crop. Pasture Sci. 2022, 73, 263–272. [Google Scholar] [CrossRef]
  21. Rayment, G.E.; Llyons, D.J. Soil Chemical Methods; CSIRO Publishing: Collingwood, VIC, Australia, 2011. [Google Scholar]
  22. APHA. Standard Methods for the Examintion of Water and Wastewater; American Public Health Association: Washington, DC, USA, 2017. [Google Scholar]
  23. Zhang, H.; Chen, C.; Gray, E.M.; Boyd, S.E. Effect of feedstock and pyrolysis temperature on properties of biochar governing end use efficacy. Biomass Bioenerg. 2017, 105, 136–146. [Google Scholar] [CrossRef]
  24. Guppy, C.N.; Menzies, N.M.; Moody, P.W.; Compton, B.L.; Blamey, F.P.C. Analytical methods and quality assurance. Commun. Soil Sci. Plant Anal. 2000, 31, 1981–1991. [Google Scholar] [CrossRef]
  25. Isbbell, R.F. The Australian Soil Classification; CSIRO Publishing: Melbourne, VIC, Australia, 1996. [Google Scholar]
  26. Rose, T.J.; Rengel, Z.; Ma, Q.; Bowden, J.W. Differential accumulation patterns of phosphorus and potassium by canola cultivars compared to wheat. J. Plant. Nutr. Soil Sci. 2007, 170, 404–411. [Google Scholar] [CrossRef]
  27. Van Zwieten, L.; Rose, T.; Herridge, D.; Kimber, S.; Rust, J.; Cowie, A.; Morris, S. Enhanced biological N2 fixation and yield of faba bean (Vicia faba L.) in an acid soil following biochar addition: Dissection of causal mechanisms. Plant Soil 2015, 395, 7–20. [Google Scholar] [CrossRef] [Green Version]
  28. Kratz, S.; Vogel, C.; Adam, C. Agronomic performance of P recycling fertilizers and methods to predict it: A review. Nutr. Cycl. Agroecosyst 2019, 115, 1–39. [Google Scholar] [CrossRef]
  29. Li, W.; Feng, X.; Song, W.; Guo, M. Transformation of Phosphorus in Speciation and Bioavailability During Converting Poultry Litter to Biochar. Front. Sustain. Food syst. 2018, 2, 20. [Google Scholar] [CrossRef]
  30. Buss, W.; Wurzer, C.; Manning, D.A.C.; Rohling, E.J.; Borevitz, J.; Masek, O. Mineral-enriched biochar delivers enhanced nutrient recovery and carbon dioxide removal. Commun. Earth Environ. 2022, 3, 67. [Google Scholar] [CrossRef]
  31. Tesfaye, F.; Liu, X.; Cheng, K.; Bian, R.; Zhang, X.; Li, L.; Drosos, M.; Joseph, S.; Pan, G. Could biochar amendment be a tool to improve soil availability and plant uptake of phosphorus? A meta-analysis of published experiments. Environ. Sci. Pollut Res. 2021, 28, 34108–34120. [Google Scholar] [CrossRef]
  32. Glaser, B.; Lehr, V.I. Biochar effects on phosphorus availability in agricultural soils: A meta-analysis. Sci. Rep. 2019, 9, 9338. [Google Scholar] [CrossRef]
  33. Luutu, H.; Rose, M.T.; McIntosh, S.; Van Zwieten, L.; Rose, T. Plant growth responses to soil-applied hydrothermally-carbonised waste amendments: A meta-analysis. Plant Soil 2022, 472, 1–15. [Google Scholar] [CrossRef]
  34. Zheng, H.; Liu, B.; Liu, G.; Cai, Z.; Zhang, C. Chapter 19—Potential Toxic Compounds in Biochar Knowledge Gaps Between Biochar Research and Safety. In Biochar from Biomass and Waste; Elsevier: Amsterdam, The Netherlands, 2019; pp. 349–384. [Google Scholar]
  35. Wang, T.; Camps-Arbestain, M.; Hedley, M.; Bishop, P. Predicting phosphorus bioavailability from high-ash biochars. Plant Soil 2012, 357, 173–187. [Google Scholar] [CrossRef]
Figure 1. Relative proportions of different P fractions in raw MFS and biochar produced at 450 °C, as determined using the Hedley sequential P extraction method. Colours represent different fractions: H2O-P (blue), NaHCO3-P (orange), NaOH-P (grey), HCl-P (yellow) and residual-P (purple).
Agronomy 12 02341 g001
Figure 2. Accumulation of ryegrass biomass in the Arenosol (a), Vertisol (b) and Ferralsol (c), and phosphorus in the Arenosol (d), Vertisol (e) and Ferralsol (f) at 4 weeks and 10 weeks after sowing. Error bars depict SEM (n = 4). Means at a given harvest (4 weeks or 10 weeks) that are not followed by a common letter are significantly different at p < 0.05.
Agronomy 12 02341 g002
Figure 3. Accumulation of biomass (a) and phosphorus (b) in ryegrass plants for five harvests up to 200 days after sowing. Error bars indicate SEM (n = 4).
Agronomy 12 02341 g003
Table 1. Physicochemical characterisation of raw MFS and MFS biochars produced at varying temperatures.
ComponentRaw MFSPyrolysis Temp (°C)
450550650
TS (wt.%) a17.70100.00100.00100.00
VS (wt.%)82.4053.5047.4044.20
Ash (%)10.0038.1040.5042.10
Volatile Fatty Acids (mg/kg) a3260.00
Oils and Grease (mg/kg) a9900.00
Protein (%)22.80
pH4.608.408.909.00
Electrical Conductivity (dS/m)0.900.700.400.30
Chloride Estimate (equiv. mg/kg)597.00469.30240.50198.70
Total Organic Carbon (%)25.1042.1542.5142.95
Carbon (%)55.6040.8041.2741.60
Phosphorus (%)1.104.884.964.74
Nitrogen (%)3.645.265.214.76
Potassium (%)0.150.610.620.60
Zinc (mg/kg)208.87590.44720.10782.20
Manganese (mg/kg)12.1651.2749.0046.80
Iron (mg/kg)1149.603459.834383.84109.2
Copper (mg/kg)8.6124.0517.7013.90
Boron (mg/kg)<5<5<5<5
Molybdenum (mg/kg)1.464.204.003.50
Sodium (%)0.100.440.500.40
Sulphur (%)0.200.100.100.10
Magnesium (%)0.100.190.200.20
Calcium (%)0.100.560.600.60
Aluminium (g/kg)36.20146.80148.40140.40
All measurements on a dry weight basis except where stated. a Based on wet material prior to drying.
Table 2. Characterisation of soils used in P-limiting plant bioassays.
Soil PropertiesArenosolVertisolFerralsol
Total Carbon (%)0.303.173.69
Total Nitrogen (%)0.020.100.32
Carbon/Nitrogen Ratio12.3930.7811.42
Phosphorus (mg/kg)<50255.621056.01
pH (1:5 Water)7.258.665.33
Electrical Conductivity (dS m−1)0.070.160.14
Estimated Organic Matter (% OM)0.525.556.46
Chloride Estimate (equiv. ppm)47.74101.2389.48
Phosphorus (Bray 1)2.07<14.59
Phosphorus (Colwell)6.5627.5544.28
Phosphorus (Bray 2)2.2916.2313.06
KCl extractable (mg kg−1)
Ammonium2.464.3914.70
Nitrate7.8516.9745.17
Sulphur1.918.3241.44
Effective Cation Exchange Capacity (cmol+ kg−1)0.8224.144.93
Exchangeable cations (cmol+ kg−1)
Calcium0.5021.323.27
Magnesium0.211.450.60
Potassium<0.121.240.42
Sodium0.070.110.14
Aluminium<0.010.020.26
DTPA extractable micronutrients (mg kg−1)
Zinc<0.5<0.51.64
Manganese3.605.3238.23
Iron30.806.4742.22
Copper<0.10.290.53
ICP elements and metals (mg kg−1)
Aluminium594.088841.8787,262.94
Arsenic<2<22.67
Boron<214.882.83
Calcium132.1664,041.70886.11
Cadmium<0.5<0.5<0.5
Cobalt0.752.3813.16
Chromium<212.8481.73
Copper<16.7711.95
Iron870.136789.0911,0866.51
Lead<13.1715.89
Potassium<502749.06330.98
Magnesium52.405111.82521.96
Manganese53.5695.73868.30
Mercury<0.1<0.10.13
Molybdenum<0.20.262.45
Nickel<15.2622.31
Selenium<0.5<0.50.95
Silicon1073.541178.52749.09
Silver<1<1<1
Sodium<50144.7489.02
Sulphur<50300.82656.93
Zinc2.359.9895.28
Table 3. Apparent P fertiliser recovery and net relative P uptake.
APFU (%)NRPU (%)
Days After SowingRaw MFSBiochar MFS+P (K2HPO4)Raw MFSBiochar MFS
3901.6110.114.4
872.13.220.310.515.6
1136.1635.717.116.8
1577.87.841.918.618.5
20011.110.350.921.820.3
Publisher’s Note: MDPI stays neutral with regard to jurisdictional claims in published maps and institutional affiliations.

