Article

Soil Biochar Application: Assessment of the Effects on Soil Water Properties, Plant Physiological Status, and Yield of Super-Intensive Olive Groves under Controlled Irrigation Conditions

by
José María De la Rosa
1,*,
Paloma Campos
2 and
Antonio Diaz-Espejo
1
1
Instituto de Recursos Naturales y Agrobiología de Sevilla (IRNAS-CSIC), Reina Mercedes Av., 10, 41012 Seville, Spain
2
Departamento de Cristalografía, Mineralogía y Química Agrícola, Universidad de Sevilla, Profesor García González, 1, 41012 Seville, Spain
*
Author to whom correspondence should be addressed.
Agronomy 2022, 12(10), 2321; https://doi.org/10.3390/agronomy12102321
Submission received: 24 August 2022 / Revised: 17 September 2022 / Accepted: 22 September 2022 / Published: 27 September 2022

Abstract

:
The effects of olive waste biochar and green compost as soil amendments on soil physical properties, as well as on physiological parameters and yield of a super-intensive olive crop cultivated under deficit irrigation conditions, were investigated in south-west Spain during the 2021 growing season. Thus, soils were amended with 40 t ha−1 of olive pomace waste biochar, green-compost, or a biochar-compost mixture (50% w/w), and no amended plots were used as control. On a bi-monthly basis, soil pH, water holding capacity, humidity, and resistance to penetrability were determined. In addition, various indicators of the physiological status and water stress of the plant were also monitored. Finally, the olive yield per tree was measured. Results showed that biochar application was the most effective amendment for increasing soil moisture and reducing soil compaction. The latter was evidenced by the significant reduction of the resistance to the penetrability of the amended soils. Plants of the amended plots showed better leaf water potential. In addition, values of the net photosynthesis rate, the average intrinsic water-use efficiency, and the maximum rate of electron transport in the time before the harvest improved significantly in the trees from the biochar-amended plots, for which olive fruit yields increased by about 15% in comparison with the other treatments. Nevertheless, the estimated net oil yield per tree was similar because the olives from the biochar-amended trees contained more moisture. This field trial shows for the first time that by providing the soil with biochar from olive crop waste as an organic amendment, having high water retention capacity, porosity, and stability, it would be possible to reduce the irrigation water needed and maintain plant yields.

1. Introduction

Agriculture is currently facing a complex challenge in the context of climate change: the need to provide quality food to a growing world population. It is expected to reach 9.7 billion inhabitants by 2064 and, as a consequence, more people will suffer from hunger [1]. While greenhouse gas emissions have intensified, the fertility of agricultural soils has declined globally due to the exposure of soils to frequent flooding, desertification, and salinization [2]. Agriculture is one of the economic pillars of the Mediterranean Basin, and of particular interest is the cultivation of olives, of which there are an estimated 7.7 million hectares. This area constitutes about 70% of the existing 1.5 billion olive trees in 56 countries around the world. Spain has more than 2.5 million hectares of olive trees (28% of which are irrigated) [3], and is currently the world’s leading producer and exporter [4]. In recent years, in a clear bid to avoid year-to-year fluctuations in productivity and to guarantee profitability, intensive and super-intensive olive growing has been expanding, especially on new farms [5]. In contrast to traditional cultivation, in super-intensive cultivation, the tree is smaller in size (hedgerow shape), up to 2000 olive trees are planted per hectare, compared to 600 trees per hectare for intensive cultivation. In both cases, automatic harvesting is possible, but controlled irrigation (usually drip irrigation) is essential. Nevertheless, the Mediterranean region is characterized by a semi-arid climate. This recent development of intensive olive cultivation that requires irrigation, together with the scarcity of rainfall, means that tensions and conflicts between water users and pressures on the environment are expected to increase.
Another problem affecting agriculture in the Mediterranean region in general, and the olive sector in particular, is the large generation of residual biomass with little commercial value. According to EUROSTAT [6], Spain produced around 5.5 million tons of agricultural and forestry waste in 2012. The olive oil agro-industry also produces abundant residual biomass, such as olive pits, estimated at over 420,000 tons per year (14% fruit weight [7]), pruning residues, dried pomace, etc. The olive pomace, the residual mixture of seeds, olive skins, and pulp [8], has a high content of polyphenols, which makes it a waste of high phyto-toxicity and recalcitrance to degradation [8], and, consequently, these biomass residues are normally burned. One of the most promising alternatives being considered to resolve this problem in a sustainable way, is the conversion of these biomasses into biochar [9]. It is the solid and porous by-product resulting from the thermal decomposition of biomass in the absence of oxygen, in a process known as pyrolysis. This process generates a mixture of combustible gases and heavy oils that can be used as an energy source [10]. The agronomic benefits of the application of partially carbonized organic matter as an amendment in agricultural soils were already known by the indigenous people of the Amazon basin in Latin America thousands of years ago, in what has been termed as terra preta de Indio (i.e., Portuguese for Indian Black Earth) [11]. Over the last decade, scientific interest in biochar has increased exponentially, with more than 4000 scientific papers published on the subject of biochar and agriculture in 2021 alone. Due to its properties, such as high carbon content, stability, cation exchange capacity, porosity, and moisture retention [12,13], the application of biochar, solely or together with other amendments or fertilizers, in crop soils has been widely experimented, resulting in beneficial effects, especially in coarse-textured soils in arid and semi-arid areas [14]. Biochar can improve the soil physiochemical properties, such as water infiltration, water holding capacity, and saturated hydraulic conductivity to accommodate cultivation [15,16,17,18,19,20], and increase agricultural productivity [21,22]. Some recent reviews discussed the effects of biochar on soil physical and hydrological properties and indicated that biochar application improved soil compaction [23,24]. Additionally, a meta-analysis [25] has described that biochar application into agrosystems may have proportionate positive effects on crop productivity or soil properties, although they are neither universal nor uniform. For instance, Sorrenty et al. [26] reported that biochar application to sandy-loam soil was effective in reducing the leached amount of NH4-N in the top-soil layer but in non-limiting conditions (e.g., water availability and soil fertility), the benefits from biochar application in commercial nectarine trees performance were negligible. Recent studies strongly suggest that large rates of biochar application may be necessary to significantly change the penetration resistance of the soil and reduce the risks of soil compaction (e.g., [27]), whereas cost-benefit analyses suggest the application of lower biochar doses [28,29]. However, the economic implications of the implementation of novel organic amendments are not within the scope of this paper, which aims, for the first time, for a holistic study that analyzes the impact of biochar on soil properties (including water content, moisture, penetration resistance, pH, and electrical conductivity), water, physiological plant status, and crop productivity in the field under Mediterranean climate conditions. Furthermore, the recovery of agro-residues for subsequent use in agriculture is important as a circular economy strategy for materials and nutrient reuse [30,31]. In relation to olive agro-industry residues, Lv et al. [32] already reported high yields and good performance in obtaining biochar from olive residues due to their relatively high lignin content compared to other biomasses. Campos & De la Rosa [33] found that biochar produced from olive pits has physical, chemical, and surface properties (water retention capacity greater than 100%, very high porosity (>300 m2 g−1), low conductivity, and density, among others) that make it very suitable for improving the water properties of soil. The recovery of biochar from olive mill wastes has recently been applied as an eco-friendly and effective method for their sustainable management [30]. Nevertheless, the lack of appropriate pyrolysis reactors means that biochar is scarce, expensive, or not produced under appropriate conditions; therefore, most trials are conducted at the pot scale. At present, the application of high doses of biochar as an arable soil amendment is not economically viable. Nevertheless, if sustainable and cost-effective applications can be found, the development and installation of high-efficiency pyrolytic reactors in which biochar is the solid by-product of the transformation of biomass into syngas would be facilitated by making quality biochar locally available at a highly competitive price.
The improvement of orchard management practices is compulsory in modern olive-growing intensive systems, planted at high density, with irrigation, and with trees formed to suit mechanical pruning and harvesting. In recent years, increasing attention has been paid to the physiological basis of crop response to cultural practices, with the aim of achieving more efficient use of water [34]. In addition, the positive effects of applying biochar in soil structural properties should be linked to its improvement in above- and belowground growth of plants, and some other phenomena that would directly enhance the process of root area and activity of microorganisms. However, taking into account that the improvements in soil physiochemical properties differ with feedstock type, soil, ageing of biochar with soil, and rate of application [35], its indirect impact on plant physiology is even more uncertain. Recent studies, (e.g., [28,29]) focused on dosage optimization suggested biochar doses ≤30 t ha−1 due to the declines in growth and physiological performance as a consequence of the induced N limitation at high biochar dosages. On the contrary, Busscher et al. [27] reported that an application of at least 44 t ha−1 is needed to significantly reduce the soil resistance to penetrability and improve soil physical properties in a sandy loam soil. It is clear that results differ according to soil type, climate, and crop. Physiological characteristics, including photosynthesis rate (AN), stomatal conductance (gs), maximum electron transport rate (ETRmax), and leaf water potential (ψleaf), are key features to determine the general performance and health of plants [36]. Effects of soil amendment by biochar and other organic ameliorants on the physiological properties of olive trees could provide valuable information to benefit farmers. Another question still to be confirmed is whether the combined application of biochar and compost has synergistic effects, as contrasting results have been reported [37,38].
Thus, considering the lack of field trials with biochar in super-intensive olive orchards, the main objectives of this study are:
(i) To verify in the field the effects of the application of biochar produced from olive pomace residues on soil properties, especially water properties, plant physiology, and crop productivity;
(ii) To compare the effects of the application of biochar with the performance of the traditionally-used green-compost.
To our knowledge, this is the first experiment which studies, under real field conditions, how the application of biochar and compost as soil amendments affects soil physical properties, soil composition, and olive tree physiology and productivity. This information is essential to understand how the crop uses water and how biochar and compost could affect soil properties and crop response.

2. Materials and Methods

2.1. Description of Organic Amendments

2.1.1. Olive Pomace Biochar (OB)

Biochar was produced from dry olive pomace (hereinafter referred to as olive pomace biochar-OB) in the pyrolysis reactor of Carboliva S.L., a company in the hamlet of Puente del Obispo (Jaén, Andalusia, southern Spain). The slow pyrolysis was performed at that rotatory cylindrical reactor (8 m long × 2 m diameter) fed by a screw in a continuous process for 15 min at 500 °C. The anoxic conditions were established by a continuous flux of N2 and CO2. This reactor converts the olive mill pomace with a capacity of 9 t per hour into a syngas fraction, rich in methane, that is valorized for energy production and used as a green biofuel, and a solid fraction called biochar. The OB sample has a pH of 9.90 ± 0.05, a water holding capacity of 78 ± 15%, ash content of 38.4 ± 0.3%, and total organic C and N contents of 56.3 ± 1.7% and 1.13 ± 0.03%, respectively, a particle size in the range of 5 to 25 mm, and an electrical conductivity of 13,700 ± 389 µS cm−1. The analytical procedures used are briefly described in Section 2.3.

2.1.2. Green Compost (GC)

Green compost (hereinafter GC) was supplied by Fertilizantes Orgánicos Melguizo S.L. (Seville, Spain). This commercial compost is made from a mixture of garden pruning waste and pine wood shavings recovered from discarded pallets. The raw materials are collected in the reception area and mixed prior to transfer to the fermentation area in its facilities located in the town of Los Palacios y Villafranca (Seville, Spain). The composting plant is located in a geographical area where rainfall is infrequent. Thus, the composting was performed using a traditional process in open piles, and aeration was assured by a turning process. GC has pH of 8.3 ± 0.2, the electrical conductivity of 1184 ± 177 µS cm−1, water holding capacity of 66 ± 20%, ash content of 73 ± 3%, and total organic C and N contents of 14.9 ± 0.2 and 0.68 ± 0.02%, respectively.

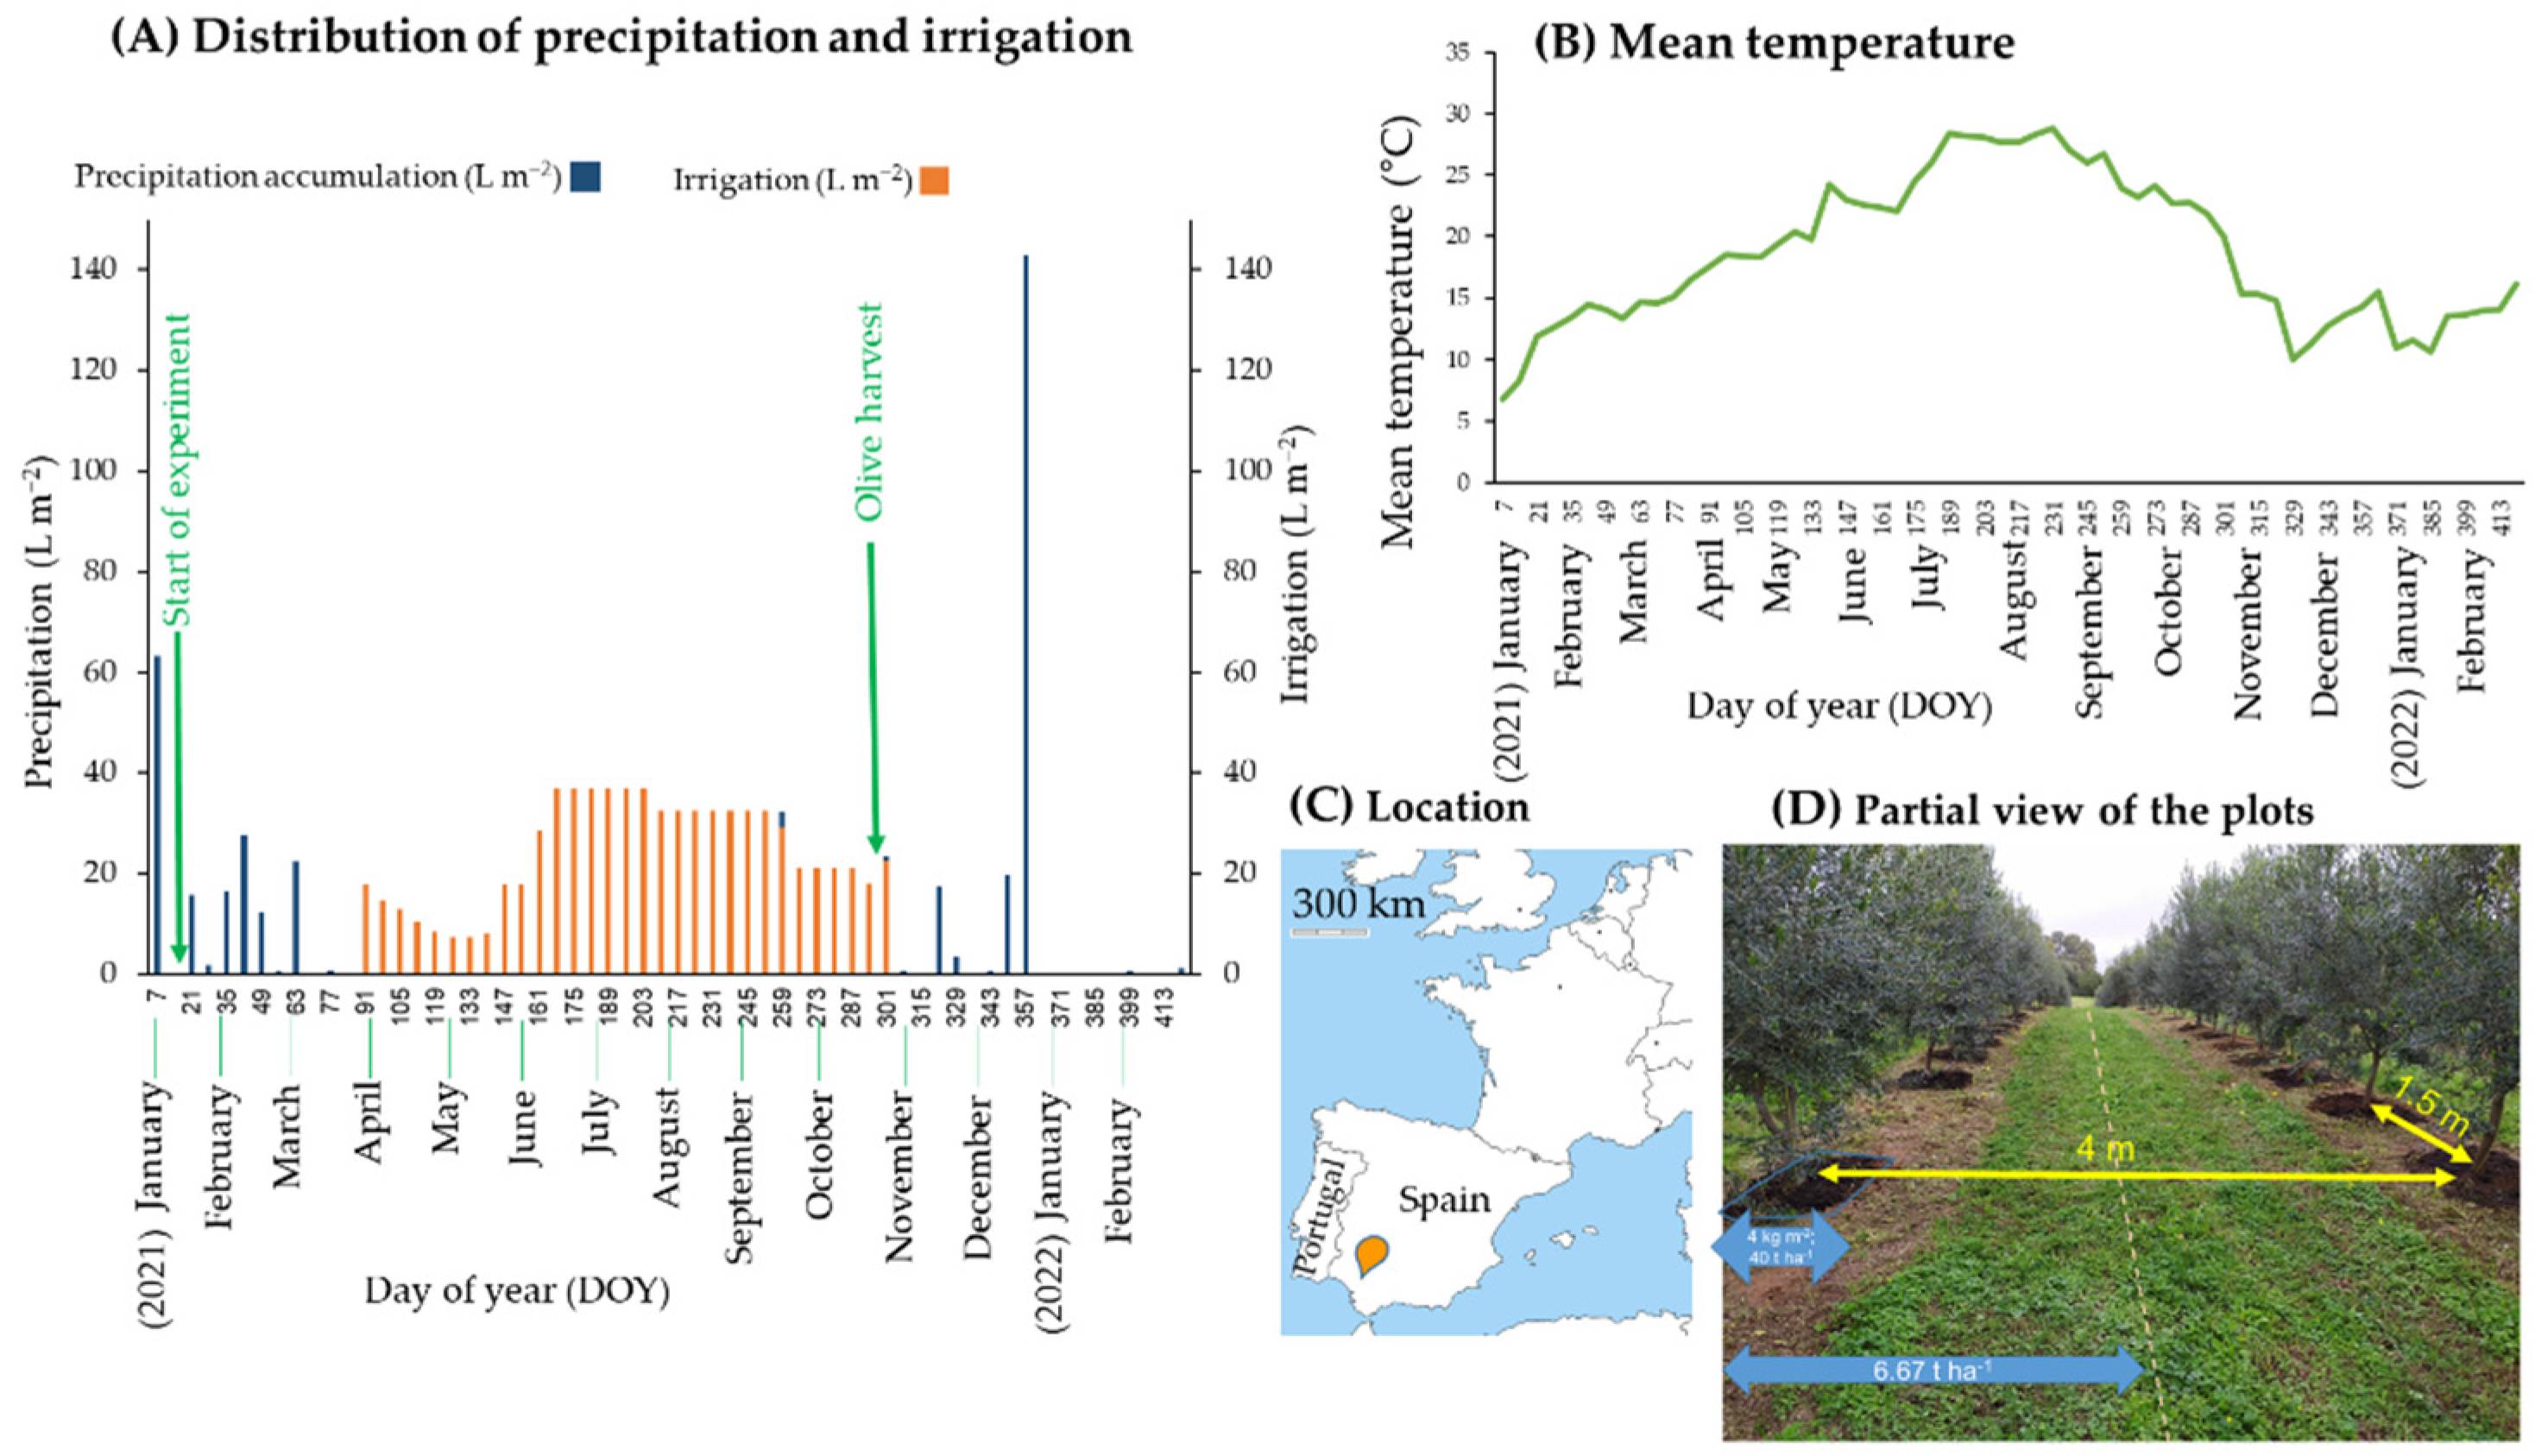
2.2. Experimental Setup and Orchard Characteristics

The experimental plots were located at La Hampa experimental farm, which is located in Coria del Río municipality (37°17′ N, 6°3′ W, 30 m above sea level; Figure 1). This area has a typical Mediterranean climate, with mild winters and dry summers, and rain episodes concentrated during autumn and spring. The average minimum and maximum air temperatures in the area are 12 °C and 26 °C, respectively. The cumulative mean rainfall was 496 L m−2 for the period 2015–2020 [39] and 443 L m−2 during 2021, and the yearly potential evapotranspiration is about 1500 L m−2 [40]. Temperature and precipitation were recorded daily during the experiment by an automated agroclimatic station (Figure 1).
The topsoil at the experimental site is sandy loam (Xerochrept) with a pH of 7.6 ± 0.3, and total C, organic C, and N contents of 2.2 ± 0.4, 1.2 ± 0.3, and 0.18 ± 0.03%, respectively. The trees are 6-year-old Olea europaea L. (Arbequina) planted in lines in a 4 m × 1.5 m configuration (1667 trees ha−1). All of the trees were irrigated with 30% regulated deficit irrigation (RDI) [41,42]; i.e., so as to satisfy 30% of irrigation needs every time [43]. The temporal distribution of irrigation is shown in Figure 1. The highest irrigation requirements were observed throughout the summer period and amounted to 460 L m−2 of the 752 L m−2 yr−1 applied, which corresponds to 7520 m3 ha−1 yr−1.
Taking into account the layout of the olive trees in this super intensive olive grove, and the drip irrigation system, four different treatments were stablished on 15 January 2021, consisting of control plots with no amendment (C; control), olive pomace biochar (OB), green compost (GC), and a 1:1 (w/w) of OB: GC mixture (OB + GC). The organic amendments were not applied to the entire surface of the farm but solely to plots of 1 m × 1 m around each tree using a frame (Figure 1d). Thus, 4 kg m−2 (equivalent to 40 t ha−1) were applied and subsequently mixed with the first 5 cm of the soil at each plot using a rake, to leave a uniform distribution. Taking into account the distribution of the trees and the distance between them, the net real amendment applied is 6.67 t ha−1 for BC and GC, and 3.33 + 3.33 t ha−1 for the mixture BC + GC, respectively. Each treatment was applied per complete row of 24 plots and not to a random distribution of trees in the parcel to avoid cross-contamination due to erosion or wind transport, flowing in the order of: C/C/GC/OB + GC/GC/OB + GC/OB/OB/OB/C. Consequently, the number of plots was n = 72, 72, 48, and 48, for treatments C, B, GC, and OB + GC, respectively, making a total of 240 plots of 1 m2 each.
Soil samples were taken from 0 to 5 cm (topsoil), 5 to 10 cm, and 10 to 20 cm depths with a manual auger at three points and four different plots for each treatment on the days of the year (DOY) 104, 118, 140, 159, 173, 187, 251, 260, 287, 294, 334, and 418. To allow statistical comparison, the same number of measurements per treatment has always been considered for each of the studied parameters.

2.3. Analyses of Physical and Chemical Properties of Amendments and Soils

Total carbon (TC) and total nitrogen (TN) contents of OB, GC, and soil were determined by dry combustion, using a Flash 2000 HT elemental micro-analyzer (Thermo Instruments, Bremen, Germany) equipped with a thermal conductivity detector at 1020 °C. The pH and EC were measured by the procedure described by Campos et al. [44] in a 1:5 (w/w) soil: distilled water mixture, whereas for pure organic amendments, a 1:10 (w/w) mixture was used. Total moisture (%) was determined for amended and un-amended soils by weight difference after drying the samples at 105 °C for 24 h in order to calculate the total water content, and water holding capacity (WHC) was measured by the method of Campos et al. [45].

2.4. Field Determination of Soil Humidity and Resistance to Penetrability

Soil moisture (%) was measured in the field at 0–5 and 5–10 cm depths with a PMS710 soil moisture meter (Tsingtao Toky Instruments Co., Ltd., Qingdao, China). For each treatment and depth, soil moisture was measured at three points and four different trees on DOY 104, 118, 140, 159, 187, 251, 260, 287, 294, 334, and 418.
Soil resistance to penetrability (kg cm−2) was measured at soil surface using the HM-502 hand penetrometer (Gilson Company, Inc., Lewis Center, OH, USA). Soil resistance to penetrability was determined at nine points and four different trees for each treatment on the same DOY as soil moisture.

2.5. Olive Trees Physiological Status

Plant physiology measurements were carried out on DOY 251, 287, 334, and 418 to provide data for the growth, fruit ripening, and post-harvest stages. Leaf water potential (ψleaf) was measured with a Scholander type pressure chamber (PMS Instrument Company, Albany, OR, USA). Measurements were made at noon (GMT) on sun-exposed, healthy, fully developed leaves of representative current-year branches. Eight leaves were measured in four representative trees per treatment.
Leaf gas exchange and chlorophyll fluorescence were measured simultaneously using an open gas exchange system (LI-6400, Li-Cor, Lincoln, NE, USA) equipped with the LI-6400-40 chamber. Twelve leaves per treatment were measured between 9:00 and 11:00 GMT, which are the times of the day when stomatal conductance is maximum. Measurements were performed in four representative trees, in leaves that were sun oriented and fully mature. Conditions in the chamber were set at 400 μmol air s−1, ambient CO2 = 430 μmol CO2 mol−1, and PPFD = 1600 μmol m−2s−1. The actual photochemical efficiency of photosystem II (ϕPSII) was determined by measuring steady-state fluorescence (Fs′) and maximum fluorescence during a light-saturating pulse of 10,000 μmolm−2s−1 (Fm′) following the procedures of Genty et al. [46]:
ϕPSII = (Fm′ − Fs′)/Fm
The maximum electron transport rate (ETRmax) was then calculated as:
ETRmax = ϕPSII PPFD β
where PPFD is the photosynthetic photon flux density and β is a term which includes the product of leaf absorptance, and the partitioning of absorbed quanta between PSI and PSII, considered as 0.5. Leaf absorptance was assumed to be 0.93 as measured in Perez-Martin et al. [47]. Briefly, leaf absorptance was determined using an integrating sphere with a portable spectroradiometer (LI-1800; Li-Cor) and calculating absorptance as 1–reflectance–transmittance.

2.6. Olive and Oil Yields per Tree

On 21 October 2021 (DOY: 294), the olives were harvested from the entire plot under study. The fruit was collected by hand, by a crew of four people who first spread a net entirely covering the soil surface area of four trees, and weighed immediately. Thus, for each line of 24 trees, 6 measurements of olive weight were obtained. For each batch, 2 kg of olives was taken for the analysis of moisture and fat content.
Olive water content (%; w/w) was calculated following the normalized methodology described in ISO 662:2016 [48]. Briefly, 20 g of fresh olive as dried at 103 ± 2 °C. Fat content was subsequently determined by using the ISO procedure [41]. An amount of 10 g of dry and milled sample was placed in a cellulose thimble and then into a Soxhlet chamber (50 mL) fitted to a distillation flask containing 100 mL of n-hexane (HPLC grade) and boiling glass regulators. After extraction for 4 h the thimble was dried to remove the solvent and the sample was weighed again.
The percentage of oil yield for the olive was calculated using the formula:
Olive oil yield (%) = Mass before extraction − Mass after extraction/Mass before extraction × 100 (%)
Free acidity of olives (oil acidity) is a parameter that is typically used to check the quality of the olive oil and to differentiate between extra virgin, virgin, and ordinary virgin. Acidity of fresh olives (%) was determined by Visible/Near Infrared (VIS/NIR) spectroscopy, following the procedure described by Garrido-Varo et al. [49].

2.7. Statistical Analysis

The IBM SPSS Statistics 26.0 software (SPSS, Chicago, IL, USA) was used for performing statistical analysis. One-way ANOVA and HSD Tukey (p = 0.05) as a post hoc analysis were performed after testing the normality and homoscedasticity of the data (Shapiro–Wilk and Levene tests). For non-normal variables, Kruskal–Wallis and Mann–Whitney U tests were performed. Linear correlations were tested using the obtained results to better discern the effects of organic amendments on soil properties and their consequences on productivity.

3. Results and Discussion

3.1. Physical and Chemical Properties of Soils

3.1.1. Laboratory Analyses

Compared to the control, not amended soils, the addition of biochar (either as OB or GC + OB) significantly increased pH and EC of the topsoil, from 7.6 to ≥9.4 and from 191 to >700 µS cm−1, respectively. This increase is due to the high alkalinity and EC of OB, and was maintained throughout the duration of the experiment for the topsoil (Table 1). However, the differences were practically negligible at a soil depth greater than 10 cm.
Soil water content did not differ between treatments in the spring season (DOY 118), even at depth. However, in samples taken from September onwards (DOYs 251, 287, and 418), it was observed that OB, and, to a lesser extent, GC amendment, increased the water content significantly, also for the soil samples taken below 5 cm depth. Previous studies have reported an increase in soil water retention, a decrease, or no change [35,45,50,51] after biochar application. Razzaghi et al. [24] concluded that the impact of biochar on soil water content might be soil type-dependent.

3.1.2. In Situ Analyses

The average values of soil moisture and penetration resistance measured in the field for each treatment are shown in Table 2. The soil moisture measured in the field ranged from 7.1% (C; spring) to 20.3% (OB + GC; summer). The application of any amendment increased soil moisture of the top-soil in the spring and summer seasons. During summer and autumn, irrigation with up to 140 L m−2 per month during these periods increased the average soil moisture for all treatments. The differences in soil moisture between the treatments are reduced for the soil fraction of 5 to 10 cm depth.
Control plots showed average penetration resistance values of 4 MPa, whereas 1.9, 1.9, and 2.5 MPa were measured for OB, OB + GC, and GC treated plots, respectively. Thus, the penetration resistance decreased considerably with the application of both GC and OB compared to the soils of the control plots throughout the entire experiment (Table 2). Exceeding 3 MPa for coarse-textured soils can significantly reduce root growth [52]. Similarly, Blanco-Canqui [53] reported that biochar application rates >20 Mg ha−1 reduced penetration resistance.
Soil moisture (0–5 cm depth) and penetration resistance measured in the field were strongly inversely correlated (R2 = 0.758, p < 0.05; Figure S1 and Table S1). This result indicates how soil physical properties are interrelated. The addition of an organic amendment, such as biochar or compost, allowed improved penetrability, reduced compaction and allowed moisture to increase, with a similar water supply. This result may suggest that soils with biochar could be trafficked at higher water content, without causing compaction, than soils without biochar [53]. A possible advantage of biochar application over compost is the greater stability of the former. This, in turn, could extend the beneficial effects of the amendment for a longer period of time, but this has yet to be demonstrated in long-term trials.

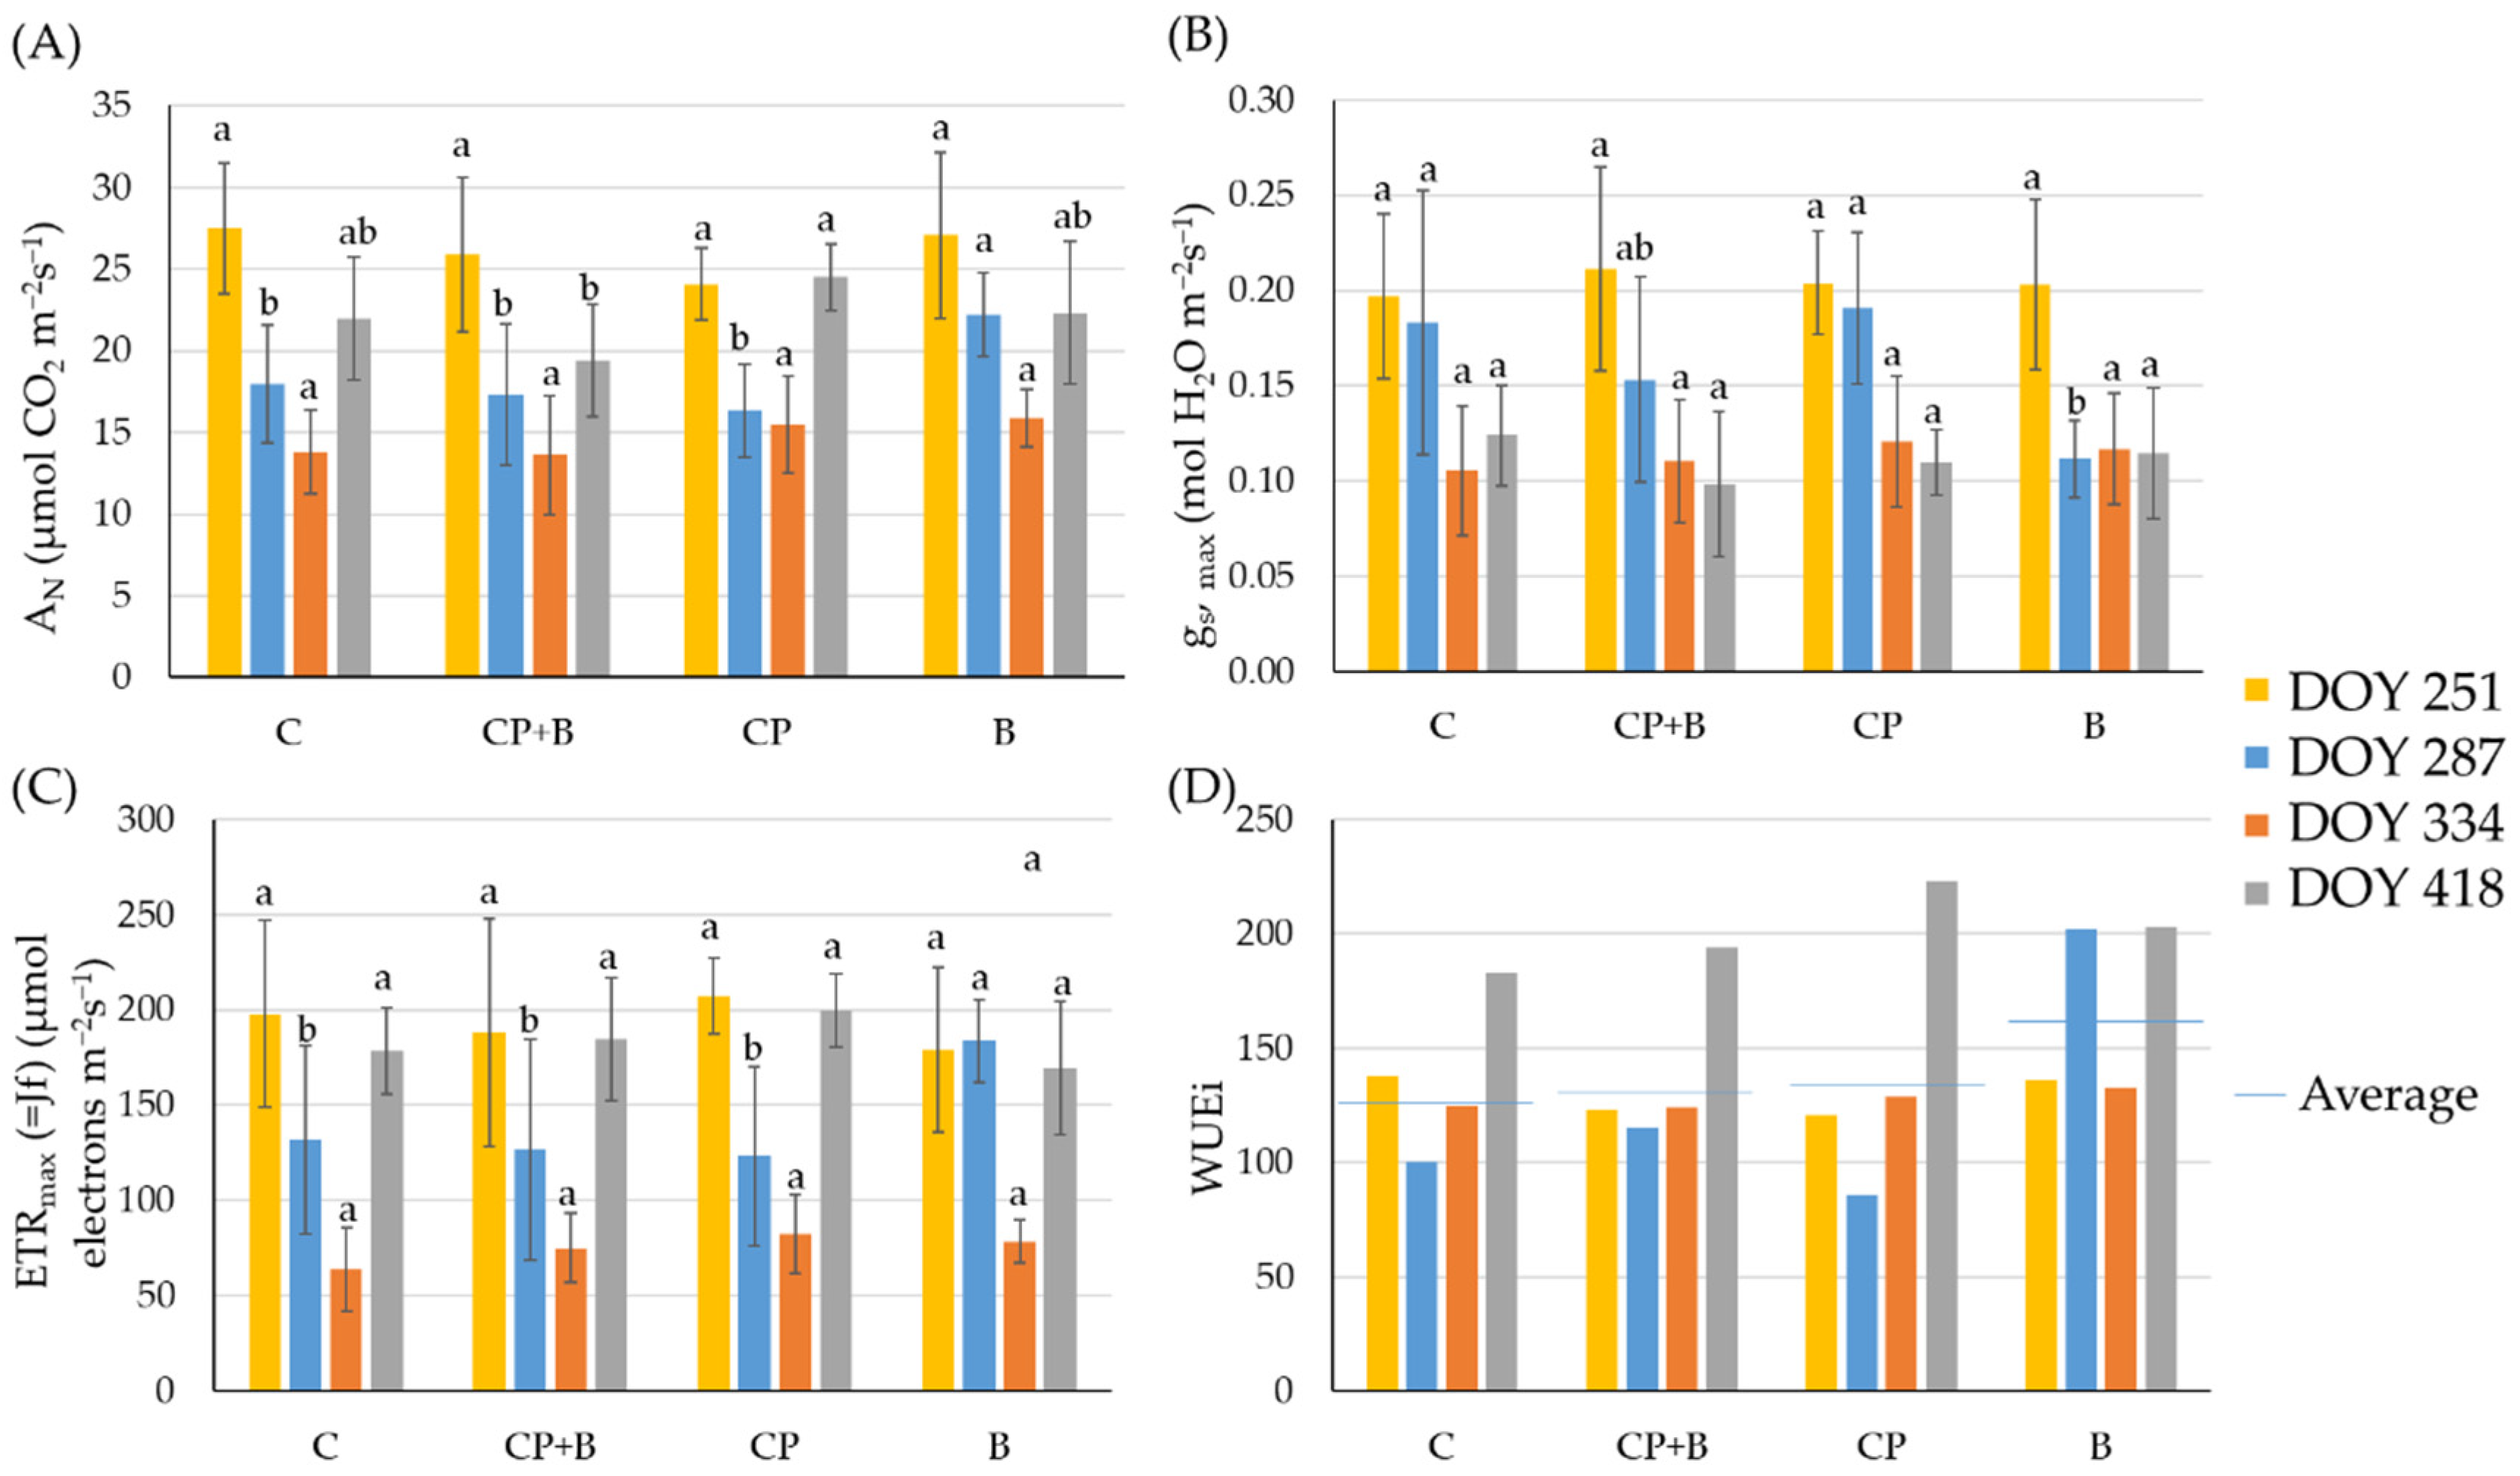
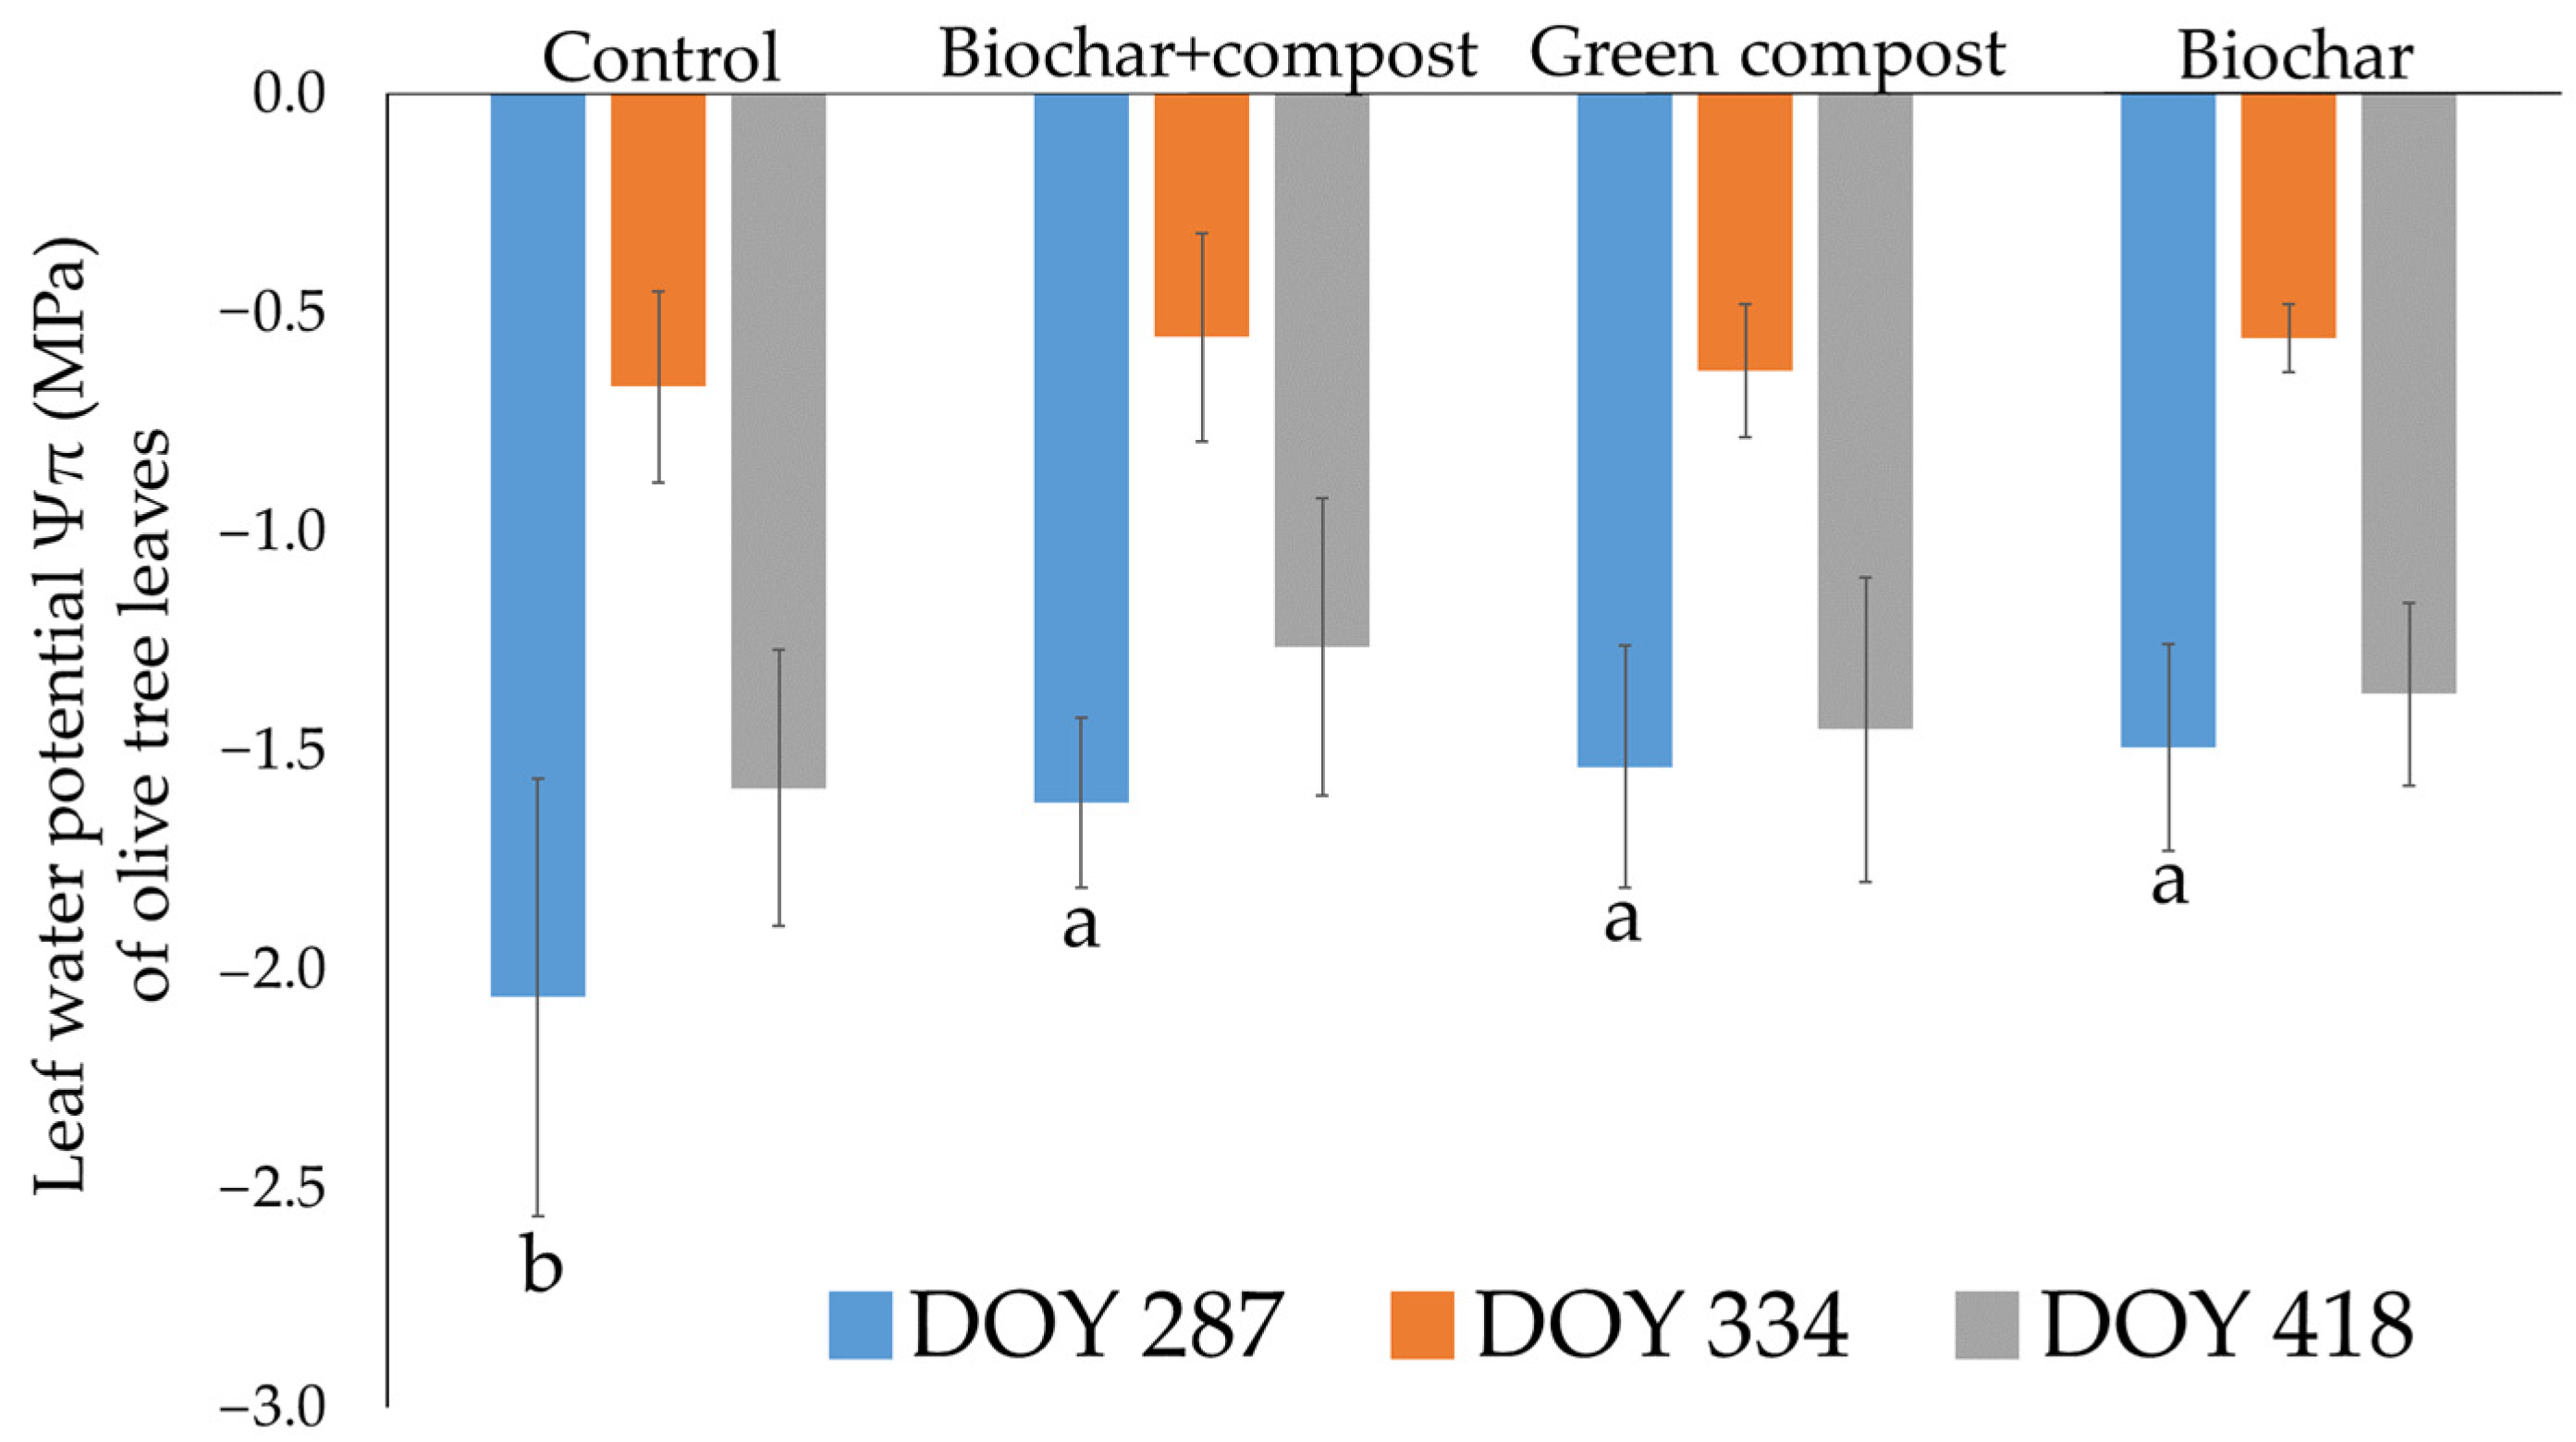
3.2. Effects on Olive Tree Physiological Parameters

Measurements of midday stomatal conductance (gs), net photosynthesis rate (AN), and maximum electron transport rate (ETRmax) on DOY 251, 287, 334, and 418 are presented in Figure 2 and Table S2. On DOY 251, gs was about 0.20 mol m−2s−1 for all the treatments. Nevertheless, on DOY 287, gs significantly decreased for the OB plots to reach values of about 0.11 mol m−2 s−1. Post-harvest measurements (DOY 334 and 418) showed gs values between 0.10 and 0.12 mol m−2 s−1, with no significant differences between treatments. Stomatal conductance (gs) is considered one of the best indicators of plant water stress, since it is placed at the intersection of water and CO2 fluxes at the leaf level. In all cases, all these values are above 0.1 mol m−2 s−1, indicating that the plants were not water stressed, according to previously published models for the same crop type [54].
The net photosynthetic rates (AN) reached the maximum values (27.5 to 24.1 µmol CO2 m−2 s−1) on day of year 251. A general drop in the AN values is reported on DOY 287 and 334 without significant differences between the four treatments, except for the increase for the OB amended trees (22.2 µmol CO2 m−2 s−1 on day of year 287). Strong seasonal variations in photosynthetic parameters have previously been reported for deciduous species under Mediterranean climate conditions in relation to water availability [55]. The general decline in gs and AN values during autumn and the post-harvest period for all the treatments suggests stomata closure, probably due to the cut in the irrigation water supply coupled with a dry autumn season.
A strong linear correlation between gs and AN is shown for OB + GC amended plants (R2 = 0.63; p < 0.05), and very poor for the control plants (R2 = 0.415; p < 0.05). At the leaf level, intrinsic water-use efficiency (WUEi) is defined as the instantaneous ratio between net CO2 assimilation rate (AN) and stomatal conductance to water vapor (gs). WUEi of the olive trees from the biochar-amended plots was on average 20% greater than those of the remaining plots (0.168 vs. 0.137 to 0.140; Figure 2 and Table S2). Values of WUEi in olive have been previously reported by Angelopoulos et al. [53] and Diaz Espejo et al. [56]. Although linear AN vs. gs relationships have been reported for olive [57], AN is affected later than gs under water stress [58]. This is a key trait for the adaptation of olive tree to drought, and explains usually greater WUEi recorded in plants. Gale and Thomas [29] recently reported that biochar addition resulted in substantial positive effects on plant ecophysiology increasing WUEi with biochar dose up to 30 t ha−1. The disturbance of the gs-AN relationship, especially in biochar-amended plots, suggests an alteration of soil water availability due to the application of organic amendments, which may induce modifications in plant physiology. Nevertheless, results of the present study should be taken with care due to the possible excess supply of mineral nutrients by biochar, in particular K, in proportion to N, inducing N deficiency at high biochar doses [29].
A linear relationship between the values of maximum electron transport rate (ETRmax) at saturating irradiance and AN was observed (R2 = 0.81; p < 0.05, Figure S2). There were no differences of ETRmax between treatments, except for the significant increase that was found in plants from plots amended with biochar during the harvest period (ETRmax = 184; day of year 287; OB treatment). This result is opposite to the lack of response to biochar addition for the physiology of apple trees reported by Eyles et al. [59]. Cultivars that have lower values of ETRmax are less efficient in transporting electrons and potentially fix less CO2 [60].
Figure 3 shows the evolution of the water potential (ψleaf) of olive tree leaves measured on DOY 287, 334, and 418. A greater water stress is shown on DOY 287 and 418, and for the plants from the control plots, whose potential reached the most negative values (Ψπ ≤ −2.0 MPa; day of year 287). However, no significant differences were found in the post-harvest analyses. Irrigation was effective in maintaining the leaf osmotic potential within values considered for non-stressed trees.

3.3. Effects of the Amendment on Plant Yields

Plant yield ranged from 10.1 to 11.9 kg of olives per tree for control and biochar-treated plots, respectively (Table 3). The significant increase in the net fruit weight for biochar-amended olive trees did not result in a linear rise of the estimated oil production, as olives from biochar-amended olive trees contained more moisture and less relative abundance of fat. Thus, this increase in net weight is due to a greater accumulation of water at the fruit from the trees on the biochar-amended plots, which is suitable for table olives. In contrast, a lower water content would be desirable for varieties destined for oil production. The latter could be achieved either by reducing irrigation rates or by delaying the harvest date.
Regarding olive oil quality, the levels of free acidity ranged from 0.29 (OB) to 0.35 (GC) without significant differences (Table 3). All of them are within the limits established by the International Olive Council (IOC) for extra virgin olive oils (EVOOs). Caruso et al. [61] suggested that olive oil acidity was not influenced by the amount of irrigation and tree water status. In contrast, other authors obtained higher levels of acidity in olive oil from well-watered olive trees [62].

4. Conclusions

Soil physical properties are crucial for crop yields of olive groves because they strongly determine water uptake and transport by plants, which can affect plant physiology and yield. The results of this study have shown that the application of olive pomace biochar (OB) and compost (GC) significantly increased soil moisture and reduced soil resistance to penetrability. Moreover, biochar led to a relative olive production increase of about 15% compared with all other treatments. However, the lower fat and greater moisture content of olives from the OB amended plots attenuated the differences in oil production per tree. Concerning the effects on the plant physiology of olive trees, stomatal conductance showed values of no water stress at any stage. Nevertheless, plants from the control plots showed the most negative water potential values (ψleaf) on day of year 287, just before the harvesting. On the contrary, olive trees from the biochar-amended plots obtained the greatest net photosynthesis rate (AN), water-use efficiency (WUEi), and maximum electron transport rate (ETRmax), indicative of better water and photosynthetic conditions. The results of this field study show that the application of organic amendments with high porosity and water retention capacity modified the soil physical properties, reducing soil compaction and improving the water status of olive trees in super-intensive olive trees plantations. However, no synergistic effect on the physiological response of olive trees was observed when the mixture of OB and GC was added to the soil. The increase in fruit yield, determined as kg of olives per plant, in the olive trees of the plots amended with biochar was mainly due to a greater water content of the fruits. This finding, together with the better physiological parameters of the plants from the biochar amended plots in the period just before the harvesting, could suggest that the application of olive pomace biochar as soil amendment under super-intensive olive groves could maintain oil yields with a reduction of the irrigation needs. However, long-term studies, including nutrient content and dosage effects, are needed to confirm this finding.

Supplementary Materials

The following are available online at https://www.mdpi.com/article/10.3390/agronomy12102321/s1. Supplementary Figure S1: Representation of linear correlation between soil resistance to penetration and soil moisture (0–5 cm depth); Supplementary Figure S2: Linear correlations between the maximum electron transport rate (ETRmax) and net photosynthetic rate (AN). (a) All treatments; (b) Correlations per treatment: Control, Olive Biochar + Green compost, Green compost, and Olive Biochar. Supplementary Table S1: Soil moisture and resistance to penetrability (in situ parameters) of not amended and amended soils.; Table S2: Physiological parameters measured in olive trees: Net photosynthesis rate (AN), stomatal conductance (gs), maximum rate of electron transport (ETRmax) and calculated value of intrinsic water-use efficiency (WUEi) at day of the year 251, 287, 334 and 418.

Author Contributions

Conceptualization, J.M.D.l.R.; methodology, P.C., A.D.-E. and J.M.D.l.R.; All the authors contributed to data analysis and investigation; resources, J.M.D.l.R. and A.D.-E.; data curation, P.C.; writing—original draft preparation, J.M.D.l.R. and P.C.; writing—review and editing, A.D.-E., P.C. and J.M.D.l.R.; project administration, J.M.D.l.R.; funding acquisition, J.M.D.l.R. All authors have read and agreed to the published version of the manuscript.

Funding

This research was funded by the BBVA foundation through the BBVA Leonardo scholarship in the frame of “Beca Leonardo a Investigadores y Creadores Culturales 2020 de la Fundación BBVA”, (Project Ref. IN[20]_CMA_CMA_0033). The BBVA Foundation is not responsible for the opinions, comments and contents included in this manuscript and/or the results derived from it, which are the total and absolute liability of the authors.

Data Availability Statement

The soil samples and datasets analyzed during the current study are available from the corresponding author on reasonable request.

Acknowledgments

The BBVA foundation is gratefully acknowledged for funding the BBVA Leonardo scholarship in the frame of “Beca Leonardo a Investigadores y Creadores Culturales 2020”, which made this project possible (Ref. IN[20]_CMA_CMA_0033). Authors would like to thank the Plant Eco-Physiology Service at IRNAS-CSIC, as well as Ignacio Girón and the staff of La Hampa Experimental Farm for their technical support. The companies Fertilizantes Orgánicos Melguizo S.L. and Carboliva S.L. are thanked for providing the Green Compost and Olive Biochar, respectively. The authors would like to thank the two anonymous reviewers for their valuable comments on drafts of this paper.

Conflicts of Interest

The authors declare no conflict of interest.

References

  1. United Nations, Department of Economic and Social Affairs, Population Division. World Population Prospects 2019. 2019. Available online: https://population.un.org/wpp/ (accessed on 25 April 2022).
  2. Kumar, A.; Bhattacharya, T.; Mukherjee, S.; Sarkar, B. A perspective on biochar for repairing damages in the soil–plant system caused by climate change-driven extreme weather events. Biochar 2022, 4, 22. [Google Scholar] [CrossRef]
  3. Ministry of Agriculture. Fisheries and Food. Available online: https://www.mapa.gob.es/es/agricultura/temas/producciones-agricolas/aceite-oliva-y-aceituna-mesa/aceite.aspx (accessed on 12 May 2022).
  4. Vilar, J.; Cárdenas, R. El Sector Internacional de Elaboración de Aceite de Oliva: Un Estudio Descriptivo de Los Distintos Países Productores. Úbeda (Jaén); GEA Westfalia: Úbeda, Spain, 2012. [Google Scholar]
  5. Penco-Valenzuela, J.M. Aproximación a Los Costes del Cultivo del Olivo; Desarrollo y Conclusiones del Estudio AEMO; Asociación Española de Municipio del Olivo: Córdoba, Spain, 2020; pp. 1–55. [Google Scholar]
  6. EUROSTAT. 2012. Available online: https://ec.europa.eu/eurostat (accessed on 11 January 2021).
  7. Rejano, L. La manzanilla fina sevillana. Grasas Y Aceites 1999, 5, 60–66. [Google Scholar] [CrossRef]
  8. Leon-Camacho, M.; Viera-Alcaide, I.; Ruiz-Méndez, M. Elimination of polycyclic aromatic hydrocarbons by bleaching of olive pomace oil. Eur. J. Lipid Sci. Technol. 2003, 105, 9–16. [Google Scholar] [CrossRef]
  9. De la Rosa, J.M.; Paneque, M.; Miller, A.Z.; Knicker, H. Relating physical and chemical properties of four different biochars and their application rate to biomass production of Lolium perenne on a Calcic Cambisol during a pot experiment of 79 days. Sci. Total Environ. 2014, 499, 175–184. [Google Scholar] [CrossRef] [PubMed]
  10. Lehmann, J.; Joseph, S. Biochar for Environmental Management: Science, Technology and Implementation; Earthscan: London, UK, 2015. [Google Scholar]
  11. Glaser, B.; Haumaier, L.; Guggenberger, G.; Zech, W. The ‘Terra Preta’ phenomenon: A model for sustainable agriculture in the humid tropics. Naturwissenschaften 2001, 88, 37–41. [Google Scholar] [CrossRef] [PubMed]
  12. Sohi, S.P.; Krull, E.; Lopez-Capel, E.; Bol, R. A Review of Biochar and Its Use and Function in Soil. Advances in Agronomy. Adv. Agron. 2010, 105, 47–82. [Google Scholar] [CrossRef]
  13. Zhao, J.; Shen, X.J.; Domene, X.; Alcañiz, J.M.; Liao, X.; Palet, C. Comparison of biochars derived from different types of feedstock and their potential for heavy metal removal in multiple-metal solutions. Sci. Rep. 2019, 9, 9869. [Google Scholar] [CrossRef]
  14. Jeffrey, S.; Verheijen, F.; van der Velde, M.; Bastos, A.C. A quantitative review of the effects of biochar application to soils on crop productivity using meta-analysis. Agric. Ecosyst. Environ. 2011, 144, 175–187. [Google Scholar] [CrossRef]
  15. Ghassemi-Golezani, K.; Farhangi-Abriz, S. Improving plant available water holding capacity of soil by solid and chemically modified biochars. Rhizosphere 2022, 21, 100469. [Google Scholar] [CrossRef]
  16. Murtaza, G.; Ahmed, Z.; Usman, M.; Tariq, W.; Ullah, Z.; Shareef, M.; Ditta, A. Biochar induced modifications in soil properties and its impacts on crop growth and production. J. Plant. Nutr. 2021, 44, 1677–1691. [Google Scholar] [CrossRef]
  17. Wijitkosum, S. Applying Rice Husk Biochar to Revitalise Saline Sodic Soil in Khorat Plateau Area—A Case Study for Food Security Purposes. In Biochar Applications in Agriculture and Environment Management; Singh, J., Singh, C., Eds.; Springer: Cham, Switzerland, 2020. [Google Scholar] [CrossRef]
  18. Liu, Z.; Chen, X.; Jing, Y.; Li, Q.; Zhang, J.; Huang, Q. Effects of biochar amendment on rapeseed and sweet potato yields and water stable aggregate in upland red soil. Catena 2014, 123, 45–51. [Google Scholar] [CrossRef]
  19. Plaza-Bonilla, D.; Arrúe, J.L.; Cantero-Martínez, C.; Fanlo, R.; Iglesias, A.; Álvaro-Fuentes, J. Carbon management in dryland agricultural systems. A review. Agron. Sustain. Dev. 2015, 35, 1319–1334. [Google Scholar] [CrossRef]
  20. Edeh, I.; Mašek, O.; Buss, W. A meta-analysis on biochar’s ef-fects on soil water properties—New insights and future research challenges. Sci. Total Environ. 2020, 714, 136857. [Google Scholar] [CrossRef] [PubMed]
  21. Yooyen, J.; Wijitkosum, S.; Sriburi, T. Increasing yield of soybean by adding biochar. J. Environ. Res. 2015, 9, 1066–1074. [Google Scholar]
  22. Abd El-Mageed, T.A.; Belal, E.E.; Rady, M.O.A.; Abd El-Mageed, S.A.; Mansour, E.; Awad, M.F.; Semida, W.M. Acidified Biochar as a Soil Amendment to Drought Stressed (Vicia faba L.) Plants: Influences on Growth and Productivity, Nutrient Status, and Water Use Efficiency. Agronomy 2021, 11, 1290. [Google Scholar] [CrossRef]
  23. Blanco-Canqui, H. Biochar and soil physical properties. Soil Sci. Soc. Am. J. 2017, 81, 687–711. [Google Scholar] [CrossRef]
  24. Razzaghi, F.; Obour, B.B.; Emmanuel, A. Does biochar improve soil water retention? A systematic review and meta-analysis. Geoderma 2020, 362, 114055. [Google Scholar] [CrossRef]
  25. Ippolito, J.A.; Cui, L.; Kammann, C.; Wrage-Mönnig, N.; Estavillo, J.M.; Fuertes-Mendizabal, T.; Cayuela, M.L.; Sigua, G.; Novak, J.; Spokas, K.; et al. Feedstock choice, pyrolysis temperature and type influence biochar characteristics: A comprehensive meta-data analysis review. Biochar 2020, 2, 421–438. [Google Scholar] [CrossRef]
  26. Sorrenti, G.; Ventura, M.; Toselli, M. Effect of biochar on nutrient retention and nectarine tree performance: A three-year field trial. J. Plant Nutr. Soil Sci. 2016, 179, 336–346. [Google Scholar] [CrossRef]
  27. Busscher, W.J.; Novak, J.M.; Evans, D.E.; Watts, D.W.; Niandou, M.A.S.; Ahmedna, M. Influence of pecan biochar on physical properties of a Norfolk loamy sand. Soil Sci. 2010, 175, 10–14. [Google Scholar] [CrossRef] [Green Version]
  28. Pandit, N.R.; Mulder, J.; Hale, S.E.; Zimmerman, A.R.; Pandit, B.H.; Cornelissen, G. Multi-year double cropping biochar field trials in Nepal: Finding the optimal biochar dose through agronomic trials and cost-benefit analysis. Sci. Total Environ. 2018, 637, 1333–1341. [Google Scholar] [CrossRef] [PubMed]
  29. Gale, N.V.; Thomas, S.C. Dose-dependence of growth and ecophysiological responses of plants to biochar. Sci. Total Environ. 2019, 658, 1344–1354. [Google Scholar] [CrossRef] [PubMed]
  30. Haddad, K.; Jeguirim, M.; Jerbi, B.; Chouchene, A.; Dutournié, P.; Thevenin, N.; Ruidavets, L.; Jellali, S.; Limousy, L. Olive mill wastewater: From a pollutant to green fuels, agricultural water source and biofertilizer. ACS Sustain. Chem. Eng. 2017, 5, 8988–8996. [Google Scholar] [CrossRef]
  31. Azzaz, A.A.; Jeguirim, M.; Kinigopoulou, V.; Doulgeris, C.; Goddard, M.L.; Jellali, S.; Ghimbeu, C. Olive mill wastewater: From a pollutant to green fuels, agricultural and water source and bio-fertilizer—Hydrothermal carbonization. Sci. Total Environ. 2020, 733, 139314. [Google Scholar] [CrossRef]
  32. Lv, D.; Xu, M.; Liu, X.; Zhan, Z.; Li, Z.; Yao, H. Effect of cellulose, lignin, alkali and alkaline earth metallic species on biomass pyrolysis and gasification. Fuel Process. Technol. 2010, 91, 903–909. [Google Scholar] [CrossRef]
  33. Campos, P.; De la Rosa, J.M. Assessing the Effects of Biochar on the Immobilization of Trace Elements and Plant Development in a Naturally Contaminated Soil. Sustainability 2020, 12, 6025. [Google Scholar] [CrossRef]
  34. Hernandez-Santana, V.; Fernández, J.E.; Rodriguez-Dominguez, C.M.; Romero, R.; Diaz-Espejo, A. The dynamics of radial sap flux density reflects changes in stomatal conductance in response to soil and air water deficit. Agric. For. Meteorol. 2016, 218–219, 92–101. [Google Scholar] [CrossRef]
  35. Obia, A.; Mulder, J.; Martinsen, V.; Cornelissen, G.; Borresen, T. In situ effects of biochar on aggregation, water retention and porosity in light-textured tropical soils. Soil Till. Res. 2016, 155, 35–44. [Google Scholar] [CrossRef]
  36. Ali, Q.; Iftikhar, W.; Shahid, S.; Hussain, A.I.; Perveen, R.; Iqbal, N.; Hussain, S.M.; Hussain, B.; Waseem, M.; Hussain, K.; et al. Alteration of plant physiology by the application of biochar for remediation of metals. In Handbook of Bioremediation Physiological, Molecular and Biotechnological Interventions; Hasanuzzaman, M., Vara Prasad, M., Eds.; Academic Press: Cambridge, MA, USA, 2021; pp. 245–262. [Google Scholar] [CrossRef]
  37. Seehausen, M.L.; Gale, N.V.; Dranga, S.; Hudson, V.; Liu, N.; Michener, J.; Thomas, S.C. Is there a positive synergistic effect of biochar and compost soil amendments on plant growth and physiological performance? Agronomy 2017, 7, 13. [Google Scholar] [CrossRef] [Green Version]
  38. Wang, F.; Wang, X.; Song, N. Biochar and vermicompost improve the soil properties and the yield and quality of cucumber (Cucumis sativus L.) grown in plastic shed soil continuously cropped for different years. Agric. Ecosyst. Environ. 2021, 315, 107425. [Google Scholar] [CrossRef]
  39. San-Emeterio, L.M.; López-Núñez, R.; González-Vila, F.J.; González-Pérez, J.A. Evolution of Composting Process in Maize Biomass Revealed by Analytical Pyrolysis (Py-GC/MS) and Pyrolysis Compound Specific Isotope Analysis (Py-CSIA). Appl. Sci. 2021, 11, 6684. [Google Scholar] [CrossRef]
  40. Miranda Fernandes, R.D.; Cuevas, M.V.; Diaz-Espejo, A.; Hernandez-Santana, V. Effects of water stress on fruit growth and water relations between fruits and leaves in a hedgerow olive orchard. Agric. Water Manag. 2018, 210, 32–40. [Google Scholar] [CrossRef]
  41. Chalmers, D.J.; Mitchell, P.D.; van Heek, L. Control of peach tree growth and productivity by regulated water supply, tree density and summer pruning. J. Am. Soc. Hortic. Sci. 1981, 106, 307–312. [Google Scholar] [CrossRef]
  42. Fernández, J.E. Understanding olive adaptation to abiotic stresses as a tool to increase crop performance. Environ. Exp. Bot. 2014, 103, 158–179. [Google Scholar] [CrossRef]
  43. Fernández, J.E.; Palomo, M.J.; Diaz-Espejo, A.; Girón, I.F. Influence of partial soil wetting on water relation parameters of the olive tree. Agronomie 2003, 23, 545–552. [Google Scholar] [CrossRef]
  44. Campos, P.; Knicker, H.; López, R.; De la Rosa, J.M. Application of Biochar Produced from Crop Residues on Trace Elements Contaminated Soils: Effects on Soil Properties, Enzymatic Activities and Brassica rapa Growth. Agronomy 2021, 11, 1394. [Google Scholar] [CrossRef]
  45. Campos, P.; Miller, A.; Knicker, H.; Costa-Pereira, M.; Merino, A.; De la Rosa, J.M. Chemical, physical and morphological properties of biochars produced from agricultural residues: Implications for their use as soil amendment. Waste Manag. 2020, 105, 256–267. [Google Scholar] [CrossRef]
  46. Genty, B.; Briantais, J.M.; Baker, N.R. The relationship between the quantum yield of photosynthetic electron transport and quenching of chlorophyll fluorescence. Biochim. Biophys. Acta Gen Subj. 1989, 990, 87–92. [Google Scholar] [CrossRef]
  47. Perez-Martin, A.; Michelazzo, C.; Torres-Ruiz, J.M.; Flexas, J.; Fernandez, J.E.; Sebastiani, L.; Diaz-Espejo, A. Regulation of photosynthesis and stomatal and mesophyll conductance under water stress and recovery in olive trees: Correlation with gene expression of carbonic anhydrase and aquaporins. J. Exp. Bot. 2014, 65, 3143–3156. [Google Scholar] [CrossRef] [Green Version]
  48. ISO 659-1988(E); Oilseeds—Determination of Oil Content (Reference Method). 2nd ed. International Organization for Standardization: Geneva, Switzerland; AENOR: Madrid, Spain, 1998; pp. 1–9.
  49. Garrido-Varo, A.; Sanchez, M.T.; De la Haba, M.J.; Torres, I.; Perez-Marin, D. Fast, low-cost and non-destructive physico-chemical analysis of virgin olive oils using near-infrared reflectance spectroscopy. Sensors 2017, 17, 2642. [Google Scholar] [CrossRef]
  50. Carvalho, M.T.M.; MAdari, B.E.; Bastiaans, L.; van Oort, P.A.J.; Leal, W.G.O.; Heinemann, A.B.; da Silva, M.A.S.; Maia, A.H.N.; Parsons, D.; Meinke, H. Properties of a clay soil from 1.5 to 3.5 years after biochar application and the impact on rice yield. Geoderma 2016, 276, 7–18. [Google Scholar] [CrossRef]
  51. Baiamonte, G.; Crescimanno, G.; Parrino, F.; De Pasquale, C. Effect of biochar on the physical and structural properties of a sandy soil. Catena 2019, 175, 294–303. [Google Scholar] [CrossRef]
  52. Bekele, A.; Roy, J.L.; Young, M.A. Use of biochar and oxidized lignite for reconstructing functioning agronomic topsoil: Effects on soil properties in a greenhouse study. Can. J. Soil Sci. 2015, 95, 269–285. [Google Scholar] [CrossRef]
  53. Blanco-Canqui, H. Does biochar application alleviate soil compaction? Review and data synthesis. Geoderma 2021, 404, 115317. [Google Scholar] [CrossRef]
  54. Angelopoulos, K.; Dichio, B.; Xiloyannis, C. Inhibition of photosynthesis in olive trees (Olea europaea L.) during water stress and rewatering. J. Exp. Bot. 1996, 47, 1093–1100. [Google Scholar] [CrossRef]
  55. Misson, L.; Limousin, J.M.; Rodriguez, R.; Letts, M.G. Leaf physiological responses to extreme droughts in Mediterranean Quercus ilex forest. Plant Cell Environ. 2010, 33, 1898–1910. [Google Scholar] [CrossRef]
  56. Diaz-Espejo, A.; Walcroft, A.S.; Fernandez, J.E.; Hafidi, B.; Palomo, M.J.; Giron, I.F. Modeling photosynthesis in olive leaves under drought conditions. Tree Physiol. 2006, 26, 1445–1456. [Google Scholar] [CrossRef]
  57. Boughalleb, F.; Hajlaoui, H. Physiological and anatomical changes induced by drought in two olive cultivars (cv Zalmati and Chemlali). Acta Physiol. Plant. 2011, 33, 53–65. [Google Scholar] [CrossRef]
  58. Fernández, J.E.; Diaz-Espejo, A.; D’Andria, R.; Sebastiani, L.; Tognetti, R. Potential and limitations of improving olive orchard design and management through modelling. Plant Biosyst. 2008, 142, 130–137. [Google Scholar] [CrossRef] [Green Version]
  59. Eyles, A.; Bound, S.A.; Oliver, G.; Corkrey, R.; Hardie, M.; Green, S.L.; Close, D.C. Impact of biochar amendment on the growth, physiology and fruit of a young commercial apple orchard. Trees 2015, 29, 1817–1826. [Google Scholar] [CrossRef]
  60. Baker, R.; Rosenqvist, E. Applications of chlorophyll fluorescence can improve crop production strategies: An examination of future possibilities. J. Exp. Bot. 2004, 55, 1607–1621. [Google Scholar] [CrossRef] [PubMed]
  61. Caruso, G.; Gucci, R.; Urbani, S.; Esposto, S.; Taticchi, A.; Di Maio, I.; Selvaggini, E.; Servili, M. Effect of different irrigation volumes during fruit development on quality of virgin olive oil of cv. Frantoio. Agric. Water Manag. 2014, 134, 94–103. [Google Scholar] [CrossRef]
  62. Dabbou, S.; Dabbou, S.; Chehab, H.; Taticchi, A.; Servili, M.; Hammami, M. Content of Fatty Acids and Phenolics in Coratina Olive Oil from Tunisia: Influence of Irrigation and Ripening. Chem. Biodivers. 2015, 12, 397–406. [Google Scholar] [CrossRef] [PubMed]
Figure 1. Distribution of precipitation and irrigation in liter per square meter (L m−2) (A); mean temperature (°C) during the field experiment (B); location of the experimental station La Hampa at SW Spain (C); and partial view of the plots and indication of the dosage (D).
Agronomy 12 02321 g001
Figure 2. Physiological parameters measured in olive trees: (A) net photosynthesis rate (AN), (B) stomatal conductance (gs), (C) maximum rate of electron transport (ETRmax), and (D) calculated value of intrinsic water-use efficiency (WUEi) at day of the year 251, 287, 334, and 418. C: Control; OB + GC: Olive Biochar+ Green compost; GC: Green Compost; OB: Olive Biochar. Different letters indicate significant differences between treatments in the same sampling (p < 0.05).
Agronomy 12 02321 g002
Figure 3. Water potential (ψleaf) of olive tree leaves measured at DOYs 287, 334, and 418. Different lowercase letters indicate significant differences between treatments in the same sampling (p < 0.05), whereas no letter indicate no significant differences.
Agronomy 12 02321 g003
Table 1. Physical and chemical properties of soils.
Sample DepthDay of YearMonthTreatment
COB + GCGCOB
pH (1:5)0–5 cm118April7.6 ± 0.5 c,9.4 ± 0.1 b8.1 ± 0.2 c9.7 ± 0.4 a
159June7.7 ± 0.1 c9.4 ± 0.0 b7.4 ± 0.0 d9.9 ± 0.0 a
251September8.2 ± 0.0 c9.5 ± 0.0 a8.3 ± 0.0 c9.3 ± 0.0 b
287October8.9 ± 0.1 b10.1 ± 0.1 a8.6 ± 0.0 c9.1 ± 0.0 b
418February9.7 ± 0.78.5 ± 0.29.3 ± 0.79.4 ± 0.6
5–10 cm118April8.1 ± 0.2 b9.1 ± 0.2 a8.2 ± 0.2 b9.3 ± 0.4 a
159June7.7 ± 0.1 d8.1 ± 0.1 c8.3 ± 0.1 b9.7 ± 0.0 a
287October9.1 ± 0.1 c10.1 ± 0.1 a9.4 ± 0.0 b9.0 ± 0.0 c
418February9.4 ± 0.1 a9.0 ± 0.4 a9.9 ± 0.3 a9.3 ± 0.4 a
10–20 cm118April7.9 ± 0.3 b9.0 ± 0.1 a8.6 ± 0.2 a9.0 ± 0.6 a
251September9.1 ± 0.1 a9.0 ± 0.2 a9.0 ± 0.0 a8.8 ± 0.0 a
287October9.0 ± 0.0 a9.2 ± 0.0 a9.1 ± 0.0 a8.9 ± 0.0 a
418February9.4 ± 0.0 a9.2 ± 0.2 a9.6 ± 0.3 a9.0 ± 0.1 a
EC [µS cm−1] (1:5)0–5 cm118April191 ± 56 c743 ± 330 ab450 ± 167 b754 ± 211 a
159June227 ± 81 d475 ± 39 c1242 ± 22 a789 ± 33 b
251September1343 ± 12 c1798 ± 102 b2330 ± 42 a1185 ± 49 c
287October904 ± 13 c1964 ± 12 a1193 ± 6 b473 ± 30 d
418February240 ± 82 a130 ± 29 a160 ± 38 a188 ± 52 a
5–10 cm118April167 ± 32 c307 ± 109 ab276 ± 112 b353 ± 110 a
159June431 ± 21 a180 ± 10 b309 ± 85 ab435 ± 26 a
287October305 ± 25 b478 ± 2 a274 ± 7 b217 ± 4 c
418February119 ± 25 a109 ± 6 a169 ± 52 a107 ± 8 a
10–20 cm118April211 ± 69 a381 ± 262 a219 ± 38 a257 ± 76 a
251September379 ± 28 a480 ± 89 a410 ± 32 a506 ± 3 a
287October226 ± 3 b330 ± 13 a243 ± 8 b189 ± 5 c
418February144 ± 11 a137 ± 11 a142 ± 55 a104 ± 9 a
Water content (105 °C; %)0–5 cm118April17.4 ± 1.6 a15.9 ± 2.9 a16.5 ± 1.6 a19.1 ± 3.7 a
251September11.7 ± 0.4 b15.2 ± 0.3 a12.6 ± 0.5 b15.5 ± 0.1 a
287October13.7 ± 0.3 b15.3 ± 2.4 b14.7 ± 0.5 b26.8 ± 0.6 a
418February9.7 ± 0.1 ab7.4 ± 1.3 b5.4 ± 0.2 b18.6 ± 6.5 a
5–10 cm118April16.8 ± 1.7 a13.5 ± 3.0 a15.2 ± 1.9 a17.3 ± 3.0 a
287October14.4 ± 0.3 b14.1 ± 0.7 b13.7 ± 0.3 b17.6 ± 0.2 a
418February11.1 ± 3.2 b7.0 ± 0.3 b8.6 ± 0.7 b18.6 ± 0.6 a
10–20 cm118April15.9 ± 2.2 a15.9 ± 2.2 a16.1 ± 0.3 a17.1 ± 1.9 a
251September15.1 ± 0.1 a15.1 ± 0.1 a15.8 ± 0.2 a15.9 ± 0.1 a
287October14.9 ± 0.9 a14.9 ± 0.9 a14.8 ± 0.4 a16.9 ± 0.5 a
418February12.6 ± 2.0 b7.0 ± 1.7 c12.6 ± 0.4 b18.3 ± 0.5 a
Different letters indicate significant differences between treatments in the same sampling (p < 0.05). C: Control; OB + GC: Olive Biochar+ Green compost; GC: Green Compost; OB: Olive Biochar.
Table 2. Average soil moisture and resistance to penetrability (in situ measurements) of not amended and amended soils.
Sample DepthSeason
Treatment
COB + GCGCOB
Soil moisture (%)0–5 cmSpring7.1 ± 6.5 c13.6 ± 6.0 b13.4 ± 6.7 b15.5 ± 5.4 a
Summer11.6 ± 7.8 b20.3 ± 0.3 a19.9 ± 1.8 a20.1 ± 1.7 a
Autumn16.7 ± 5.5 a19.9 ± 1.2 a18.6 ± 3.3 a19.0 ± 2.6 a
Winter11.2 ± 7.9 c12.2 ± 6.9 bc17.5 ± 5.3 ab18.7 ± 2.6 a
5–10 cmSpring11.5 ± 6.2 b17.0 ± 3.3 a17.3 ± 2.9 a18.0 ± 2.3 a
Summer17.1 ± 4.8 b20.6 ± 0.1 a20.6 ± 0.2 a20.2 ± 3.0 a
Autumn19.5 ± 2.2 a20.5. ± 0.2 a20.1 ± 1.3 a20.5 ± 0.2 a
Winter17.3 ± 3.8 a16.1 ± 4.0 a20.4 ± 0.3 a20.4 ± 0.2 a
Resistance to penetrability (kg cm−2) Spring3.8 ± 1.5 a2.5 ± 1.5 b2.6 ± 1.5 b2.0 ± 1.1 c
Summer4.0 ± 1.9 a1.7 ± 1.1 b1.8 ± 1.0 b1.3 ± 0.8 b
Autumn3.5 ± 1.7 a1.2 ± 0.3 c1.8 ± 0.9 b1.5 ± 0.9 b
Winter4.7 ± 1.6 a2.0 ± 1.0 c3.7 ± 1.7 b2.6 ± 1.2 c
Different letters indicate significant differences between treatments in the same sampling (p < 0.05).
Table 3. Primary productivity parameters per olive tree for each treatment.
TreatmentOlive Fruit Yield (kg per Tree)Olive Water Content (% w/w)Total Fat (% w/w)Oil Free AcidityOlive Oil Yield (kg per Tree)Total Fat (% Dry Weight)
C10.1 ± 0.4 a61.7 ± 0.3 a15.1 ± 0.2 a0.31 ± 0.021.5239.4
GC10.5 ± 0.3 a61.0 ± 0.4 a15.8 ± 0.4 a0.35 ± 0.031.6640.5
OB + GC10.8 ± 0.2 a61.7 ± 0.3 a15.2 ± 0.2 a0.31 ± 0.031.6439.7
OB11.9 ± 0.3 b63.9 ± 0.5 b14.1 ± 0.3 b0.29 ± 0.041.6839.1
Different letters indicate significant differences between treatments for the same parameter (p < 0.05), whereas no letter indicates no significant differences.
Publisher’s Note: MDPI stays neutral with regard to jurisdictional claims in published maps and institutional affiliations.

