Article

Salinity Effect on Plant Growth Parameters and Fruit Bioactive Compounds of Two Strawberry Cultivars, Coupled with Environmental Conditions Monitoring

by
Nikoleta-Kleio Denaxa
1,*,
Aggeliki Nomikou
2,
Nikolaos Malamos
2,
Eleni Liveri
2,
Petros Anargyrou Roussos
1 and
Vasileios Papasotiropoulos
2,*
1
Department of Crop Science, Agricultural University of Athens, 11855 Athens, Greece
2
Department of Agriculture, University of Patras, 30200 Messolonghi, Greece
*
Authors to whom correspondence should be addressed.
Agronomy 2022, 12(10), 2279; https://doi.org/10.3390/agronomy12102279
Submission received: 13 August 2022 / Revised: 17 September 2022 / Accepted: 20 September 2022 / Published: 23 September 2022
(This article belongs to the Special Issue Toward a "Green Revolution" for Crop Breeding)

Abstract

:
Salinity stress is one of the most vital abiotic stresses, impairing the productivity of crops in both irrigated and dry areas. A pot experiment was carried out in a greenhouse environment, aiming to examine the relevant tolerances and evaluate the effect of salinity stress on plant growth, fruit physiological, and quality traits of two strawberry cultivars, Camarosa and Rociera. The plants were irrigated with water with electrical conductivity (EC) of 0.4 dS m−1 (control), or with a salt solution with either ECs 2 dS m−1 (moderate salt stress) or 4 dS m−1 (elevated salt stress). Furthermore, several meteorological parameters, as well as soil moisture, were monitored inside the greenhouse. The results showed that salinity induced osmotic stress, water deprivation, and toxic effects, affecting the growth parameters and yield of both cultivars. The elevated salt stress imposed a negative impact on Rociera’s fruits carbohydrates, organic acids, and anthocyanins, while the antioxidant capacity increased. However, Rociera exhibited high total yield/plant and total yield even under elevated salt stress compared to Camarosa. Camarosa plants grown under high salt levels presented low salinity tolerance index, plant water content, and growth parameters. The fruits exhibited low fresh weight but high sweetness index and antioxidant power. An accumulation of soluble sugars under saline conditions, especially sucrose, was also detected in cv. Camarosa fruits when compared to Rociera. Therefore, the two cvs. exhibited a different pattern of response to salinity stress concerning their physiological, biochemical and nutritional characteristics; however, either could be an interesting alternative for cultivation in areas where a slight salinization of the water or soil imposes a limitation on the rather salt-sensitive crops. Agronomic and biochemical evaluation of salinity stress coupled with monitoring of greenhouse microclimatic conditions will lead to a better understanding of the effects on plant growth and quality characteristics, enhancing the productivity of strawberry cultivars, especially under salt-affected environments.

1. Introduction

Plants are typically exposed to a broad myriad of biotic and abiotic stresses, including feeding from wild animals and insects, weed infestation, hail, mechanical injury, diseases, low soil fertility, drought, salinity, and other stresses that can diminish the plant photosynthetic area, and thus, the attained total plant biomass or grain yield [1,2]. Salinity is an environmental stress, one which inhibits the growth, development and productivity of many plants in both irrigated and dry areas [3,4]. By 2050, it is estimated that roughly half of the world’s arable areas will be damaged by salt stress [5]. Salt stress is an ever-increasing problem worldwide, due to the continuous accumulation of salt in agricultural soils as a result of irrigation, fertilization, and climate warming [6]. Under the usual climatic change scenarios, agricultural systems would need to be extended to drier and more saline lands to meet increasing food demand. Furthermore, as the amount of water available for crop production decreases in the future, the use of low-quality irrigation water will rise [7]. Therefore, the use of saline water and wastewater in agriculture is regarded one of the alternative sources of irrigation [8].
Soil salinization is affected by numerous factors, including climate change and uncontrolled anthropogenic activities by the continuously increasing human population [9,10]. Limited rainfall, high evapotranspiration, high temperature, and poor water management all contribute to increased soil salinity in arid and semiarid regions of the world [11]. Thus, it is critical to determine the impact of salt stress on crop development and elucidate the mechanisms of plant response to salinity. The adaptation or tolerance of plants to salinity stress involves complex physiological, biochemical, and molecular mechanisms, which are still far from being fully understood. The main physiological and biochemical factors include ion homeostasis and compartmentalization, ion transport and uptake, biosynthesis of osmoprotectants and compatible solutes, activation of antioxidant enzymes and synthesis of antioxidant compounds, synthesis of polyamines, generation of nitric oxide (NO), and hormone modulation [12]. Plants also use a variety of molecular mechanisms to regulate (either upregulating or downregulating) the synthesis of specific gene products in response to salt stress [12].
Salinity, as well as other intense abiotic stresses, influences numerous physiological, biochemical and morphological functions of plants, such as plant development and metabolism, water and nutrient uptake, photosynthetic performance, antioxidant mechanism, yield, etc. [13,14,15]. It is well documented that the first response of a plant to osmotic pressure is to limit its leaf development, especially under intense stress levels [16]. Many researchers have reported that increased salt concentration around the roots causes a metabolic disorder and induces toxicity symptoms, especially in the older leaves, thus affecting the photosynthetic capacity and photoassimilates production, which consequently reduces the plant’s growth rate [17,18,19,20]. However, many researchers have proposed that mild stress conditions enhance the antioxidant content in the edible part of the plant and increase plant adaptability to stress-prone environments [21,22]. Therefore, the application of salt stress during fruit production has been proposed by several researchers to improve fruit quality, especially sweetness [23,24].
Strawberry (Fragaria × ananassa Duch.), is the most commercially and economically important cultivated berry in the horticulture sector. Over the last decade, the high market demand has led to increased strawberry production in different parts of the world, even in drier and more saline lands with poor-quality irrigation water [25]. However, strawberry plants are characterized as salt-sensitive fruit crops [26,27]. Variation in salt tolerance among strawberry cultivars has been recorded to date [28,29,30,31,32,33], emphasizing thus the importance of cultivar (cv) selection when soil or water salinity is too high [34].
The present study aims to evaluate the influence of moderate and elevated salinity stress on plant growth and quality traits, with special attention to bioactive compounds, of two strawberry cultivars which are currently cultivated in Greece. One is Camarosa, by far the most widespread cultivar in Western Greece, while the other is Rociera, a very prominent cultivar, which has been recently introduced in the region. Furthermore, several meteorological parameters and soil moisture were monitored inside the greenhouse in order to acquire essential information about the prevailing microclimatic conditions, which will eventually lead to a better understanding of the effects on plant growth and quality characteristics.

2. Materials and Methods

2.1. Plant Material and Experimental Design

The experiment was conducted at a greenhouse located at the Department of Agriculture, University of Patras, in Amaliada, Greece (latitude: 37.79353° N, longitude: 21.36352° E, 60 m above sea level). The plant material consisted of fresh strawberry plants of cv. Camarosa and cv. Rociera. The latter genotype was suggested by the Research & Development (R&D) Department of Berryplasma World Ltd. (Varda Ilias, Greece).
The experiment was arranged as a randomized complete block (RCB) design, with three treatments and three replications of eleven plants per treatment. In total, 198 plants (99 plants/cultivar) were used, i.e., 2 cultivars × 3 salt treatments × 3 replications × 11 plants per replication.
The plants were planted in early November in 5 L black plastic pots (20 cm depth, 21 cm top dimensions, 17 cm bottom dimensions) filled with commercial compost—brown peat (pH = 5.5–6.3), without basic fertilization. The same volume of water was provided to all plants and the frequency of watering was determined according to the requirements of the plants to keep sufficient soil moisture. The plants were fertilized with Fe-EDDHA, and a water-soluble fertilizer (21-21-21 N-P-K, plus micronutrients and vitamins) at a dose rate of 1 g per plant to ensure optimum nutrient status.
Air temperature (°C), relative humidity (%), barometric pressure (kPa) and solar radiation flux density (W m−2) were monitored using sensors placed in the center of the greenhouse (ATMOS 14 and Pyr, both from METER Group, Inc., Pullman, WA, USA). Furthermore, water content sensors (% v/v) of appropriate size (ECH20 EC-5, METER Group, Inc., Pullman, WA, USA) were placed inside pots, each one corresponding to a different treatment. All microclimate and water content readings were automatically stored every 10 min using a datalogger (Em50, METER Group, Inc., Pullman, WA, USA).
Salt treatments started 65 days after planting, in early January, when the plants had developed enough leaves (plants were at the growth stage 15–17, i.e., 5 to 7 true leaves unfolded-based on BBCH crop growth stage scale). The salt stress treatments consisted of: (a) water from the urban network with no added NaCl with electric conductivity (EC) 0.4 dS m−1 (control); (b) NaCl solution with EC = 2 dS m−1; and (c) NaCl solution with EC = 4 dS m−1. For saline solutions, tanks of 50 L were used where salt (NaCl, ACS reagent, ≥99.0%) was added to the tap water with a continuous shaking and measuring of solution EC until EC setpoints were reached. The water’s electrical conductivity was determined using a portable conductivity meter (Delta OHM, HD 2306 model, Selvazzano Dentro, PD, Italy). In order to avoid sudden osmotic stress to plants, the salt concentration of solutions was gradually increased from week to week, to the desired level. Plants were irrigated with 0.50 L water (control) or with the salt solutions, on average twice a week, avoiding wilting.
A total of three sampling events took place; each event lasted approximately one month. The first occurred on 24 January to 23 February, the second sampling took place on 24 February to 27 March, and the last one on 28 March to 17 April. All fully ripe fruits per plant (red color in the whole fruit) were harvested, placed into labeled plastic bags, and immediately transferred via a portable freezer to the laboratory for further analysis.

2.2. Physical Characteristics Determination

The weight of each individual fruit, along with its diameter and length, were recorded with an electronic balance (Kern 470, Kern and Sohn, GmbH, Germany) and a digital caliper (Starrett, 727 Series, Athol, New England, MA, USA), respectively. Furthermore, overall fruit production was classified into two categories based on fruit diameter (according to the European Commission Regulation (843/2002) on the strawberry fruit trade), ‘Extra’, fruits with diameter above 25 mm, and ‘I and II’ for fruits with a diameter of at least 18 mm. Malformed or diseased fruits were not included in this classification. Fruit color was measured, at two opposite points of the equatorial region of each fruit, with a Minolta CR 300 reflectance Chroma Meter (Minolta, Osaka, Japan).
On completion of the above measurements, sepals were removed, and the fruits were stored at −25 °C for further analyses. The sample lots were mixed frozen by a food processor to obtain a homogenous mixture. Furthermore, fruit dry weight of at least ten fruits per replicate was measured at the end of each sampling event, by drying the whole fruit in an oven at 70 °C to constant weight, and the ratio of fresh versus dry weight was determined.

2.3. Evaluation of Plant Growth Parameters and Toxicity Symptoms

At the end of the trial (7 months after planting), five plants from each block were randomly selected, the above-ground plant mass (AGPM) and the roots were separated and data on plant growth parameters were determined (AGPM fresh weight, root fresh weight, AGPM dry weight, and root dry weight per plant). AGPM and root dry weight were determined after the plant material was dried in an oven at 70 °C for 72 h to a constant weight. The water content of the AGPM and roots were calculated using the following formulas:
AGPM water content = AGPM fresh weight − AGPM dry weight
Root water content = Root fresh weight − Root dry weight
At the end of each sampling event, the growth rate of the plants, as well as, the foliar salt toxicity symptoms were assessed, using the following scale for each plant, from 0 to 5, where: 0 = no symptoms (no foliar damage), 1 = symptoms such as leaf tip burn in less than 25% of the foliar, 2 = burn symptoms at 25–50% of the foliar, 3 = burn symptoms at 50–75% of the foliar, 4 = symptoms at more than 75% of the foliar, and 5 = dead plants. Furthermore, the salt tolerance index (TI) was evaluated using the following formula:
Tolerance index (TI) = (Treatment dry weight/Blank dry weight) × 100.

2.4. Total Soluble Solids (TSS), Total Titratable Acidity (TA) and pH Determinations

A fraction (2 mL) of the homogenous mixture was centrifuged at 12,000 rpm for 5 min and the supernatant clear juice was analyzed for total soluble solids (TSS), total titratable acidity (TA), and pH. TSS was evaluated with a digital refractometer (Hanna Intruments, HI 96801 model) at 20 °C and expressed as oBrix. TA was determined in diluted juice (0.5 mL juice and 19.5 mL distilled water) by titrating to pH 8.2 using 0.1 N NaOH. TA was expressed at % citric acid. pH was determined using a pH meter (Consort C5010, Cleaver) after dilution of 1 mL juice in 9 mL of distilled water.

2.5. Total Phenol Content, Total Anthocyanin Content and Antioxidant Capacity Determination

A frozen strawberry fruit mixture (0.5 g) was extracted twice with 5 mL 75% (v/v) ethanol under periodical stirring at 38 °C in a water bath. After centrifugation the supernatant was assessed for total phenols, total o-diphenols, total flavonoids and total flavanols according to Roussos et al., 2020. The results were expressed as mg equivalent of gallic acid, caffeic acid, and catechin, per g fresh weight, respectively.
The total anthocyanin content was assessed based on pH differentiation method as described by Roussos et al., 2020. Results were expressed as mg pelargonidin 3-glucoside 100 g−1 fresh tissue (MW = 433.2 and ε = 36,000 L mol−1 cm−1).
The antioxidant capacity of strawberry fruits was evaluated using the DPPH and FRAP assays based on the method of Roussos et al. [35] and expressed as μmol Trolox equivalents per g fresh weight.

2.6. Carbohydrates Determination

Soluble sugars extraction and determination was performed by the method described by Denaxa et al. [36]. For the HPLC sugar analysis, a Shimadzu Nexera X2 HPLC system equipped with an LC-30AD pump and HP1047A refractive index detector (Agilent, Santa Clara, CA, USA) was used. The separation of the carbohydrates was achieved through a Hamilton HC-75 cation exchange column, calcium form (Ca2+) (305 mm × 7.8 mm, 9 μm) (Hamilton, Bonaduz, Switzerland), equilibrated at 80 °C, at a flow rate 0.6 mL min−1 with water as mobile phase. Three soluble sugars were detected in the strawberry fruits, i.e., sucrose, glucose, and fructose. Total sugar concentration was estimated by summing the concentrations of the detected individual sugars. Final concentrations were expressed as mg g−1 fresh weight.
The sweetness index (SI) of the fruit, was calculated based on the relative amount and sweetness properties of each carbohydrate [37]. Therefore, SI was calculated as 1.00 × (glucose concentration) + 1.35 × (sucrose concentration) + 2.3 × (fructose concentration).

2.7. Organic Acids Determination

Approximately 0.5 g of frozen strawberry fruit mixture was extracted twice with 5 mL aqueous 3% (w/v) metaphosphoric acid at room temperature for 30 min under periodical vortexing, as described by Roussos et al. [35]. For the organic acids determination, a Shimadzu Nexera X2 HPLC system equipped with an LC-30AD pump and SPD-M20A diode array detector (DAD) was used. The analysis was performed on a Li-Chrospher RP18 column (250 mm × 4.6 mm, 5 μm, Merck Kenilworth, NJ, USA), eluted isocratically at a flow rate of 1 mL min−1 and the mobile phase was consisted of 0.02% (v/v) formic acid in water. Four organic acids (citric, malic, fumaric, and ascorbic acid) were detected at 200 nm, and the total organic acid concentration was also calculated. Final concentrations were expressed as mg g−1 fresh weight.

2.8. Statistical Analyses

All samples were analyzed twice regarding fruit quality characteristics, while each fruit was measured separately for its physical characteristics. The statistical analyses were performed using the JMP 7.0 statistical software (SAS Institute, Cary, NC, USA). Data were analyzed as two-way ANOVA with the factors being the salt treatments and the strawberry cultivars. The data were analyzed together, with each sampling event serving as replication. Significant differences were detected by using Tukey’s HSD test at α = 0.05. Additionally, principal component analysis (PCA) after varimax rotation was separately performed per cultivar, to visually describe the effect of each salinity level on all the measured variables by a reduced number of factors. Discriminant analysis by forward selection was also performed to test the possible classification of the tested cultivars as well as that of salinity levels, based on the measured variables.

3. Results

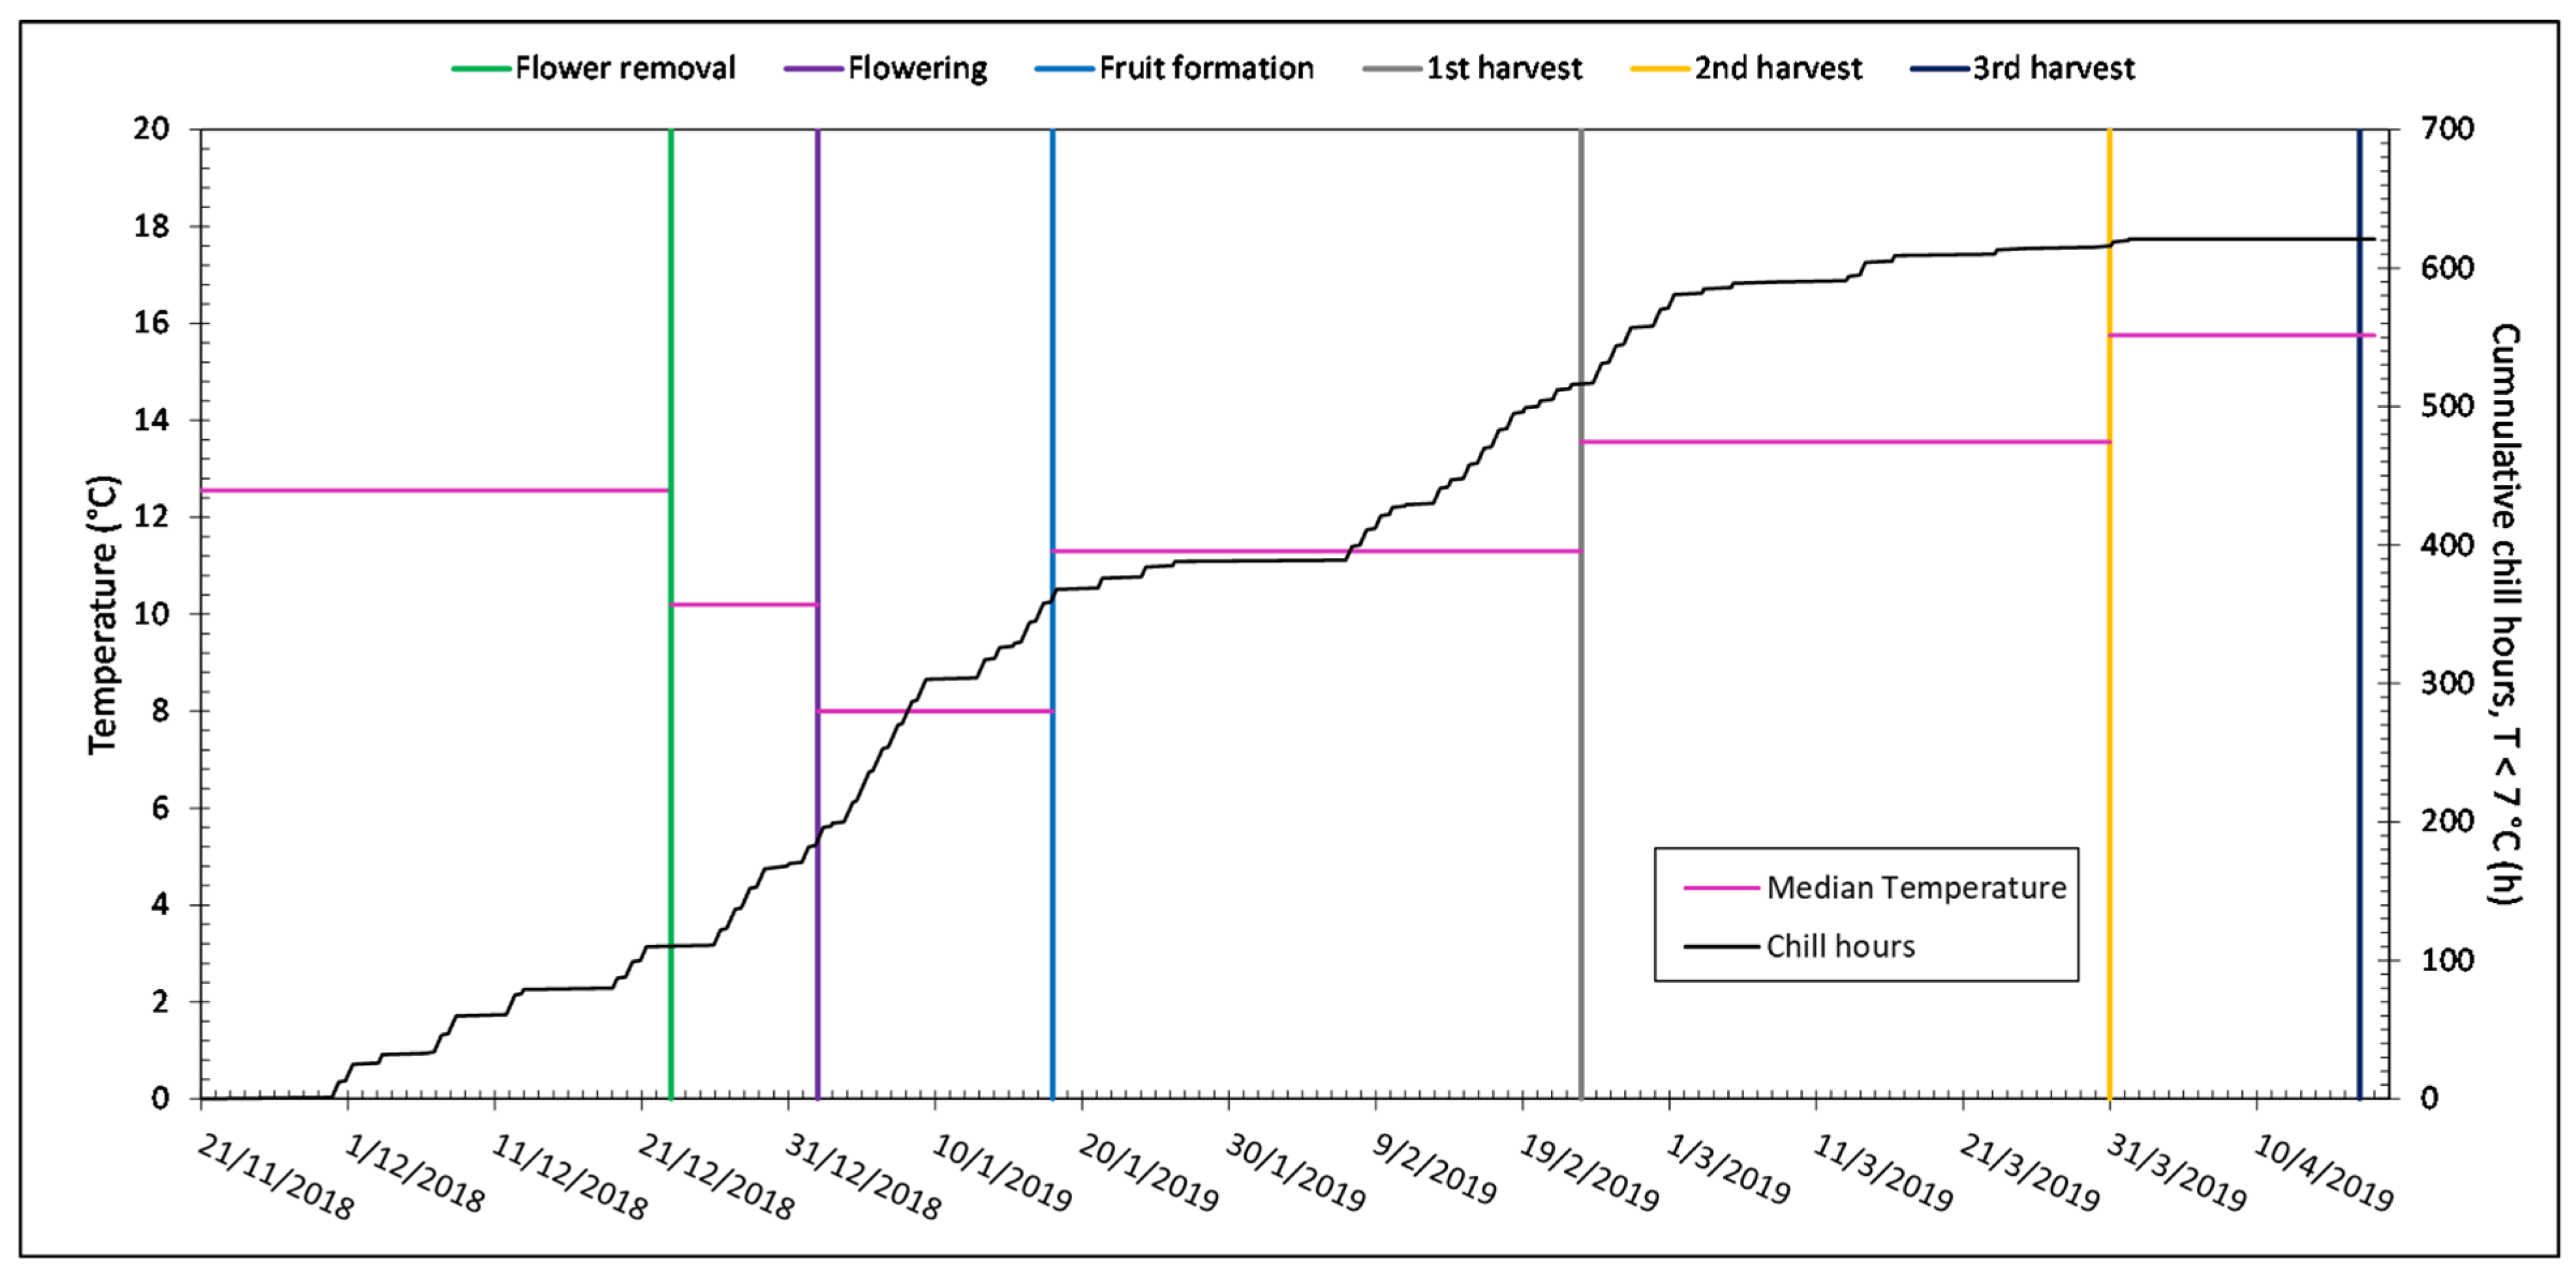
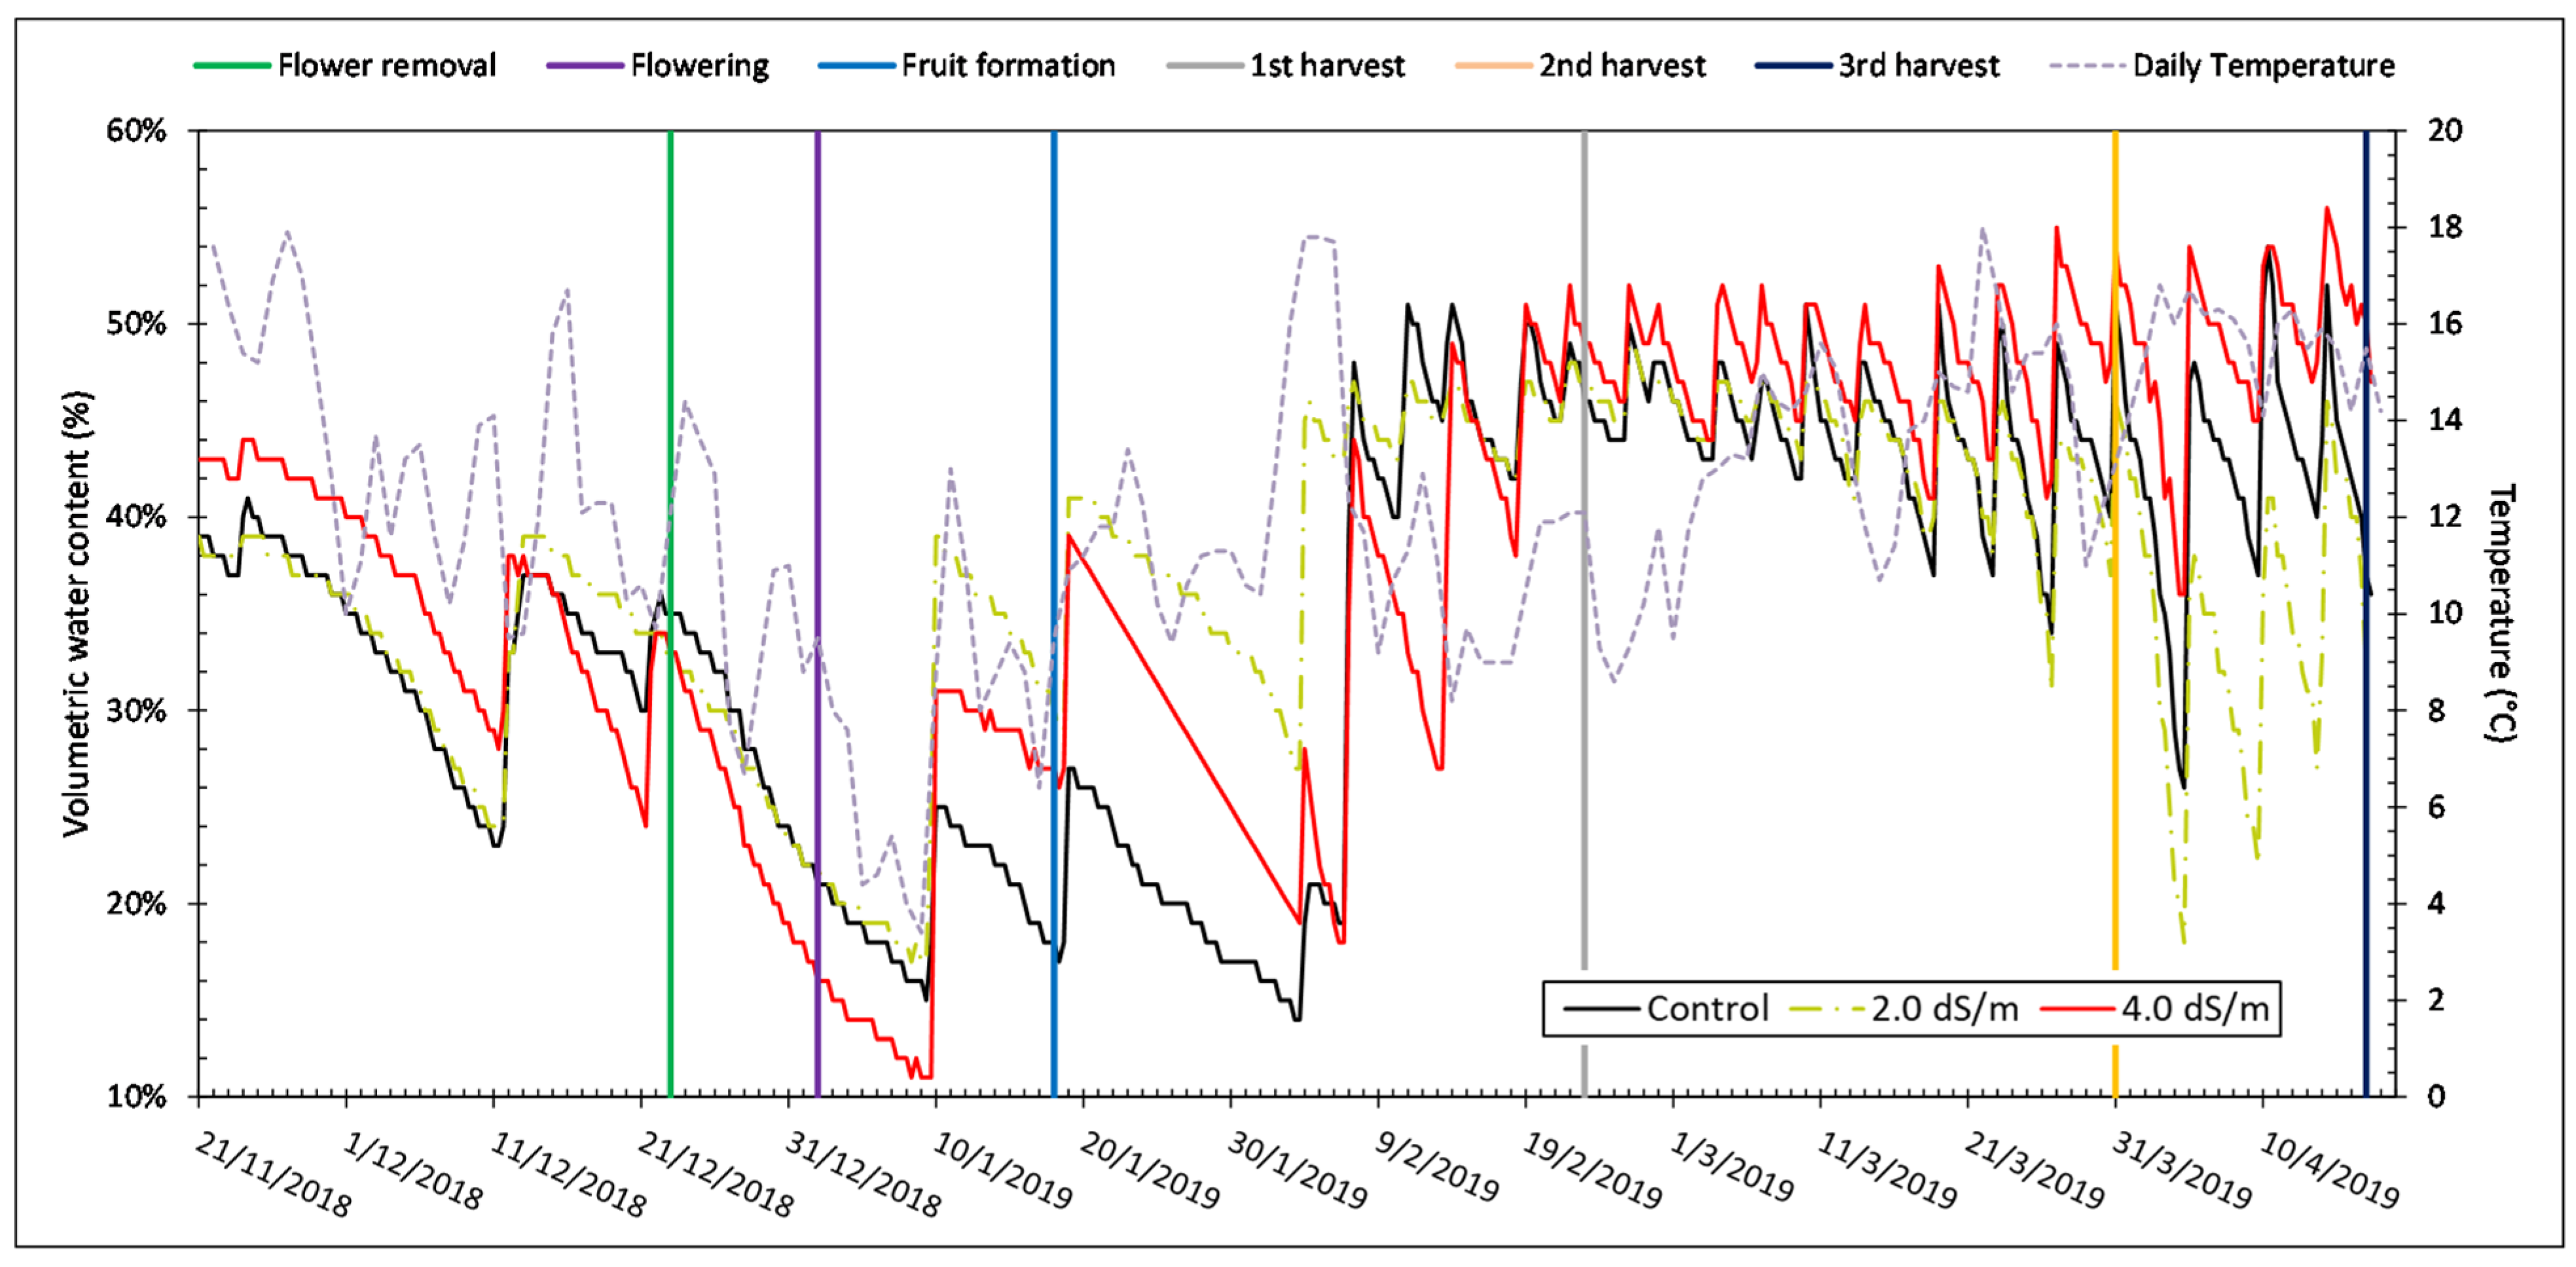
3.1. Microclimate and Soil Moisture Data

Strawberry flower induction has been shown to be significantly affected by temperature as well as photoperiod. In this context, Table 1 and Table 2 depict the day and night monthly average values for temperature, relative humidity, and solar radiation that occurred inside the greenhouse during the experiment. January was the coldest month, with average temperatures of 12.6 °C during the day and 6.9 °C during the night. Also, January exhibited the lowest amount of incoming solar radiation relative to other months with only 124.1 W m−2 per day, while March and April reached over 260 W m−2 per day. The increased incoming solar radiation in March and April resulted in higher temperatures. The variation of relative humidity during the experiment was typical, with higher values during the night. Obviously, relative humidity inside the greenhouse was strongly affected by the rainfall events that occurred during the experiment.
Figure 1 presents the cumulative chill duration in hours and temperature data against the different experiment stages. Fruit formation initiated on 18 January 2019 accumulating 368 hours of temperature below 7 °C, while at the beginning of the first harvesting period, a total of 521 chill hours were totaled. It is obvious that the prevailing temperatures before fruit formation were well below 10 °C. The median temperature during the period from 2 January 2019 up to 18 January 2019 was 8 °C, resulting in a sharp increase of chill duration, while the corresponding median before the first harvesting round, i.e., from 18 January 2019 up to 23 January 2019 ascended to 11.3 °C. On 1 April 2019, the total accumulated chill duration reached 621 hours, which remained constant until the end of the experiment.
Figure 2 presents the eight-hour averaged water content data of the three pots of cv. Camarosa against the different experiment stages and the daily air temperature. The selection of the eight-hour timescale allowed the assessment of the water content variation since the irrigation events during each day of the experiment were clearly identified. Thus, the plants were irrigated 24 times during the cultivation period, and it is obvious that the variation of the water content is similar between the three treatments, especially after the irrigation events. During the coldest period, i.e., 23 December 2019 up to 18 January 2019, only three irrigations were applied, reflecting the limited water deficit of the plants. From 2 February 2019 until 5 February 2019 temperature was increased, so irrigation was applied on 4 February 2019 and 7 February 2019.

3.2. Effect of Salt Stress on Strawberry Fruit Physical and Quality Parameters

Salt stress negatively affected some of the fruit’s physical and quality parameters, such as mean fruit weight, fruit length, fruit diameter, diameter/length ratio, number of fruits per plant, the dry/fresh weight ratio, and finally the total yield per plant, as well as the total yield (Table 3 and Table 4). Mean fruit weight was significantly reduced in cv. Camarosa plants treated with the high salinity solution. Similarly, the same plants exhibited the lowest mean fruit diameter and fruit length among treatments (Table 3). The ratio of fruit diameter to weight did not differ significantly among the various salt treatments for cv. Camarosa or cv. Rociera; however, the plants of cv. Camarosa exhibited significantly lower values compared to cv. Rociera (Table 3). Furthermore, the dry/fresh weight ratio was highest in cv. Camarosa and cv. Rociera control plants, with a significant difference from that determined in the salt treated plants of both cultivars. On the other hand, the fruit’s firmness exhibited no difference among the various treatments.
The number of fruits per plant was significantly reduced in cv. Camarosa plants irrigated with the high salinity solution (Table 4). Furthermore, cv. Camarosa and cv. Rociera control plants exhibited the highest percentage of fruits classified into the Extra category and, at the same time, the lowest percentage of fruits within the I plus II category (Table 4). Finally, the total yield per plant and total yield differed significantly among treatments, with cv. Rociera exhibiting higher values compared to cv. Camarosa. Furthermore, cv. Camarosa control plants presented significantly higher total yield per plant and total yield than did moderate and elevated salinity treatments. Overall, the total yield was reduced significantly when salt stress applied in both cultivars (Table 4). It is noteworthy that total yield/plant in cv. Camarosa plants treated with the medium and high salinity solution was almost 21.5% and 29.1% reduced, respectively, compared with the control treatment. Similarly, in cv. Rociera the reduction was on average 17.3% and 22.7%.
The salt treatments did not exhibit any significant effect on the fruit juice total soluble solids (TSS), total titratable acidity (TA), or their ratio (TSS:TA) (Table 5) in the two cultivars. As far as the fruit color is concerned, there was not detected any statistically significant difference among treatments in any of the measured variables (L*, Chroma and Hue).

3.3. Effect of Salt Stress on the Phenolic and Anthocyanin Content of Strawberry Fruits and Antioxidant Capacity

The total phenols and flavonoids content differed significantly between control and high salt treatment for cv. Camarosa, which exhibited higher values, while the above parameters did not differ significantly for cv. Rociera. As far as the total o-diphenols and total flavanols content is concerned, there was no statistically significant difference among the treatments. However, the salt stress resulted in high total anthocyanin content for both cultivars, with a significant difference from control treatment (Table 6). Furthermore, total anthocyanins content of cv. Camarosa fruits was significantly higher compared to cv. Rociera.
According to FRAP assay, the antioxidant capacity of cv. Camarosa exhibited the highest values for the plants treated with the high salinity solution, whereas cv. Rociera control plants showed significantly lower value compared to both salinity treatments (Table 6). Furthermore, the highest antioxidant capacity values, according to DPPH assay, were measured for cv. Camarosa plants treated with the high salinity solution, as well as for cv. Rociera plants treated with the medium or high salinity solution (Table 6).

3.4. Effect of Salt Stress on Strawberry Fruit Carbohydrate and Organic Acids Concentration

The results presented in Table 7 show that strawberry cultivars differed significantly in their soluble carbohydrates (fructose, glucose, sucrose) concentration when exposed to salinity. Therefore, in cv. Rociera, a decrease due to salt stress in the concentrations of sucrose, glucose, fructose, and total sugars was observed. That was also the case for the sweetness index (SI). The detected decrease of total sugars and SI in cv. Rociera at the high salt stress level compared with the control was approximately 23%. On the other hand, in cv. Camarosa, the measured carbohydrates concentration increased considerably at the high salt stress compared with control treatment (Table 7). It is noteworthy that high salt application had a 29.8% increase in total sugars concentration and 31% in SI.
Citric acid was the predominant organic acid detected among the measured organic acids in strawberry fruits (Table 8). The fruits’ ascorbic acid was negatively affected by salt stress imposition, a phenomenon which was more pronounced for cv. Camarosa. Therefore, the fruits deriving from cv. Camarosa plants exposed to salt stress presented the lowest concentration of ascorbic acid compared with the other treatments. A decrease in ascorbic acid concentration was also detected in fruits of cv. Rociera, but the difference was not statistically significant compared with control. Malic acid did not present any statistical fluctuations. Notably, a significant rise in citric acid concentration was observed in the fruits of salt-stressed plants of both cultivars; however, a more pronounced increase was found in the fruits of cv. Camarosa. Finally, the fruits from cv. Camarosa plants treated with the high salinity solution presented the highest concentration of total acids.

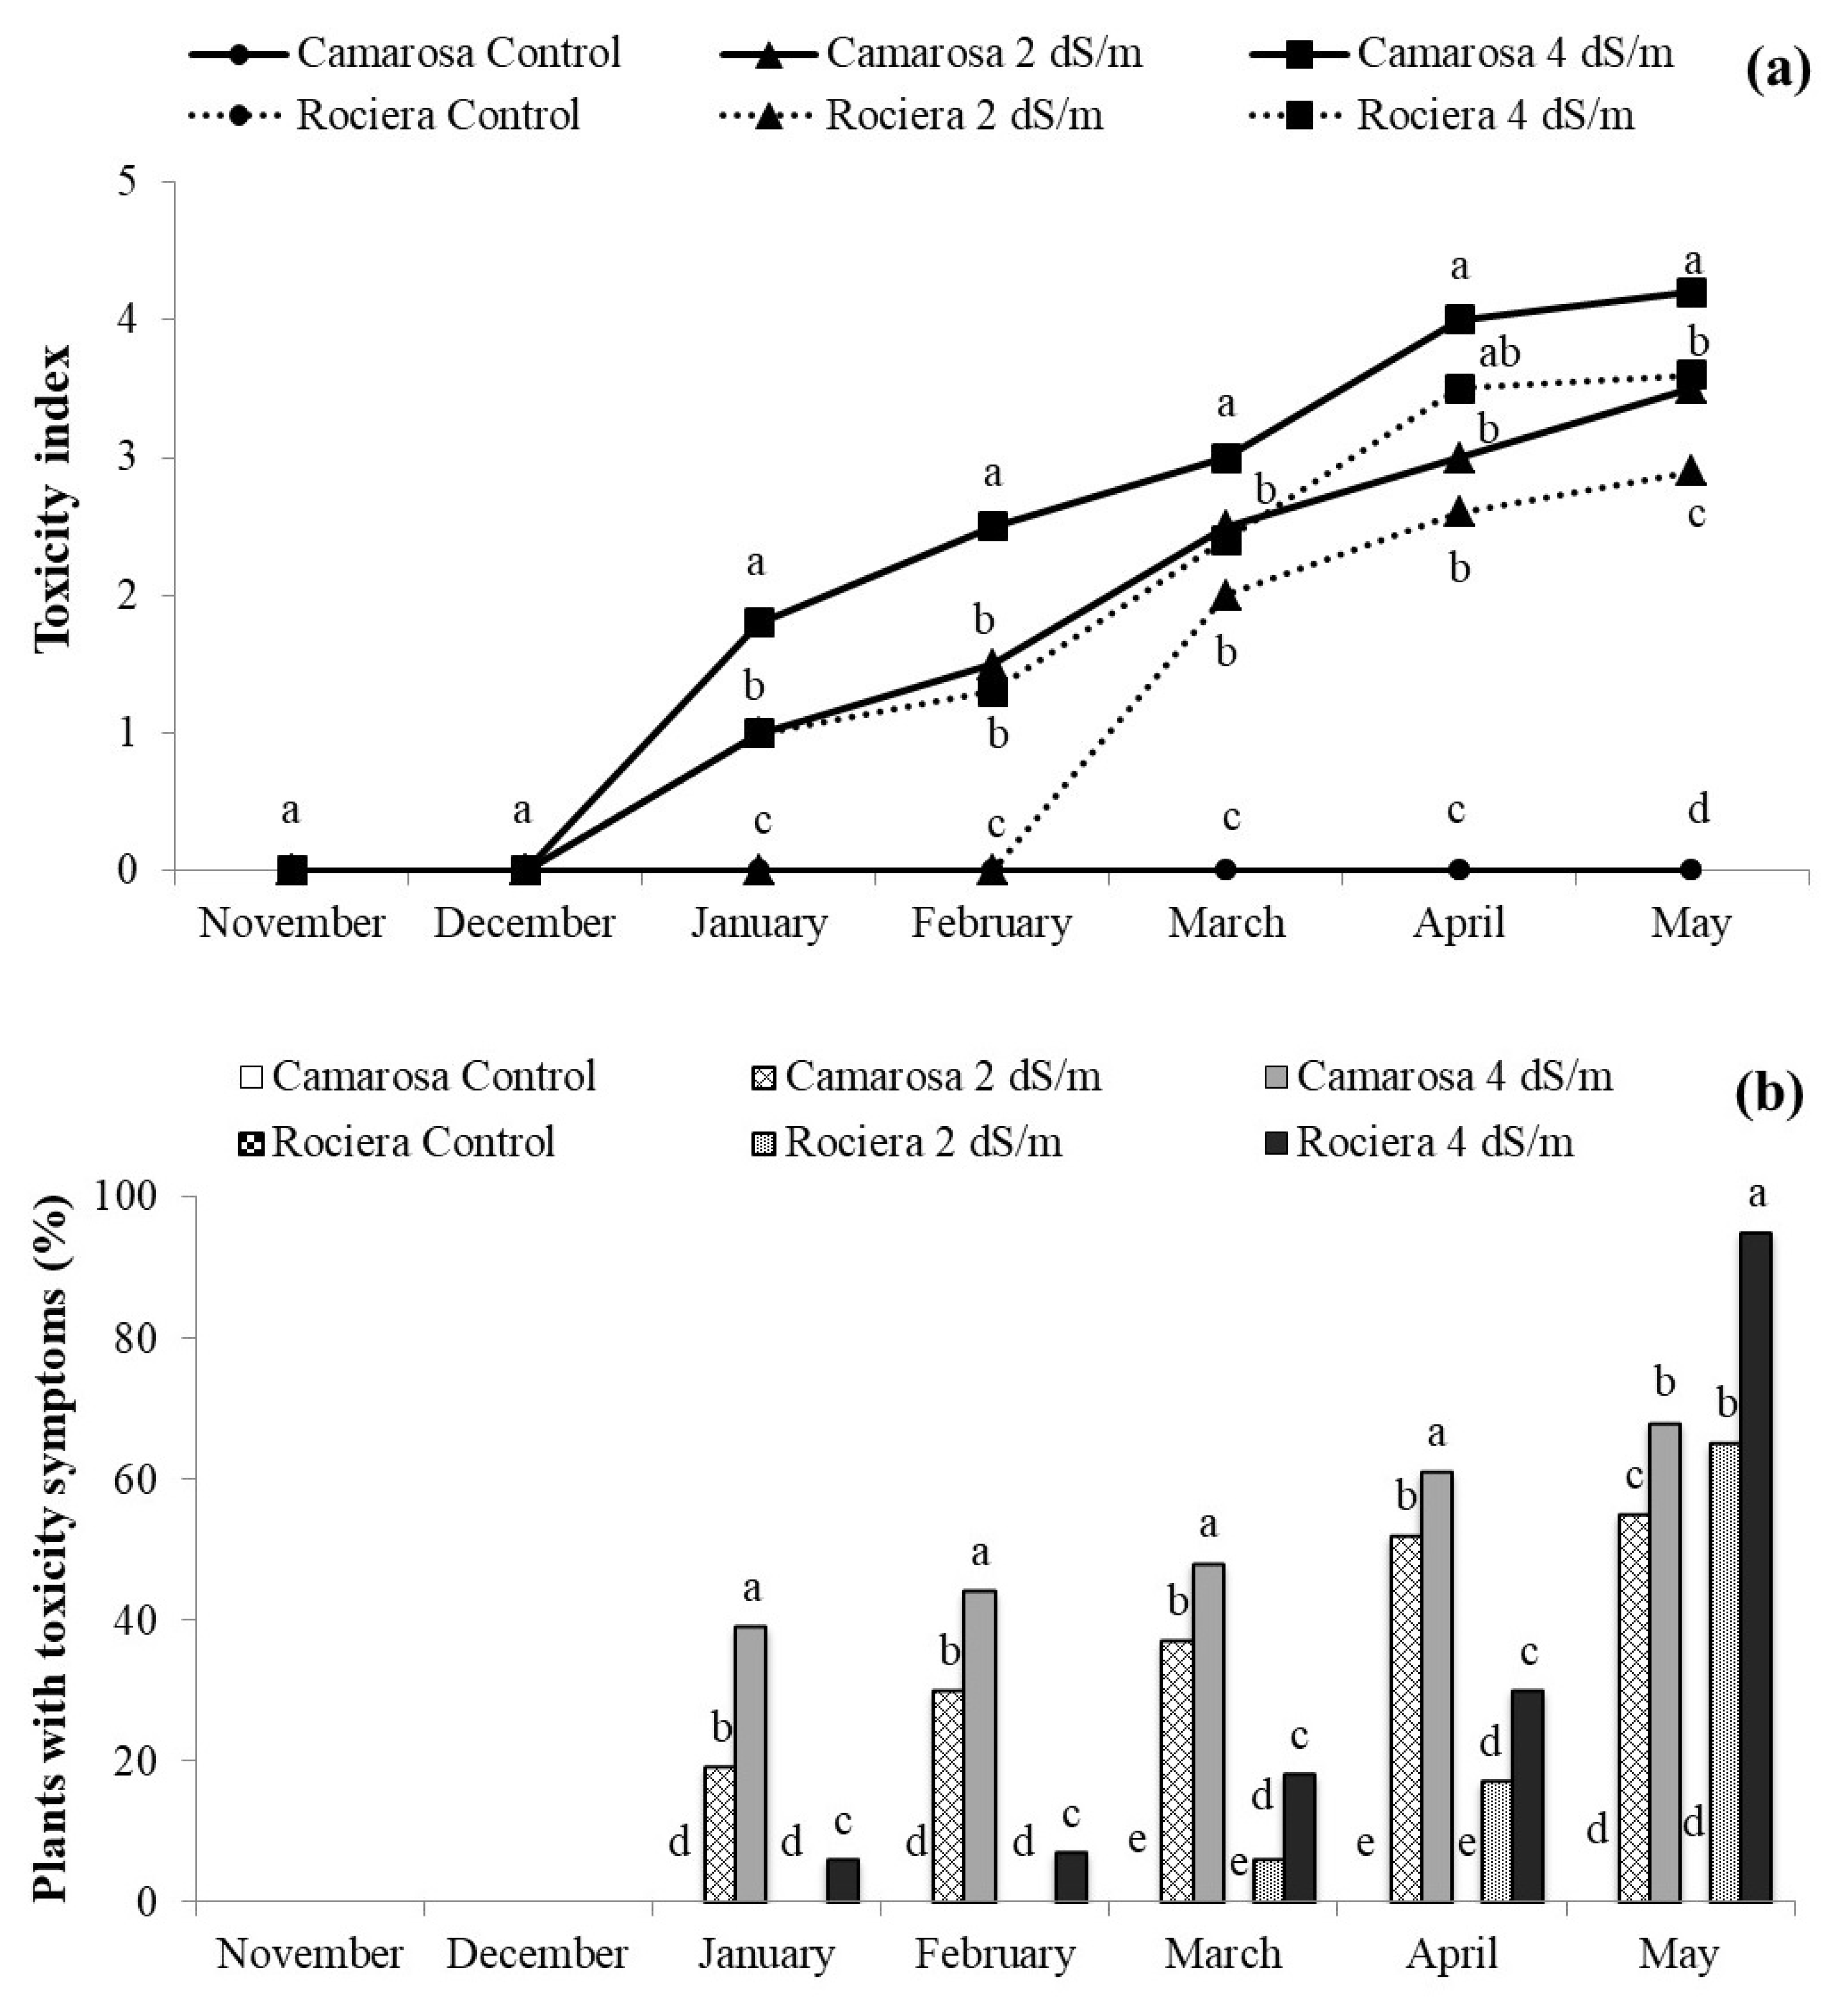
3.5. Effect of Salt Stress on Strawberry Growth Parameters and Toxicity Symptoms

Salinity had a negative impact on root, AGPM, and total plant fresh and dry weight in both cvs. However, this decrease was more pronounced when the high salinity solution was applied (Table 9). In cv. Camarosa plants at the high salt stress, the root fresh weight was reduced on average by 48.2%, root dry weight by 49.1%, AGPM fresh weight by 22.2%, AGPM dry weight by 24.3%, total plant fresh weight by 34.1%, and total plant dry weight by 33.1% compared with control. Furthermore, the root fresh weight was reduced on average by 43%, root dry weight by 44%, AGPM fresh weight and dry weight by 27.8%, total plant fresh weight by 33.4%, and total plant dry weight by 31.4% in high salt-stressed cv. Rociera plants, compared with control. The ratio of root to AGPM fresh weight as well as the root to AGPM dry weight exhibited the highest value for cv. Camarosa control plants and the lowest for cv. Rociera plants at the high salt stress.
Salt stress noticeably decreased the number of leaves in both cvs (Table 10). However, a significantly reduced number of leaves was recorded in plants treated with the high salinity solution, a reduction which was more pronounced in cv. Camarosa plants. More specifically, cv. Camarosa plants had a 22% and 38.9% decrease in the leaf number and cv. Rociera had a 15.8% and 31.6% decrease in the leaf number, at 2 dS m−1 and 4 dS m−1 NaCl, respectively. The salt-stressed cv. Rociera plants exhibited the lowest AGPM and root water content. Furthermore, plant water content was found to be lowest for cv. Rociera plants treated with the high salinity solution, while cv. Camarosa plants treated with the medium salinity solution preserved almost the same plant water content to cv. Rociera control plants (Table 10). The highest tolerance index among the treatments was measured for the cv. Rociera plants at the moderate salt stress with no significant difference from the control treatment (Table 10).
Toxicity symptoms appeared at the end of January, (Figure 3a) revealing a significant difference between the two cvs. At the end of January, cv. Camarosa plants treated with the high salt levels presented higher toxicity symptoms than did cv. Rociera plants for the same treatment. Nonetheless, at the end of the harvest period, cv. Camarosa plants treated with the high salinity solution exhibited severe toxicity symptoms (Figure 3a). More specifically, 45% of cv. Camarosa plants treated with the high salinity solution exhibited symptoms (Figure 3b). From February to the end of the harvest season, the percentage of cv. Camarosa plants that presented symptoms due to salinity increased gradually and reached up to 55% and 68%, respectively, for the medium and the high salt stress. On the other hand, in cv. Rociera a sudden significant increase in the percentage of plants with toxicity symptoms was observed in May, reaching up to 95% for the high salt stress (Figure 3b).

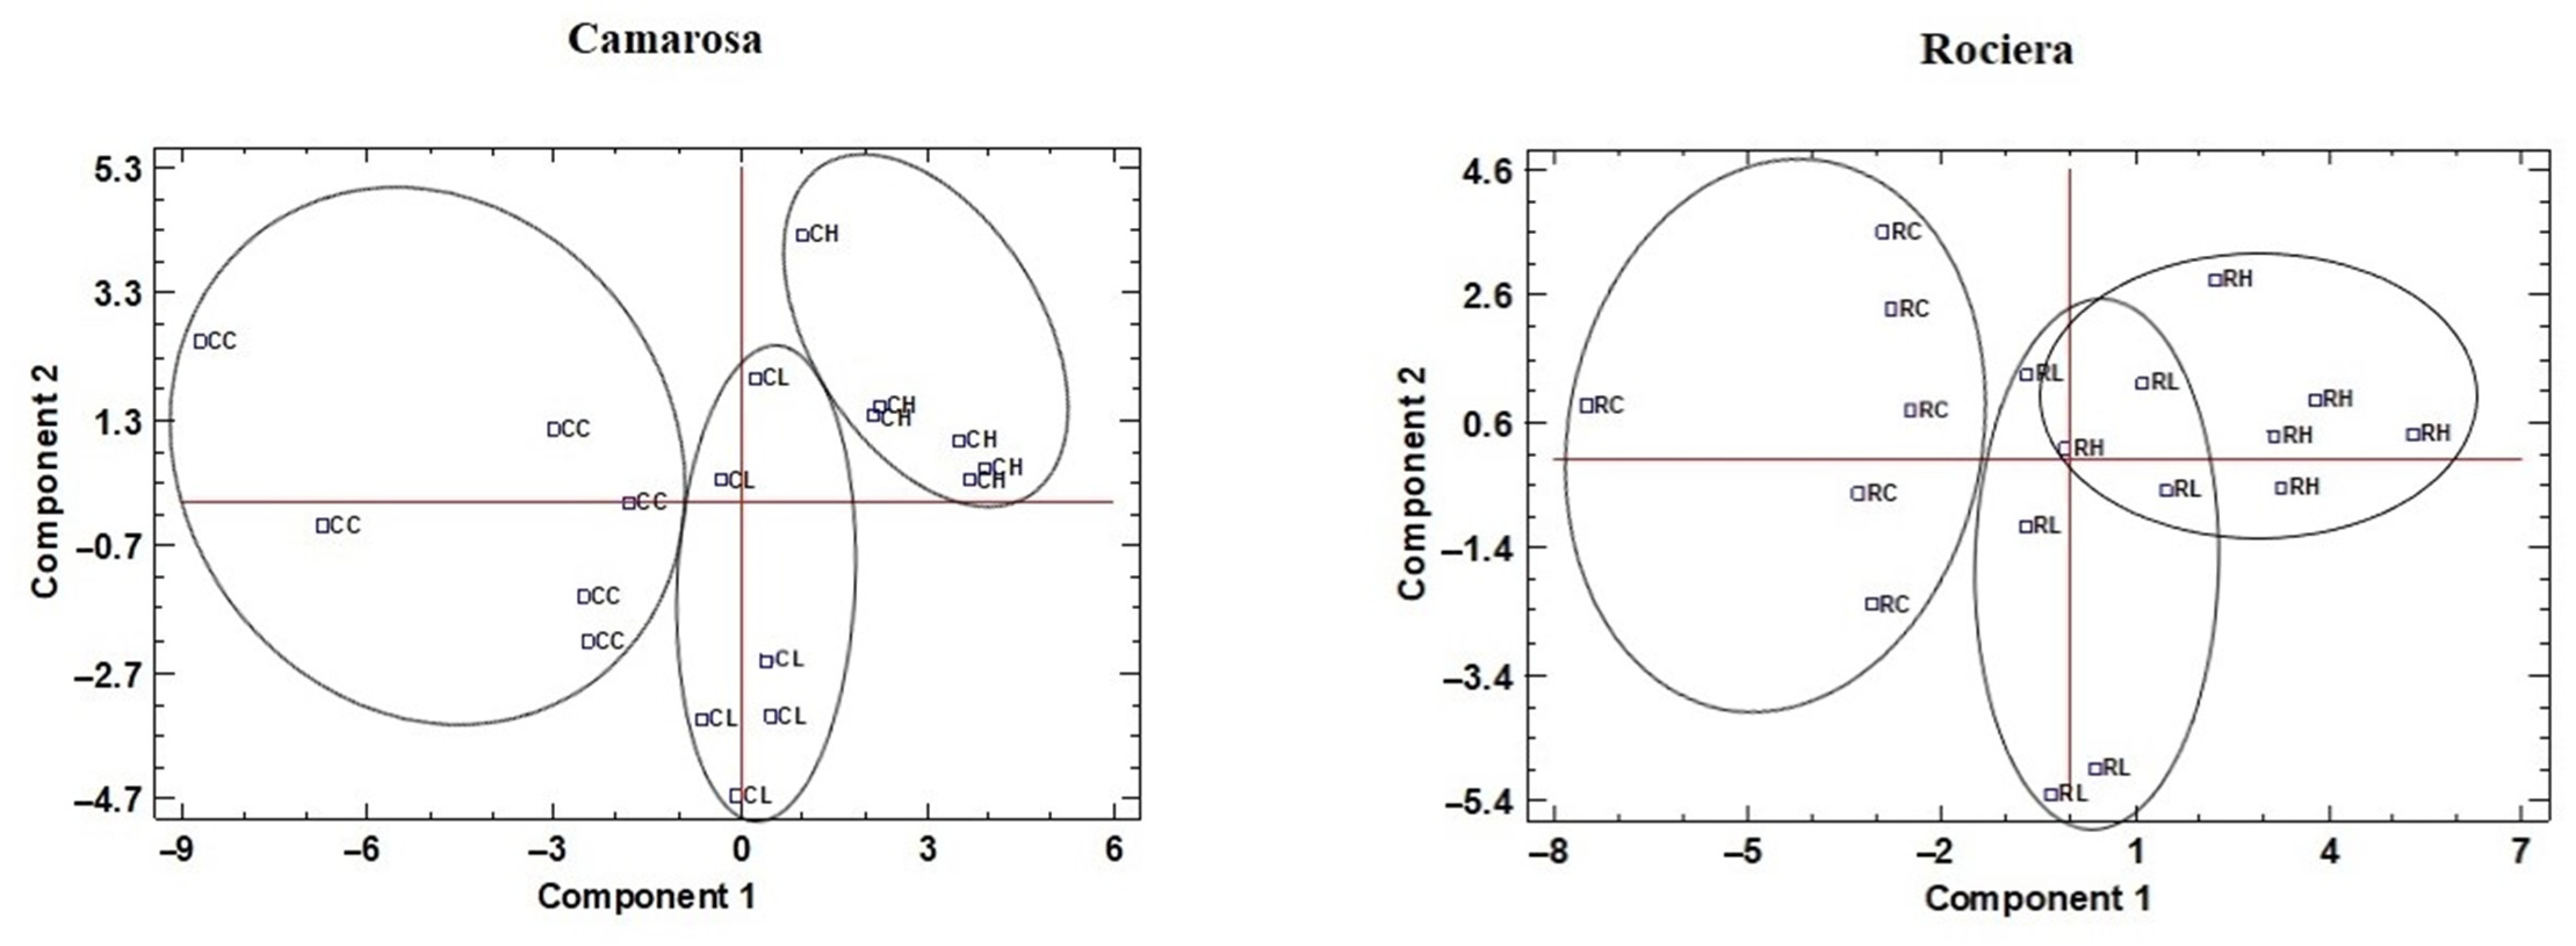
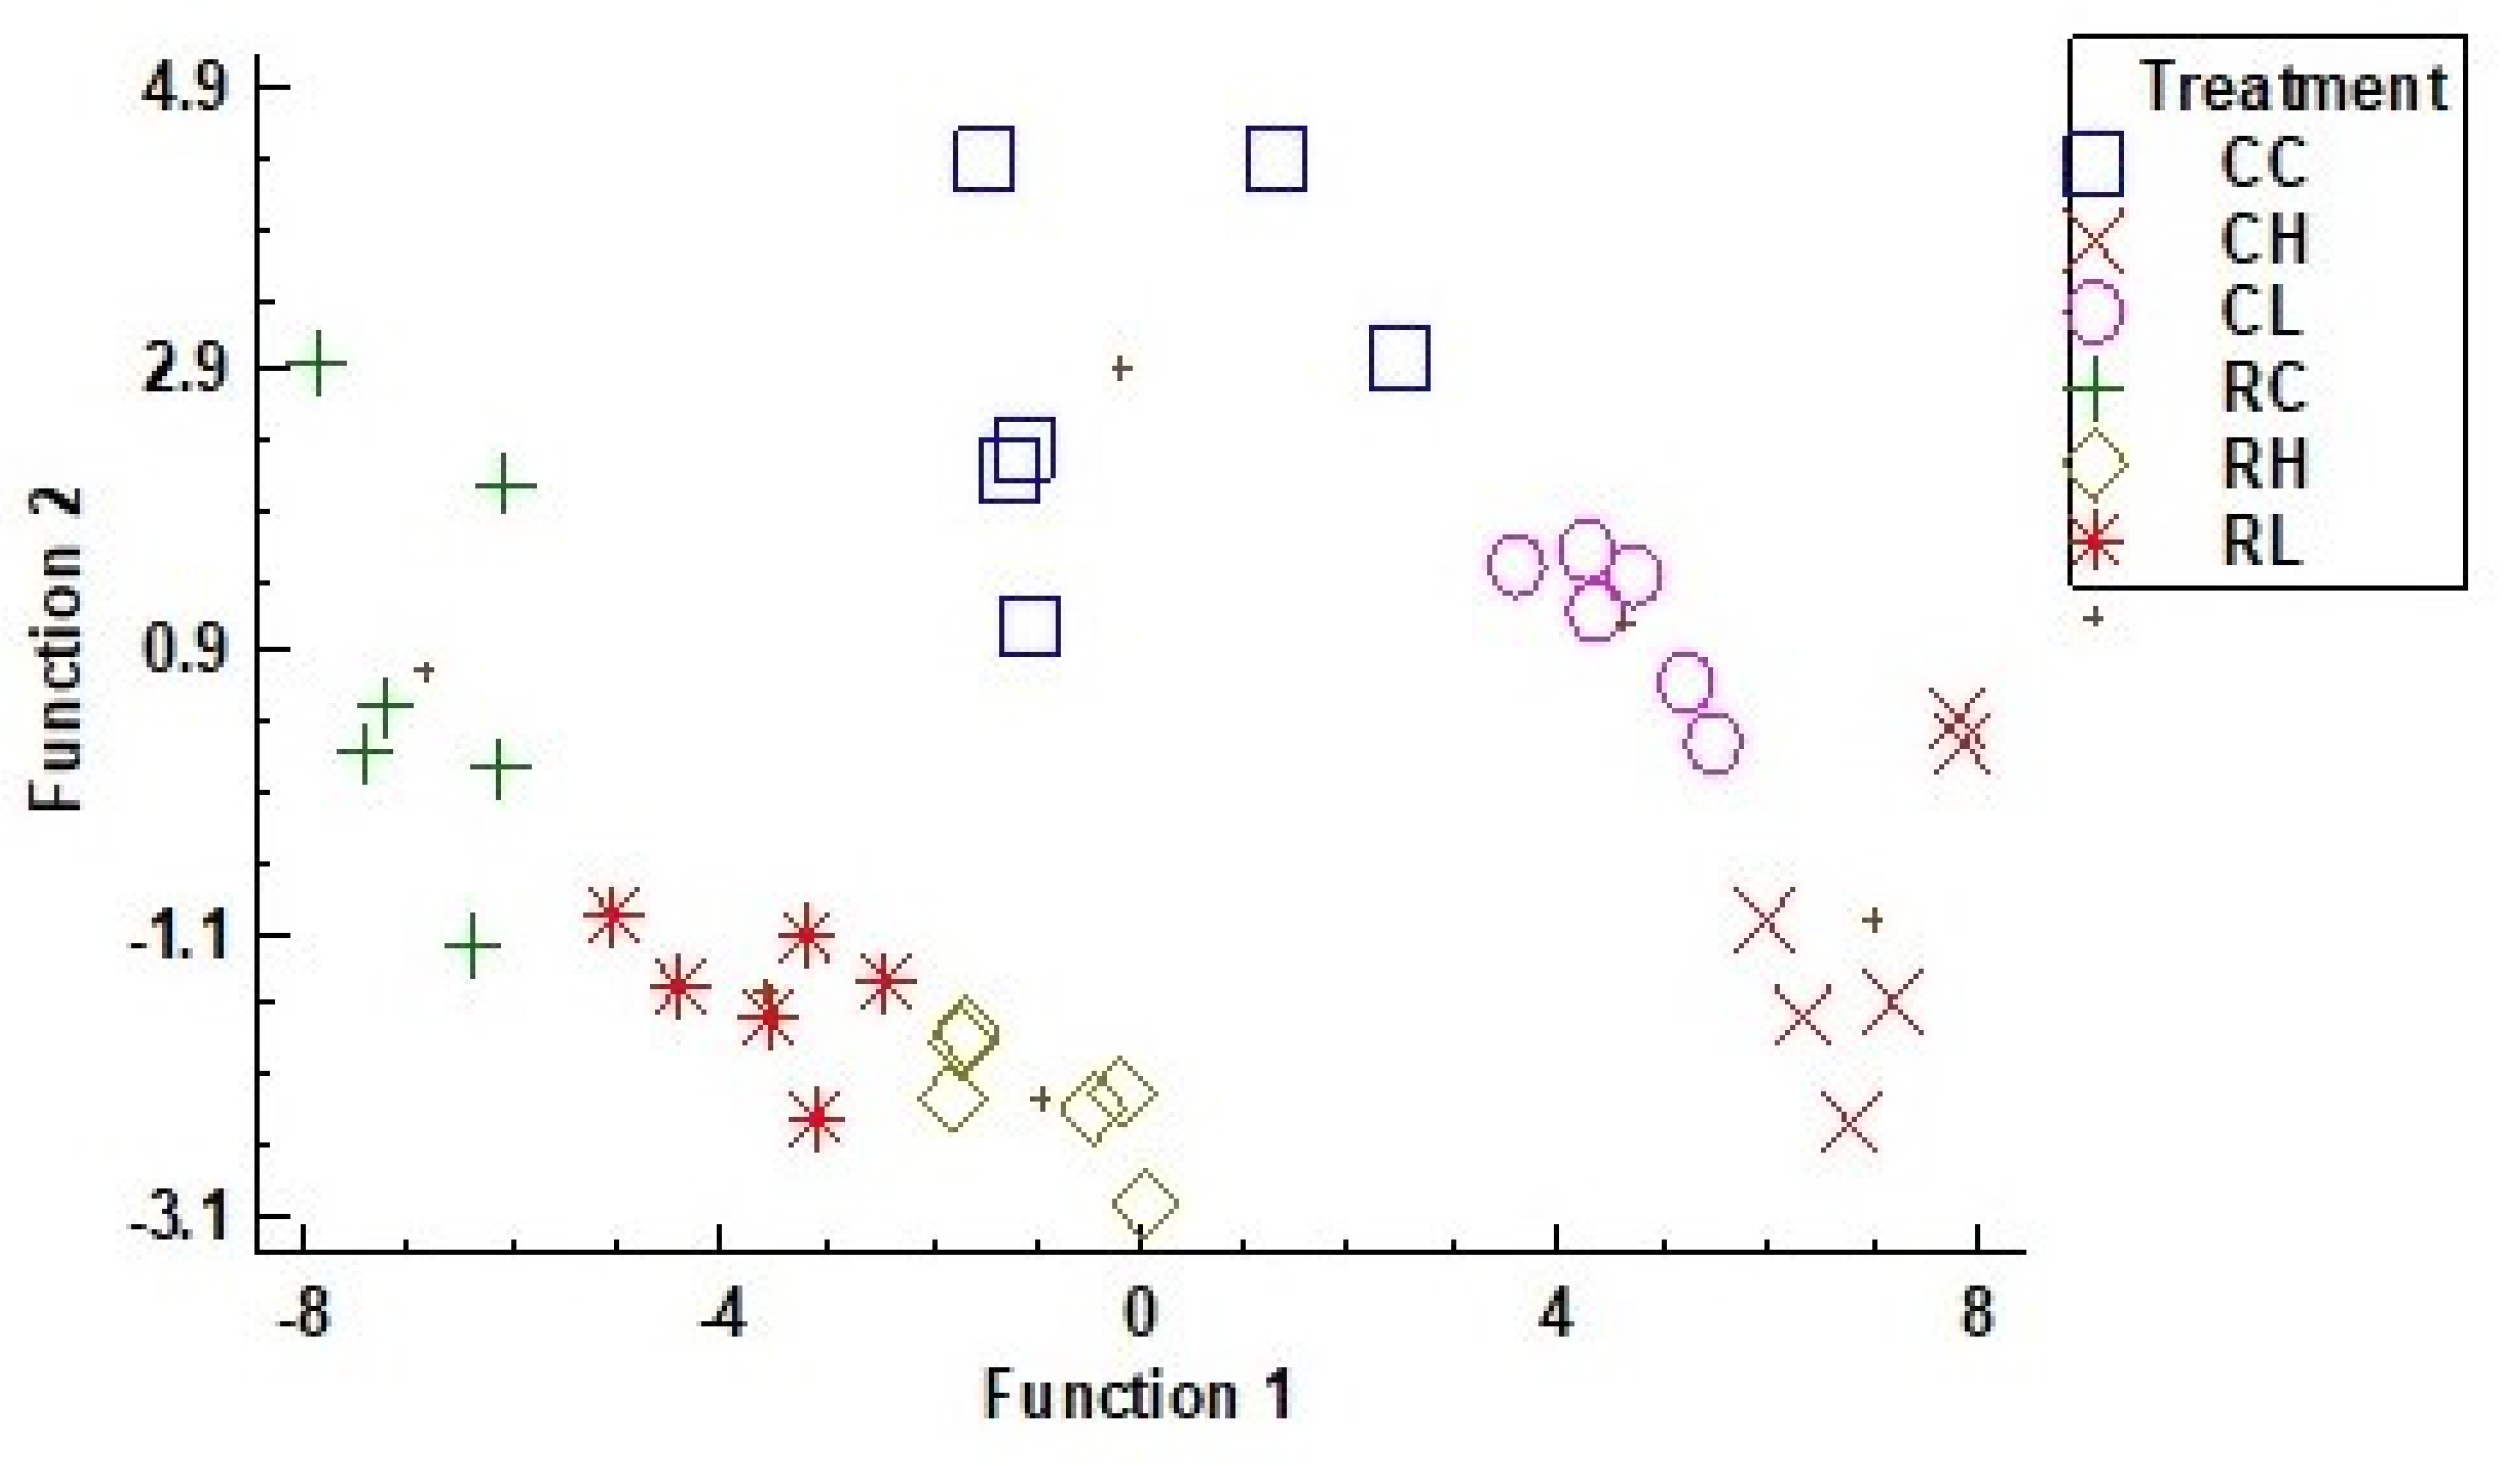
3.6. Principal Components Analysis

Seven principal components with an eigenvalue higher than 1.0 were produced by the PCA, regarding the data collected from cv. Camarosa. Principal component 1 (PC1) is comprised of salt tolerance index, root and plant water content, root as well as whole plant fresh and dry weight and fruit sucrose concentration. PC2 is comprised of FRAP, fruit fructose, glucose and total sugars concentration, sweetness index, fruit mean weight, length, and diameter (Table 11). Low salinity level did not present any common areas in both control and elevated salt stress, as depicted in Figure 4. Elevated salinity level was clearly located in the positive side of both PC1 and PC2, revealing that cv. Camarosa plants grown under elevated salinity presented low salinity tolerance index, as well as low root and plant water content and low root and plant fresh and dry weight but high fruit sucrose, fructose, glucose and total sugars concentration as well as sweetness index (Figure 4). Nonetheless, these plants produced fruits of low fresh weight, length and diameter but high antioxidant power (based on FRAP assay).
PCA on data produced by the trial on cv. Rociera revealed nine principal components with eigenvalue above 1.0. PC1 was comprised of salt tolerance index, number of leaves, AGPM and plant water content, AGPM and plant fresh weight and plant dry weight. On the other hand, PC2, was comprised of FRAP, fructose, sucrose and total sugars concentration, and sweetness index (Table 11). In cv. Rociera plants grown under control conditions were clearly separated from those grown under elevated salinity level, which showed similar areas with those plants grown under low salinity level (Figure 4). Control treatment was located on the negative side of PC1, producing plants with a high number of leaves and tolerance index, high AGPM and whole plant water content and high AGPM and whole plant fresh weight and plant dry weight (Figure 4).
The discriminant analysis (forward selection), taking into account all the data produced by both cvs., revealed some significant findings, based mainly on FRAP, fruit total anthocyanins concentration, and the number of leaves (according to the discriminant function coefficients) (Figure 5). Treatments were clearly distinguished by each other, irrespective of the cv. More remarkable though, was the fact that the analysis was able to distinguish the two cvs. even under control conditions, imposing the effect of the genotype. Another interesting finding was the fact that as the salinity level increased, the data produced were gradually shifted to the right in both cultivars.

4. Discussion

In the present study, plant growth parameters such as root, AGPM, and total plant fresh and dry biomass significantly decreased when the applied salt concentration increased, confirming the negative impact of salt stress on plant growth parameters [25,38]. Significant decrease in fresh and dry weight of leaves and roots in different Fragaria × ananassa cvs. grown under NaCl stress has been also reported by Pirlak and Esitken [39], Saied et al. [29], Turhan and Eris [31], Khayyat et al. [40], Keutgen and Pawelzik [41], Yilmaz and Kina [42], Al-Shorafa et al. [8], Garriga et al. [17] and Ntanos et al. [43].
The decrease in the shoot and root dry weight is one of the most important agricultural markers to detect salt-sensitive plants [17]. In the present study, a greater decrease in root dry weight (on average 80%) was observed in both cvs. compared to AGPM dry weight (68–72%), but the above reduction under NaCl salinity was not statistically significant compared to control. Furthermore, in cv. Camarosa, root dry weight was not significantly decreased under salt imposition, similarly to the results reported by Yoon et al. [44] for soybean. On the other hand, in cv. Rociera a significant decrease in the root dry weight was detected, especially upon high salt concentration. Ghaderi et al. [19] as well as Ntanos et al. [43] reported an increase in root to AGPM dry weight ratio due to salt stress, results that were related to the greater reduction in the above ground biomass rather than in the increase of root biomass. In the present study however, the ratio of root to AGPM dry weight did not exhibit significant differences in both cvs. Total dry weight was also highest in cv. Camarosa and cv. Rociera control plants, whereas lowest dry mass was observed in cv. Rociera plants treated with the high salinity solution. Al-Shorafa et al. [8] found also that the growth parameters (shoot, root, and total dry weights and root:shoot ratios) were significantly reduced with each increase in salinity level, with cv. Camarosa having higher value for all these parameters compared with cv. Albino. Thus, the distinct reduction in root, AGPM and total plant dry weight of cv. Rociera indicates its possible sensitivity to NaCl salinity, as was also seen by the PCA results. In accordance with the literature, the sensitive cultivars produced less dry weight under salinity conditions than did the tolerant ones [45,46,47], hence it seems that tissue susceptibility to salt stress varies between cvs. and different plant species.
The number of leaves is another parameter of growth that is affected negatively by salinity according to Ghaderi et al. [19], while Saied et al. [29] found that the number of leaves remained unaltered in strawberry cvs. Elsanta and Korona when subjected to NaCl stress. The present results showed that both cvs. exhibited almost the same number of leaves in control treatment and that salt application had a great negative impact on the number of leaves in both cvs. In particular, an excessive decrease in the number of leaves was observed in cv. Rociera and especially in plants treated with the high salt concentration (38.9%), indicating the severity of the imposed salinity stress.
Studies have shown that salt accumulation in the root zone reduces the osmotic potential. This in turn imposes an osmotic stress that hampers the necessary for plant growth root water uptake and thereby diminishes leaf water content [43,48]. In the present study, it was found that AGPM, root and plant water content of both strawberry cvs. were reduced under salinity application. Furthermore, by the end of the experiment, the high salinity treatment presented higher soil water content than did the other two. Therefore, these results indicate the reduced plant ability to assimilate the required amount of water due to the increased osmotic and ionic salt stress caused by the 4 dS m−1 salt concentration, results that are in line with other reports [17,49]. Moreover, the lowest water content was measured in cv. Rocieras’ plants when treated with the high salinity solution, pinpointing that salinization significantly affects plant’s water loss. This difference between cvs. might be related to the difficulty of cv. Rociera’s root to absorb water in response to salt application as was also attested by the severe reduction of root fresh and dry weight.
Besides reducing growth, the elevated salt stress had a significantly negative impact on strawberry fresh fruit yield [50]. In the present study, mean fruit weight and the number of fruits per plant were significantly reduced in both cvs., especially in the plants irrigated with the high salinity solution, as also reported by Kaya et al. [51], Khayyat et al. [52] and Keutgen and Pawelzik [32]. With salinity, fruit size reduction could be attributed to inhibition of water uptake and water transport to the fruit as well [24], which was observed in the present experiment, taking into account the decrease in the AGPM and root water content. A significant decrease was also observed in fruit diameter and fruit length in both cvs. under salinity stress in accordance with that reported by Ondrašek et al. [53].
Ferreira et al. [54] reported a low threshold of electrical conductivity of the soil saturation extract (ECe) (1.0 dS m−1) for strawberry plants, after which yield decreases 33% with each increasing ECe unit. According to Sun et al. [34] the level of yield reduction varies with cultivar, as seen in the present study as well. Therefore, it is noteworthy that total yield per plant in cv. Camarosa plants treated with the medium and the high salinity solution was reduced by 21.5% and 29.1% respectively, while in cv. Rociera this reduction was on average 17.3% and 22.7%. Reduction of strawberries yield growing under saline conditions has been also reported by many researchers [27,43,54], and was attributed either to lower fruit weight [48] and/or to the lower number of fruits [27,43,55]. Contrary to what has been proposed by Saied et al. [29] and Keutgen and Pawelzik [32], the reduced dry:fresh weight ratio could be ascribed to lower fruit water content under stress conditions [43] or to decreased photoassimilates accumulation into the fruits.
Salinity has been also found to decrease the marketable fruits classified into the Extra category, as was earlier reported by Ferreira et al. [54] and Ntanos et al. [43]. On the other hand, fruit firmness, an important quality parameter for fruit shelf-life, exhibited no difference under salinity stress, as was also observed by Garriga et al. [17] and Ntanos et al. [43], while opposite results have been reported by Awang et al. [56] and Zahedi et al. [57]. Garriga et al. [50], suggested that the activity of pectinases and/or other cell wall degrading enzymes was not changed by Na+ and Cl ions deleterious effect, hence the fruit retained its desirable firmness. According to the same researchers, this could increase fruit firmness; however, the lower fruit size of the salt-stressed plants could have balanced the low water availability, causing the stressed plants to exhibit similar firmness to control ones.
Numerous studies highlight that salinity affects positively the total soluble solids, organic acids, and sugars concentrations, compounds which have been associated with and contribute in aroma and taste improvement in many fruits [58,59]. Based on the results of TSS content and TA, Garriga et al. [50] and Ferreira et al. [54] indicate a variable and genotype-dependent effect of salinity on fruit quality. Saied et al. [29], Keutgen and Pawelzik [60] and Galli et al. [25] reported that the increased NaCl concentration in the nutrient solution resulted in an increase of both TSS content and TA in strawberry. However, other literature reports on strawberry fruits showed that TSS and TA content did not change as salinity level in the irrigation water increased [52,60,61,62], results that are in line with the findings of the present study. Regarding coloration of the strawberry fruit skin, the measured parameters were not affected by the application of NaCl, as also reported by Saied et al. [29] and Ntanos et al. [43].
An increased sugar concentration in fruits is very common under saline conditions, since sugars and other low molecular weight osmolytes accumulate to counterbalance the increase of osmotic potential in the vacuole to adjust to salt stress [63,64]. Likewise, in the results of Galli et al. [25], an accumulation of soluble sugars under saline conditions in cv. Camarosa plants was detected, especially of sucrose, as salt levels were elevated. In cv. Rociera fruits, on the other hand, the sugar content was significantly reduced, confirming the results of Keutgen and Pawelzik [32] according to which strawberry cvs. differed in their contents of soluble carbohydrates (fructose, glucose, sucrose), when exposed to salinity. This reduction could be ascribed firstly to the reduced number of leaves, and also to oxidative stress occurrence. Furthermore, judging from the toxicity signs on the leaves, it could be assumed that the photosynthetic activity was lower and thus reduced the supply of photoassimilates to the fruits. These findings are in line with the results of Saied et al. [29] and Ntanos et al. [43], who also detected reductions of fruit carbohydrates.
Furthermore, it was found that by increasing the osmotic stress to 4 dS m−1, citric acid and total organic acids were significantly increased under the saline conditions, which was more pronounced for cv. Camarosa, as was also attested by Zahedi et al. [27] and Ntanos et al. [43]. Citric acid was the major detected organic acid, accounting for about 0.6% FW in control fruits of both cvs., while in the salt-stressed plants, its values ranged between 7% and 9% FW. On the other hand, salinity stress resulted in decreased concentration of ascorbic acid of the fruit especially in cv. Camarosa, results which are in line with those of Jamalian et al. [62] and Haghshenas et al. [48]. The decrease in the fruits’ ascorbic acid content, especially at the elevated salt levels, suggests that the rate of ascorbic acid oxidation exceeded the capacity of the regenerative system. In other words, the ascorbic acid reduction would be attributed to plant’s inability to produce this active compound under extreme stresses. Ntanos et al. [43] concluded that salinity stress diminishes the photosynthetic ability and therefore the sugars production required for vitamin C biosynthesis declines, resulting thus in a decreased concentration of fruit ascorbic acid. However, that was the case only in cv. Rociera’s fruits exposed to high salt stress, where decreased carbohydrate content was detected. Nevertheless, the reduction of ascorbic acid content and of its redox state is regarded as a serious disadvantage for human nutrition and health.
Sweetness is one of the important taste parameters characterizing the acceptance of strawberry fruits by consumers. However, taste is also related to acids and volatile compounds [65]. In the present study, the content of TOA is relatively high (>1.2% of FM) in the fruits of salt-stressed plants of both cvs., which could be attributed to the large amounts of citric acid, especially at high salt stress levels. Therefore, the ratio TSC to TOA of both cvs. fruits is lower than 5.3, a value that has been quoted in the literature for the good quality of strawberry fruits [60,65]. Especially in cv. Rociera, the detected TSC/TOA ratio was 5.04 and 3.9 in the fruits derived from the plants of moderate and elevated salt stress levels, respectively. Generally, it was observed that salinity stress affected fruit phytochemical content, especially with regard to the concentration of the different groups of phenolic compounds and antioxidant capacity. Therefore, moderate salinity increased total phenolic compounds and total flavonoids in cv. Camarosa, and a further increase was observed in the elevated salt stress. The detected accumulation of phenolic compounds inhibits the free radicals’ activity and protects cell membranes and macromolecules from the imposed osmotic stress. Therefore, plants maintain their photosynthetic capacity and metabolic processes. This hypothesis could be also confirmed by the increased carbohydrate content in the fruits of cv. Camarosa plants as well as the moderate toxicity signs on the leaves. On the contrary, in cv. Rociera, fruits’ total phenolics and total flavonoids concentration did not change significantly upon salt application. These results indicate that the phenylpropanoid and flavonoid biosynthetic pathways remained unaffected and functional in this cultivar, enabling fruit tissues to respond to endogenous and external signals for defense requirements [43]. Similar results were observed by Keutgen and Pawelzik [60], who found that, in the less sensitive genotype Korona, moderate salt imposition increased the phenolic compounds, while in salt-sensitive cv. Elsanta, the phenolic compounds’ content remained the same. The same researchers concluded that the composition and amounts of phenolic compounds are influenced mainly by genotype and finally by the environmental conditions.
In addition to phenolic compounds, anthocyanins are also involved in reactive oxygen species scavenging, and increases in their concentrations are known to contribute to plant tolerance [60]. A significant anthocyanin accumulation was detected in both strawberry cvs. under salt stress. More specifically, the present data showed that with increasing salt application, the total anthocyanins concentration tended to increase in cvs. Camarosa and Rociera. That was also the case in several studies [60,66]. Similar to total phenols, cv. Camarosa fruits were characterized by higher amounts of anthocyanins accumulation. Therefore, it seems that in this cultivar, moderate or even elevated salt stress did not influence the portion of anthocyanin per total phenolic compounds. On the other hand, Garriga et al. [17] found that with increasing salt concentration in the medium, total anthocyanin concentration tended to decrease in cvs. Camarosa and Bau, while their levels remained constant in cv. Cucao. Furthermore, Keutgen and Pawelzik [37] reported that moderate salinity increased fruit anthocyanins in the less salt-sensitive strawberry cv. Korona, while their concentration decreased in the more sensitive cv. Elsanta. Finally, Ntanos et al. [43], found that in cv. Camarosa, anthocyanin levels remained stable under salt stress.
Previous studies have established a relationship between salt stress and antioxidant levels in strawberry fruits [25,37,67]. Similarly, fruits’ antioxidant capacity (both measured by DPPH and FRAP assays) was positively related to salt concentration, with the increase being more pronounced for cv. Rociera plants. These findings indicate that stress imposition triggered the antioxidant mechanism in both strawberry cvs., and especially in cv. Rociera. On the other hand, the results obtained by Zahedi et al. [27] showed a significant decrease in total phenolic compounds as well as a significant reduction in the antioxidant capacity of the fruits.

5. Conclusions

The present data showed that salinity induced osmotic stress, water deprivation and toxic effects, affecting hence the growth parameters and the yield of strawberry plants regardless of the cultivar. However, the two cvs. were clearly distinguished, even under control conditions, which indicates the strong impact of the genotype. Another interesting finding was that the two cvs. exhibited a different pattern of response to salinity stress concerning their physiological, biochemical, and nutritional characteristics. Generally, cv. Rociera presented reduction of the plant growth parameters, the number of leaves and plant water content a growth limitation under severe salinity conditions. Furthermore, the elevated levels of salt stress had a negative impact on phytochemical quality characteristics such as carbohydrates, organic acids, anthocyanins, and TSC/TOA ratio. However, in the same cv, salinity increased the antioxidant capacity, while ascorbic acid content remained stable. Furthermore, cv. Camarosa plants grown under elevated salinity levels presented low salinity tolerance index, as well as low plant water content and growth parameters, but high fruit sucrose, fructose, glucose, and total sugars concentration, as well as sweetness index. Nonetheless, these plants produced fruits of low fresh weight, length and diameter but high antioxidant power (based on FRAP assay). It was also found that moderate salt stress had a positive effect on the nutrient content of cv. Camarosa’s fruits. Therefore, the present data confirms the literature reports according to which the response to salinity is a genotype-dependent feature, suggesting that the genotype selection is of essential importance for achieving fruits with high concentration in bioactive compounds under saline conditions. Furthermore, it seems that both cvs. could be an interesting alternative for cultivation in areas where a slight salinization of the water or soil imposes a limitation of the rather salt-sensitive crops. However, the study and evaluation of several cultivars at different salt levels, or even the development of new salt-tolerant cultivars, could be considered as a valuable aspect of research, seeking to enhance the productivity of strawberry fruits for commercial interests and facilitating the management of salt-affected environments.

Author Contributions

Conceptualization, N.-K.D., N.M. and V.P.; methodology, N.M., N.-K.D. and V.P.; validation, N.-K.D., A.N. and N.M.; formal analysis, N.-K.D., N.M. and P.A.R.; investigation, A.N., N.-K.D. and N.M.; resources, N.-K.D., N.M., P.A.R. and V.P.; writing—original draft preparation, N.-K.D., E.L. and N.M.; writing—review and editing, N.-K.D., E.L., V.P., P.A.R. and N.M.; visualization, N.-K.D. and N.M.; supervision, N.-K.D., N.M. and V.P.; project administration, A.N. and N.-K.D.; funding acquisition, V.P. All authors have read and agreed to the published version of the manuscript.

Funding

This research received no external funding.

Data Availability Statement

Not applicable.

Acknowledgments

We would like to thank A. Kavga for kindly letting us use the greenhouse facility which belongs to her laboratory to perform the experiment.

Conflicts of Interest

The authors declare no conflict of interest.

References

  1. Hassan, A.; Fasiha Amjad, S.; Hamzah Saleem, M.; Yasmin, H.; Imran, M.; Riaz, M.; Ali, Q.; Ahmad Joyia, F.; Mobeen; Ahmed, S.; et al. Foliar application of ascorbic acid enhances salinity stress tolerance in barley (Hordeum vulgare L.) through modulation of morpho-physio-biochemical attributes, ions uptake, osmo-protectants and stress response genes expression. Saudi J. Biol. Sci. 2021, 28, 4276–4290. [Google Scholar] [CrossRef] [PubMed]
  2. Ali, B.; Saleem, M.H.; Ali, S.; Shahid, M.; Sagir, M.; Tahir, M.B.; Qureshi, K.A. Mitigation of salinity stress in barley genotypes with variable salt tolerance by application of zinc oxide nanoparticles. Front. Plant Sci. 2022, 13, 973782. [Google Scholar] [CrossRef] [PubMed]
  3. Khan, M.G.; Silberbush, M.; Lips, S.H. Physiological studies on salinity and nitrogen interaction in alfalfa. i. biomass production and root development. J. Plant Nutr. 1994, 17, 657–668. [Google Scholar] [CrossRef]
  4. Quesada, V.; Ponce, M.R.; Micol, J.L. Genetic analysis of salt-tolerant mutants in Arabidopsis thaliana. Genetics 2000, 154, 421–436. [Google Scholar] [CrossRef]
  5. Blumwald, E.; Grober, A. Salt tolerance. In Plant Biotechnology: Current and Future Uses of Genetically Modified Crops; Halfor, N.G., Ed.; John Wiley and Sons: Hoboken, NJ, USA, 2006; pp. 206–224. [Google Scholar]
  6. Szabolcs, I. Soil and salinization. In Handbook of Plant and Crop Stress; Pessarakli, M., Ed.; Marcel Dekker: New York, NY, USA, 1994; pp. 3–11. [Google Scholar]
  7. Krasensky, J.; Jonak, C. Drought, salt, and temperature stress-induced metabolic rearrangements and regulatory networks. J. Exp. Bot. 2012, 63, 1593–1608. [Google Scholar] [CrossRef]
  8. Al-Shorafa, W.; Mahadeen, A.; Al-Absi, K. Evaluation for salt stress tolerance in two strawberry cultivars. Am. J. Agric. Biol. Sci. 2014, 9, 334–341. [Google Scholar] [CrossRef]
  9. Kerbab, S.; Silini, A.; Bouket, A.C.; Cherif-Silini, H.; Eshelli, M.; Rabhi, N.E.H.; Belbahri, L. Mitigation of NaCl stress in wheat by rhizosphere engineering using salt habitat adapted PGPR halotolerant bacteria. Appl. Sci. 2021, 11, 1034. [Google Scholar] [CrossRef]
  10. Magallon, K.J.; Dinneny, J.R. Environmental Stress: Salinity Ruins a Plant’s Day in the Sun. Curr. Biol. 2019, 29, R360–R362. [Google Scholar] [CrossRef]
  11. Meloni, D.A.; Oliva, M.A.; Martinez, C.A.; Cambraia, J. Photosynthesis and activity of superoxide dismutase, peroxidase and glutathione reductase in cotton under salt stress. Environ. Exp. Bot. 2003, 49, 69–76. [Google Scholar] [CrossRef]
  12. Gupta, B.; Huang, B. Mechanism of salinity tolerance in plants: Physiological, biochemical, and molecular characterization. Int. J. Genom. 2014, 2014, 701596. [Google Scholar] [CrossRef] [Green Version]
  13. Manaf, H.H. Beneficial effects of exogenous selenium, glycine betaine and seaweed extract on salt stressed cowpea plant. Ann. Agric. Sci. 2016, 61, 41–48. [Google Scholar] [CrossRef]
  14. Hu, L.; Hu, T.; Zhang, X.; Pang, H.; Fu, J. Exogenous glycine betaine Ameliorates the adverse effect of salt stress on perennial ryegrass. J. Am. Soc. Hortic. Sci. 2012, 137, 38–46. [Google Scholar] [CrossRef]
  15. Sofy, M.R.; Elhawat, N.; Alshaal, T. Glycine betaine counters salinity stress by maintaining high K+/Na+ ratio and antioxidant defense via limiting Na+ uptake in common bean (Phaseolus vulgaris L.). Ecotoxicol. Environ. Saf. 2020, 200, 110732. [Google Scholar] [CrossRef] [PubMed]
  16. Parida, A.K.; Das, A.B. Salt tolerance and salinity effects on plants: A review. Ecotoxicol. Environ. Saf. 2005, 60, 324–349. [Google Scholar] [CrossRef]
  17. Garriga, M.; Muñoz, C.A.; Caligari, P.D.S.; Retamales, J.B. Effect of salt stress on genotypes of commercial (Fragaria x ananassa) and Chilean strawberry (F. chiloensis). Sci. Hortic. 2015, 195, 37–47. [Google Scholar] [CrossRef]
  18. Jamali, B.; Eshghi, S. Salicylic acid-induced salinity redressal in hydroponically grown strawberry. Commun. Soil Sci. Plant Anal. 2015, 46, 1482–1493. [Google Scholar] [CrossRef]
  19. Ghaderi, N.; Hatami, M.; Mozafari, A.; Siosehmardeh, A. Change in antioxidant enzymes activity and some morpho-physiological characteristics of strawberry under long-term salt stress. Physiol. Mol. Biol. Plants 2018, 24, 833–843. [Google Scholar] [CrossRef]
  20. Karlidag, H.; Yildirim, E.; Turan, M. Role of 24-epibrassinolide in mitigating the adverse effects of salt stress on stomatal conductance, membrane permeability, and leaf water content, ionic composition in salt stressed strawberry (Fragaria × ananassa). Sci. Hortic. 2011, 130, 133–140. [Google Scholar] [CrossRef]
  21. Cogo, S.L.P.; Chaves, F.C.; Schirmer, M.A.; Zambiazi, R.C.; Nora, L.; Silva, J.A.; Rombaldi, C.V. Low soil water content during growth contributes to preservation of green colour and bioactive compounds of cold-stored broccoli (Brassica oleraceae L.) florets. Postharvest Biol. Technol. 2011, 60, 158–163. [Google Scholar] [CrossRef]
  22. Ripoll, J.; Urban, L.; Staudt, M.; Lopez-Lauri, F.; Bidel, L.P.R.; Bertin, N. Water shortage and quality of fleshy fruits-making the most of the unavoidable. J. Exp. Bot. 2014, 65, 4097–4117. [Google Scholar] [CrossRef] [Green Version]
  23. Awang, Y.B.; Atherton, J.G.; Taylor, A.J. Salinity effects on strawberry plants grown in rockwool. I. Growth and leaf water relations. J. Hortic. Sci. Biotechnol. 1993, 68, 783–790. [Google Scholar] [CrossRef]
  24. Sato, S.; Sakaguchi, S.; Furukawa, H.; Ikeda, H. Effects of NaCl application to hydroponic nutrient solution on fruit characteristics of tomato (Lycopersicon esculentum Mill.). Sci. Hortic. 2006, 109, 248–253. [Google Scholar] [CrossRef]
  25. Galli, V.; da Silva Messias, R.; Perin, E.C.; Borowski, J.M.; Bamberg, A.L.; Rombaldi, C.V. Mild salt stress improves strawberry fruit quality. LWT Food Sci. Technol. 2016, 73, 693–699. [Google Scholar] [CrossRef]
  26. Yildirim, E.; Karlidag, H.; Turan, M. Mitigation of salt stress in strawberry by foliar K, Ca and Mg nutrient supply. Plant Soil Environ. 2009, 55, 213–221. [Google Scholar] [CrossRef]
  27. Zahedi, S.M.; Abdelrahman, M.; Hosseini, M.S.; Hoveizeh, N.F.; Tran, L.S.P. Alleviation of the effect of salinity on growth and yield of strawberry by foliar spray of selenium-nanoparticles. Environ. Pollut. 2019, 253, 246–258. [Google Scholar] [CrossRef]
  28. Kepenek, K.; Koyuncu, F. Studies on the salt tolerance of some strawberry cultivars under glasshouse. Acta Hortic. 2002, 573, 297–304. [Google Scholar] [CrossRef]
  29. Saied, A.S.; Keutgen, A.J.; Noga, G. The influence of NaCl salinity on growth, yield and fruit quality of strawberry cvs. “Elsanta” and “Korona”. Sci. Hortic. 2005, 103, 289–303. [Google Scholar] [CrossRef]
  30. Gulen, H.; Turhan, E.; Eris, A. Changes in peroxidase activities and soluble proteins in strawberry varieties under salt-stress. Acta Physiol. Plant. 2006, 28, 109–116. [Google Scholar] [CrossRef]
  31. Turhan, E.; Eriş, A. Growth and stomatal behaviour of two stawberry cultivars under long-term salinity stress. Turkish J. Agric. For. 2007, 31, 55–61. [Google Scholar] [CrossRef]
  32. Keutgen, A.J.; Pawelzik, E. Quality and nutritional value of strawberry fruit under long term salt stress. Food Chem. 2008, 107, 1413–1420. [Google Scholar] [CrossRef]
  33. Orsini, F.; Alnayef, M.; Bona, S.; Maggio, A.; Gianquinto, G. Low stomatal density and reduced transpiration facilitate strawberry adaptation to salinity. Environ. Exp. Bot. 2012, 81, 1–10. [Google Scholar] [CrossRef]
  34. Sun, Y.; Niu, G.; Wallace, R.; Masabni, J.; Gu, M. Relative salt tolerance of seven strawberry cultivars. Horticulturae 2015, 1, 27–43. [Google Scholar] [CrossRef]
  35. Roussos, P.A.; Denaxa, N.K.; Ntanos, E.; Tsafouros, A.; Mavrikou, S.; Kintzios, S. Organoleptic, nutritional and anti-carcinogenic characteristics of the fruit and rooting performance of cuttings of black mulberry (Morus nigra L.) genotypes. J. Berry Res. 2020, 10, 77–93. [Google Scholar] [CrossRef]
  36. Denaxa, N.K.; Vemmos, S.N.; Roussos, P.A. The role of endogenous carbohydrates and seasonal variation in rooting ability of cuttings of an easy and a hard to root olive cultivars (Olea europaea L.). Sci. Hortic. 2012, 143, 19–28. [Google Scholar] [CrossRef]
  37. Keutgen, A.J.; Pawelzik, E. Modifications of strawberry fruit antioxidant pools and fruit quality under NaCl stress. J. Agric. Food Chem. 2007, 55, 4066–4072. [Google Scholar] [CrossRef]
  38. Turhan, E.; Eriş, A. Changes of Growth, Amino Acids, and Ionic Composition in Strawberry Plants under Salt Stress Conditions. Commun. Soil Sci. Plant Anal. 2009, 40, 3308–3322. [Google Scholar] [CrossRef]
  39. Pirlak, L.; Eşitken, A. Salinity effects on growth, proline and ion accumulation in strawberry plants. Acta Agric. Scand. Sect. B Soil Plant Sci. 2004, 54, 189–192. [Google Scholar] [CrossRef]
  40. Khayyat, M.; Tafazoli, E.; Rajaee, S.; Vazifeshenas, M.; Mahmoodabadi, M.R.; Sajjadinia, A. Effects of NaCl and Supplementary Potassium on Gas Exchange, Ionic Content, and Growth of Salt-Stressed Strawberry Plants. J. Plant Nutr. 2009, 32, 907–918. [Google Scholar] [CrossRef]
  41. Keutgen, A.J.; Pawelzik, E. Impacts of NaCl stress on plant growth and mineral nutrient assimilation in two cultivars of strawberry. Environ. Exp. Bot. 2009, 65, 170–176. [Google Scholar] [CrossRef]
  42. Yilmaz, H.; Kina, A. The influence of NaCl salinity on some vegetative and chemical changes of strawberries (Fragaria x ananassa L.). Afr. J. Biotechnol. 2008, 7, 3299–3305. [Google Scholar]
  43. Ntanos, E.; Kekelis, P.; Assimakopoulou, A.; Gasparatos, D.; Denaxa, N.K.; Tsafouros, A.; Roussos, P.A. Amelioration effects against salinity stress in strawberry by bentonite–zeolite mixture, glycine betaine, and bacillus amy-loliquefaciens in terms of plant growth, nutrient content, soil properties, yield, and fruit quality characteristics. Appl. Sci. 2021, 11, 8796. [Google Scholar] [CrossRef]
  44. Yoon, J.; Hamayun, M.; Lee, S.; Lee, I. Methyl jasmonate alleviated salinity stress in soybean. J. Crop Sci. Biotechnol. 2009, 12, 63–68. [Google Scholar] [CrossRef]
  45. Munns, R. Comparative physiology of salt and water stress. Plant Cell Environ. 2002, 25, 239–250. [Google Scholar] [CrossRef] [PubMed]
  46. Kusvuran, S.; Ellialtioglu, S.; Yasar, F.; Abak, K. Effects of salt stress on ion accumulation and activity of some antioxidant enzymes in melon (Cucumis melo L.). J. Food Agric. Environ. 2007, 5, 351–354. [Google Scholar]
  47. Talei, D.; Kadir, M.A.; Yusop, M.K.; Valdiani, A.; Abdullah, M.P. Growth indices and salinity tolerance threshold in a medicinal plant Andrographis paniculata Nees. J. Med. Plants Res. 2013, 7, 104–110. [Google Scholar] [CrossRef]
  48. Haghshenas, M.; Javad Nazarideljou, M.; Shokoohian, A. Phytochemical and Quality Attributes of Strawberry Fruit under Osmotic Stress of Nutrient Solution and Foliar Application of Putrescine and Salicylic Acid Introduction. Int. J. Hortic. Sci. Technol. 2020, 7, 263–278. [Google Scholar] [CrossRef]
  49. Warrence, B.N.J.; Bauder, J.W.; Pearson, K.E. Basics of Salinity and Sodicity Effects on Soil Physical Properties; Montana State University-Bozeman: Bozeman, MT, USA, 2002. [Google Scholar]
  50. Garriga, M.; Caligari, P.; Retamales, J. Salt stress induces differential responses in yield, fruit quality, vegetative growth and physiological parameters in commercial (Fragaria × ananassa) and Chilean strawberry (F. chiloensis) genotypes. Acta Hortic. 2017, 1156, 419–424. [Google Scholar] [CrossRef]
  51. Kaya, C.; Kirnak, H.; Higgs, D.; Saltali, K. Supplementary calcium enhances plant growth and fruit yield in strawberry cultivars grown at high (NaCL) salinity. Sci. Hortic. 2002, 93, 65–74. [Google Scholar] [CrossRef]
  52. Khayyat, M.; Tafazoli, E.; Eshghi, S.; Rahemi, M.; Rajaee, S. Salinity, Supplementary Calcium and Potassium Effects on Fruit Yield and Quality of Strawberry (Fragaria ananassa Duch.). Am. Eurasian J. Agric. Environ. Sci. 2007, 2, 539–544. [Google Scholar]
  53. Ondrašek, G.; Romić, D.; Romić, M.; Duralija, B.; Mustač, I. Strawberry growth and fruit yield in a saline environment. Agric. Conspec. Sci. 2006, 71, 155–158. [Google Scholar]
  54. Ferreira, J.F.S.; Liu, X.; Suarez, D.L. Fruit yield and survival of five commercial strawberry cultivars under field cultivation and salinity stress. Sci. Hortic. 2019, 243, 401–410. [Google Scholar] [CrossRef]
  55. Bybordi, A.; Saadat, S.; Zargaripour, P. The effect of zeolite, selenium and silicon on qualitative and quantitative traits of onion grown under salinity conditions. Arch. Agron. Soil Sci. 2018, 64, 520–530. [Google Scholar] [CrossRef]
  56. Awang, Y.B.; Atherton, J.G.; Taylor, A.J. Salinity effects on strawberry plants grown in rockwool. II. Fruit quality. J. Hortic. Sci. Biotechnol. 1993, 68, 791–795. [Google Scholar] [CrossRef]
  57. Zahedi, S.M.; Hosseini, M.S.; Abadía, J.; Marjani, M. Melatonin foliar sprays elicit salinity stress tolerance and enhance fruit yield and quality in strawberry (Fragaria × ananassa Duch.). Plant Physiol. Biochem. 2020, 149, 313–323. [Google Scholar] [CrossRef] [PubMed]
  58. Kader, A.A. Flavor quality of fruits and vegetables. J. Sci. Food Agric. 2008, 88, 1863–1868. [Google Scholar] [CrossRef]
  59. Rouphael, Y.; Petropoulos, S.A.; Cardarelli, M.; Colla, G. Salinity as eustressor for enhancing quality of vegetables. Sci. Hortic. 2018, 234, 361–369. [Google Scholar] [CrossRef]
  60. Keutgen, A.; Pawelzik, E. Modifications of taste-relevant compounds in strawberry fruit under NaCl salinity. Food Chem. 2007, 105, 1487–1494. [Google Scholar] [CrossRef]
  61. D’Anna, F.; Incalcaterra, G.; Moncada, A.; Miceli, A. Effects of different electrical conductivity levels on strawberry grown in soilless culture. Acta Hortic. 2003, 609, 355–360. [Google Scholar] [CrossRef]
  62. Jamalian, S.; Tehranifar, A.; Tafazoli, E.; Eshghi, S.; Davarynejad, G.H. Paclobutrazol application ameliorates the negative effect of salt stress on reproductive growth, yield, and fruit quality of strawberry plants. Hortic. Environ. Biotechnol. 2008, 49, 203–208. [Google Scholar]
  63. Cardeñosa, V.; Medrano, E.; Lorenzo, P.; Sánchez-Guerrero, M.C.; Cuevas, F.J.; Pradas, I.; Moreno-Rojas, J.M. Effects of salinity and nitrogen supply on the quality and health-related compounds of strawberry fruits (Fragaria × ananassa cv. Primoris). J. Sci. Food Agric. 2015, 95, 2924–2930. [Google Scholar] [CrossRef]
  64. Slama, I.; Abdelly, C.; Bouchereau, A.; Flowers, T.; Savouré, A. Diversity, distribution and roles of osmoprotective compounds accumulated in halophytes under abiotic stress. Ann. Bot. 2015, 115, 433–447. [Google Scholar] [CrossRef] [PubMed]
  65. Cordenunsi, B.R.; Nascimento, J.R.O.; Lajolo, F.M. Physico-chemical changes related to quality of five strawberry fruit cultivars during cool-storage. Food Chem. 2003, 83, 167–173. [Google Scholar] [CrossRef]
  66. Eraslan, F.; Inal, A.; Pilbeam, D.J.; Gunes, A. Interactive effects of salicylic acid and silicon on oxidative damage and antioxidant activity in spinach (Spinacia oleracea L. cv. Matador) grown under boron toxicity and salinity. Plant Growth Regul. 2008, 55, 207–219. [Google Scholar] [CrossRef]
  67. Keutgen, A.J.; Keutgen, N. Influence of NaCl salinity stress on fruit quality in strawberry. Acta Hortic. 2003, 609, 155–157. [Google Scholar] [CrossRef]
Figure 1. Cumulative chill hours and temperature data versus experiment stages.
Agronomy 12 02279 g001
Figure 2. Water content data of the three treatments versus experiment stages.
Agronomy 12 02279 g002
Figure 3. (a) Toxicity symptom severity in strawberry plants; (b) percentage of strawberry plants that exhibited toxicity symptoms. Different letters within each month indicate significant differences among treatments, according to the Tukey HSD test at a = 0.05.
Agronomy 12 02279 g003
Figure 4. Principal component analysis scatterplot of the measured variables, based on the treatments imposed. CC, Camarosa control; CL, Camarosa 2 dS m−1; CH, Camarosa 4 dS m−1; RC, Rociera control; RL, Rociera 2 dS m−1; RH, Rociera 4 dS m−1.
Agronomy 12 02279 g004
Figure 5. Discriminant analysis plot of the effect of salt treatments on strawberry cvs. Camarosa and Rociera growth parameters and fruit physiological, quality, and biochemical characteristics. CC, Camarosa control; CL, Camarosa 2 dS m−1; CH, Camarosa 4 dS m−1; RC, Rociera control; RL, Rociera 2 dS m−1; RH, Rociera 4 dS m−1.
Agronomy 12 02279 g005
Table 1. Monthly daytime average values for temperature, relative humidity, and solar radiation during the experiment (20 November 2018–17 April 2019) inside the greenhouse.
Temperature
(°C)
Relative Humidity
(%)
Solar Radiation
(W m−2)
November18.963.5130.6
December15.559.8128.1
January12.666.1124.1
February15.354.0181.1
March17.959.0261.4
April18.664.2260.6
Table 2. Monthly nighttime average values for temperature and relative humidity during the experiment (20 November 2018–17 April 2019) inside the greenhouse.
Temperature (°C)Relative Humidity (%)
November13.384.0
December8.983.3
January6.986.5
February8.178.3
March9.887.8
April12.388.3
Table 3. Effect of salt stress on strawberry fruit mean weight, diameter, length, diameter:length ratio, firmness and dry:fresh weight ratio.
CultivarSalt
Treatment
Weight (g)Diameter (mm)Length (mm)Diameter/
Length
Firmness (N)Dry/Fresh Weight
Camarosa Control19.20 c36.71 c33.89 b1.08 b1.68 a0.11 a
2 dS m−118.60 d35.61 c34.81 ab1.02 b1.70 a0.08 b
4 dS m−115.19 d31.82 d31.41 c1.01 b1.62 a0.06 b
Rociera Control24.34 a45.60 a36.58 a1.25 a1.75 a0.12 a
2 dS m−123.01 ab43.44 b35.91 ab1.21 a1.72 a0.09 b
4 dS m−120.69 b41.70 b34.31 b1.22 a1.69 a0.07 b
Means within the same column followed by the same letter do not differ significantly according to Tukey HSD test at a = 0.05.
Table 4. Effect of salt stress on number of fruits per plant, classification of harvested fruits into categories (Extra, I and II), mean total yield per plant and mean total yield (thirty-three plants).
CultivarSalt TreatmentNb Fruits/PlantExtra (%)I and II (%)Total Yield/Plant (g)Total Yield (kg)
CamarosaControl9.21 ab97.82 a2.18 b130.74 ab4.31 d
2 dS m−18.24 ab94.12 b5.88 ab103.13 b3.40 e
4 dS m−16.87 b92.82 b7.18 a92.85 b3.17 e
RocieraControl10.97 a97.02 a2.98 b277.26 a9.15 a
2 dS m−110.52 a96.91 ab3.09 b229.08 ab7.56 b
4 dS m−19.91 ab93.06 b6.94 a214.13 ab7.07 c
Means within the same column followed by the same letter do not differ significantly according to Tukey HSD test at a = 0.05.
Table 5. Effect of salt stress on the strawberry fruit juice pH, total soluble solids (TSS), titratable acidity (TA), the ratio of total soluble solids:titratable acidity and on the strawberry fruit color attributes (L*, chroma and Hue value).
CultivarSalt TreatmentpHTSS (°Brix)TA (% Citric Acid)TSS:TAL*ChromaHue
CamarosaControl3.34 a8.80 a1.12 a8.65 a36.48 a43.20 a33.75 a
2 dS m−13.30 a8.39 a1.06 a8.67 a36.10 a43.17 a33.58 a
4 dS m−13.33 a8.28 a1.19 a7.63 a35.75 a40.80 a32.60 a
RocieraControl3.31 a9.00 a1.06 a9.45 a36.89 a41.32 a32.54 a
2 dS m−13.26 a8.09 a0.98 a8.91 a35.85 a40.94 a32.64 a
4 dS m−13.27 a8.06 a1.12 a8.15 a34.90 a40.25 a32.59 a
Means within the same column followed by the same letter do not differ significantly according to Tukey HSD test at a = 0.05.
Table 6. Effect of salt stress on strawberry fruit total phenols, total o-diphenols, total flavanols and total flavonoids concentration (expressed as mg g−1 fresh weight), total anthocyanins (expressed as mg g−1 fresh weight) and antioxidant capacity of strawberry fruit juice, according to FRAP and DPPH assays (expressed as μmol Trolox g−1 fresh weight).
CultivarSalt
Treatment
Total
Phenols
Total o-diphenolsTotal
Flavanols
Total
Flavonoids
Total
Anthocyanins
FRAPDPPH
CamarosaControl3.43 b5.22 a0.42 a0.46 b0.54 b20.43 b11.02 b
2 dS m−14.02 ab3.67 a0.43 a0.54 ab0.59 a20.77 b12.29 ab
4 dS m−14.56 a4.50 a0.51 a0.59 a0.61 a24.20 a13.89 a
RocieraControl4.45 a3.30 a0.52 a0.58 a0.34 d19.37 b12.21 ab
2 dS m−14.83 a4.01 a0.55 a0.62 a0.38 c25.50 a13.98 a
4 dS m−14.21 ab4.76 a0.46 a0.59 a0.40 c24.74 a13.63 a
Means within the same column followed by the same letter do not differ significantly according to Tukey HSD test at a = 0.05.
Table 7. Effect of salt stress on strawberry fruit carbohydrate concentration (expressed as mg g−1 fresh weight) and sweetness index (SI).
CultivarSalt TreatmentSucroseGlucoseFructoseTotal SugarsSI
CamarosaControl17.49 bc9.30 b9.85 c36.64 c55.56 c
2 dS m−123.64 a9.33 b12.23 abc45.21 ab69.37 bc
4 dS m−124.39 a10.21 ab12.91 ab47.51 a72.83 a
RocieraControl19.70 b11.90 a13.95 a45.55 ab70.58 ab
2 dS m−118.72 bc9.17 b12.09 abc39.98 bc62.25 bc
4 dS m−116.13 c8.34 c10.58 bc35.05 c54.45 c
Means within the same column followed by the same letter do not differ significantly according to Tukey HSD test at a = 0.05.
Table 8. Effect of salt stress on the strawberry fruit organic acid content (expressed as mg g−1 fresh weight).
CultivarSalt TreatmentAscorbic AcidMalic AcidCitric AcidTotal Acids
Control0.50 ab3.64 a6.38 b10.54 c
Camarosa2 dS m−10.45 b4.26 a8.72 ab13.43 b
4 dS m−10.39 b4.57 a9.27 a14.23 a
Control0.60 a4.87 a5.41 b10.88 c
Rociera2 dS m−10.57 a5.04 a6.72 b12.35 b
4 dS m−10.51 ab5.21 a8.13 ab13.86 b
Means within the same column followed by the same letter do not differ significantly according to Tukey HSD test at a = 0.05.
Table 9. Effect of salt stress on the strawberry root, above-ground plant mass (AGPM), and total plant fresh and dry weight (FW and DW).
CultivarSalt
Treatment
Root
FW
Root
DW
AGPM FWAGPM DWTotal Plant FWTotal Plant DWRoot/AGPM FWRoot/AGPM DW
Camarosa Control140.67 a27.44 a162.35 a49.07 a303.01 a76.51 a0.85 a0.55 a
2 dS m−186.64 ab16.95 ab145.54 ab40.12 ab232.18 b57.07 bc0.63 ab0.46 a
4 dS m−173.24 ab13.98 ab126.43 bc37.22 ab199.66 bc51.20 bc0.61 ab0.39 a
Rociera Control89.78 ab17.69 ab148.51 ab46.38 ab238.29 b64.07 ab0.65 ab0.42 a
2 dS m−170.28 b15.16 ab123.11 bc38.51 ab193.40 bc53.67 bc0.58 ab0.40 a
4 dS m−151.41 b10.33 b107.50 c33.61 b158.92 c43.95 c0.50 b0.32 a
Means within the same column followed by the same letter do not differ significantly according to Tukey HSD test at a = 0.05.
Table 10. Effect of salt stress on strawberry number of leaves, above-ground plant mass (AGPM) water content, root water content, plant water content and plant tolerance index (%).
CultivarSalt
Treatment
Nb of LeavesAGPM Water Content (g)Root Water Content (g)Plant Water Content (g)Tolerance Index (%)
CamarosaControl18 a113.28 a113.22 a226.50 a100 a
2 dS m−114 c105.43 ab69.68 ab175.11 b74.59 b
4 dS m−111 d89.20 bc59.26 ab148.46 bc66.91 b
RocieraControl19 a102.13 ab72.09 ab174.22 b100 a
2 dS m−116 b84.60 bc55.13 b139.73 bc83.76 ab
4 dS m−113 c73.89 c41.09 b114.97 c68.58 b
Means within the same column followed by the same letter do not differ significantly according to Tukey HSD test at a = 0.05.
Table 11. Component weights in principal component analysis based on the measured physiological and biochemical parameters.
CamarosaRociera
FactorsComponent 1Component 2Component 1Component 2
FRAP0.110.2280.0674−0.29
DPPH0.1280.1480.0382−0.0931
Total anthocyanins0.2270.05080.132−0.124
Total phenols0.1870.201−0.09890.00807
Total o-diphenols−0.1090.1540.04790.0644
Total flavonoids0.2050.0574−0.0556−0.203
Total flavanols0.1210.18−0.146−0.134
Salt tolerance index−0.2790.0969−0.288−0.114
Nb of leaves−0.192−0.0939−0.2720.048
AGPM water content−0.210.101−0.2530.0459
Root water content−0.2420.109−0.184−0.201
Plant water content−0.2680.123−0.289−0.113
Root FW−0.2450.108−0.177−0.204
Root DW−0.2530.106−0.134−0.198
AGPM FW−0.2220.0926−0.2610.0363
AGPM DW−0.2290.0608−0.2670.00987
Plant FW−0.2730.119−0.292−0.114
Plant DW−0.2790.0969−0.288−0.114
pH−0.02450.163−0.07930.0717
TSS−0.034−0.06−0.06860.103
TA0.04730.0844−0.0487−0.178
Total yield−0.117−0.0179−0.0526−0.204
Total yield/plant−0.117−0.0179−0.0526−0.204
Malic0.09830.005740.003040.0812
ASA−0.04640.1190.104−0.04
Citric−0.1−0.16−0.134−0.0762
Total organic acids0.0788−0.0689−0.006550.0405
Fructose0.02650.303−0.1970.257
Glucose0.06470.282−0.1360.302
Sucrose0.1950.164−0.01670.328
Total sugars0.1450.285−0.1370.343
SI0.1350.299−0.1540.332
Weight0.0143−0.2860.178−0.0434
Length−0.00334−0.3350.1310.0556
Diameter0.0861−0.2530.216−0.0737
Publisher’s Note: MDPI stays neutral with regard to jurisdictional claims in published maps and institutional affiliations.

