
Quantitative Research on Profitability Measures in the Polish Meat and Poultry Industries


Abstract
:1. Introduction
1.1. The Meat and Poultry Industries in Poland
1.2. Economic Efficiency in the Paradigm of Sustainable Development
1.3. Financial Efficiency in Terms of Profitability in the Meat and Poultry Industries
- (1)
- Have the meat and poultry enterprises reached economic efficiency in the area of profitability?
- (2)
- Are there any statistically significant dependencies between profitability ratios and the meat and poultry enterprises?
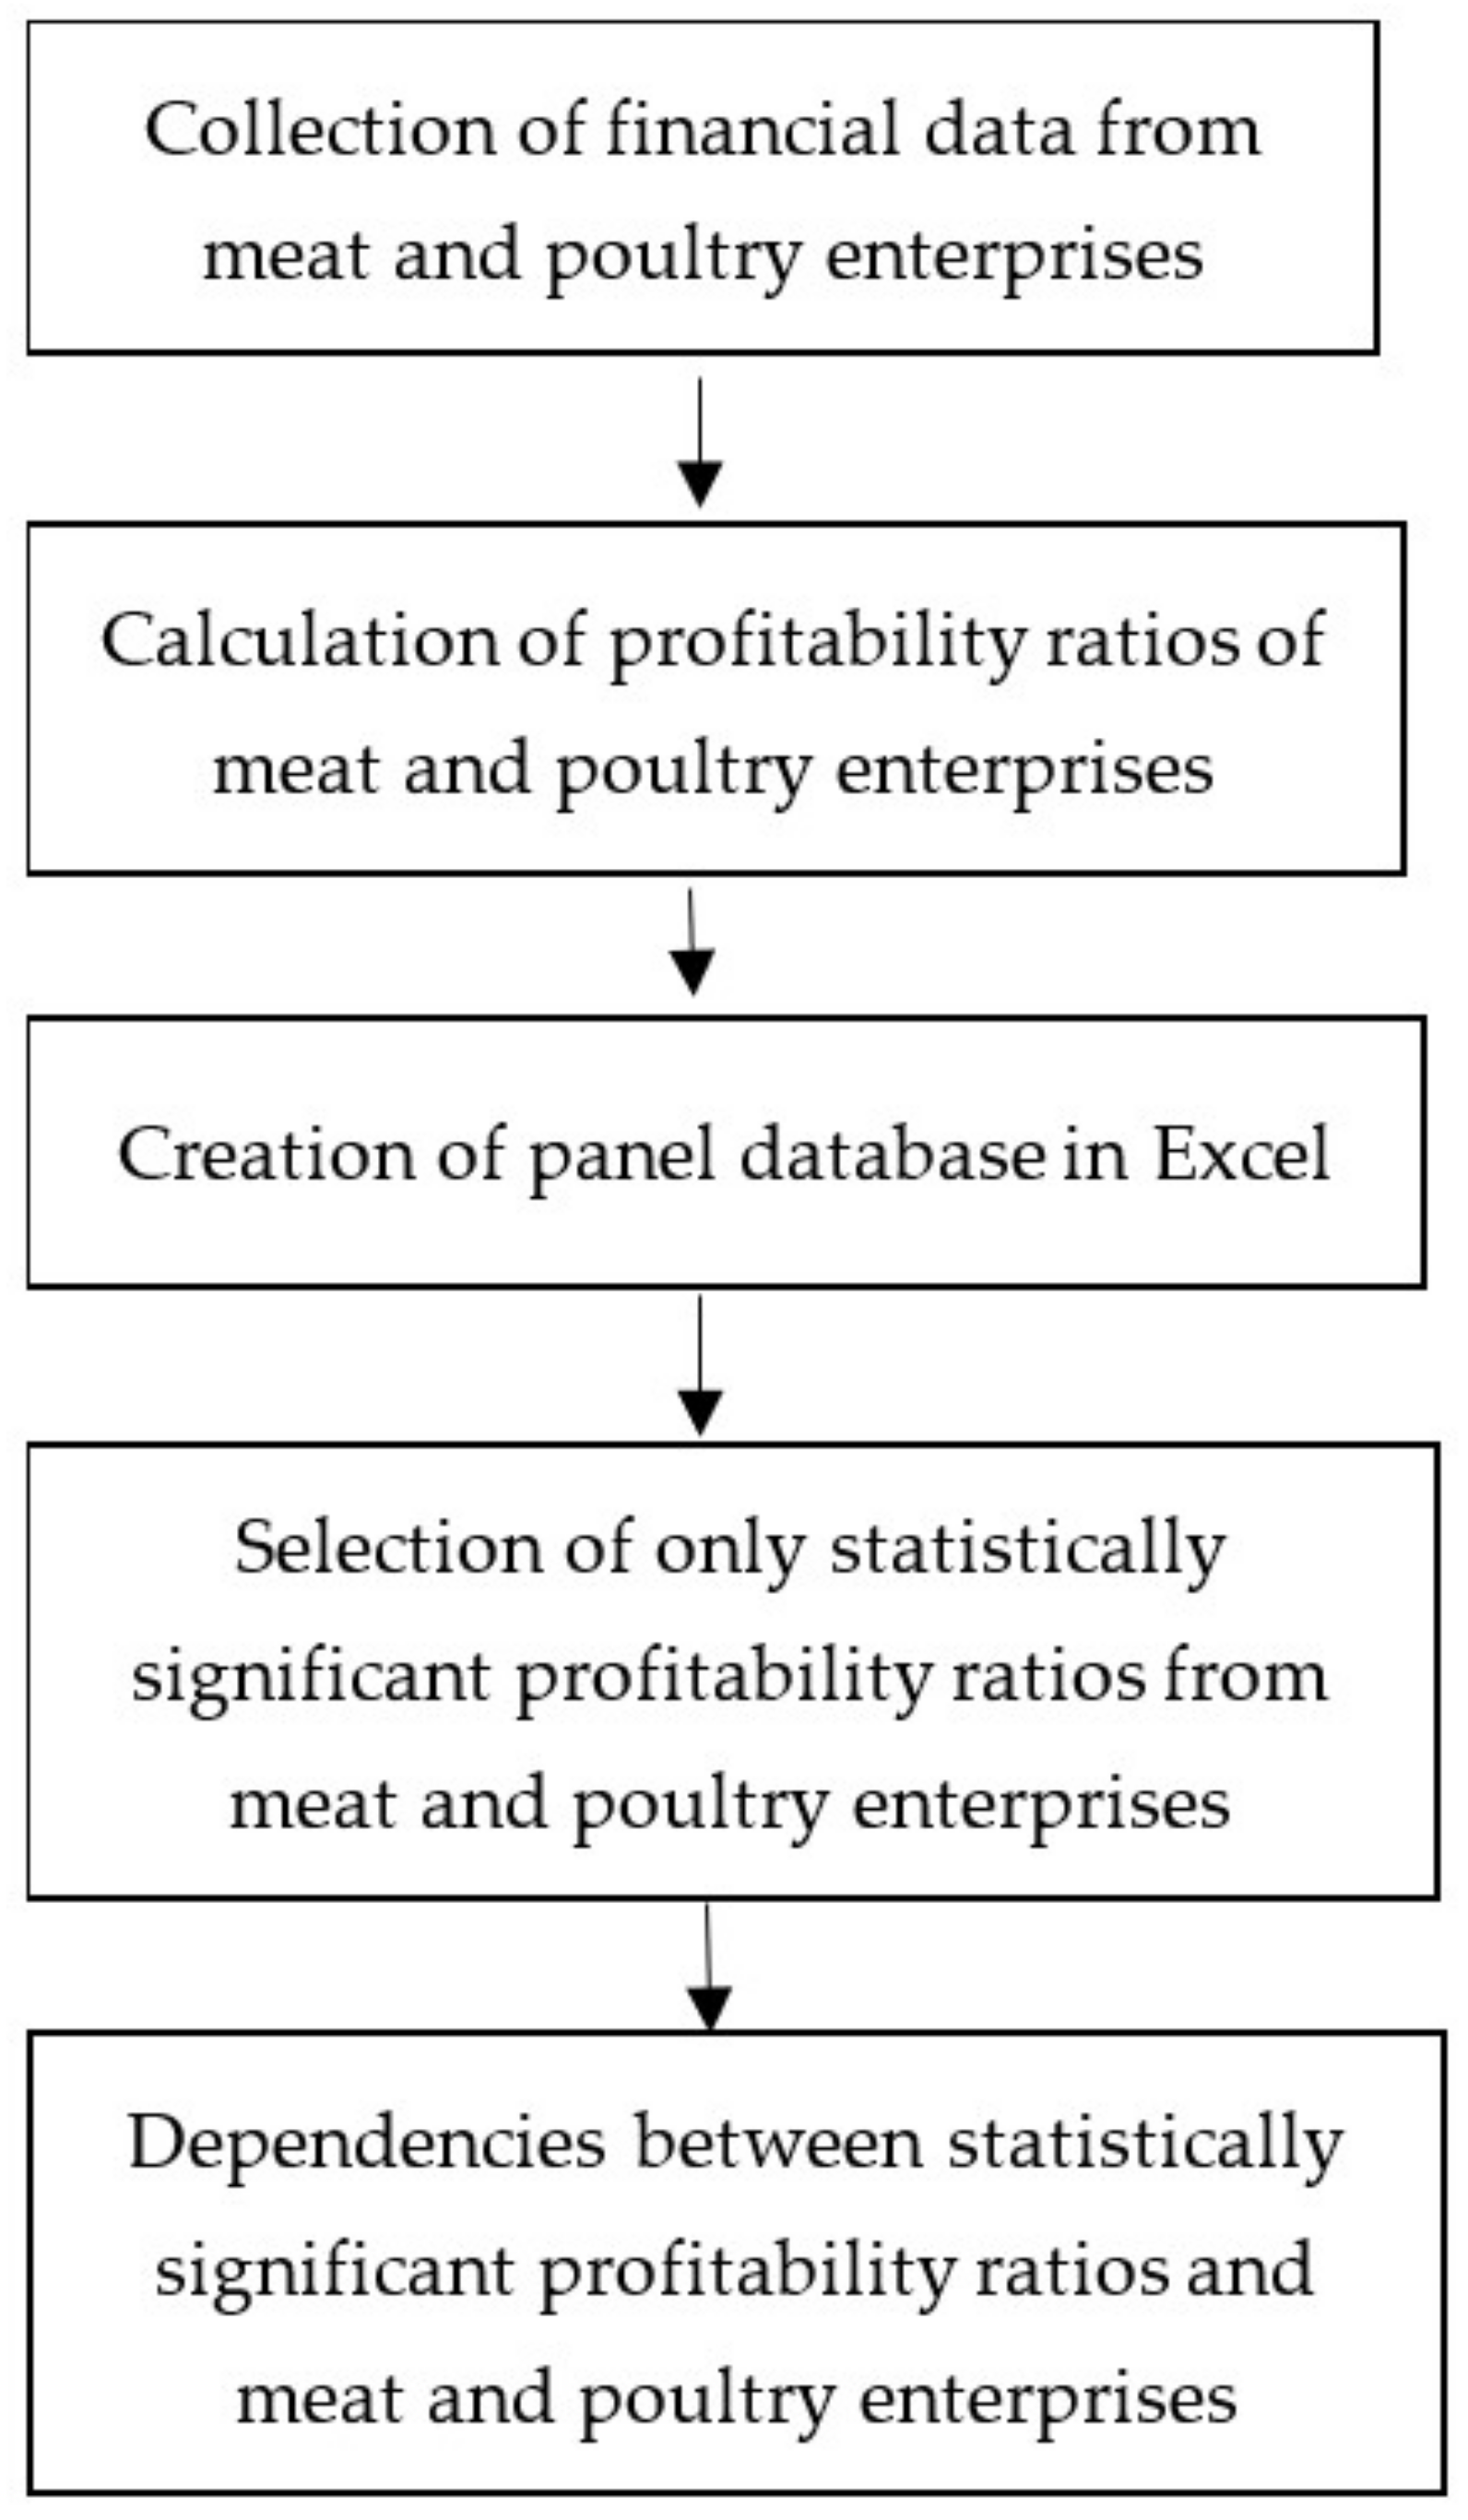
2. Materials and Methods
2.1. Primary and Secondary Research Sources
2.2. Measures
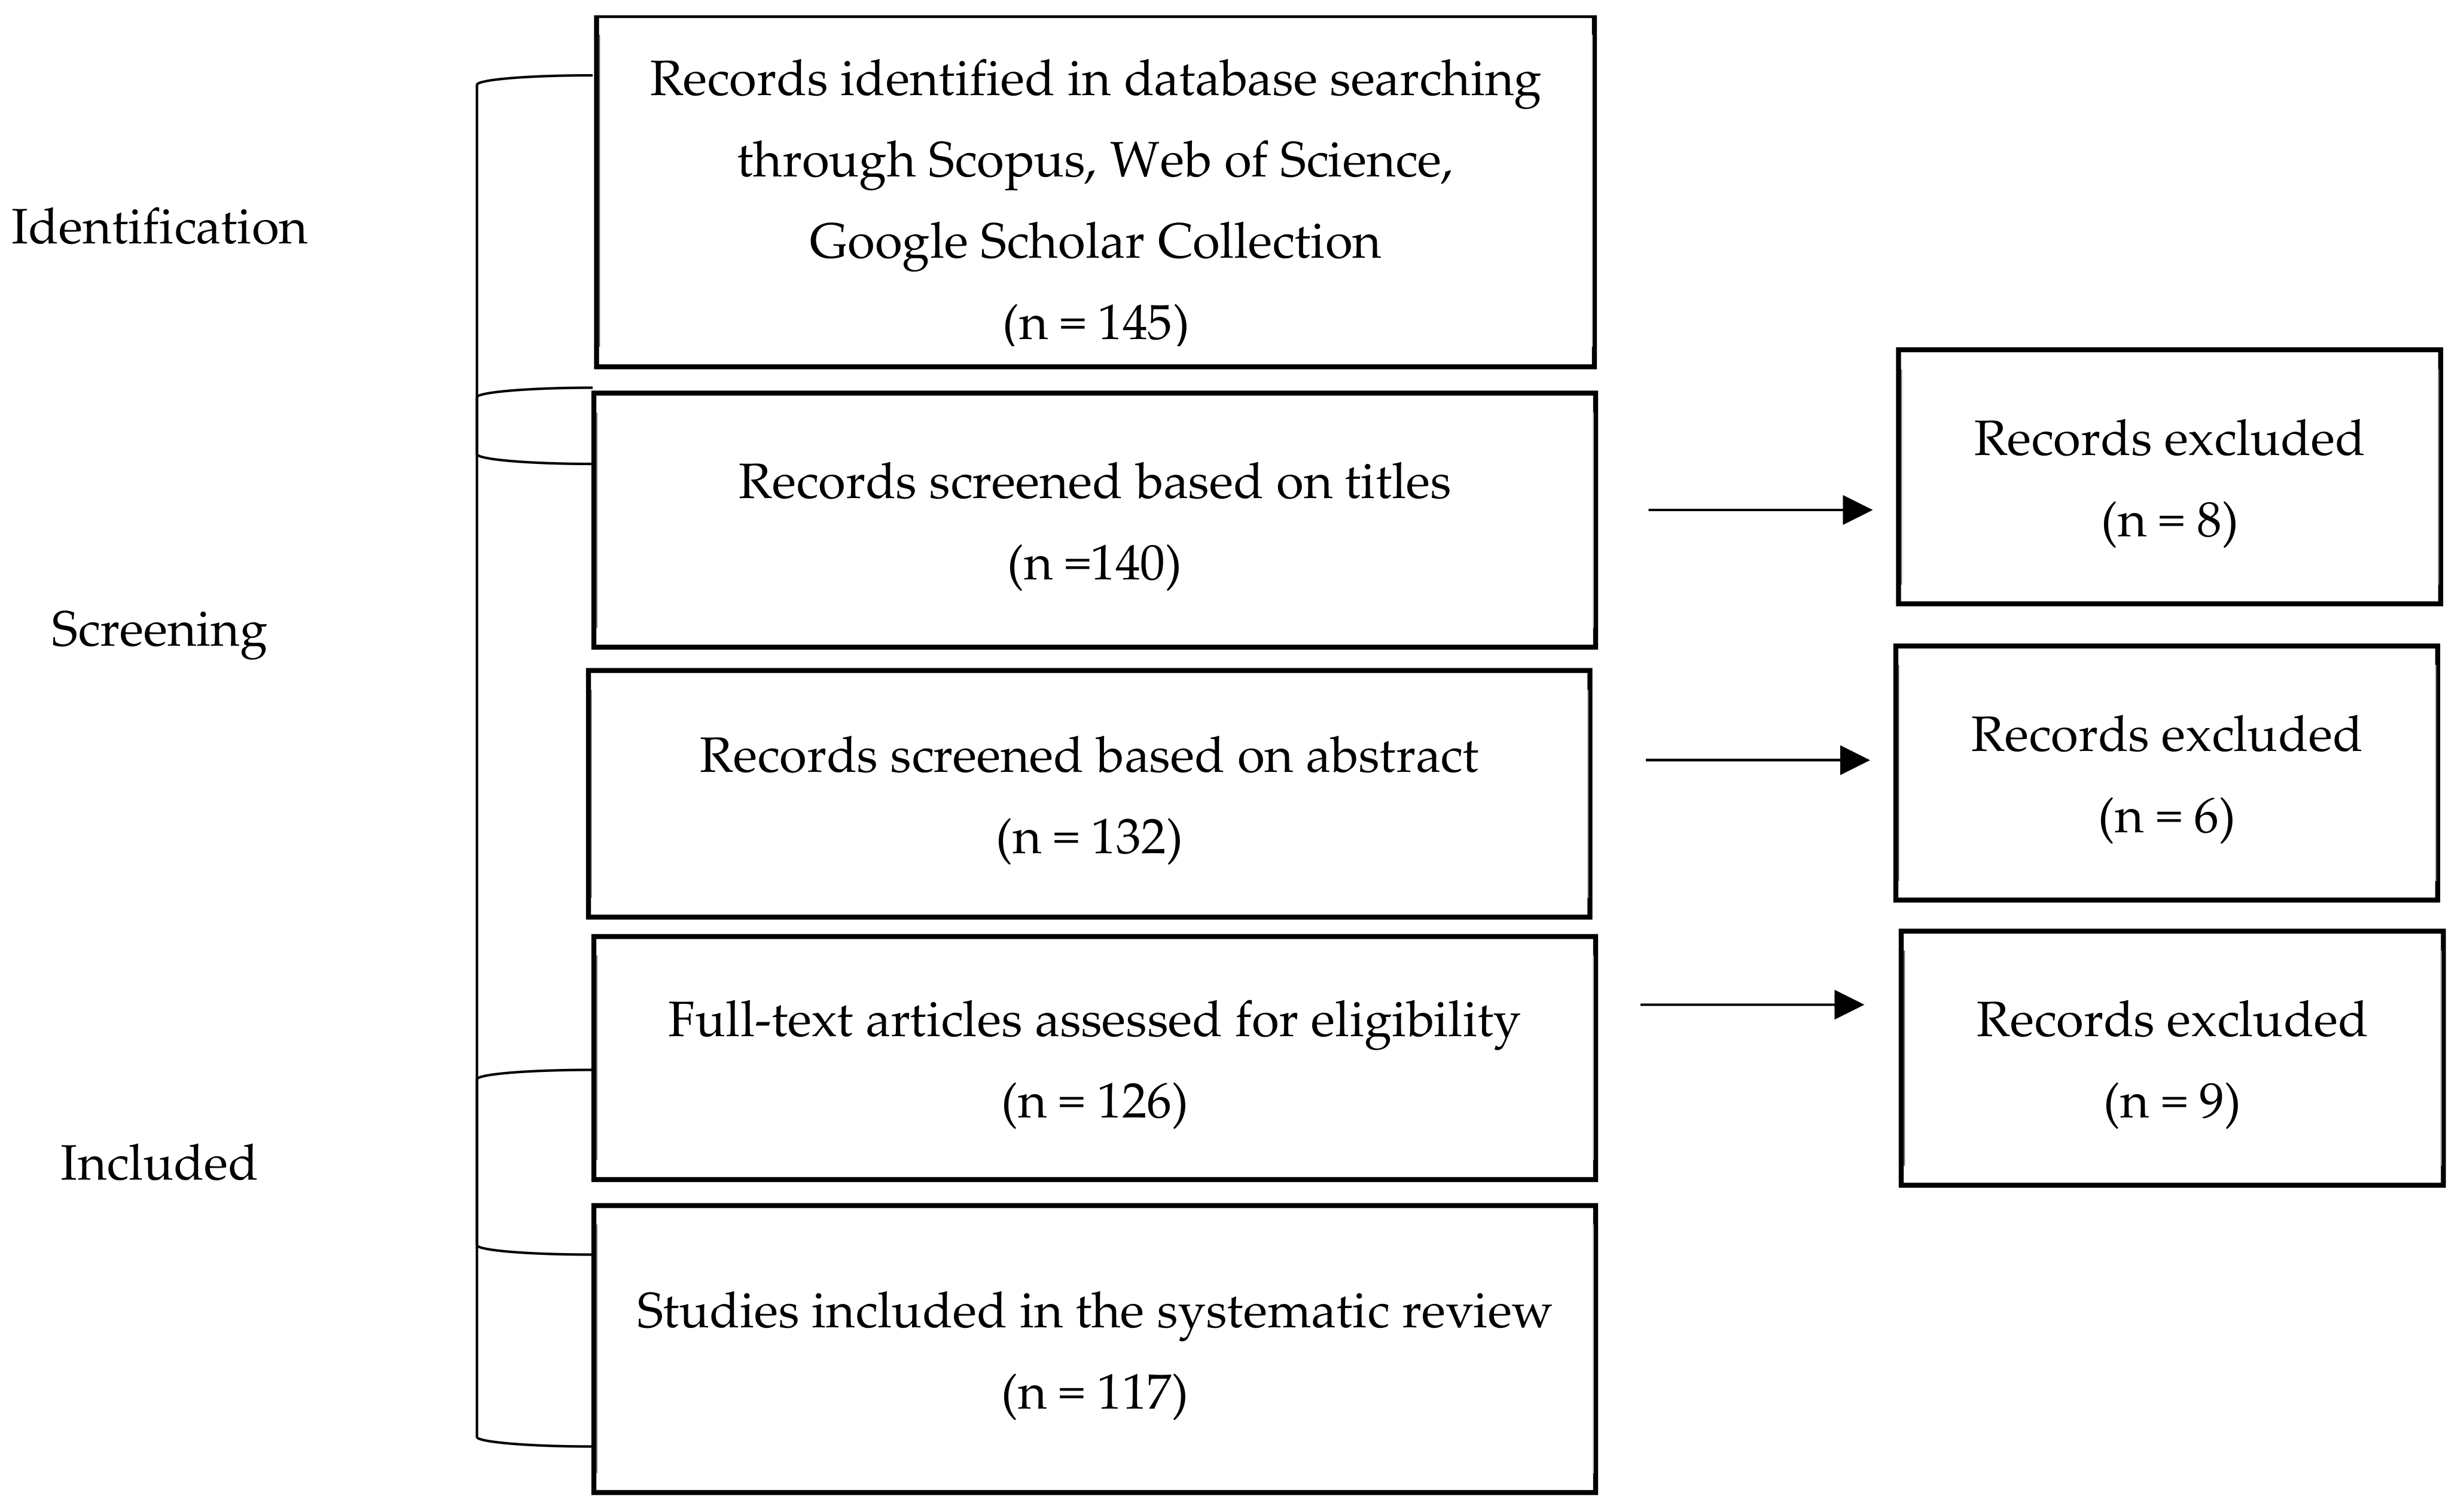
2.3. Sample and Procedure
- Subject of conducted activity according to PKD 2007 (PKD—Polish Classification of Business Activities)—classes 10.12 and 10.13;
- Location within the country;
- Keeping financial statements for the years 2012–2019;
- Raw material processing volume (t/week), number of employees (full-time), and volume of revenue (PLN/year).
2.4. Financial Analysis—Concept, Advantages, and Constraints of Its Use
- 5.
- Activity ratios that measure how efficiently a company performs day-to-day tasks such as the collection of receivables and management of inventory;
- 6.
- Liquidity ratios that measure the company’s ability to meet its short-term obligations;
- 7.
- Solvency ratios that measure a company’s ability to meet long-term obligations. Subsets of these ratios are also known as “leverage” and “long-term debt” ratios;
- 8.
- Profitability ratios that measure a company’s ability to generate profitable sales from its resources (assets);
- 9.
- Calculation ratios that measure the quantity of an asset or flow (e.g., earnings) associated with ownership of a specified claim (e.g., a share or ownership of the enterprise).
2.5. ANOVA Analysis—Concept, Advantages, and Constraints of its Use
2.6. Panel Data Modeling—Concept, Advantages, and Constraints of Its Use
3. Results and Discussion
4. Conclusions
- 10.
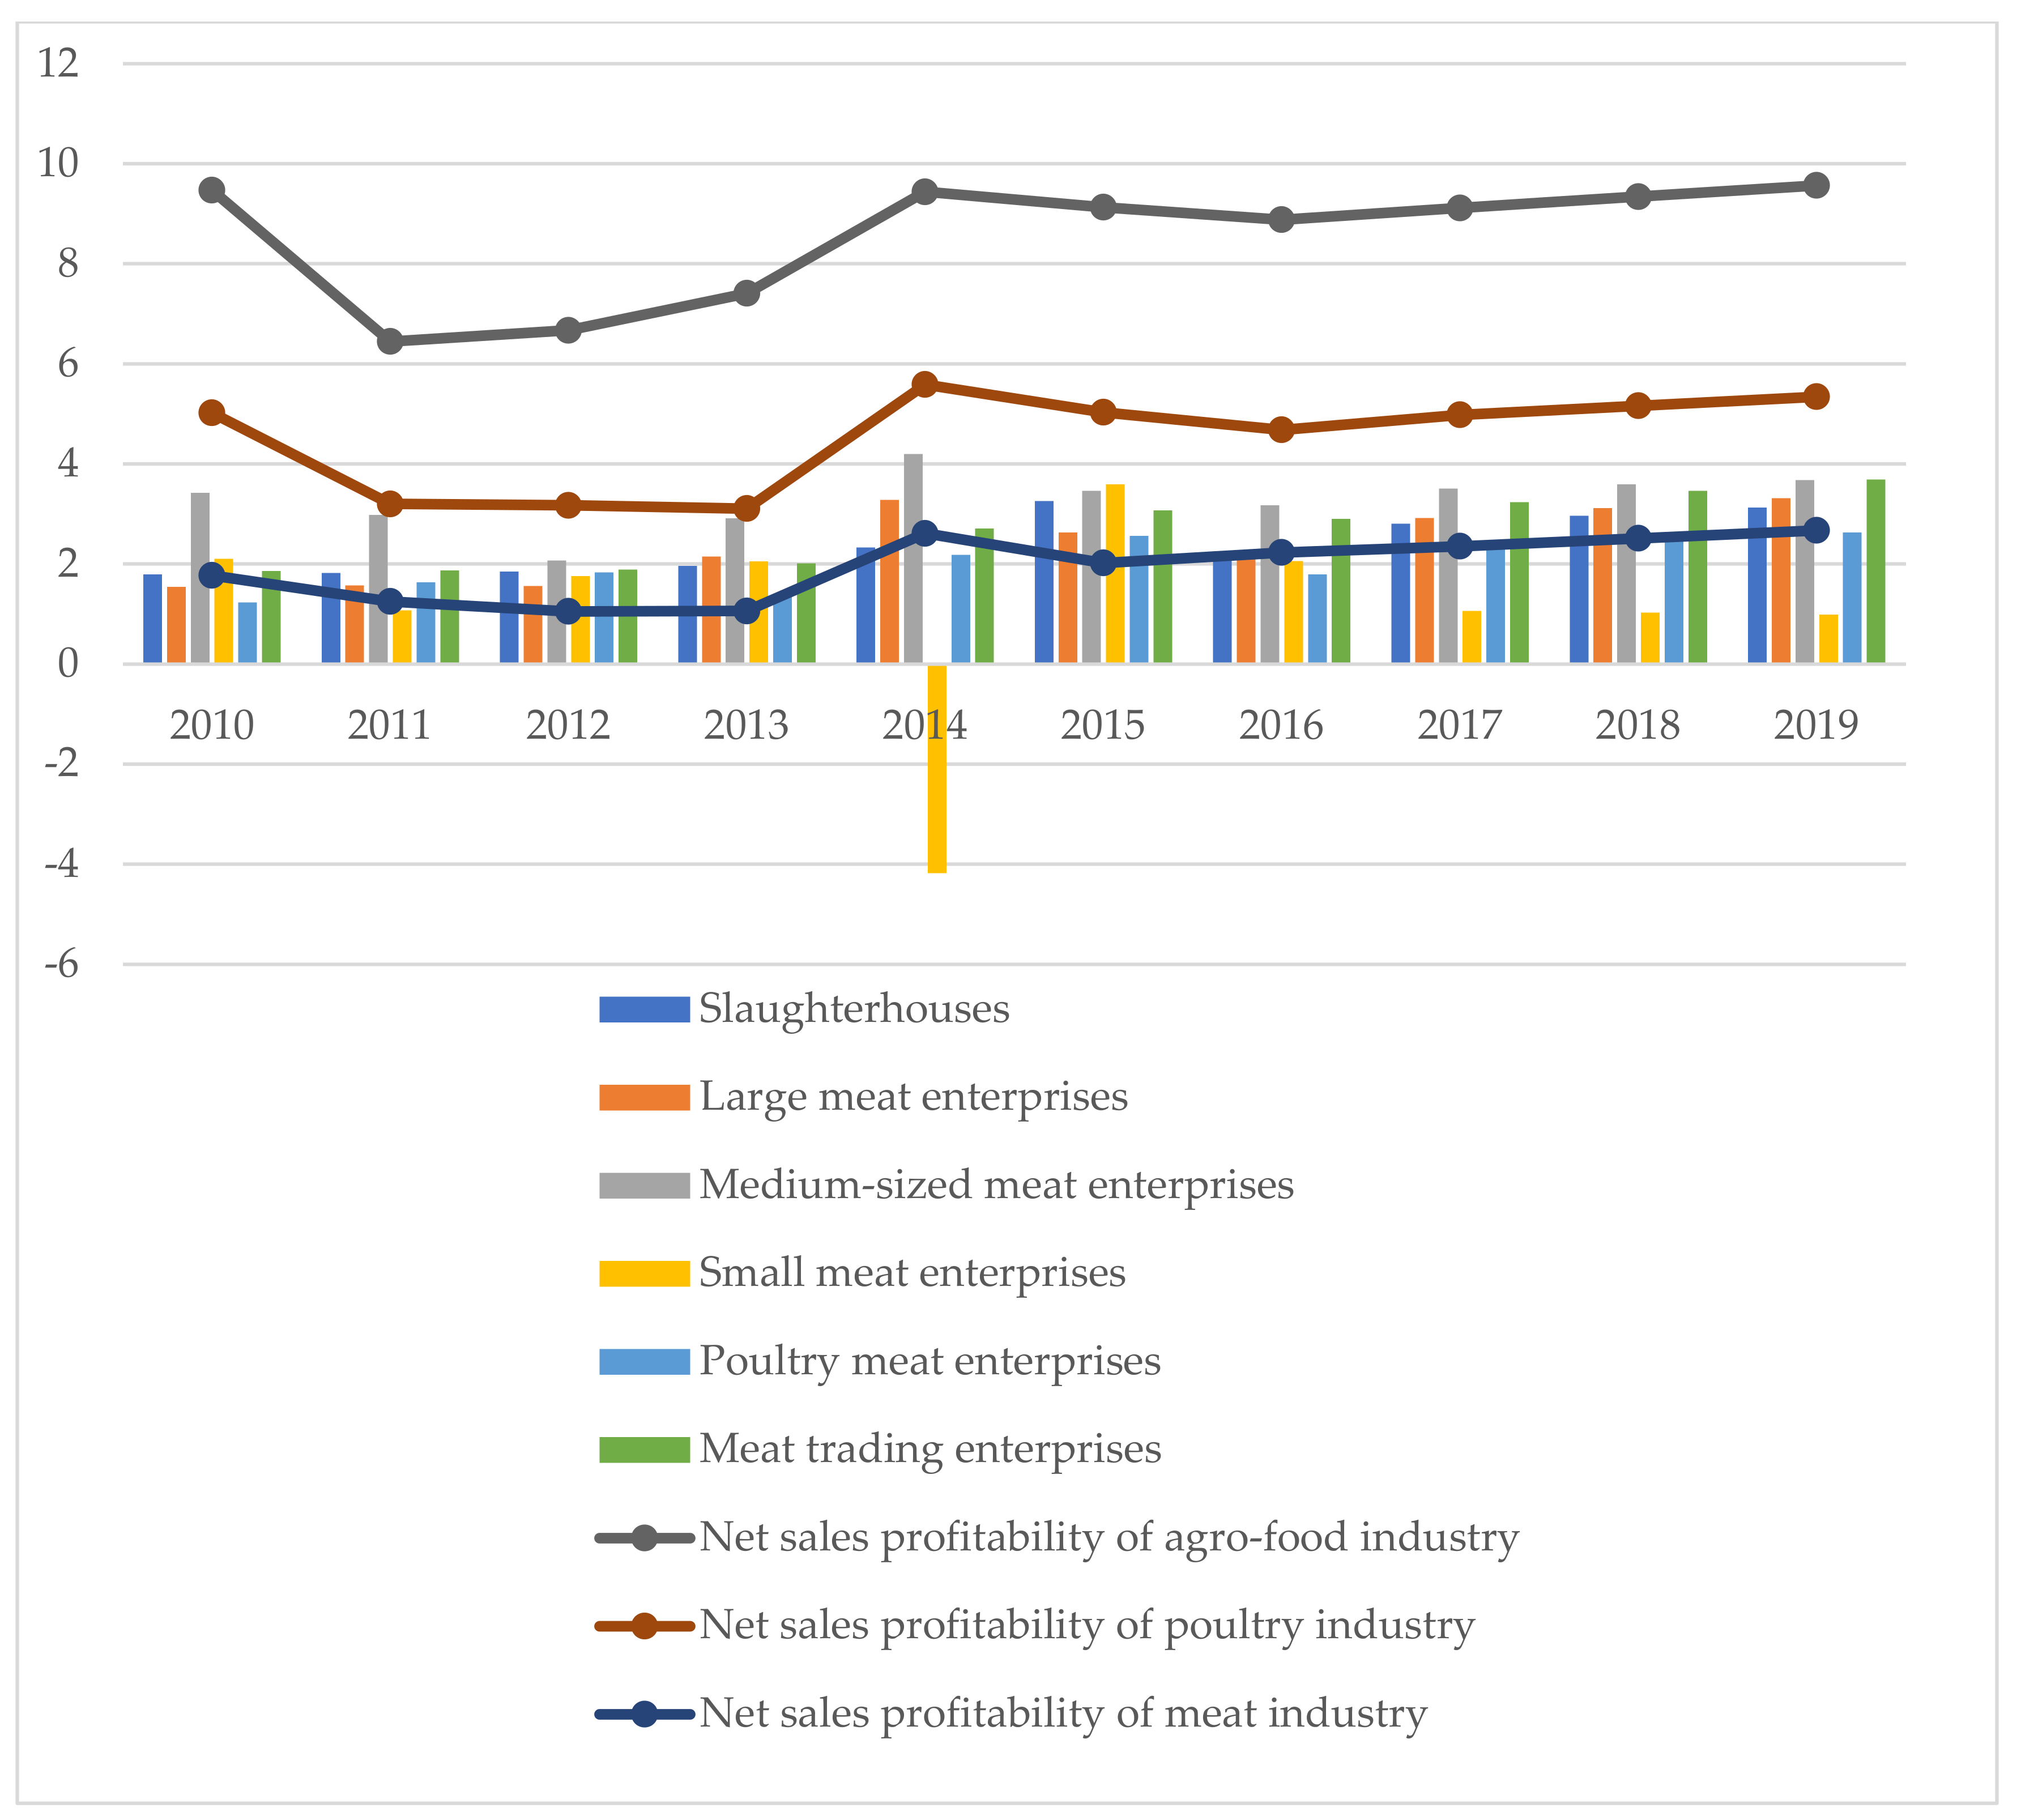
- There was a wide variation in terms of profitability in all four groups of analyzed enterprises;
- 11.
- The evaluation of the enterprises’ profitability ratios showed statistical significance for the rise in profitability for ROE, NRS, and OP, which means that enterprises should invest and upgrade their own capital to gain market advantage and compete with other companies as well as scrutinize their ability to pay back the loans.
- 12.
- The ROE ratio significantly differentiated poultry meat enterprises, which means that due to the fact of their fast production turnover, they can gain a higher return on equity;
- 13.
- NRS significantly differentiated slaughterhouses and poultry meat enterprises, and they must pay close attention to the size of their credit burden;
- 14.
- OP significantly differentiated meat enterprises, which means they have to cope with the high demands on the price and quality of their products.Summarizing the results of the study, the following specific conclusions can be drawn:
- 15.
- Profitability reached the highest values in the examined poultry meat enterprises;
- 16.
- The positive level of profitability (except for small meat enterprises) was achieved by all groups of examined enterprises;
- 17.
- The examined small meat enterprises had the largest difficulties in maintaining the optimal level of profitability.
- 18.
- Based on the researchers’ field experiences, farmers, producers, processers, and wholesalers as well as retailers in the meat and poultry industries have vivid evidence that keeping a detailed record on profitability ratios will enable them to use this knowledge to run a successful business and reduce the risk of insolvency. Moreover, the results of the panel data modeling offer a reference for potential profitability paths by developing different meat and poultry production tracks;
- 19.
- State authorities and government institutions dealing with the meat and poultry industries should focus on financial support in the form of credit and loans.
Author Contributions
Funding
Institutional Review Board Statement
Informed Consent Statement
Data Availability Statement
Conflicts of Interest
Appendix A

| Number | Name of The Ratio | Explanation of the Profitability Ratio | Average Values in the Sector |
|---|---|---|---|
| 1. | Operating profitability (OP) = (operating profit)/(sales revenue + other operating revenue) | The operating profitability ratio measures the relationship between profit (loss) on total operations and sales in value terms. The ratio takes into account other operating activities in the assessment of profitability, thus increasing or decreasing the profitability of the core business by a partial result achieved on other operating activities | 9.82 |
| 2. | Return on total capital (ROI) = Operating profit after tax/total capital × 100% | The return on investment ratio measures the effectiveness of a company’s operations, as it estimates how much profit a company can count on by investing one monetary unit. Due to the fact of its versatility and ease of calculation, the ratio is often used to compare the profitability of several investments and can be expressed as a percentage or value. | The higher, the better |
| 3. | Net return on sales (NRS) = net profit/(net revenue from the. sale of products, goods, and materials + other operating revenue + financial revenue + extraordinary profits) × 100% | The return on sales ratio shows how much net profit remains in the company from sales. This means that thanks to the ratio, one can determine how much profit is earned on each 1 monetary unit acquired from sales. The amount of the ratio depends to a large extent on the industry of the company and the length of the turnover cycle and the company’s sales volume. | 3.87% |
| 4. | Return on assets (ROA) = net profit/total assets × 100% | The return on assets ratio informs on the company’s ability to generate profits and the efficiency of asset management. | 8.79% |
| 5. | Return on equity (ROE) = net profit/equity × 100% | The return on equity ratio shows how much profit a company generates from the contributed equity. | 14.85% |
References
- Zielińska-Chmielewska, A. Ocena Efektywności Ekonomicznej Przedsiębiorstw Mięsnych w Polsce (Assesment of Economic Efficiency of Meat Enterprises in Poland); Wydawnictwo UE w Poznaniu: Poznań, Poland, 2020. [Google Scholar]
- Zielińska-Chmielewska, A.; Mruk-Tomczak, D.; Wielicka-Regulska, A. Qualitative Research on Solving Difficulties in Maintaining Continuity of Food Supply Chain on the Meat Market during the COVID-19 Pandemic. Energies 2021, 14, 5634. [Google Scholar] [CrossRef]
- Havlíček, J.; Dömeová, L.; Smutka, L.; Řezbová, H.; Severová, L.; Šubrt, T.; Šrédl, K.; Svoboda, R. Efficiency of Pig Production in the Czech Republic and in an International Context. Agriculture 2020, 10, 597. [Google Scholar] [CrossRef]
- Boggia, R.; Zunin, P.; Turrini, F. Functional Foods and Food Supplements. Appl. Sci. 2020, 10, 8538. [Google Scholar] [CrossRef]
- Baráth, L.; Fertő, I. Productivity and Convergence in European Agriculture. J. Agric. Econ. 2016, 68, 228–248. [Google Scholar] [CrossRef] [Green Version]
- Šrédl, K.; Prášilová, M.; Severová, L.; Svoboda, R.; Štěbeták, M. Social and Economic Aspects of Sustainable Development of Livestock Production and Meat Consumption in the Czech Republic. Agriculture 2021, 11, 102. [Google Scholar] [CrossRef]
- Mian, M.A.; Malik, M.S. Variations in Profitability of Different Size of Commercial Broiler Poultry Farms in Central Region of Khyber Pakhtunkhwa. Sarhad J. Agric. 2021, 37, 858–867. [Google Scholar]
- Spedding, C.R.W. Sustainability in animal production systems. Anim. Sci. 1995, 61, 1–8. [Google Scholar] [CrossRef]
- Dan, S.D.; Platon, S.; Mihaiu, M.; Jecan, C.; Cordea, D.; Cordis, I.V.; Lapusan, A. Microbial Risk Assessment in the Main Steps of Poultry Slaughter. Bull. UASVM Vet. Med. 2013, 70, 214–222. [Google Scholar]
- Kelly, L.A.; Gettinby, H.E.; Fazil, G.A.; Snary, E.; Wooldridge, M. Microbiological safety of poultry meat: Risk assessment as a way forward. World’s Poult. Sci. J. 2003, 59, 495–508. [Google Scholar] [CrossRef]
- Mead, G.C. Microbiological quality of poultry meat: A review. Braz. J. Poult. Sci. 2004, 6, 135–142. [Google Scholar] [CrossRef]
- Hiralal, J. Problems of Poultry Farming. 2015. Available online: www.krishisewa.com/articles/livestock/575-poultry-farming-problem (accessed on 1 September 2021).
- Zawadzka, D.; Pasińska, D. Przetwórstwo [Meat processing]. Rynek Mięsa (Meat Mark.) 2017, 53, 49–52. [Google Scholar]
- Pasińska, D. Przetwórstwo [Poultry Meat Processing]. Rynek Drobiu Jaj [Poult. Egg Mark.] 2018, 53, 10–13. [Google Scholar]
- Jaźwiński, I. Kapitał Ludzki w Polityce Regionalnej (Human Capital in Regional Policy); Wydawnictwo Naukowe Uniwersytetu Szczecińskiego: Szczecin, Poland, 2017. [Google Scholar]
- Kotane, I.; Kuzmina-Merlino, I. Assessment of financial indicators for evaluation of business performance. Eur. Integr. Stud. 2012, 6, 216–224. [Google Scholar] [CrossRef]
- Narkunienė, J.; Ulbinaitė, A. Comparative analysis of company performance evaluation methods. Entrep. Sustain. Issues 2018, 6, 125–138. [Google Scholar] [CrossRef]
- Black, J. Słownik konomii; Wydawnictwo Naukowe PWN: Warsaw, Poland, 2008. [Google Scholar]
- Kaplan, R.S.; Atkinson, A.A. Advanced Management Accounting, 3rd ed.; Prentice-Hall: Hoboken, NJ, USA, 1998. [Google Scholar]
- Alexander, D.; Britton, A.; Jorissen, A. International Financial Reporting and Analysis, 6th ed.; Cengage Learning EMEA: Andover, UK, 2014. [Google Scholar]
- Zielińska-Chmielewska, A.; Kaźmierczyk, J.; Andrianova, E.V. Advantages and Constraints of Eco-Efficiency Measures: The Case of the Polish Food Industry. Agronomy 2021, 11, 299. [Google Scholar] [CrossRef]
- De Toni, A.; Tonchia, S. Performance measurement systems–Models, characteristics and measures. Int. J. Oper. Prod. Manag. 2001, 21, 46–71. [Google Scholar] [CrossRef]
- Rutherford, D. Routledge Dictionary of Economics; Taylor& Francis Group: London, UK, 2002. [Google Scholar]
- Zbierowski, P. Organizacja wysokiej efektywności. In Uwarunkowania i Prawidłowości Gospodarcze Wywierające Wpływ na Efektywność Funkcjonowania Przedsiębiorstw; Dudycz, T., Ed.; Politechnika Wrocławska: Wrocław, Poland, 2008; Volume 10, pp. 69–79. [Google Scholar]
- Kowalski, Z. Wybrane problemy definiowania i oceny efektywności gospodarowania w rolnictwie (Selected problems of defining and evaluating management efficiency in agriculture, Zeszyty Naukowe). Zag. Ekon. Rolnej 1992, 1, 2–22. [Google Scholar]
- Wilkin, J. Efektywność a sprawiedliwość (Effectiveness and Justice). 1997. Available online: www.for.org.pl (accessed on 1 October 2019).
- Pietrzak, M. Efektywność finansowa spółdzielni mleczarskich – koncepcja oceny [Financial efficiency of dairy cooperatives - a concept for evaluation. In Wydawnictwo Szkoły Głównej Gospodarstwa Wiejskiego w Warszawie; Wydawnictwo Szkoły Głównej Gospodarstwa Wiejskiego w Warszawie: Warszawa, Poland, 2006; ISBN 8372448175. [Google Scholar]
- Diantimala, Y. The mediating effect of sustainability disclosure on the relationship between financial performance and firm value. J. Account. Financ. Audit. Stud. 2018, 4, 32–48. [Google Scholar]
- Financing for Sustainable Development Report; The Inter-Agency Task Force on Financing for Development United Nations: New York, NY, USA, 2019.
- Modigliani, F.; Pogue, G.A. An introduction to risk and return: Concepts and evidence, part one. Financ. Anal. J. 1974, 30, 68–80. [Google Scholar] [CrossRef] [Green Version]
- Solow, R. Intergenerational equity and exhaustible resources. Rev. Econ. Stud. 1974, 41, 29–45. [Google Scholar] [CrossRef] [Green Version]
- Stiglitz, J. Growth with exhaustible natural resources: Efficient and optimal growth paths. Rev. Econ. Stud. 1974, 41, 123–137. [Google Scholar] [CrossRef] [Green Version]
- Myšková, R.; Hájek, P. Comprehensive assessment of firm financial performance using financial ratios and linguistic analysis of annual reports. J. Int. Stud. 2017, 10, 96–108. [Google Scholar] [CrossRef] [Green Version]
- Zabolotnyy, S.; Wasilewski, M. The Concept of Financial Sustainability Measurement: A Case of Food Companies from Northern Europe. Sustainability 2019, 11, 5139. [Google Scholar] [CrossRef] [Green Version]
- Jaźwiński, I. Elementy Ekonomii i Polityki Społecznej (Elements of Social Economics and Policy); Polskie Towarzystwo Ekonomiczne: Szczecin, Poland, 2007. [Google Scholar]
- Mroczek, R. Przetwórstwo [Meat Processing]. Rynek Mięsa (Meat Mark.) 2018, 55, 49–51. [Google Scholar]
- Kuipers, A.; Malak-Rawlikowska, A.; Stalgienė, A.; Ule, A.; Klopčič, M. European Dairy Farmers’ Perceptions and Responses towards Development Strategies in Years of Turbulent Market and Policy Changes. Agriculture 2021, 11, 293. [Google Scholar] [CrossRef]
- Rahman, S.; Kazal, M.M.H.; Begum, I.A.; Alam, M.J. Competitiveness, Profitability, Input Demand and Output Supply of Maize Production in Bangladesh. Agriculture 2016, 6, 21. [Google Scholar] [CrossRef] [Green Version]
- Havlíček, J.; Šrédl, K.; Řezbová, H.; Smutka, L.; Dömeová, L.; Severová, L.; Šubrt, T.; Svoboda, R. International aspects of the pork production value chain in the Czech Republic. Int. J. Value Chain. Manag. 2021, 12, 241–266. [Google Scholar]
- Ismail, D.; Majid, T.A.; Roosli, R. Analysis of Variance of the Effects of a Project’s Location on Key Issues and Challenges in Post-Disaster Reconstruction Projects. Economies 2017, 5, 46. [Google Scholar] [CrossRef] [Green Version]
- Ali, S.; Asif, R.; Nawaz, M. Profitability and cost efficiency analysis of open shed broiler farmers in Punjab, Pakistan. Int. J. Econ. Comm. Manag. 2014, 2, 1–10. [Google Scholar]
- Bano, R.; Shah, H.; Sharif., M.; Akhtar, W. Profitability index and capital turn over in open house broiler farming: A case study of district Rawalpindi. J. Agric. Res. 2011, 24, 1–4. [Google Scholar]
- Islam, F. An Analytical Evaluation of Broiler Farm Unit in Malakand Agency. Life Sci. Int. J. 2016, 1. [Google Scholar]
- Mohsin, A.Q.; Riaz, R.; Asad, S.; Mushtaq, A. A profitability analysis of broiler production in Rawalpindi District. Pak. J. Agric. Sci. 2008, 45, 514–519. [Google Scholar]
- Oladeebo, J.O.; Ambe-Lamidi, A.I. Profitability, input elasticities and economic efficiency of poultry production among youth farmer in Osun State, Nigeria. Int. J. Poult. Sci. 2007, 6, 994–998. [Google Scholar] [CrossRef] [Green Version]
- Shaikh, A.S.; Zala, Y.C. Production Performance and Economic Appraisal of Broiler Farms of Gujarat. Agric. Econ. Res. Rev. 2011, 24, 317–323. [Google Scholar]
- Rynek Mięsa (Meat Market). Summary 2020, 59, 5–7.
- Rynek Drobiu Jaj (Poultry and Egg Market). Summary 2020, 58, 4–5.
- Pasińska, D. Przetwórstwo [Poultry Meat Processing]. Rynek Drobiu Jaj [Poult. Egg Mark.] 2018, 54, 10–13. [Google Scholar]
- Pasińska, S. Przetwórstwo [Poultry Meat Processing]. Rynek Drobiu Jaj [Poult. Egg Mark.] 2019, 55, 10–12. [Google Scholar]
- Wasilewski, M.; Zabadała, P. Efektywność przedsiębiorstw rolniczych w zależności od relacji kapitału własnego do obcego [Efficiency of agricultural enterprises as a function of the equity/foreign capital ratio]. In Ekonomika i Organizacja Gospodarki Żywnościowej; No. 99; Wydawnictwo SGGW: Warsaw, Poland, 2012. [Google Scholar]
- Filipiak, B.; Jasińska, E. Changes in the approach to measuring efficiency of public healthcare organizations. Zesz. Nauk. Wyższej Szkoły Bank. Pozn. 2018, 78, 87–101. [Google Scholar] [CrossRef]
- Waśniewski, T.; Skoczylas, W. Teoria i Praktyka Analizy Finansowej w Przedsiębiorstwie [Theory and Practice of Financial Analysis in Business]; Fundacja Rozwoju Rachunkowości w Polsce [Foundation for the Development of Accounting in Poland]: Warsaw, Poland, 2004. [Google Scholar]
- Jaki, A. Mechanizmy procesu zarządzania wartością przedsiębiorstwa (Mechanisms of the enterprise value management process). Zesz. Nauk. Uniw. Ekon. Krakowie 2012, 215, 150–152. [Google Scholar]
- Mensch, G. Finanz-Controlling. In Finanzplanung und Kontrolle. Controlling zur Finanziellen Unternehmungsführung, 2nd ed.; Oldenburg Verlag: München, Germany, 2008; p. 417. [Google Scholar]
- Czerwińska-Kayzer, D.; Florek, J.; Staniszewski, R.; Kayzer, D. Application of Canonical Variate Analysis to Compare Different Groups of Food Industry Companies in Terms of Financial Liquidity and Profitability. Energies 2021, 14, 4701. [Google Scholar] [CrossRef]
- Kandpal, V.; Kavidayal, P.C. Implication of working capital management on the profitability: A case of ONGC LTD, India. Commer. Manag. 2013, 4, 49–53. [Google Scholar] [CrossRef]
- Malak-Rawlikowska, A.; Głębska, M.; Hoste, R.; Leeb, C.; Montanari, C.; Wallace, M.; de Roest, K. Developing a Methodology for Aggregated Assessment of the Economic Sustainability of Pig Farms. Energies 2021, 14, 1760. [Google Scholar] [CrossRef]
- Mijic, K.; Zekic, S.; Jaksic, D.; Vuković, B. Meat industry in Serbia: Performance analysis of meat-processing and livestock companies. Custos Agronegocio 2014, 10, 124–144. [Google Scholar]
- Zielińska-Chmielewska, A.; Alihodzić, A.; Smutka, L. Theoretical and practical concepts of financial efficiency in food processing enterprises. In Proceedings of the 8th International Scientific Symposium Economy of Eastern Croatia—Vision and Growth, Jossip Juraj Strossmayer University of, Osijek, Osijek, Croatia, 29–30 May 2019; pp. 1086–1096. [Google Scholar]
- Zimon, G.; Zimon, D. The Impact of Purchasing Group on the Profitability of Companies Operating in the Renewable Energy Sector—The Case of Poland. Energies 2020, 13, 6588. [Google Scholar] [CrossRef]
- Helfert, E.A. The Nature of Financial Statements: The Income Statement. Financial Analysis–Tools and Techniques–A Guide for Managers; McGraw-Hill: New York, NY, USA, 2001. [Google Scholar]
- McCrary, S. Mastering Financial Accounting Essentials. In The Critical Nuts and Bolts; John Wileyand Sons, Inc.: Hoboken, NJ, USA, 2010. [Google Scholar]
- Niemann, M.; Schmidt, J.H.; Neukirchen, M. Improving performance of corporate rating prediction models by reducing financial ratio heterogeneity. J. Bank. Financ. 2008, 32, 434–446. [Google Scholar] [CrossRef]
- Pappas, A.A. Financial Accounting–Theoretical and Practical Issues, Vol. A; Mpenos, E. Press: Athens, Greece, 1998. [Google Scholar]
- Williams, J.R.; Haka, S.F.; Bettner, M.S.; Carcello, J.V. Financial and Managerial Accounting; McGraw-Hill, Irwin: New York, NY, USA, 2008. [Google Scholar]
- Bititci, U.S. Overview of popular performance measurement models and frameworks. In Managing Business Performance: The Science and the Art; TJ International Ltd.: Padstow, UK, 2015; pp. 251–262. [Google Scholar] [CrossRef]
- Baccarini, D. The concept of project complexity a review. Int. J. Proj. Manag. 1996, 14, 201–204. [Google Scholar] [CrossRef] [Green Version]
- Cheng, C.S. The incremental information content of earnings and cash flow from operations affected by their extremity. J. Bus. Financ. Account. 2003, 30, 73–116. [Google Scholar] [CrossRef]
- Straub, J.T. The Agile Manager’s Guide to Understanding Financial Statements; Velocity Business Publishing: Bristol, VT, USA, 1997. [Google Scholar]
- Su, L. A rule extraction based approach in predicting derivative use for financial risk hedging in construction companies. In Proceedings of the International Conference on Information, Management, Innovation Management and Industrial Engineering 2011, Shenzhen, China, 26–27 November 2011; pp. 397–400. [Google Scholar]
- American Management Association. How to build a high–performance organization. In A Global Study of Current Trends and Future Possibilities 2007–2017; Copyright 2007; American Management Association. Available online: http://www.gsu.edu/images/HR/HRI-high-performance07.pdf (accessed on 1 December 2021).
- Skripnuk, D.F.; Davydenko, V.A.; Romashkina, G.F.; Khuziakhmetov, R.R. Consumer Trust in Quality and Safety of Food Products in Western Siberia. Agronomy 2021, 11, 257. [Google Scholar] [CrossRef]
- Sievänen, M.; Suomala, P.; Paranko, O. Activity-Based Costing and Product. In Proceedings of the 5th International Seminar on Manufacturing Accounting Research, Pisa, Italy, 6–8 June 2001; pp. 1–14. [Google Scholar]
- Hafeez, K.; Zhang, Y.B.; Malak, N. Determining key capabilities of a firm using analytic hierarchy process. Int. J. Prod. Econ. 2002, 76, 39–51. [Google Scholar] [CrossRef]
- Lau, C.H.; Sholihin, M. Financial and non-financial performance measures: How do they affect job satisfaction? Br. Account. Rev. 2005, 37, 389–413. [Google Scholar] [CrossRef]
- Cardinaels, E.; van Veen-Dirks, P.M.G. Financial versus non-financial information: The impact of information organization and presentation in a Balanced Scorecard. Account. Organ. Soc. 2010, 35, 565–578. [Google Scholar] [CrossRef]
- Chen, J.S.; Tsou, H.T.; Huang, A.Y.H. Service Delivery Innovation: Antecedents and Impact on Firm Performance. J. Serv. Res. 2009, 12, 36–55. [Google Scholar] [CrossRef]
- Tangen, S. Performance measurement: From philosophy to practice. Int. J. Product. Perform. Manag. 2004, 53, 726–737. [Google Scholar] [CrossRef]
- Kim, J.; Im, C. Study on Corporate Social Responsibility (CSR): Focus on Tax Avoidance and Financial Ratio Analysis. Sustainability 2017, 9, 1710. [Google Scholar] [CrossRef] [Green Version]
- Choong, K.K. Understanding the features of performance measurement system: A literature review. Meas. Bus. Excell. 2013, 17, 102–121. [Google Scholar] [CrossRef]
- Suarez, V.; Lesneski, C.; Denison, D. Making the case for using financial indicators in local public health agencies. Am. J. Public Health 2011, 101, 419–425. [Google Scholar] [CrossRef]
- Robinson, T.R.; van Greuning, H.; Henry, E.; Broihahn, M.A. International Financial Statement Analysis; CFA Institute, John Wiley & Sons, Inc.: Hoboken, NJ, USA, 2009. [Google Scholar]
- Öcal, M.E.; Oral, E.L.; Erdis, E.; Vural, G. Industry financial ratios–Application of factor analysis in Turkish construction industry. Build. Environ. 2007, 42, 385–392. [Google Scholar] [CrossRef]
- Chavan, M. The balanced scorecard: A new challenge. J. Manag. Dev. 2009, 28, 393–406. [Google Scholar] [CrossRef] [Green Version]
- Zielińska-Chmielewska, A.; Smutka, L.; Kotyza, P.; Alihodźić, A. The measurement of financial efficiency in terms of debt in meat sector. The case of Poland. In Proceedings of the International Scientific Symposium “Region, Entrepreneurship, Development”, Osijek, Croatia, 16 June 2021. [Google Scholar]
- Štefko, R.; Vašaniˇcová, P.; Jenˇcová, S.; Pachura, A. Management and Economic Sustainability of the Slovak Industrial Companies with Medium Energy Intensity. Energies 2021, 14, 267. [Google Scholar] [CrossRef]
- Benos, T.; Kalogeras, N.; Wetzels, M.; de Ruyter, K.; Pennings, J.M.E. Harnessing a ‘Currency Matrix’ for Performance Measurement in Cooperatives: A Multi-Phased Study. Sustainability 2018, 10, 4536. [Google Scholar] [CrossRef] [Green Version]
- Bhasin, M. A study of economic value added disclosures in the annual reports: Is EVA a superior measure of corporate performance? East Asian J. Bus. Econ. 2017, 5, 10–26. [Google Scholar] [CrossRef]
- Hopwood, A.G. An empirical study of the role of accounting data in performance evaluation. empirical research in accounting: Selected studies. J. Account. Res. 1972, 10, 156–182. [Google Scholar] [CrossRef]
- Cohen, S.; Thiraios, D.; Kandilorou, M. Performance parameters interrelations from a balanced scorecard perspective: An analysis of Greek companies. Manag. Audit. J. 2008, 23, 485–503. [Google Scholar] [CrossRef]
- Shaban, A.; Shalaby, S.A.; Di Gravio, G.; Patriarca, R. Analysis of Variance Amplification and Service Level in a Supply Chain with Correlated Demand. Sustainability 2020, 12, 6470. [Google Scholar] [CrossRef]
- Md Isa, H.A.; Ismail, M.M.; Samsuddin, N.S.; Abdurofi, I. Profitability of broiler contract farming: A case study in Johor and Sabah. Int. J. Bus. Soc. 2019, 20, 521–532. [Google Scholar]
- Zhang, J.-T. Analysis of Variance for Functional Data; Chapman and Hall/CRC: London, UK, 2013. [Google Scholar]
- ANOVA (Analysis of Variance): Definition & Methods//Qualtrics. Available online: https://www.qualtrics.com/au/experience-management/research/anova/ (accessed on 1 May 2021).
- Wilcox, R.R. Understanding the Practical Advantages of Modern ANOVA Methods. J. Clin. Child Adolesc. Psychol. 2002, 31, 399–412. [Google Scholar] [CrossRef]
- Görzen, E.; Diekötter, T.; Meyerink, M.; Kretzschmar, H.; Donath, T.W. The Potential to Save Agrestal Plant Species in an Intensively Managed Agricultural Landscape through Organic Farming—A Case Study from Northern Germany. Land 2021, 10, 219. [Google Scholar] [CrossRef]
- Marelli, S.P.; Madeddu, M.; Mangiagalli, M.G.; Cerolini, S.; Zaniboni, L. Egg Production Systems, Open Space Allowance and Their Effects on Physical Parameters and Fatty Acid Profile in Commercial Eggs. Animals 2021, 11, 265. [Google Scholar] [CrossRef] [PubMed]
- What Are the Limitations of ANOVA in SPSS? Available online: www.techwalla.com/articles/what-are-the-limitations-of-anova-in-spss (accessed on 1 August 2021).
- Andrei, J.V.; Chivu, L.; Gheorghe, I.G.; Grubor, A.; Sedlarski, T.; Sima, V.; Subic, J.; Vasic, M. Small and Medium-Sized Enterprises, Business Demography and European Socio-Economic Model: Does the Paradigm Really Converge? J. Risk Financ. Manag. 2021, 14, 64. [Google Scholar] [CrossRef]
- Hsiao, C. Panel Data Analysis—Advantages and Challenges. Test 2007, 16, 1–22. [Google Scholar] [CrossRef] [Green Version]
- Ahrens, H. Analiza wariancji (Analysis of Variance); PWN: Warsaw, Poland, 1970. [Google Scholar]
- Stock, J.H.; Watson, M.W. Introduction to Econometrics, 4th ed.; Harward University Mark W. Watson Princeton University: New York, NY, USA, 2019; Available online: https://www.pearsonhighered.com/.../3/4/0134610989.pdf (accessed on 1 December 2021).
- Eadie, W.; Drijard, D.; James, F.; Roos, M.; Sadoulet, B. Statistical Methods in Experimental Physics, 4th ed.; Amsterdam, Harward University Mark W. Watson Princeton University: New York, NY, USA, 1971. [Google Scholar]
- Corder, G.; Foreman, D. Nonparametric Statistics for Non-Statisticians: A Step-by-Step Approach; John Wiley & Sons: Hoboken, NJ, USA, 2009. [Google Scholar]
- Mann, H.; Whitney, D. On a test of whether one of two random variables is stochastically larger than the other. Ann. Math. Stat. 1947, 18, 50–60. [Google Scholar] [CrossRef]
- Wilcoxon, F. Individual comparisons by ranking methods. Biom. Bull. 1945, 1, 196–202. [Google Scholar] [CrossRef]
- Mroczek, R. Przetwórstwo mięsa. Rynek mięsa. Stan i perspektywy (Meat Processing. The Meat Market. State of Play and Prospects); IERiGŻ-PIB: Warsaw, Poland, 2017. [Google Scholar]
- Mroczek, R. (Ed.) Przemiany Strukturalne Przemysłu Spożywczego w Polsce i UE na tle Wybranych Elementów Otoczenia Zewnętrznego. Monografie Programu Wieloletniego 2015–2019 (Structural Transformation of the Food Industry in Poland and the EU Against the Background of Selected Elements of the External Environment. Monographs of the Multiannual Programme 2015–2019); IERiGŻ-PIB: Warsaw, Poland, 2016. [Google Scholar]
- Bieniek-Majka, M.; Matuszczak, A. Profitability of Kuyavian-Pomeranian fruit and vegetable producers and organizators. Zesz. Nauk. Szkoły Głównej Gospod. Wiej. Warszawie Probl. Rol. Swiat. 2017, 17, 7–16. [Google Scholar] [CrossRef]
- Wasilewski, M.; Gałecka, A. Rentowność kapitału własnego gospodarstw rolniczych w zależności od bieżącej płynności finansowej [Return on equity of agricultural holdings in relation to current liquidity]. Zesz. Nauk. Ekon. Organ. Gospod. Żywnościowej 2010, 81, 231–240. [Google Scholar]
- Urban, R. Przetwórstwo Mięsa. Rynek Mięsa–Stan i Perspektywy, [Meat Processing. The Meat Market-State and Prospects]; Wydawnictwo Instytutu Rolnictwa i Gospodarki Żywnościowej: Warsaw, Poland, 2012; Volume 43, pp. 1–5. [Google Scholar]
- Drewnowska, B. Widmo upadłości wisi nad Rynkiem Mięsnym [The Spectre of Bankruptcy Hangs over the Meat Market]. 2010. Available online: http://www.parkiet.com/artykul/894003.html (accessed on 1 November 2021).
- Bereżnicka, J.; Pawlonek, T. Optimum kapitałowe w ocenie rentowności wybranych przedsiębiorstw w branży mięsnej [Capital optimum in the assessment of profitability of selected companies in the meat industry]. Zagadnienia Ekon. Rolnej [Probl. Agric. Econ.] 2014, 3, 136–153. [Google Scholar]


| Number | Specification | 2010 | 2011 | 2012 | 2013 | 2014 | 2015 | 2016 | 2017 | 2018 | 2019 |
|---|---|---|---|---|---|---|---|---|---|---|---|
| 1. | Net revenues from the sale of products, goods, and materials (million PLN) | 31,404 | 32,986 | 41,728 | 44,862 | 44,675 | 46,189 | 49,951 | 57,825 | 54,474 | 59,381 |
| 2. | Net profit (million PLN) | 1029 | 680 | 891 | 963 | 1389 | 1447 | 1267 | 1763 | 1762 | 1351 |
| 3. (a) (b) (c) | Return on total revenues (%) - Gross | 3.76 | 2.29 | 2.45 | 2.36 | 3.35 | 3.40 | 2.86 | 3.41 | 3.54 | 2.61 |
| - Net | 3.25 | 1.95 | 2.12 | 2.05 | 2.98 | 3.01 | 2.45 | 3.07 | 3.14 | 2.21 | |
| - Capital accumulation * | 5.31 | 3.80 | 3.74 | 3.69 | 4.69 | 4.80 | 4.21 | 4.71 | 4.83 | 3.87 | |
| 4. | Equity | 6153 | 6200 | 6709 | 7487 | 8611 | 9648 | 9671 | 10,771 | 10,547 | 11,428 |
| 5. | Total debt | 6325 | 6827 | 8010 | 8475 | 9117 | 9955 | 11,256 | 12,398 | 13,415 | 14,398 |
| 6. | Current liquidity | 1.20 | 1.24 | 1.22 | 1.30 | 1.34 | 1.31 | 1.32 | 1.46 | 1.40 | 1.33 |
| 7. | Investment rate ** | 1.18 | 1.24 | 1.23 | 1.16 | 1.13 | 1.50 | 1.31 | 1.30 | 1.28 | 1.36 |
| 8. | Profitable companies (%) - Percentage of profitable companies | 86.9 | 77.3 | 81.3 | 84.1 | 87.3 | 89.0 | 82.2 | 85.3 | 87.8 | 83.1 |
| - Their share in industry revenue | 91.1 | 85.8 | 91.4 | 84.5 | 94.9 | 93.99 | 89.9 | 90.9 | 87.3 | 83.9 |
| Number | Specification | 2010 | 2011 | 2012 | 2013 | 2014 | 2015 | 2016 | 2017 | 2018 | 2019 |
|---|---|---|---|---|---|---|---|---|---|---|---|
| 1. | Net revenues from the sale of products, goods, and materials (million PLN) | 10,202 | 13,777 | 14,281 | 11,068 | 11,411 | 11,482 | 12,345 | 12,658 | 13,714 | 13,807 |
| 2. | Net profit (million PLN) | 193 | 204 | 180 | 160 | 314 | 235 | 280 | 304 | 455 | 268 |
| 3. (a) (b) (c) | Return on total revenues (%) - Gross | 2.05 | 1.44 | 1.13 | 1.26 | 2.91 | 2.37 | 2.53 | 2.55 | 3.60 | 2.25 |
| - Net | 1.77 | 1.25 | 1.05 | 1.06 | 2.61 | 2.02 | 2.23 | 2.35 | 3.22 | 1.89 | |
| - Capital accumulation * | 3.30 | 2.68 | 2.60 | 2.44 | 3.93 | 3.53 | 3.87 | 4.09 | 5.00 | 3.79 | |
| Cash flow (%) | 3.30 | 2.68 | 2.60 | 2.44 | 3.93 | 3.53 | 3.87 | 4.09 | 5.00 | 3.79 | |
| 4. | Current liquidity | 1.21 | 1.17 | 1.24 | 1.15 | 1.28 | 1.34 | 1.30 | 1.34 | 1.28 | 1.35 |
| 5. | Investment rate ** | 1.12 | 1.43 | 1.02 | 1.37 | 1.41 | 1.92 | 1.90 | 1.70 | 1.26 | 1.48 |
| 6. | Profitable companies (%) - Percentage of profitable companies | 89.4 | 81.3 | 77.6 | 83.1 | 90.7 | 89.3 | 83.6 | 85.5 | 86.1 | 86.7 |
| - Their share in industry revenues | 93.1 | 66.2 | 89.5 | 86.2 | 89.1 | 91.00 | 73.40 | 89.80 | 90.00 | 91.00 |
| Subject | Objects, Country, Time | Measurement Methods and Tools | Goal |
|---|---|---|---|
| Assessment off inancial efficiency | Database on enterprises operating in meat and poultry industries in Poland in 2010–2019 | Quantitative: indicator analysis, ANOVA analysis, and panel data Modeling | A comprehensive study on financial efficiency in terms of profitability in the meat and poultry industries |
| Specification of Indicators | Maximum Minus Difference | Maximum Plus Difference | Sample Mean | Standard Deviation | Critical Significance Level |
|---|---|---|---|---|---|
| Operating profitability (OP) | 0.153 | −0.101 | 1.9431 | 0.8017 | 0.200 ab |
| Return on total capital (ROI) | 0.201 | −0.205 | 16.6317 | 2.0534 | 0.002 a |
| Net sales profitability (NSP) | 0.153 | −0.095 | 1.6596 | 0.8571 | 0.200 ab |
| Return on assets (ROA) | 0.301 | −0.208 | 16.7096 | 16.4395 | 0.002 a |
| Return on equity (ROE) | 0.206 | −0.165 | 21.7555 | 19.9371 | 0.134 a |
| Years | 2010 | 2011 | 2012 | 2013 | 2014 | 2015 | 2016 | 2017 | 2018 | 2019 | Volatility Measures | ||
|---|---|---|---|---|---|---|---|---|---|---|---|---|---|
| Average Value for 2010–2019 | SD | Coefficient of Variation (%) | |||||||||||
| Slaughterhouses (n = 55) | |||||||||||||
| Return on equity (ROE) % | 14.20 | 14.21 | 14.91 | 14.38 | 14.41 | 22.20 | 15.56 | 15.50 | 15.60 | 15.94 | 15.69 | 2.38 | 6.60 |
| Net return on sales (NRS) % | 1.79 | 1.82 | 1.85 | 1.96 | 2.61 | 3.26 | 2.23 | 2.18 | 2.36 | 3.12 | 2.17 | 0.43 | 5.11 |
| Operating profitability (OP) | 2.50 | 2.52 | 2.54 | 2.89 | 2.90 | 3.95 | 2.81 | 2.80 | 2.84 | 2.90 | 2.87 | 0.41 | 6.91 |
| Meat enterprises (n = 545) | |||||||||||||
| Large meat enterprises (n = 35) | |||||||||||||
| Return on equity (ROE) % | 12.10 | 13.12 | 13.89 | 17.36 | 17.35 | 10.56 | 10.62 | 13.19 | 12.67 | 12.40 | 13.33 | 2.37 | 5.62 |
| Net return on sales (NRS) % | 1.54 | 1.25 | 1.56 | 2.15 | 3.28 | 2.63 | 2.23 | 2.91 | 3.11 | 3.31 | 2.05 | 0.55 | 3.72 |
| Operating profitability (OP) | 2.24 | 2.26 | 2.27 | 2.31 | 2.20 | 2.68 | 3.81 | 3.13 | 3.42 | 2.82 | 2.71 | 0.57 | 4.75 |
| Medium-sized meat enterprises (n = 295) | |||||||||||||
| Return on equity (ROE) % | 17.60 | 17.41 | 14.98 | 14.78 | 18.10 | 19.90 | 17.64 | 17.40 | 17.50 | 17.70 | 17.30 | 1.47 | 11.74 |
| Net return on sales (NRS) % | 3.42 | 1.95 | 2.07 | 2.91 | 4.20 | 3.46 | 3.17 | 3.50 | 3.59 | 3.67 | 3.20 | 0.53 | 5.99 |
| Operating profitability (OP) | 4.04 | 4.97 | 2.67 | 3.76 | 3.54 | 4.05 | 3.84 | 3.84 | 3.82 | 3.84 | 0.59 | 6.45 | |
| Small meat enterprises (n = 267) | |||||||||||||
| Return on equity (ROE) % | 1.14 | 1.62 | 1.82 | 2.48 | 3.33 | 7.13 | 1.81 | 2.67 | 2.47 | 2.41 | 2.69 | 1.68 | 1.60 |
| Net return on sales (NRS) % | 2.10 | 1.77 | 1.07 | 1.83 | |4.18| | 2.05 | 3.59 | 2.06 | 1.06 | 0.98 | 2.30 | 0.90 | 2.55 |
| Operating profitability (OP) | 2.49 | 2.50 | 2.52 | 3.44 | 1.63 | 4.88 | 2.91 | 2.91 | 3.01 | 3.08 | 2.94 | 0.84 | 3.50 |
| Poultry meat enterprises (n = 56) | |||||||||||||
| Return on equity (ROE) % | 13.20 | 13.40 | 14.08 | 13.60 | 8.65 | 11.04 | 12.33 | 12.20 | 12.01 | 11.80 | 12.23 | 1.57 | 7.81 |
| Net return on sales (NRS) % | 1.23 | 1.63 | 1.83 | 1.63 | 2.61 | 2.18 | 2.56 | 1.80 | 2.51 | 2.63 | 1.79 | 0.38 | 4.77 |
| Operating profitability (OP) | 2.50 | 2.64 | 2.52 | 2.54 | 2.79 | 2.51 | 2.97 | 2.63 | 2.42 | 2.21 | 2.57 | 0.21 | 12.51 |
| Meat trading enterprises (n = 50) | |||||||||||||
| Return on equity (ROE) % | 18.76 | 18.77 | 18.78 | 17.56 | 19.54 | 19.70 | 16.16 | 18.47 | 17.71 | 16.67 | 18.21 | 1.17 | 15.61 |
| Net return on sales (NRS) % | 1.86 | 1.87 | 1.89 | 2.01 | 2.02 | 3.07 | 2.91 | 3.20 | 3.46 | 3.68 | 2.28 | 0.46 | 4.98 |
| Operating profitability (OP) | 2.44 | 2.45 | 2.47 | 2.62 | 3.21 | 3.56 | 2.39 | 2.73 | 2.64 | 2.44 | 2.70 | 0.39 | 6.94 |
| Model 1: Panel Data Estimation—758 Observations Time Series Length: Minimum 3, Maximum 5 Robust Standard Errors (Robust HAC) | ||||
|---|---|---|---|---|
| Variables | Coefficient | Standard Error | Z | Critical Significance Level |
| Const | 36.2469 | 6.522051 | 5.56 | <0.000 |
| Slaughterhouses | −11.50156 | 7.878275 | −1.46 | <0.144 |
| Meat enterprises | −9.53371 | 6.74018 | −1.41 | <0.157 |
| Poultry meat enterprises | −18.62808 | 7.990935 | −2.33 | <0.020 |
| Test: Chi-Square (2) = 6.02; Critical significance level = 0.1107 | ||||
| Interpretation of the model | The value of ROE was significantly lower by 18,628 (p-value = 0.020) in poultry meat enterprises than in other groups of enterprises. For the zero-one variable analyses, meat and meat product traders were the base variable and are not included in the outcome Table 4, Table 5 and Table 6 | |||
| Conclusions | There were statistically significant differences in the level of obtained values for the ROE ratio by groups of meat industry enterprises. | |||
| Hypothesis H1 | Each type of tested profitability differentiates financial efficiency | |||
| Decision on H1 | Reject H1 | |||
| Summary | Profitability measured by the value of ROE differentiated the group of meat enterprises. The obtained estimation results did not confirm hypothesis H1, because the ROE value significantly differentiated only poultry meat enterprises. The results of the model may complement H1 by fulfilling a cognitive function. | |||
| Model 2: Panel Data Estimation—758 Observations Time Series Length: Minimum 3, Maximum 5 Robust Standard Errors (Robust HAC) | ||||
|---|---|---|---|---|
| Variables | Coefficient | Standard Error | Z | Critical Significance Level |
| Const | 5.059239 | 1.119018 | 4.52 | <0.000 |
| Slaughterhouses | −2.782779 | 1.351669 | −2.06 | <0.040 |
| Meat enterprises | −0.6000481 | 1.156463 | −0.52 | <0.604 |
| Poultry meat enterprises | −2.752528 | 1.37098 | −2.01 | <0.045 |
| Test: Chi-Square (2) = 13.09; Critical significance level = 0.0044 | ||||
| Interpretation of the model | The value of the NRS was significantly lower by 2.782 (critical level of significance = 0.040) in slaughterhouses, and by 2.752 (critical level of significance = 0.045) in poultry processing enterprises than in meat enterprises and trade and service meat enterprises. | |||
| Conclusions | There were statistically significant differences in the level of obtained values of the net sales profitability ratio in slaughterhouses and poultry meat enterprises. | |||
| Hypothesis H1 | Each type of tested profitability differentiated financial efficiency. | |||
| Decision on H1 | Do not reject H1 | |||
| Summary | Profitability measured by the value of the NRS differentiated the group of meat enterprises. The obtained estimation results confirmed hypothesis H1, because the value of the NRS ratio significantly differentiated both slaughterhouses and poultry meat enterprises. | |||
| Model 3: Panel Data Estimation—758 Observations Time Series Length: Minimum 3, Maximum 5 Robust Standard Errors (Robust HAC) | ||||
|---|---|---|---|---|
| Variables | Coefficient | Standard Error | Z | Critical Significance Level |
| Const | 2.646011 | 0.8977534 | 2.95 | <0.003 |
| Slaughterhouses | 0.1182097 | 1.242771 | 0.10 | <0.924 |
| Meat enterprises | 2.583077 | 0.9568674 | 2.70 | <0.007 |
| Meat trade enterprises | 2.908654 | 1.554172 | 1.87 | 0.061 |
| Test: Chi-Square (2) = 13.31; Critical significance level = 0.0040 | ||||
| Interpretation of the model | The value of the OP ratio was significantly higher by 2.583 (critical level of significance = 0.007) in meat enterprises than in slaughterhouses and poultry processing enterprises. | |||
| Conclusions | There were statistically significant differences in the level of the obtained value of the OP ratio in meat enterprises rather than in slaughterhouses and poultry meat enterprises. | |||
| Hypothesis H1 | Each type of tested profit abilities differentiated financial efficiency. | |||
| Decision on H1 | Reject H1 | |||
| Summary | Profitability measured by the value of the OP ratio differentiated groups of meat enterprises. The obtained estimation results did not confirm hypothesis H1, because the value of the OP ratio significantly differentiated only meat enterprises. The results of the model may complement H1 by fulfilling a cognitive function | |||
Publisher’s Note: MDPI stays neutral with regard to jurisdictional claims in published maps and institutional affiliations. |
© 2021 by the authors. Licensee MDPI, Basel, Switzerland. This article is an open access article distributed under the terms and conditions of the Creative Commons Attribution (CC BY) license (https://creativecommons.org/licenses/by/4.0/).
Share and Cite
Zielińska-Chmielewska, A.; Kaźmierczyk, J.; Jaźwiński, I. Quantitative Research on Profitability Measures in the Polish Meat and Poultry Industries. Agronomy 2022, 12, 92. https://doi.org/10.3390/agronomy12010092
Zielińska-Chmielewska A, Kaźmierczyk J, Jaźwiński I. Quantitative Research on Profitability Measures in the Polish Meat and Poultry Industries. Agronomy. 2022; 12(1):92. https://doi.org/10.3390/agronomy12010092
Chicago/Turabian StyleZielińska-Chmielewska, Anna, Jerzy Kaźmierczyk, and Ireneusz Jaźwiński. 2022. "Quantitative Research on Profitability Measures in the Polish Meat and Poultry Industries" Agronomy 12, no. 1: 92. https://doi.org/10.3390/agronomy12010092