Article

Varying Effects of Organic Waste Products on Yields of Market Garden Crops in a 4-Year Field Experiment under Tropical Conditions

1
CIRAD, UPR Recyclage et Risque, LMI IESOL, Dakar 18524, Senegal
2
UCAD, FST, Département de Biologie Animale, Dakar-Fann 16180, Senegal
3
CIRAD, UPR Recyclage et Risque, 34398 Montpellier, France
4
Recyclage et Risque, Univ Montpellier, CIRAD, 34398 Montpellier, France
*
Author to whom correspondence should be addressed.
Agronomy 2022, 12(1), 32; https://doi.org/10.3390/agronomy12010032
Submission received: 20 November 2021 / Revised: 16 December 2021 / Accepted: 21 December 2021 / Published: 24 December 2021

Abstract

:
Controlling organic and mineral fertilisation is a major concern in tropical environments. An experiment was conducted on an arenosol in the Dakar region, the main market gardening area of Senegal, to evaluate treatments commonly used by farmers. Seven treatments were repeated three times: A mineral fertilisation (MF) treatment based on N-P2O5-K2O (10-10-20), and three organic treatments at two doses (dried sewage sludge (SS), poultry litter (PL) and a digestate from an anaerobic digestion (AD) of cow manures). Each of the organic treatments were supplemented with a normal dose (1) and a double dose (2) of mineral N and K fertiliser. A lettuce, carrot and tomato rotation was grown in four campaigns (2016–2020) on all of the plots. Yields of all three crops in all of the organic treatments were statistically similar (p > 0.05) to the MF in all four campaigns, except for the yield of the lettuce crop under treatment PL-2 in campaigns 2 and 3. The tomato yields were statistically similar under all of the organic treatments in all four campaigns. In contrast, the yields of the lettuce and carrot crops differed statistically from each other and under the different organic treatments in all four campaigns. The yields of all three crops differed in the campaigns with the fertilisation treatment. In each campaign, the yields of each crop were not correlated with the total amounts of N, P and K applied. These differences or similarities in yields are explained by the nature of the organic waste products, the accumulation of nutrients after several applications, the type of crop and interannual differences in temperature.

1. Introduction

Recycling organic waste products (OWPs) in agriculture sustains the ecosystem services provided by soils and achieves yields at least equivalent to those obtained with mineral fertilisers [1]. Crop yields obtained with OWPs are frequently compared to those obtained with mineral fertilisers [2,3]. However, the variability of the OWPs studied, the doses applied, the application frequencies, the types of crops and the changes the OWPs undergo in the soil produce contrasting results. Most authors studied the immediate effects of OWPs and their residual effects on yields by adding them only once at the start of the experiment in (i) trials with unbalanced N, P and K, compared to mineral fertiliser (ii) tests with balanced N or P, (iii) tests with balanced N and P or balanced P and K and tests with balanced N, P and K [2,4,5]. Other authors demonstrated the effects of the repeated application of OWPs on yield usually with one or two applications per year, most often on field crops in monoculture or in rotation with two or three plant species [6,7,8,9]. However, few studies have evaluated the effects of OWPs in intensive systems with regular applications, particularly vegetable crops over a period of several years. Although using OWPs is widely reported to increase crop yields, few studies have investigated if the effect of regular applications of OWPs improves yields in tropical conditions [3,7].
OWPs are an appropriate alternative for use in sustainable agriculture when the cost of mineral fertilisation is high or its efficiency is low, especially in tropical contexts [4,5,10]. However, OWPs are less easy to use than mineral fertilisers because their nitrogen, phosphorus and potassium contents vary in the same OWP and between OWPs [11], and their balance does not necessarily match crop needs.
In sub-Saharan Africa, the agronomic characteristics of OWPs are rarely measured and are often not known by farmers. Determining the appropriate doses of OWP for crop fertilisation is thus a major challenge in agro-ecological production systems. The N, P and K fertilisation values of OWP are determined according to their total content and in the case of N and P, the proportions in organic and mineral form. However, the proportions of N and P in the organic fraction available to the plant depend on the mineralisation of OWP in the soil. Complete mineralisation of organic N from OWP can take several years and varies according to the characteristics and type of OWP, soil properties, cultivation practices and climatic conditions [12,13]. Therefore, nutrients may be available only after the end of the crop cycle for which the OWP was intended, especially in the case of short cycle crops.
Combining chemical fertilisers with OWPs simultaneously increases mineralisation of nitrogen in the OWPs and the immobilisation of nitrogen fertiliser in soil aggregates [13]. The practice of combining mineral and organic fertilisers thus offers considerable advantage in tropical soils, which often have a low cation exchange capacity (CEC) due to low clay and organic matter contents [14]. Reduced tillage and crop rotation are also effective ways to manage soil nutrients to improve crop yields. However, when OWPs are applied regularly, the availability of OWP nutrients following the crop cycle for which it was applied and in subsequent years is unknown [5]. Indeed, when an OWP is added to the mineral and organic residues present in soils as a result of the previous application of OWP, the availability of mineral elements in the soil fluctuates over the crop cycles [15]. Thus, crop yields can change over the seasons following repeated applications of OWP, depending on the doses applied and the type of OWP. In the case of nutrient-demanding vegetable crops such as lettuce, tomato and carrot, a deficit of one of the essential mineral elements rapidly reduces yields [16,17]. Conversely, inputs of an OWP in excess of the crop requirements leads to contamination [18] and can reduce vegetable yields [19,20].
We grew three vegetable crops in rotation in four annual campaigns on an arenosol to assess the impact of different types of OWPs on yields during the crop cycle and after several years. The aim was to evaluate (i) whether the different organic fertilisation treatments produced similar yields and similar to those obtained with purely mineral fertilisation, and (ii) the impact of repeated applications of nutrients on cumulative yields after four years of cultivation.

2. Materials and Methods

2.1. Study Site

The experiment was conducted at the Senegalese Agricultural Research Institute (Institut Sénégalais de Recherche Agricole, ISRA) experimental station in Sangalkam in the region of Dakar, the capital city of Senegal (14°47′34′′ N and 17°13′30′′ W), at the southern end of the Niayes area, the main market gardening production basin in Senegal. The soil is an arenosol [21] formed from quaternary dune sands and similar to the sandy soils of the Niayes zone, slightly acidic and poor in organic matter, nitrogen and phosphorus (Table 1). The surface horizon has a C/N ratio of 13 and a CEC of 9.6 cmol(+)·kg−1 dominated by Ca and Mg. The bulk density is 1.3 kg·dm−3.

2.2. Physical and Chemical Parameters

The methods used to measure the physical and chemical parameters are referenced in [22]. The soils to be analysed were sampled in the 0–20 and 20–40 cm depth layers (Table 1) using a gouge auger. The bulk density was measured using the sand method (NF X 31-503). The particle size and chemical properties were measured after sieving to 2 mm by the IRD IMAGO Unit in Dakar. For the particle size study, five soil fractions were measured using the Robinson pipette method [23]. The pH of the soil water was measured with a soil-distilled water ratio of 1/2.5 and the KCl pH was measured by adding 3.8 g of KCl in the same solution (NF ISO 10390). The total carbon and nitrogen were measured using an elementary AutoAnalyzer (Technicon) according to the NF ISO 10,694 and NF ISO 13,878 standards, respectively. The organic carbon was measured according to the NF ISO 14,235 standard. Forms of mineral nitrogen (N-NO3, N-NH4) were extracted with a 1M KCl solution and assayed by colourimetry (Griess and Nessler methods). The assimilable phosphorus was determined by the modified Olsen–Dabin method. The cationic exchange capacity (CEC) of the soils was measured by extraction with ammonium acetate (NF X 31-108). Exchangeable calcium, magnesium, sodium and potassium were extracted with ammonium acetate (NF X 31-108) and measured by colourimetric assay according to the NF X 31–130 standard.

2.3. Experimental Design

The experiment consisted of 21 square plots whose sides measured 8 metres. To reproduce the same growing conditions as on local farms, each plot consisted of six bands 1 m wide and 8 m long (i.e., 6 × 8 m2 cultivated area per plot) spaced at 0.4 m intervals. The 21 plots represented a randomized design of seven treatments each repeated three times:
MF: mineral fertilisation treatment based on N-P2O5-K2O (10-10-20) with added mineral N (a form of urea) and K (a form of potassium sulphate);
Sewage sludge (SS)-1: dried sewage sludge with added mineral N and K;
SS-2: double the SS-1 dose;
Poultry litter (PL)-1: poultry litter with added mineral N and K;
PL-2: double the PL-1 dose;
Anaerobic digestate (AD)-1: digestate from anaerobic digestion of cow manures with added mineral N and K;
AD-2: double the AD-1 dose.
These treatments were applied to the soil surface at each cycle and were never buried; no tillage was carried out. The MF treatment corresponded to that recommended by technical institutes in Senegal. Farmers in the Niayes region use mineral fertilisers alone sometimes but very frequently combined with these types of organic manures [3,12]. The quantities of nutrients they provide vary but are usually between doses 1 and 2 of the SS, PL and AD treatments (Table 2). The AD treatment could not be used on the lettuce and carrot crops in the first campaign due to non-availability. In addition, the digestate showed variable properties and was very often too liquid to provide nutrients in the desired quantities.
For each of the 21 plots, 18 soil samples were taken with a gouge auger and mixed for analysis. These samples were then immediately transported to the laboratory for drying and sieving.
The dry matter content of the OWP is calculated by the ratio: dry matter mass/initial gross mass of the sample. The total nitrogen was determined with an elementary AutoAnalyzer according to NF ISO 10694 and NF ISO 13878. The total phosphorus was determined by automatic colourimetric determination with a hot attack by aqua regia (mixture of 10 mL HCl and 5 mL HNO3) for five hours in a microwave oven (Murphey and Riley method). Potassium was measured by ammonium acetate extraction (NF X 31-108).

2.4. Plant Materials and Application of Treatments

The market garden crops were cultivated identically on all of the plots from February 2016 to March 2020. One rotation of lettuce, carrot and tomato each year corresponded to one cropping campaign. Thus, four campaigns were conducted over the course of the whole experiment. The lettuce and tomato plants were sown in a nursery and transplanted to the experimental plots 25 days after sowing. The carrot seeds were sown directly in the plots after opening the furrows. One month after the carrot seeds were sown, thinning was carried out to correct possible heterogeneities.
Irrigation was carried out daily at a rate of four watering cans (total 44 L) per band (8 m2) for all of the crops. Weeding and hoeing was carried out regularly for each crop. No pesticides were applied to the crops during the cycles.
The MF mineral treatment was applied in two stages to minimise nitrogen losses through volatilisation. Half the crop N, P and K requirements (Table 2) were applied just after the lettuce or tomato plants were transplanted and the carrots were thinned. The other half was applied in the middle of the cycle of the corresponding crop. This mineral treatment consisted of a 10N/10P/20K fertiliser and supplements of N in the form of urea and K in the form of potassium sulphate. The organic treatments were applied three days before the lettuce and tomato plantlets were transplanted or the carrot seeds were sown. Supplementary N with urea and K with potassium sulphate were also applied in the middle of the crop cycle in each organic treatment (Table 2).

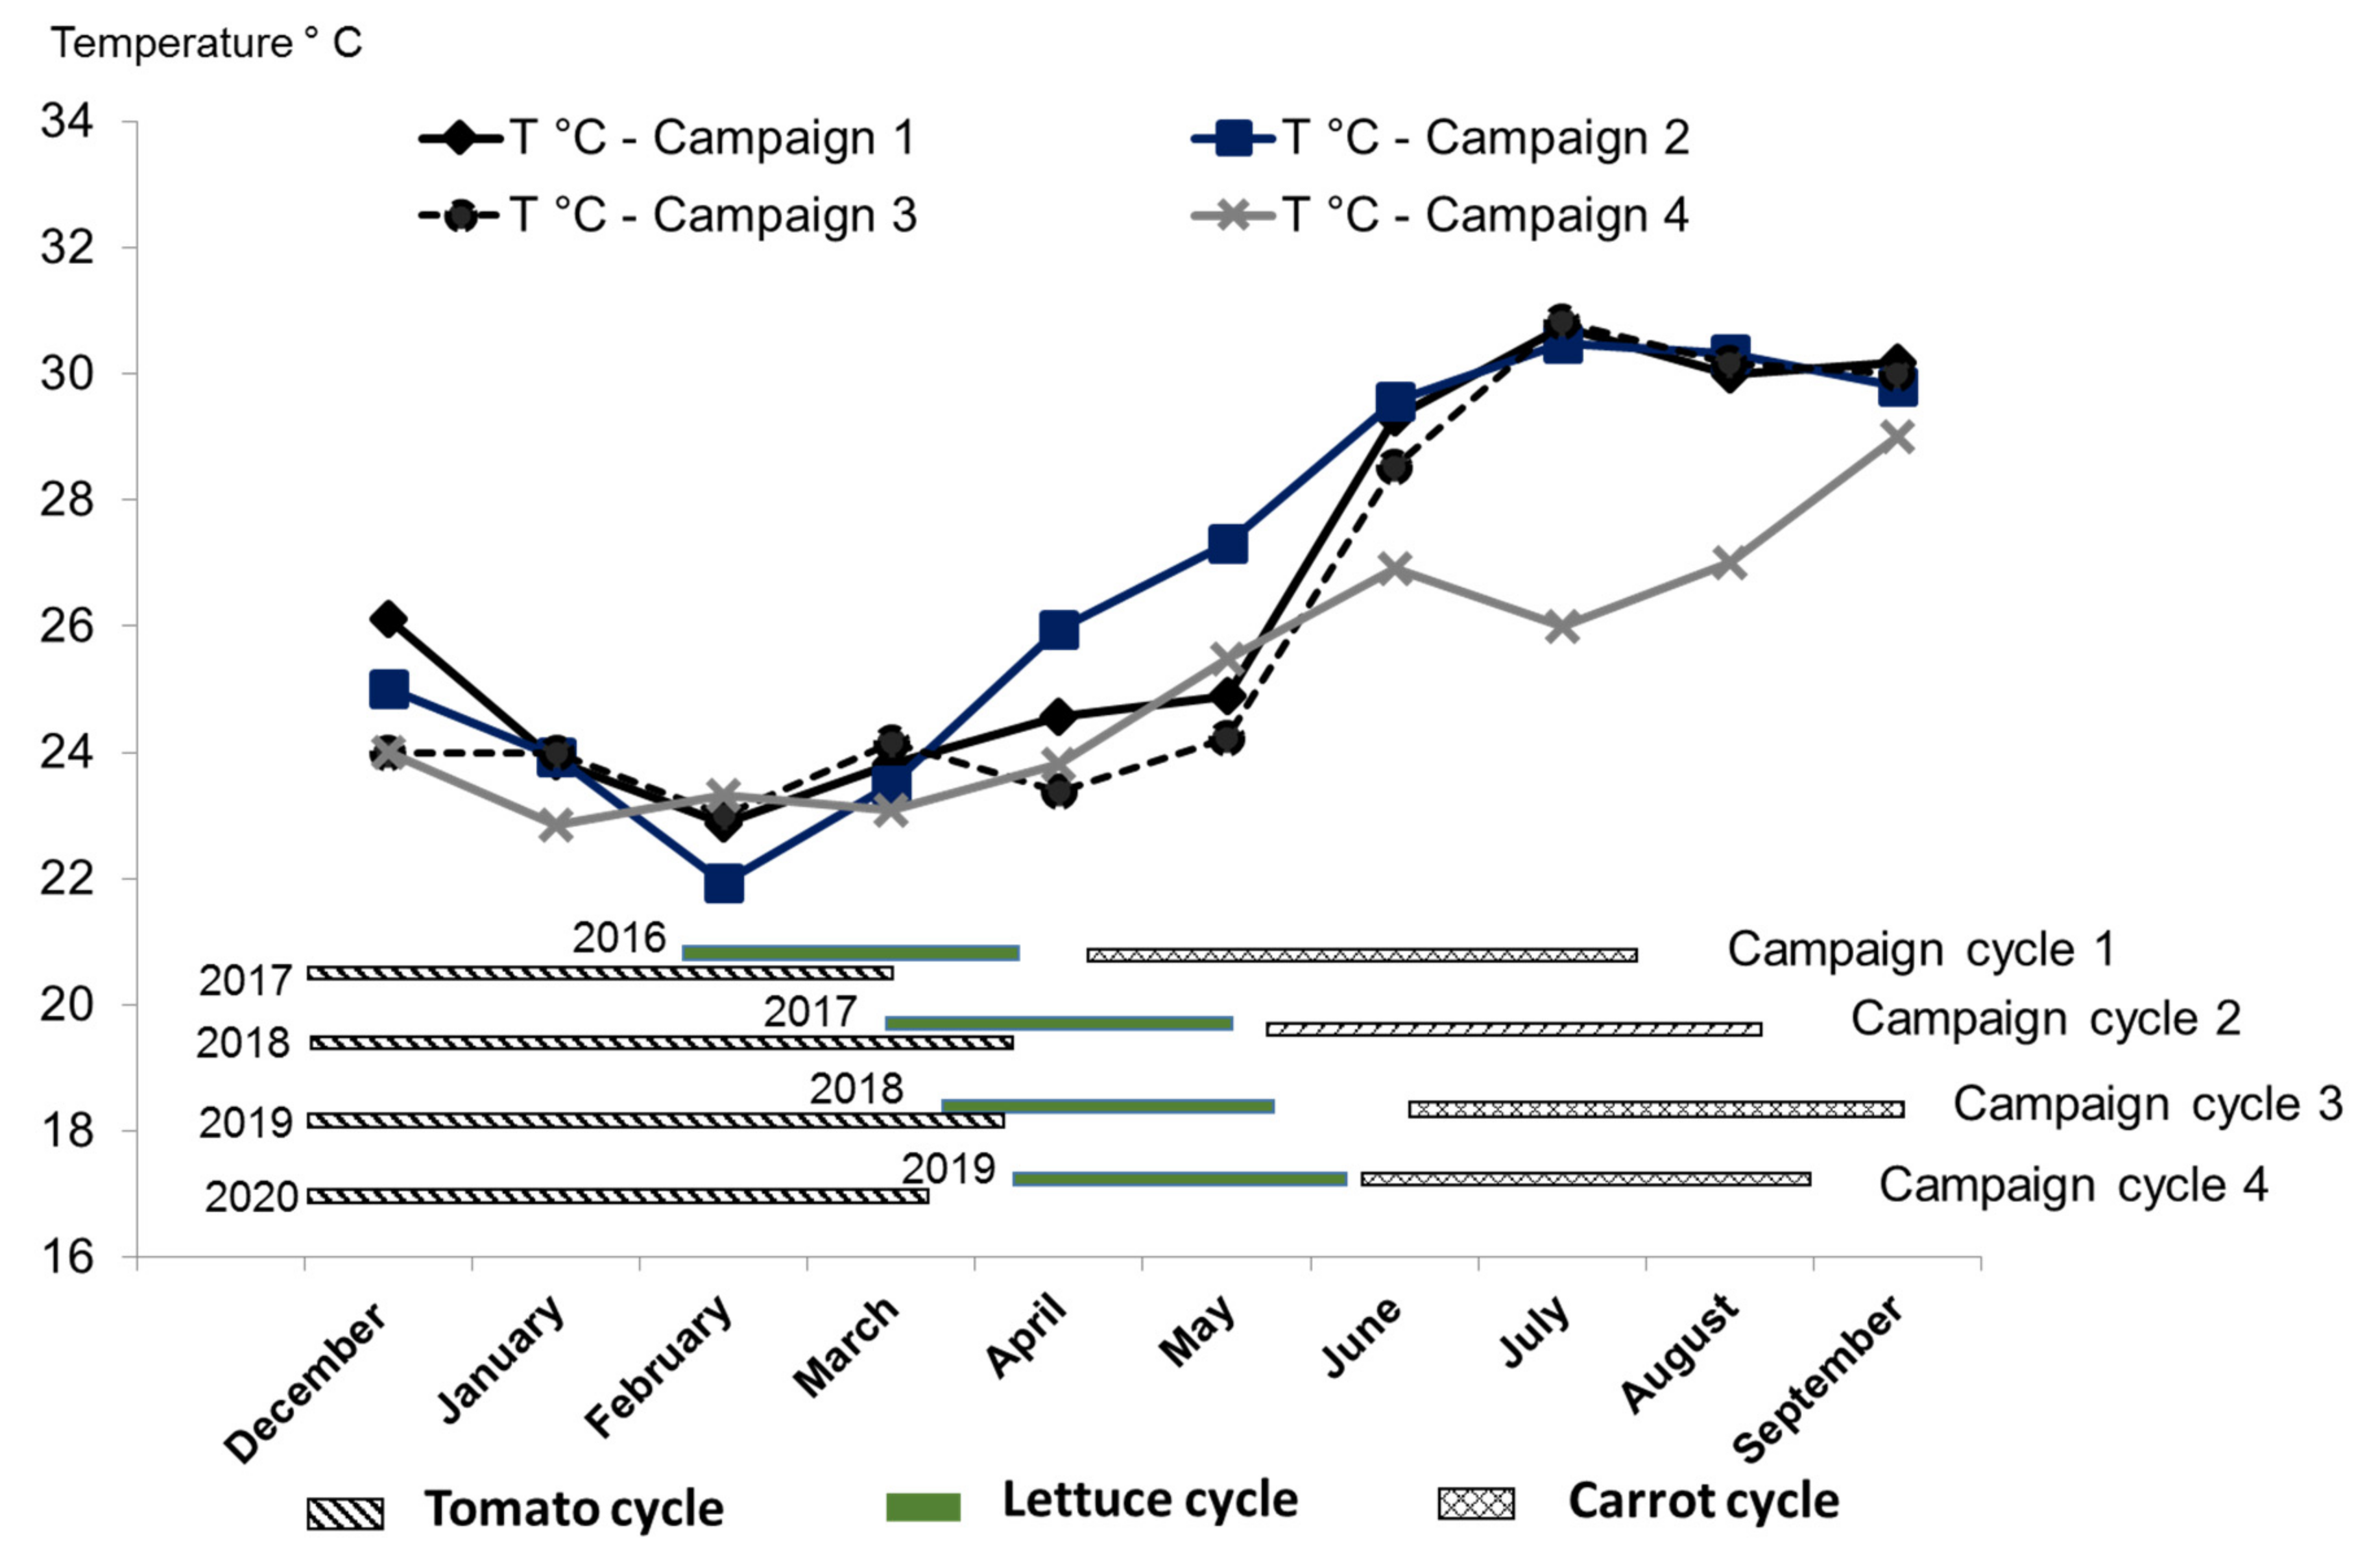
2.5. Cultivation Cycle and Climatic Data

The lettuce cycles all lasted 63 days and started between early February and mid-April (Table 3). The carrot cycles lasted from 85 to 100 days and started between the end of April and the end of June. The tomato cycles started between mid-November and the end of November and lasted from 113 to 127 days depending on the maturity of the fruits. The first fruits were harvested in February in campaigns 1, 3 and 4, i.e., respectively, 84, 100 and 89 days after sowing. In campaign 2, the first fruits were harvested in March, 96 days after sowing.
The temperatures were measured in the plot and monthly averages ranged from 21.9 °C in February 2017 to 30.8 °C in July 2018 (Figure 1). The maximum temperature differences between the campaigns were observed from April to August while for the months of December, February and March, the differences were one to two degrees between years. The rainfall data (Table 4) were extracted from the Geoportal weather forecast (https://retd1.teledetection.fr/climap/proj/; Last access 14 October 2021). Rainfall was only recorded from June to September in the four campaigns. The cumulative rainfall during these four months varied little and ranged from 373 to 412 mm.

2.6. Yield, Chemical Analysis of Plants and Statistical Analysis of Data

All the crops were harvested by hand. The leaves and roots of the lettuce and carrots were cut at the collar and the remaining biomass was weighed. The lettuce and carrots yields were calculated according to the planting density (10 lettuce plants per m2 and 56 carrot plants per m2) and the total biomass of the leaves and roots, respectively, according to the formula:
Yield (kg·m−2) = (total measured biomass (kg) × planting density)/number of plants harvested
Not all the tomato fruits were ripe at the same time. The tomato harvest was spread out over five weeks, with one harvest per week. At each harvest, deformed, rotten or attacked fruits were separated from intact fruits. The yields were calculated based on the total production (five harvests) of healthy fruit and the planting density (4 tomato plants per m2) using the same formula.
To evaluate the yield change rate (YCR) between campaigns, we used the following calculation (for example between campaign N and campaign N + 1):
YCR (%) = 100 × (yield campaign N + 1 − yield campaign N)/yield campaign N
After harvesting, a representative sample of 2 kg is taken for each plot. The lettuce, carrot and tomato samples were washed twice with fresh water to remove adhering soil particles and then twice with distilled water. They were then dried in an oven at 65 °C. The total nitrogen was determined by dry combustion (Dumas method).
Statistical analyses were performed using with XLstat version 2019.lnk. An analysis of variance (ANOVA) was applied to the yield data for each crop data on soil chemical parameters and total N content to test the effects of the treatments of campaigns and of their interaction (treatments * campaigns). The means of the levels of each factor were ranked using the Newman–Keuls test at the 5% probability level with a 95% confidence interval. The conditions for the application of ANOVA had previously been tested, in particular the normality of the distribution of the measured variables. A Pearson correlation test was performed to understand the variation in yields in relation to direct inputs of N, P and K provided by the treatments.

3. Results

3.1. Effects of Treatment Inputs on Soil Parameters after 4 Years of Cultivation

For the MF treatment, the soil pH decreased significantly, and it became more acidic at 0–20 and 20–40 cm depths in T4 (Table 5). The contents of exchangeable K increased significantly for 0–20 and 20–40 cm depths. The organic carbon content decreased by 20% and total nitrogen content by 25% in 0–20 cm depth (Table 5). For the SS-1 treatment, the measured soil parameters did not show significant differences. In contrast, for the SS-2 treatment, exchangeable Mg and K contents decreased by 1% and increased by 0.6%, respectively, at the 0–20 cm depth between T0 and T4. For the PL treatments, the soil pH significantly increased until it reached a near-neutral pH. Exchangeable K contents increased significantly for the 0–20 (PL-2) and 20–40 (PL-1) cm depths between T0 and T4. For the PL-2 treatment, exchangeable Ca content also grew at 0–20 cm depth. For the AD-1 treatment, organic carbon and total N contents decreased significantly at 0–20 cm depth between T0 and T4. In contrast, for the AD-2 treatment, only the total N content significantly decreased in the soil at the 0–20 cm level. For the AD-2 treatment, exchangeable K contents increased significant at 0–20 and 20–40 cm depths between T0 and T4.

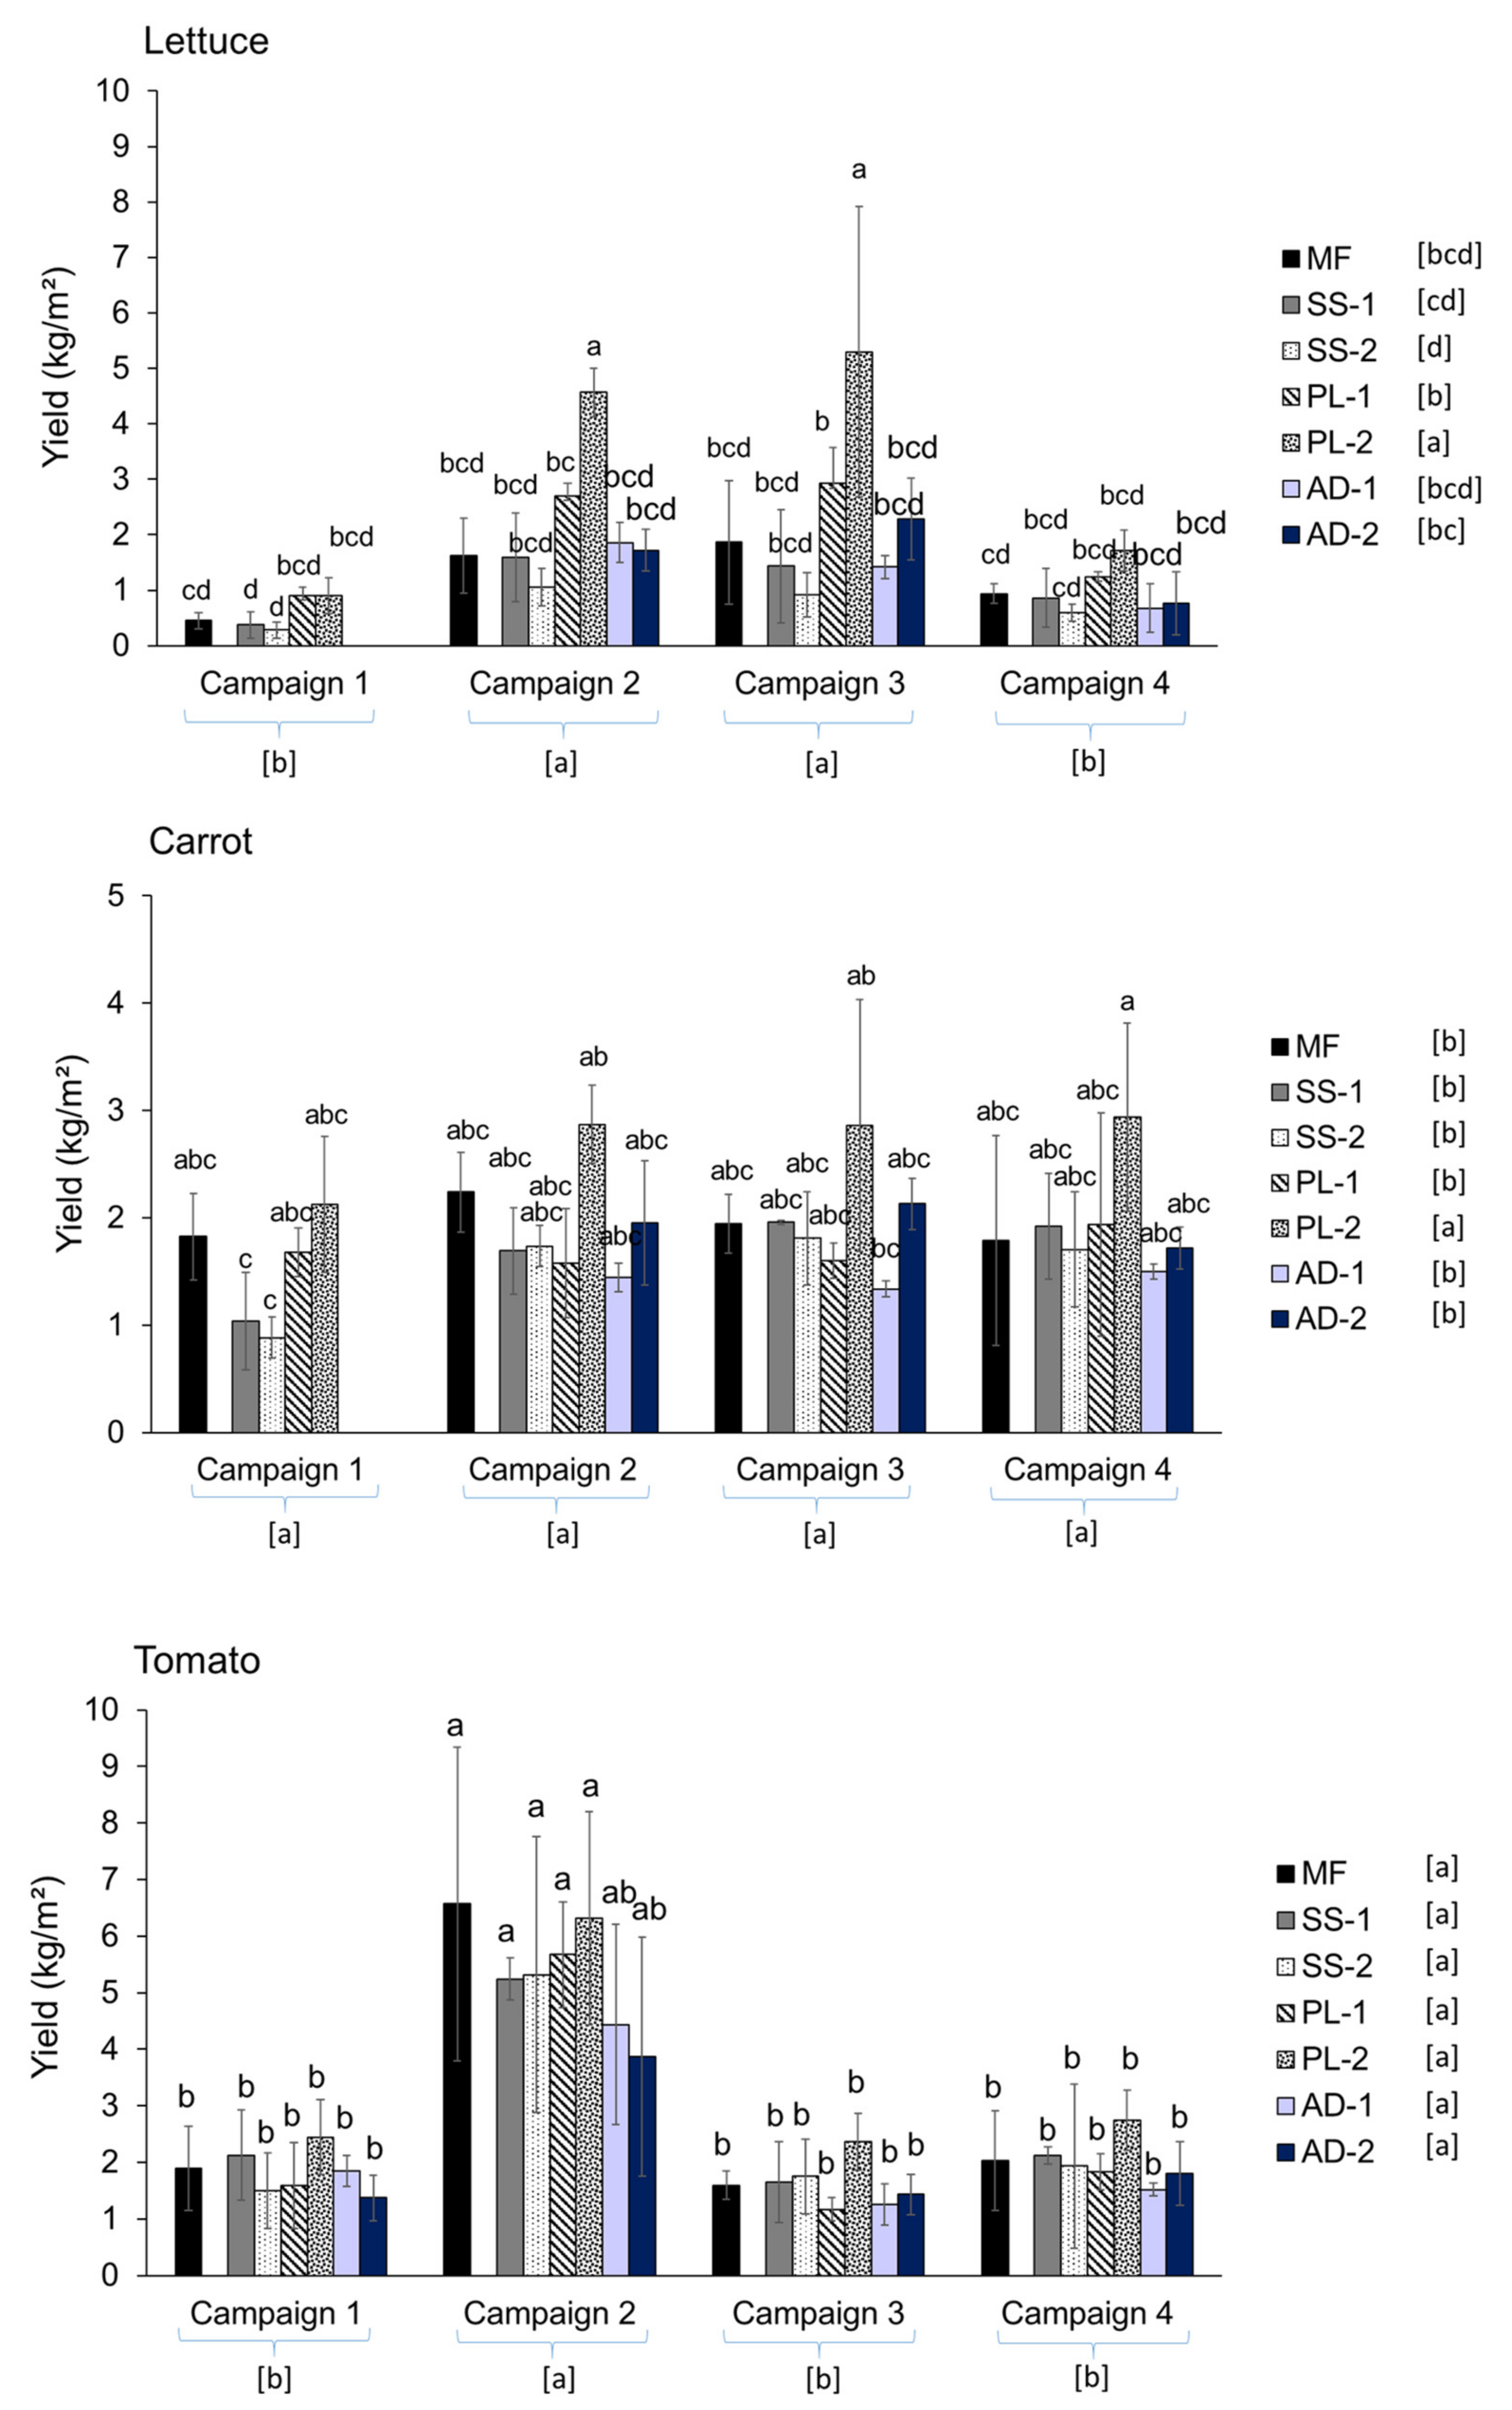
3.2. Effects of Treatment and Campaign Variables and Their Interaction on Crop Yields

The results of the statistical analyses showed that the variables treatment, campaign and their interaction (treatment*campaign) had significant effects in explaining the variability of lettuce (p < 0.0001), carrot (p = 0.001) and tomato (p < 0.0001) yields (Figure 2).
For lettuce crops, the effects of treatment and campaign variables (p < 0.0001) and their interaction (p = 0.003) were significant on yields. The effects of PL-2 * campaign 2 and PL-2 * campaign 3 interactions were significantly higher than other treatment*campaign interactions on lettuce yield. Yields in SS-1 * campaign 1 and SS-2 * campaign 1 were the lowest, with significant differences compared to lettuce yields in PL-1 * campaign 2 and PL-1 * campaign 3, and PL-2 * campaign 2 and PL-2 * campaign 3. Lettuce yields in treatments * campaign 1 and treatments * campaign 4 did not show significant differences between them. Thus, treatment PL-2 had a significantly higher effect on lettuce yields than the other treatments. The SS (1 and 2) treatments showed the lowest lettuce yields with significant differences compared to the PL (1 and 2) treatments. Lettuce yields in the MF treatment were similar to those in the AD-1, AD-2, SS-1, SS-2 and PL-1 treatments. The yields observed in campaigns 2 and 3 are significantly different from those observed in campaigns 1 and 4. There was no significant difference between the yields in campaigns 2 and 3, nor between those in campaigns 1 and 4.
For carrot crops, it was the treatment variable that showed a significant effect (p < 0.0001) in explaining yield variability, rather than the campaign variable (p = 0.052) and their interaction (p = 0.694). Carrot yields in PL-2 * campaign 2, PL-2 * campaign 3 and Pl-2 * campaign 4 were the highest with significant differences compared to carrot yields in SS-1 campaign 1 and SS-2 * campaign 2. No other significant differences were observed between treatment * campaign interactions. Thus, the PL-2 treatment had a significantly higher effect on carrot yields than the other treatments. The effects of treatments MF, AD-1, AD-2, SS-1, SS-2 and PL-1 were similar on carrot yields. Carrot yields between a campaign were not significantly different.
For tomato crops, it was the campaign variable that showed a significant effect (p < 0.0001) in explaining yield variability, rather than the treatment variable (p = 0.071) and their interaction (p = 0.97). Tomato yields in MF * campaign 2, PL-1 * campaign 2, PL-2 * campaign 2, SS-1 * campaign 2 and SS-2 * campaign 2 are significantly higher than tomato yields in treatments * campaigns 1, 3, and 4. Thus, there are no significant differences between treatment effects on tomato yield. The tomato yields in campaign 2 were significantly different from the other campaigns.
For each campaign, the yields of each crop were not correlated with the total amounts of N, P and K supplied by the OWP and mineral supplements (results not shown. Similarly, the cumulative yields after the four campaigns were not correlated with the cumulative amounts of N, P and K applied.

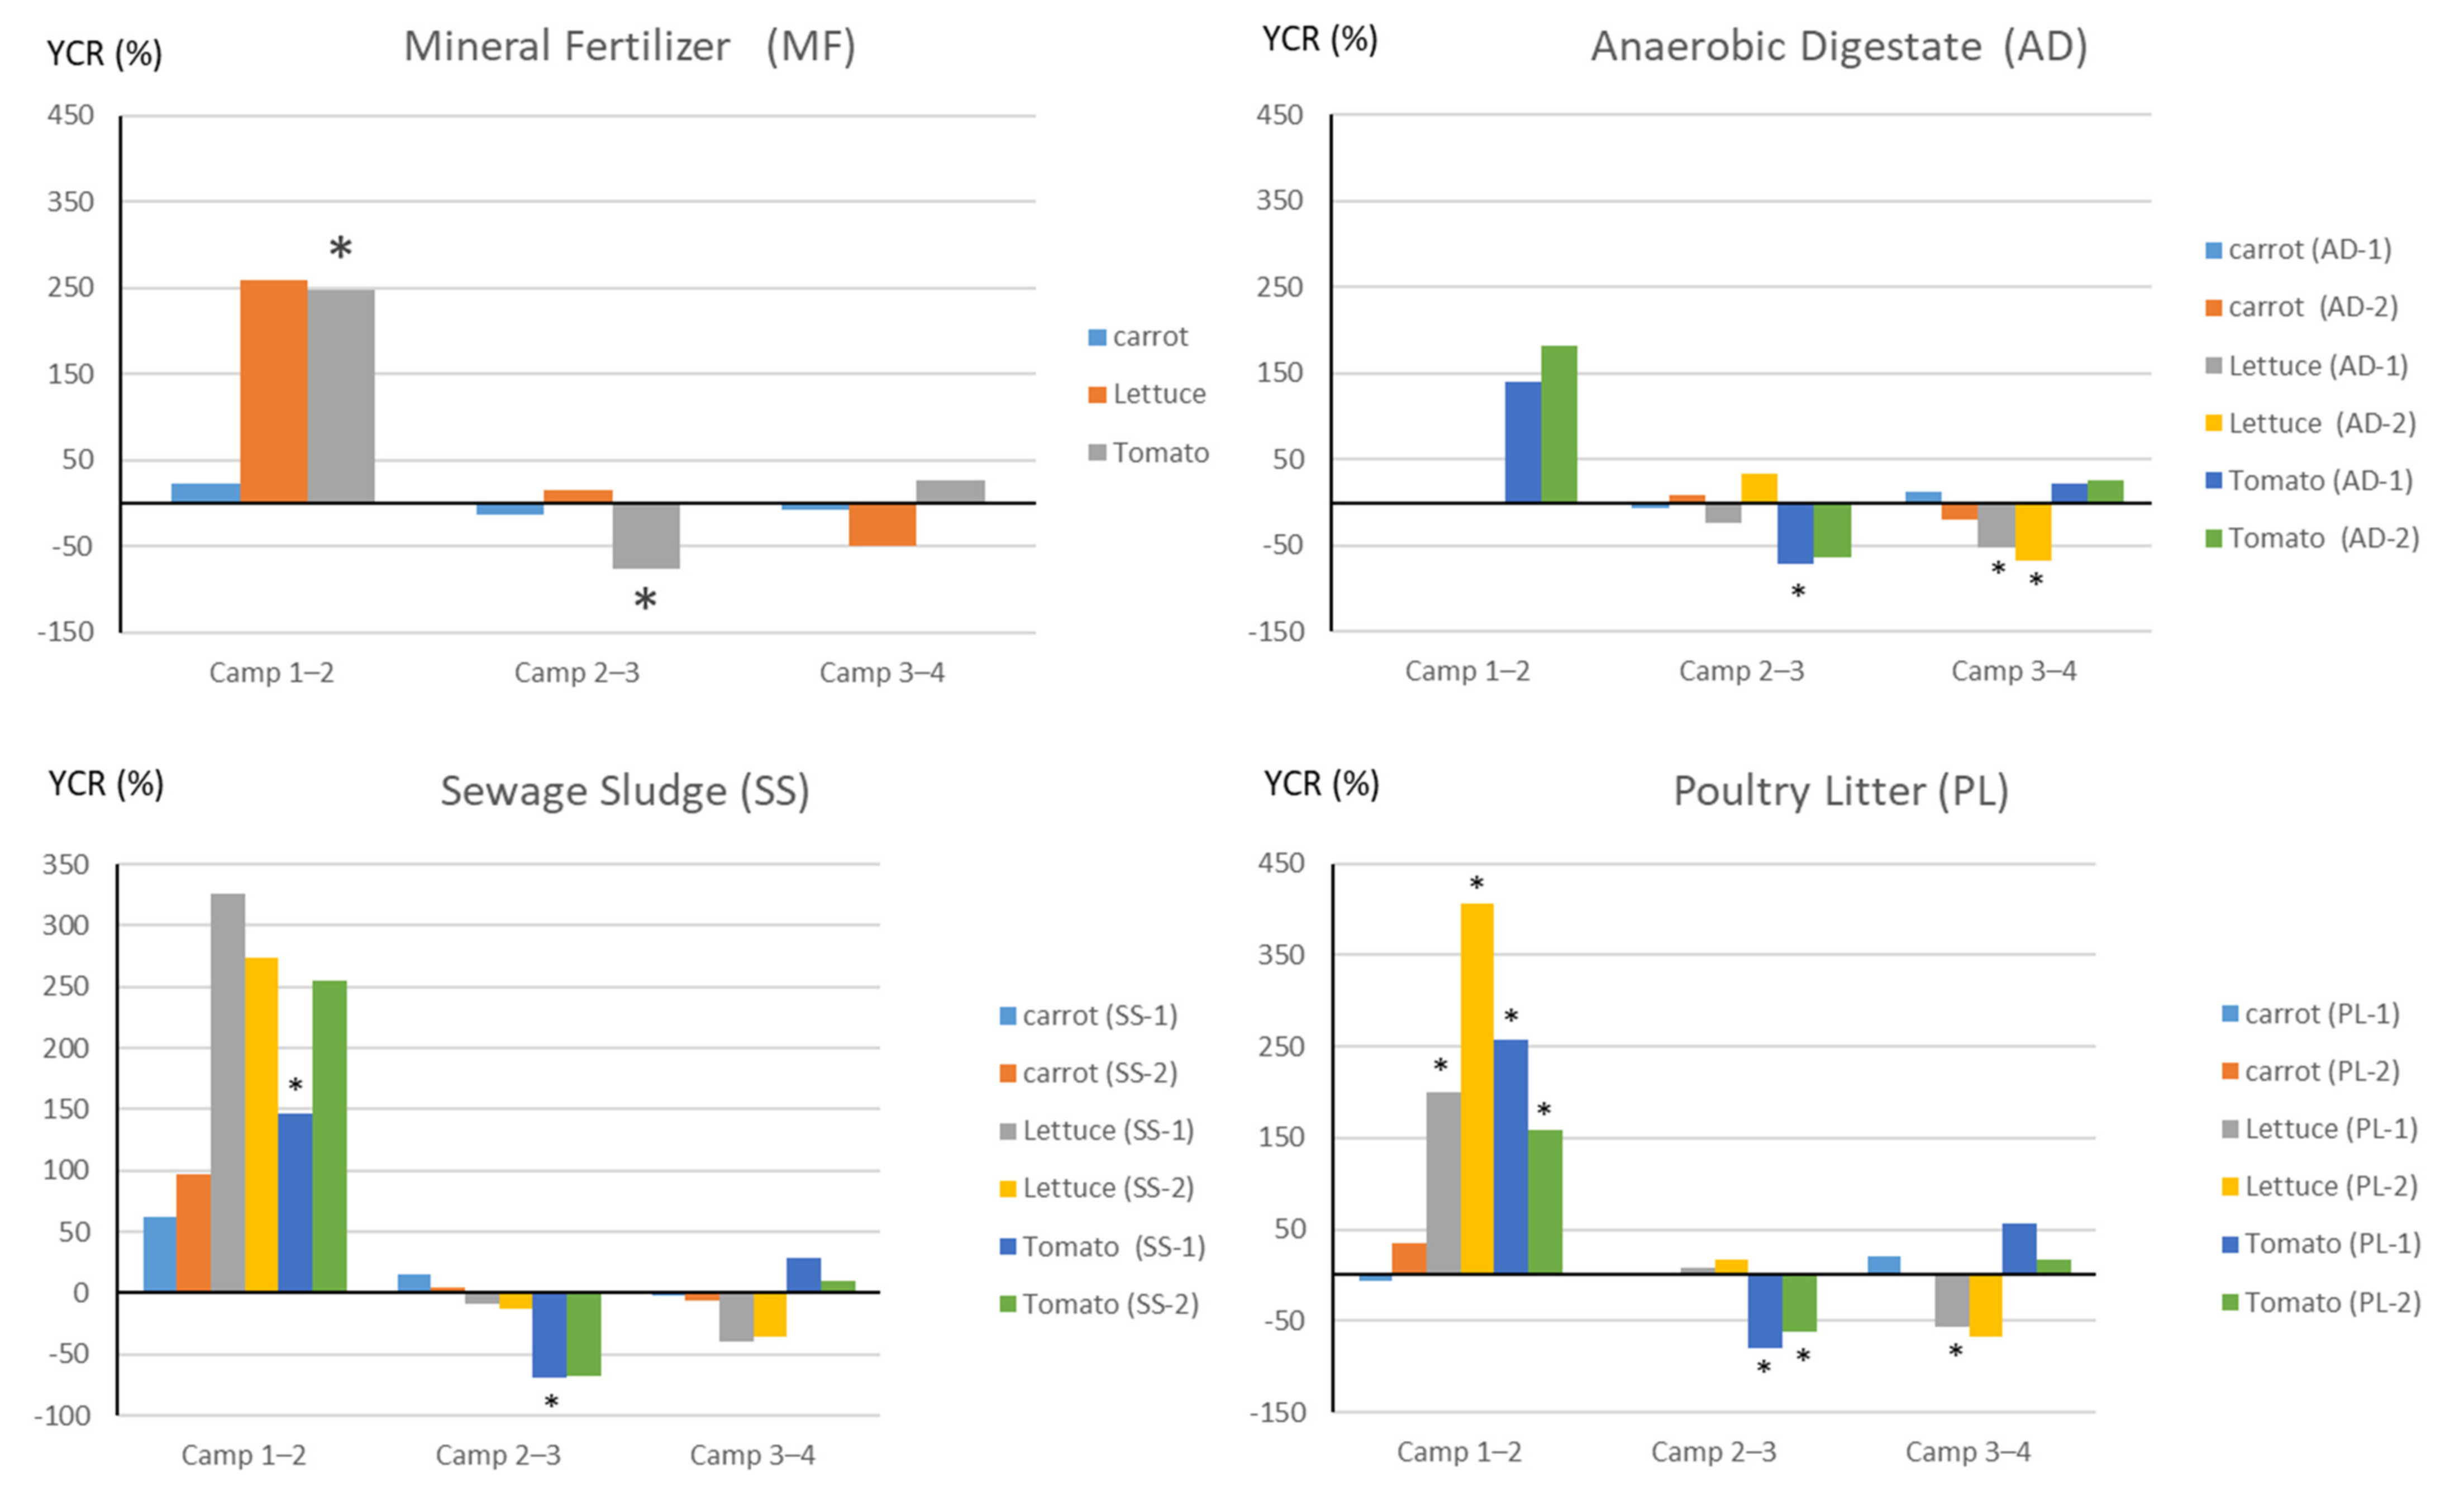
3.3. Changes in the Yields of the Three Crops over the Four Campaigns

The yields of all three crops obtained with each fertilisation treatment differed in the four campaigns (Figure 3). Lettuce yields increased between campaigns 1 and 2 with significant differences for treatment PL-1 (p = 0.003) and PL-2 (p = 0.048) treatments. Lettuce yield change rates (YCRs) were between 200 and 406%. No significant differences in lettuce yields were observed for all of the treatments (p > 0.05) between campaigns 2 and 3. Between campaigns 3 and 4, the lettuce YCRs decreased by −35 to −68% depending on the treatment, with significant differences for treatment AD-1, AD-2 and PL-1 treatments (p < 0.05). The yields of lettuce obtained with the PL-1 and PL-2 treatments in campaign 3 were significantly higher (p < 0.005) than those obtained in campaign 1. In contrast, no significant differences in lettuce yields were observed for all of the treatments between campaigns 1 and 4 (p > 0.05). Lettuce YCRs gradually decreased between campaigns 2, 3 and 4 under all of the treatments. Carrot yields did not vary significantly between campaigns 1, 2, 3 and 4 (p > 0.05). Carrot YCRs were low and varied with the treatment from campaign to campaign (−13 to +97%). Tomato yields increased between campaigns 1 and 2 under all of the treatments and differed significantly from the MF (p = 0.04), SS-1 (p = 0.01), AD-1 (p = 0.024) treatments, PL-1 (p = 0.0001) and PL-2 (p = 0.005). Tomato YCRs were between 147 and 258%. Between campaigns 2 and 3, tomato yields decreased under all of the treatments and YCRs differed significantly (p < 0.04) from the treatment (−76%), SS-1 (−69%) treatments, AD-1 (−72%), PL -1 (−79%) and PL-2 (−63%). Between campaigns 3 and 4, no significant differences in tomato yields were observed under all of the treatments (p > 0.05). The tomato yields in campaign 1 and campaigns 3 and 4 were statistically similar (p > 0.05).

3.4. Evolution of Nitrogen Concentrations in Vegetables during the Campaigns in the Different Treatments Applied

After the first campaign, for lettuce, the mean total N contents decreased significantly for the MF, SS-1, SS-2, PL-1 and PL-2 treatments (Table 6). For the carrot crop, the total N contents decreased for the PL-1 treatment between campaigns 1 and 2 and increased for the AD treatments between campaigns 2 and 3. For tomatoes, there were no significant differences between campaigns 1 and 2.

4. Discussion

4.1. Effects of High Doses of OWP and Mineral Supplementation on Yields

Crop yields did not systematically increase with high doses of OWP applied. After several cycles (campaigns 2 and 3), only the lettuce yields of the PL-2 (poultry litter) treatment (10 t·ha−1) were higher than those of the mineral fertilisation treatment. This is because the total amount of N available in organic treatments depends on (i) the amount of mineral N initially present in the OWP that is potentially more rapidly available, and (ii) the rate of mineralisation of organic N present in the soil and that supplied by the OWP [9,24]. However, when most of the mineral N in these OWPs is in the form of ammonium, a fraction can be immobilised by soil microorganisms in the form of microbial biomass; another fraction can be nitrified and become available to crops [7,18]. Furthermore, supplementing organic fertilisation with mineral inputs increases both the mineralisation of organic N from OWP and the immobilisation of fertiliser N in soil aggregates [13]. This ensures the continuous availability of mineral N in the soil solution at the phenological stages when N demand is highest, thereby significantly improving the yield of crops supplied with organic fertiliser [8]. Thus, the yields of the OWP treatments equalled the yield of the mineral treatment in the first cropping campaign at all of the doses.
According to [25], the lack of significant differences between such treatments may also be related to the horticultural species considered, which have a short growth cycle (45–100 days), thus reducing the visibility of different fertilisation rates. Indeed, the availability of nitrogen to plants in the form of nitrates by OWP treatments is not synchronous with the timing of the highest nitrogen demand [7,8]. Moreover, [3] showed that lettuce biomass increased more significantly after the application of high doses of PL than after the application of the mineral fertiliser on an arenosol. In contrast, the high rate of application of SS had similar effects as those of the application of the mineral fertiliser on the biomass of lettuce grown on the same type of arenosol. The high-dose application of poultry manure thus immediately provides the forms of nitrogen needed by the crop and, through repeated applications over cycles, improves soil fertility by improving the pH and soil nutritional status [9,15,26]. The application of OWP over the years thus affects the availability of nutrients in the soil depending on the composition of the OWP and on soil fertility parameters; its influence on yields also depends on the type of crop.
Crop yields increase linearly with nutrient rates and then reach an asymptote; excessive N applications can reduce yields [27,28]. However, high or continuous applications of OWP can increase the mineral forms of N in soils available to crops [7] and explain the insignificant effects of high OWP applications on vegetable yields. Based on the results of the analyses of total N levels in vegetables during the seasons, we can explain the decrease in yields by a low availability of N in the soil. Above a threshold dose of available N, carrot yields no longer increase or decrease [16,17], and the same is true for tomato [28] and lettuce yields [29]. Furthermore, when the amounts of N applied are too high, the impacts of ammonium toxicity have been attributed to the reduction and inhibition of cation uptake, particularly potassium, due to the ionic imbalance this induces [30]. Indeed, in our study, soil analyses showed a significant increase in the exchangeable K content between T0 and T4. This means that the crops were not able to use the amount of K supplied by the fertiliser and this element thus accumulated in the soil. Regular application of OWPs can also increase soil phosphorus levels over the cycle [9] and thereby increase crop yields. Conversely, excess soil phosphorus can promote zinc deficiencies and the consumption of potassium interferes with calcium and magnesium uptake [1]. In addition, soils receiving OWP applications are more susceptible to phosphorus leaching losses than the same soils receiving the same amount of phosphorus as an inorganic source. The input of soluble organic compounds, which can form metal complexes, blocks the available phosphorus adsorption sites [31]. In our study, the accumulation of P assim. In the soil in 2020 is higher in the mineral treatment than in the organic treatments. Furthermore, changes in available phosphorus in the soil have been shown to be positive in the mineral fertiliser treatment but are generally much lower than in the OWP treatments [6]. Phosphorus is one of the main factors limiting the efficient use of nitrogen by plants. Regardless of the type of treatment, inappropriate proportions of nitrogen, phosphorus and potassium affect the nutrient uptake and use, and reduce the yield [32]. When high doses are applied, the risks of N losses through leaching [18,33] and volatilisation are high during the crop cycle [2,34]. Thus, to reduce nutrient losses to the soil and decrease inputs, and to achieve the best crop yields in tropical environments, OWP application rates need to be optimised.

4.2. Contrasting Effects on Crop Yields Depending on the Type of OWP

Lettuce and carrot yields differed depending on the type of OWP, but the tomato yield did not. Organic treatments did not produce different yields of tomatoes because the doses of nitrogen, phosphorus and potassium applied were not contrasted enough [35,36]. The highest lettuce and carrot yields were obtained in the poultry litter (PL) treatments due to strong and rapid mineralisation at the beginning of the crop cycle, even though the nutrient amounts were equivalent (even higher in the sewage sludge (SS) treatment). This result is consistent with results reported in the literature where efficient mineral forms of nitrogen and phosphorus are higher in PL than in other OWPs [30,37]. Consequently, PL applications frequently produce higher yields of lettuce and carrot than applications of other OWPs [4,29,38]. The treatments including anaerobic digestate (AD) showed similar effects to those of the SS and PL-1 treatments, despite the low N, P and K intakes of the solid fraction. This result indicates the N, P and K contents of the liquid fraction of AD contributed considerably to crop fertilisation [39]. In addition, ADs were not applied at the start of the campaign, so they are an OWP which evolves rapidly in the soil and has a good fertiliser value, but the risks of ammonia volatilisation are high [40]. The rate of organic N mineralisation of AD is similar to the rate of transformation of urea [41]. In these AD treatments, organic C and total N in the soil decreased significantly in 2020. Concerning SS, in our study, the high application rate produced lower yields than the other organic treatments. It also caused a decrease in pH and exchangeable Mg content in the soil. In the literature, it has been reported that application beyond the optimal dose does not increase tomato, cabbage and beet yields [19,20]. The application of SS is a problem when the concentrations of trace metal elements are high. Elements such as Cu, Ni and Cd can cause deficiencies of other cations (Ca, Mg, Mn, Fe, Zn) by interacting with them at the root level and inhibiting the growth of vegetables [42]. The influence of OWPs on crop yields therefore depends on their nature, the amount applied, the frequency of application, the availability of minerals in the soil and the type of crop.

4.3. Effect of Repeated Applications of OWP after Several Cropping Campaigns

Repeated applications of OWPs did not maintain high yields over the four campaigns. The yield change rates varied between campaigns depending on the treatments and the cumulative amounts of N, P and K inputs. In our study, the residual effects of the previous treatments were positive for carrot yields over the campaigns, but without significant differences, probably due to the shortening of the cycles from 5 to 15 days. This is indicative of fairly rapid carrot root maturity with repeated applications of the treatments, particularly with the PL-2 treatment applications. Summer crops can also benefit more from the residual effect of manure applications due to the increase in air and soil temperatures and in the activity of soil microorganisms [7]. The lettuce yields increased under all of the treatments over the four campaigns concomitant with the levels of mineral nitrogen levels in the soil over the four campaigns as a result of repeated applications of the treatments [27]. The residual effects of the treatments on the tomato crop were less visible than the effect of campaign 2. However, tomatoes are very sensitive to small variations in climatic parameters during their development [43,44]; this is apparent in the differences in cycle length across campaigns. The authors of [6] observed that 15 years of manure application on an acidic Chinese soil increased yield, while for 2 consecutive years, they only observed differences between years with extremely low yields (e.g., 1992, 1993 and 2000) and years with high yields (e.g., 2001). The residual effects depend on both the treatment, the crop and the cropping period. However, the availability of N, P and K elements from OWPs in subsequent years and the consequences of regular OWP inputs are less well known [5], particularly in subtropical contexts [7]. Indeed, when OWPs are applied continuously to the soil, the availability of nutrients for crops will change over time. Depending on the amount of N, P and K available in the soil during the crop cycle and the type of crop, the effects of the treatments on yield differ over the seasons [9,32].

4.4. The Strong Impact of Inter-Annual Temperature Variability on Yields

Tomato yields in campaign 2 were two to three times higher than in the other campaigns under all of the treatments. This result is explained by the larger quantity of mature fruits harvested in campaign 2 and could be linked to the effect of temperature on the growth and development of tomato plants [28]. Indeed, average temperature in the fruit-setting period, 60 to 70 days after sowing in campaign 2, were lowest in February (22 °C). This fruit set phase corresponded to December and January in the other campaigns when the temperatures ranged from 24 °C to 26 °C. In contrast, during the tomato fruit ripening phase, the temperatures ranged from 23 °C to 26 °C in campaign 2 (March to April) and were higher than in the other campaigns (22 °C to 24 °C). The fruit set was poor in plants grown at 26 °C and many fruits were parthenocarpic, resulting in lower tomato yields compared to those obtained from plants grown at 18 °C or 22 °C [44]. On the other hand, [43] showed that the tomato fruit maturity rate was positively correlated with higher temperatures up to at least 26 °C. A relatively small increase in temperature (2 °C) at mid-day (21–24 °C versus 23–26 °C) was reported to be associated with a significant increase in fruit ripening [44]. Although these results clearly support our hypothesis concerning the difference between tomato campaigns, the effect of temperature on tomato yields should be considered as a determining factor in increasing yields.

5. Conclusions

Organic waste products (OWPs) have contrasting properties and are used in a variety of contexts in Senegal. Farmers have little knowledge of the nutrient contents of OWPs, which hinders their judicious use. However, our results show that they can carry out different organic fertilisation treatments that will enable them to obtain yields equivalent to those obtained with an entirely mineral fertilisation. For the lettuce and carrot crops, better yields were measured with high doses of poultry litter. In contrast, tomato crop yields were identical for all of the treatments, regardless of climatic conditions and inter-annual variability. In addition, the geochemical properties of the soils were little changed by OWP inputs after several years of consecutive crop rotation. Our results also show that successive OWP inputs do not lead to major nutrient losses. With this information, farmers will be able to reduce the amount of mineral fertilisers applied through judicious supplementation with an OWP and thus increase their revenues. In order to clarify this benefit, a full economic study would be needed to convince farmers of the usefulness of an OWP.

Author Contributions

Conceptualization, F.F.; methodology, F.D. and F.F.; validation, F.F. and S.L.; formal analysis, F.D.; investigation, F.D., S.L. and F.F.; data curation, F.D.; writing—original draft preparation, F.D. and F.F.; writing—review and editing, F.D., S.L., K.D. and F.F.; visualization, F.D.; supervision, K.D. and F.F.; project administration, S.L. and F.F.; funding acquisition, F.F. All authors have read and agreed to the published version of the manuscript.

Funding

The authors are grateful to the French Agricultural Research Centre for International Development (CIRAD) and Digestate (diagnosis of waste treatments for contaminant fates in the environment) project, funded by ANR (Agence Nationale de la Recherche, France) under Grant ANR-15-CE34-0003-01, for funding the PhD scholarship of Falilou Diallo.

Institutional Review Board Statement

Not applicable.

Informed Consent Statement

Not applicable.

Acknowledgments

The authors thank the LMI IESOL for hosting, and the Water, Soil and Plant research unit (CIRAD, Montpellier), and IMAGO (IRD, Dakar) for laboratory analysis.

Conflicts of Interest

No potential conflict of interest is reported by the authors.

References

  1. Reeve, J.R.; Hoagland, L.A.; Villalba, J.J.; Carr, P.M.; Atucha, A.; Cambardella, C.; Delate, K. Organic farming, soil health, and food quality: Considering possible links. Adv. Agron. 2016, 137, 319–367. [Google Scholar] [CrossRef]
  2. Edmeades, D.C. The long-term effects of manures and fertilisers on soil productivity and quality: A review. Nutr. Cycl. Agroecosyst. 2003, 66, 165–180. [Google Scholar] [CrossRef]
  3. Diallo, F.; Masse, D.; Diarra, K.; Feder, F. Impact of organic fertilisation on lettuce biomass production according to the cultivation duration in tropical soils. Acta Agric. Scand. Sect. B—Soil Plant Sci. 2020, 70, 215–223. [Google Scholar] [CrossRef]
  4. Atakora, K.; Agyarko, K.; Asiedu, E.K. Influence of grasscutter, chicken manure and NPK fertilizer on the physical properties of a Chromic Luvisol, growth and yield of carrot (Daucus carota). Int. J. Plant Soil Sci. 2014, 3, 197–204. [Google Scholar] [CrossRef]
  5. Cesarano, G.; De Filippis, F.; La Storia, A.; Scala, F.; Bonanomi, G. Organic amendment type and application frequency affect crop yields, soil fertility and microbiome composition. Appl. Soil Ecol. 2017, 120, 254–264. [Google Scholar] [CrossRef]
  6. Duan, Y.; Xu, M.; Wang, B.; Yang, X.; Huang, S.; Gao, S. Long-term evaluation of manure application on maize yield and nitrogen use efficiency in China. Soil Sci. Soc. Am. J. 2011, 75, 1562–1573. [Google Scholar] [CrossRef]
  7. Bacca, A.; Ceretta, C.A.; Kulmann, M.S.D.S.; Souza, R.O.S.; Ferreira, P.A.A.; Rodrigues, L.A.T.; Marchezan, C.; Garlet, P.L.; Brunetto, G. Residual and immediate effect after 16 applications of organic sources on yield and nitrogen use efficiency in black oat and corn. Rev. Bras. Ciência Solo 2020, 44, 44. [Google Scholar] [CrossRef]
  8. Marchezan, C.; Ferreira, P.A.; Silva, L.S.; Bacca, A.; Krug, A.V.; Nicoloso, F.T.; Camila, P.; Tarouco, C.P.; Tiecher, T.L.; Brunetto, G.; et al. Nitrogen availability and physiological response of corn after 12 years with organic and mineral fertilization. J. Soil Sci. Plant Nutr. 2020, 20, 979–989. [Google Scholar] [CrossRef]
  9. Zhao, Y.; Chen, Y.; Dai, H.; Cui, J.; Wang, L.; Sui, P. Effects of Organic Amendments on the Improvement of Soil Nutrients and Crop Yield in Sandy Soils during a 4-Year Field Experiment in Huang-Huai-Hai Plain, Northern China. Agronomy 2021, 11, 157. [Google Scholar] [CrossRef]
  10. Avadí, A.; Hodomihou, N.R.; Amadji, G.L.; Feder, F. LCA and nutritional assessment of southern Benin market vegetable gardening across the production continuum. Int. J. Life Cycle Assess. 2021, 26, 1977–1997. [Google Scholar] [CrossRef]
  11. Feder, F. Recycling Organic Waste Products in a Tropical Context. In Soils as a Key Component of the Critical Zone 5: Degradation and Rehabilitation; Valentin, C., Ed.; ISTE Éditions: London, UK, 2018. [Google Scholar] [CrossRef]
  12. Lashermes, G.; Nicolardot, B.; Parnaudeau, V.; Thuriès, L.; Chaussod, R.; Guillotin, M.L.; Linères, M.; Mary, B.; Metzger, L.; Morvan, T.; et al. Typology of exogenous organic matters based on chemical and biochemical composition to predict potential nitrogen mineralization. Bioresour. Technol. 2010, 101, 157–164. [Google Scholar] [CrossRef] [PubMed]
  13. Gentile, R.M.; Vanlauwe, B.; Six, J. Integrated Soil Fertility Management: Aggregate carbon and nitrogen stabilization in differently textured tropical soils. Soil Biol. Biochem. 2013, 67, 124–132. [Google Scholar] [CrossRef]
  14. Feder, F. Soil map update: Procedure and problems encountered for the island of Réunion. Catena 2013, 110, 215–224. [Google Scholar] [CrossRef]
  15. Diacono, M.; Montemurro, F. Long-term effects of organic amendments on soil fertility: A review. Agron. Sustain. Dev. 2011, 30, 401–422. [Google Scholar] [CrossRef] [Green Version]
  16. Chen, Q.; Li, X.; Horlacher, D.; Liebig, H.-P. Effects of Different Nitrogen Rates on Open-Field Vegetable Growth and Nitrogen Utilization in the North China Plain. Commun. Soil Sci. Plant Anal. 2004, 35, 1725–1740. [Google Scholar] [CrossRef]
  17. Colombari, L.F.; Lanna, N.B.; Guimarães, L.R.; Cardoso, A. Production and quality of carrot in function of split application of nitrogen doses in top dressing. Hortic. Bras. 2018, 36, 306–312. [Google Scholar] [CrossRef]
  18. Feder, F.; Bochu, V.; Findeling, A.; Doelsch, E. Repeated pig manure applications modify nitrate and chloride competition and fluxes in a Nitisol. Sci. Total Environ. 2015, 511, 238–248. [Google Scholar] [CrossRef]
  19. Özyazici, M.A. Effects of sewage sludge on plant yield in the wheat-white cabbage-tomato rotation system. Eurasian J. Soil Sci. 2013, 2, 35–44. [Google Scholar] [CrossRef]
  20. Kabil, E.M.; Faize, M.; Makroum, K.; Assobhei, O.; Rafrafi, M.; Loizidou, M.; Aajjane, A. Effect of compost made with sludge and organic residues on soil and sugar beet crop in MoroccoEffet du compost à base de boues et de résidus organiques sur le sol et les betteraves sucrières au Maroc. J. Agron. 2015, 14, 264–271. [Google Scholar] [CrossRef] [Green Version]
  21. IUSS Working Group WRB. World Reference Base for Soil Resources 2014, update 2015. In International Soil Classification System for Naming Soils and Creating Legends for Soil Maps; World Soil Resources Reports No 106; FAO: Rome, Italy, 2015. [Google Scholar]
  22. AFNOR. Évaluation de la Qualité des Sols. In Recueil Normes et Réglementation, 1: Méthodes D’analyse Chimique; AFNOR: Paris, France, 2004. [Google Scholar]
  23. Alary, K.; Babre, D.; Caner, L.; Feder, F.; Szwarc, M.; Naudan, M.; Bourgeon, G. Pretreatment of Soil Samples rich in Short-Range-Order Minerals before Particle-Size Analysis by the Pipette Method. Pedosphere 2013, 23, 20–28. [Google Scholar] [CrossRef]
  24. Feder, F.; Oliver, R.; Rakotoarisoa, J.; Muller, B.; Scopel, E. Geochemical properties of variable charge soil explain the low nitrogen bioavailability. Commun. Soil Sci. Plant Anal. 2020, 51, 2022–2037. [Google Scholar] [CrossRef]
  25. Nicoletto, C.; Santagata, S.; Zanin, G.; Sambo, P. Effect of the anaerobic digestion residues use on lettuce yield and quality. Sci. Hortic. 2014, 180, 207–213. [Google Scholar] [CrossRef]
  26. Feder, F. Effects of Fertilisation Using Organic Waste Products with Mineral Complementation on Sugarcane Yields and Soil Properties in a 4 Year Field Experiment. Agriculture 2021, 11, 985. [Google Scholar] [CrossRef]
  27. Duan, J.; Shao, Y.; He, L.; Li, X.; Hou, G.; Li, S.; Xie, Y. Optimizing nitrogen management to achieve high yield, high nitrogen efficiency and low nitrogen emission in winter wheat. Sci. Total Environ. 2019, 697, 134088. [Google Scholar] [CrossRef]
  28. Elia, A.; Conversa, G. Agronomic and physiological responses of a tomato crop to nitrogen input. Eur. J. Agron. 2012, 40, 64–74. [Google Scholar] [CrossRef]
  29. Moreira, M.A.; dos Santos, C.A.P.; Lucas, A.A.T.; Bianchini, F.G.; de Souza, I.M.; Viégas, P.R.A. Lettuce production according to different sources of organic matter and soil cover. Agric. Sci. 2014, 5, 99–105. [Google Scholar] [CrossRef] [Green Version]
  30. Andriolo, J.L.; Godoi, R.D.S.; Cogo, C.M.; Bortolotto, O.C.; da Luz, G.L.; Madaloz, J.C. Growth and development of lettuce plants at high NH4+: NO3 ratios in the nutrient solution. Hortic. Bras. 2006, 24, 352–355. [Google Scholar] [CrossRef] [Green Version]
  31. Siddique, M.T.; Robinson, J.S. Phosphorus sorption and availability in soils amended with animal manures and sewage sludge. J. Environ. Qual. 2003, 32, 1114–1121. [Google Scholar] [CrossRef]
  32. Herencia, J.F.; Maqueda, C. Effects of time and dose of organic fertilizers on soil fertility, nutrient content and yield of vegetables. J. Agric. Sci. 2016, 154, 1343. [Google Scholar] [CrossRef]
  33. Feder, F.; Findeling, A. Retention and leaching of nitrate and chloride in an andic soil after pig manure amendment. Eur. J. Soil Sci. 2007, 58, 393–404. [Google Scholar] [CrossRef]
  34. Kirchmann, H.; Kätterer, T.; Bergström, L.; Börjesson, G.; Bolinder, M.A. Flaws and criteria for design and evaluation of comparative organic and conventional cropping systems. Field Crop. Res. 2016, 186, 99–106. [Google Scholar] [CrossRef] [Green Version]
  35. Makinde, A.I.; Jokanola, O.O.; Adedeji, J.A.; Awogbade, A.L.; Adekunle, A.F. Impact of organic and inorganic fertilizers on the yield, lycopene and some minerals in tomato (Lycopersicum esculentum mill) fruit. Eur. J. Agric. For. Res. 2016, 4, 18–26. [Google Scholar]
  36. Moccia, S.; Chiesa, A.; Oberti, A.; Tittonell, P.A. Yield and Quality of Sequentially Grown Cherry Tomato and Lettuce under Long-Term Conventional, Low-Input and Organic Soil Management Systems. Eur. J. Hortic. Sci. 2016, 71, 183–191, 1611-4426. [Google Scholar]
  37. Adegbidi, H.G.; Briggs, R.D. Nitrogen mineralization of sewage sludge and composted poultry manure applied to willow in a greenhouse experiment. Biomass Bioenergy 2003, 25, 665–673. [Google Scholar] [CrossRef]
  38. Kiraci, S. Effects of seaweed and different farm manures on growth and yield of organic carrots. J. Plant Nutr. 2018, 41, 716–721. [Google Scholar] [CrossRef]
  39. Nkoa, R. Agricultural benefits and environmental risks of soil fertilization with anaerobic digestates: A review. Agron. Sustain. Dev. 2014, 34, 473–492. [Google Scholar] [CrossRef] [Green Version]
  40. Gutser, R.; Ebertseder, T.; Weber, A.; Schraml, M.; Schmidhalter, U. Short-term and residual availability of nitrogen after long-term application of organic fertilizers on arable land. J. Plant Nutr. Soil Sci. 2005, 168, 439–446. [Google Scholar] [CrossRef]
  41. Tambone, F.; Adani, F. Nitrogen mineralization from digestate in comparison to sewage sludge, compost and urea in a laboratory incubated soil experiment. J. Plant Nutr. Soil Sci. 2017, 180, 355–365. [Google Scholar] [CrossRef] [Green Version]
  42. Gupta, N.; Yadav, K.K.; Kumar, V.; Kumar, S.; Chadd, R.P.; Kumar, A. Trace elements in soil-vegetables interface: Translocation, bioaccumulation, toxicity and amelioration-A review. Sci. Total Environ. 2019, 651, 2927–2942. [Google Scholar] [CrossRef]
  43. Adams, S.R.; Cockshull, K.E.; Cave, C.R.J. Effect of temperature on the growth and development of tomato fruits. Ann. Bot. 2001, 88, 869–877. [Google Scholar] [CrossRef]
  44. Van Der Ploeg, A.; Heuvelink, E. Influence of sub-optimal temperature on tomato growth and yield: A review. J. Hortic. Sci. Biotechnol. 2005, 80, 652–659. [Google Scholar] [CrossRef]
Figure 1. Distribution of average temperatures during the campaigns at Sangalkam station.
Agronomy 12 00032 g001
Figure 2. Average (n = 3) yields of lettuce, carrot and tomato under the different treatments and in the four campaigns. The different letters on the bars indicate significant differences (p < 0.01) between the cross-effects of treatments and campaigns. Different letters bracketed indicate significant differences (p < 0.01) between campaign effects under the plots and between treatment effects on the right side of the plots.
Agronomy 12 00032 g002
Figure 3. Yield change rates (YCR) of lettuce, carrot and tomato between campaigns for each treatment. Significant differences (p < 0.05) are marked with an asterisk.
Agronomy 12 00032 g003
Table 1. Physical and chemical characteristics of the soil.
0–20 cm20–40 cm
MeanStandard
Deviation
MeanStandard
Deviation
Bulk densitykg·dm−31.30.1
Clay%103114
Silt %114114
Sand%77117711
pH H2O 6.460.336.540.42
pH KCl 5.580.415.220.49
org. C g·kg−16.821.355.351.17
total C 7.60.155.60.17
total N0.70.010.50.01
C/N 13.040.6613.760.87
N-NO3 mg·kg−11.790.690.710.28
N-NH4 0.70.990.180.6
P 34.5721.132.2425.12
CECcmol(+)·kg−19.662.549.712.91
Ca ex.5.131.515.041.31
Mg ex.2.640.832.280.8
Na ex.0.120.080.160.15
K ex.0.190.090.110.05
Table 2. Average amounts of N, P and K provided by OWP and mineral fertilisation with crop supplements over the 4 campaigns. The calculations of the quantities of mineral elements supplied are explained in the column on the right.
OWP TypeSewage Sludge (SS)Poultry Litter
(PL)
Anaerobic
Digestate (AD)
Mineral Fertilisation
(MF)
Major
Components
NPKNPKNPKNP2O5K2OCalculation
Mean concentration dry matter (g·kg−1) (n = 8)20.7
± 7.3
10.6
± 4.9
1.7
± 0.7
25.3
± 8.7
9
± 2.0
11.3
± 3.5
18.1
± 0.8
5.4
± 0.3
15.7
± 3.3
100100200(1)
Dry matter contents (%)90.190.190.189.589.589.510.510.510.5100100100(2)
Amount of raw materials applied (t·ha−1·year−1) (n = 12)5.3
± 1.6
5.3
± 1.6
5.3
± 1.6
4.6
± 1.2
4.6
± 1.2
4.6
± 1.6
6.9
± 4.1
6.9
± 4.1
6.9
± 4.1
0.8
± 0.4
0.8
± 0.4
0.8
± 0.4
(3)
N-P-K provided (kg·ha−1·year−1)98.850.68.1104.237.146.513.13.911.481.581.5163(4) = (1) × (2) × (3)/100
Mineral complementation (kg·ha−1·year−1)60.30175.220.30103.227.8067.782.2092.6(5)
Treatments SS-1/PL-1/AD-1/MF
(kg·ha−1·year−1)
15951183124371504147916482256(6) = (4) + (5)
Treatments SS-2/PL-2/AD-2 (kg·ha−1·year−1)31810136724974299828158---(7) = 2 × (6)
Table 3. Crop variety, period and number of days of cultivation in brackets, during the experiment and crop needs.
CropLettuceCarrotTomato
VarietyEdenPamelaMongal
Campaign 1 (2016–2017)February–March(63)end April–mid August(100)mid November–end February(113)
Campaign 2 (2017–2018)mid-March–mid-May(63)end May–end August(92)end November–end March(127)
Campaign 3 (2018–2019)end March–end May(63)end June–end September(92)mid-November–mid March(127)
Campaign 4 (2019–2020)mid-April–mid-June(63)mid-June–mid September(85)mid-November–March(117)
Crop needs * kg·ha−1N120110120
P283539
K200225175
* for an expected yield of 5 kg·m−2.
Table 4. Cumulative monthly rainfall in mm.
YearsCampaign 1Campaign 2Campaign 3Campaign 4
1981–20102016–20172017–20182018–20192019–2020
December to May<3.5<3
June1717192112
July7263937159
August168159175162152
September144151125155149
October2329253340
November11511
Table 5. Differences between soil parameters measured at T0 (initial soil, 2016) and T4 (soil after cultivation in 2020).
Depth (cm)MFSS-1SS-2PL-1PL-2AD-1AD-2
pH H2O (T4) − pH H2O (T0) 0–20−0.8 *0.0−0.10.5 *0.6 *−0.3−0.2
20–40−0.7 *−0.10.10.50.1−0.4−0.2
pH KCl (T4) − pH KCl (T0) 0–20−0.9 *−0.10.00.40.5−0.7 *−0.4
20–40−0.30.20.70.8 *0.4−0.30.0
[org. C (T4) − org. C (T0)/org. C(T0)] × 100%0–20−20−466−19−39 *−24
20–40−8529−12−16−31−12
[tot. C (T4) − tot. C (T0)/org. C(T0)] × 1000–20−1321215−15−30 *−22
20–40−10633−14−12−27−8
[tot. N(T4) − tot. N(T0)/org. C(T0)] × 1000–20−25−15−1−26−25−37 *−31 *
20–40−21−915−25−18−35−21
assim. P (T4) − assim. P (T0)mg·kg−10–2055.4−13.0−0.7−11.77.7−17.4−8.0
CEC (T4) − CEC (T0)cmol(+)·kg−10–200.91.30.1−0.50.9−1.31.4
20–400.5−0.5−3.2−1.70.5−1.50.8
Ca ex. (T4) − Ca ex. (T0)0–201.92.12.31.62.6 *−0.61.6
20–402.82.13.20.72.80.11.9
Mg ex. (T4) − Mg ex. (T0)0–20−0.10.0−1.0 *−0.40.0−0.30.4
20–400.20.3−0.4−0.30.2−0.20.3
Na ex.(T4) − Na ex.(T0)0–200.10.10.00.00.00.10.2
20–400.20.10.00.10.10.10.2
K ex.(T4) − K ex.(T0)0–200.2 *0.20.6 *0.20.4 *0.10.4 *
20–400.1 *0.10.40.2 *0.30.10.2 *
(*) the difference is significant between T0 and T4 with p < 0.05.
Table 6. Mean total N concentrations (n = 3) in lettuce, carrot, and tomato after harvest. Statistical analyses represent the difference between campaigns for each crop, different letters indicate significant differences.
LettuceCarrotTomato
Camp. 1Camp. 2Camp. 3Camp. 1Camp. 2Camp. 3Camp. 1Camp. 2Camp. 3
total N (g·kg−1)MF45.94 a31.95 b24.20 c19.75 a14.15 a17.63 a27.89 a28.54 a-
SS-139.33 a33.00 b26.01 b18.03 a 15.22 a16.03 a30.59 a28.50 a-
SS-239.90 a45.99 a28.04 b15.41 a17.51 a18.76 a29.47 a28.73 a-
PL-142.03 a22.77 b26.94 b17.80 a13.13 b15.10 ab27.50 a22.55 a-
PL-248.03 a29.59 b28.28 b21.86 a14.61 a18.18 a28.58 a25.44 a-
AD-1-28.92 a23.66 a-10.80 b15.20 a24.84 a26.30 a-
AD-2-38.22 a28.00 a-11.72 b20.59 a26.55 a22.14 a-
(-) not determined.
Publisher’s Note: MDPI stays neutral with regard to jurisdictional claims in published maps and institutional affiliations.

