Article

Nitrogen Intake and Its Partition on Urine, Dung and Products of Dairy and Beef Cattle in Chile

1
Agricultural Research Institute, INIA Remehue, Casilla 24-O, Osorno 5290000, Chile
2
Faculty of Agricultural and Food Sciences, Institute of Animal Production, Austral University of Chile, Independencia 641, Valdivia 5110566, Chile
3
Faculty of Veterinary Sciences, Institute of Animal Science, Austral University of Chile, Independencia 641, Valdivia 5110566, Chile
*
Author to whom correspondence should be addressed.
Agronomy 2022, 12(1), 15; https://doi.org/10.3390/agronomy12010015
Submission received: 27 October 2021 / Revised: 8 December 2021 / Accepted: 17 December 2021 / Published: 23 December 2021
(This article belongs to the Special Issue Assessing Sustainability of Ruminant Livestock Forage-Based Systems)

Abstract

:
Nitrogen that is excreted through the urine and dung of cattle is an important source of nitrous oxide and ammonia emissions. In Chile, several studies have evaluated nitrogen (N) intake and its partitioning into urine and dung from beef and dairy cattle, however, there are no studies collating all data into one central database, which would allow an estimation of N excretion and its key variables to be developed. The aim of this study was to determine the N partition (milk or meat, urine and dung) and variables influencing the nitrogen use efficiency (NUE) and urinary N excretion of cattle based on a database generated from Chilean studies. The search of studies was carried out using a keyword list in different web-based platforms. Nitrogen excretion into urine and dung was calculated using equations reported in the literature for beef and dairy cattle. Mixed models were used to identify variables influencing the N partitioning. Nitrogen intake and its partitioning into the animal product, urine and dung were higher for dairy compared to beef cattle. For dairy cattle, NUE was influenced by milk yield, the non-fibrous carbohydrates (NFC)/crude protein ratio, acid detergent fiber intake and milk urea N (MUN), while urinary N excretion was influenced by milk yield, MUN and NFC intake. For beef cattle, N intake and its excretion were greater for grazing compared to the confined system, while NUE was greater for confined animals. This database supplies new information on N intake and its partitioning (milk, meat, urine and dung) for dairy and beef cattle, which can be used for the estimation of greenhouse gas emissions from pasture-based livestock in Chile. Additionally, our study supplies new information on nutritional variables determining NUE and urinary N excretion for dairy cattle, which can be used by farmers to reduce N excretion into the environment.

1. Introduction

It was observed that production systems may importantly affect nitrogen (N) partitioning and nitrogen use efficiency in the animal (henceforth NUE), the latter ranging between 13 and 31% in grazing systems and 40 to 45% under confinement systems with balanced rations [1,2]. Furthermore, concentrate supplementation was shown to increase NUE from 21 to 25% on pasture-fed dairy cows [3].
In humid temperate regions, such as southern Chile, most of the livestock production systems are based on pasture [4], where the most common pasture species (80%) used in grazing systems is Lolium perenne L. [5]. This grass species is characterized by a high crude protein (CP) content, ranging between 15 and 28% depending on the season and the phenological stage [6], which often exceeds the N requirements of dairy [7] and beef cattle [8,9]. The excess of ingested-N is rapidly removed and converted into urea in the liver to avoid toxic effects on the animal. Urea is transported through the bloodstream to the saliva or digestive tract to be recycled, and to milk and urine to be excreted [10]. Urinary urea is the main pathway of N excretion for ruminants, which is more readily available for soil microorganisms compared to dung N, however, it is also quickly volatilized as ammonia (NH3) or nitrous oxide (N2O). Concern regarding N2O emissions is of increasing global importance due to its high warming potential, which is 265 times greater than that of carbon dioxide [11], while NH3 emissions could contribute to ecosystem degradation and indirect emissions of N2O [12,13].
Several countries in the world, including Chile, estimate their greenhouse gas emissions (GHG) from livestock using the Intergovernmental Panel on Climate Change (IPCC) Guidelines for National Greenhouse Gas Inventories [14]. Estimation of N2O, and NH3 or nitrate (NO3) leaching emissions from N excretion by livestock are calculated by multiplying the annual N excretion rate by an emission factor (kg N emitted as N2O/kg N excreted). Nationally, the annual N excretion rate (kg N/1000 kg of body weight (BW)) is calculated for each animal species, using country-specific data [14,15]. The methodology used in the Chilean inventory involves the TIER 2 approaches, which consider activity data (e.g., animal weight) and expert judgments. Country-specific data for different cattle and animal production systems (grazing or confined) could improve the estimation of total N excretion (urine plus dung), however, there is a paucity of such a database to collect this information.
In Chile, few studies have calculated the NUE from mathematical models in beef systems [16], and others have determined NUE directly from field experiments in dairy systems [17,18,19]. According to these studies, NUE and total N excretion for dairy cattle ranged from 20.4 to 27.3%, and 260–475 g N/d, respectively, while for beef cattle ranged from 13.4 to 16.3% and 101 to 114 g N/d, respectively. This suggests that NUE and total N excretion vary between beef and dairy cattle, however, there are a small number of studies supporting these results for Chilean farms, and specifically, there is not enough information to determine what is their real difference. Nevertheless, there are many other published Chilean studies on beef and dairy cattle that report diet composition and intake, which could be used to calculate NUE through the estimation of urine or dung N when they are not reported. Johnson, et al. [20] compiled different studies from the literature, comparing the predictions of N excretion by several equations, selecting the predictive equations with higher precision and accuracy which could be used to calculate the N excretion (urine and dung) for both beef and dairy cattle. Despite the fact that some mathematical tools are available in the literature to facilitate the estimate of N excretion, there is scarce information compiling N partitioning data into a central database for livestock from developing countries. Databases are a type of systemic review, providing a synthesis of the state of knowledge in a field and allowing for evaluation theories about how or why phenomena occur [21]. In this way, a Chilean database on N partitioning could be used to determine the difference between dairy and beef cattle, and identify key variables influencing their NUE and urinary N excretion, increasing our understanding of how to reduce environmental pollution from N excretion in dairy/beef cattle in Chile. Therefore, we hypothesized that the use of local databases could allow the identification of potential variables specific to Chilean conditions that influence the NUE and urinary N excretion from beef and dairy cattle, helping farmers, extensionists, and governmental authorities to develop policies and strategies to reduce the N excretion and the risk of pollution to the environment. Thus, the aim of this study was to determine the N partition (milk/meat, urine and dung) and variables influencing the NUE and urinary N excretion of cattle based on a database generated from Chilean studies under representative local conditions.

2. Materials and Methods

2.1. Data Collection

Data collection was carried out from September 2019 to December 2020, including studies published between 1995 and 2020. During this period, a systematic literature search on N intake, NUE and N excretion (urine and dung) was performed to compile publications from peer-reviewed articles, theses (undergraduate and postgraduate) and conference papers, using different web-based platforms such as Web of Science, ScienceDirect, Scielo and Google Scholar. Search of information was performed using a combination of two keywords in Spanish and English: (1) Animal purpose (beef or dairy cattle) plus (2) Production System (grazing, grazing and supplementation and confinement system).
All studies collated were screened for their suitability prior to inclusion in the database. The selection criteria for all studies identified were: (1) Nutritional characterization of feeds, (2) Dry matter intake (DMI), (3) Methodology used to estimate the DMI, (4) Milk yield and CP concentration in milk (only for dairy cattle studies), and (5) Days in milk (DIM; only for dairy cattle studies). The studies which satisfied the selection criteria list were included in the database. Figure 1 presents a summary of the data collation process.

2.2. Description of Database

Data collated were entered into a specific template developed in Microsoft Excel®. The Excel template included 89 variables, with the aim to collate information about the study, animal parameters, diet, and N partitioning. Due to large variation in the information entered in the database, variables were grouped into six categories (1) Study characterization, (2) Diet nutritive value, (3) Animal type, (4) Rumen and blood parameters, (5) DMI and (6) N partitioning.
The study characterization contained 14 variables, including trial description, institution, country, season, climate zone, latitude, longitude, data source, type of study, quality control, reference and identification of the number of experiments.
The diet nutritive value contained 13 variables such as DM, CP, neutral and acid detergent fiber (NDF and ADF, respectively), metabolizable energy (ME), digestibility (the content of digestible organic material (%) in the DM, determined in vitro (DOMD)), ash, lipids, water-soluble carbohydrates (WSC), non-fibrous carbohydrates (NFC; NFC = 100 − (CP + NDF + Ether extract + Ash), and NFC:CP ratio.
Animal type included 14 variables such as number of cows per treatment, BW, DIM (only for dairy cattle), experimental season, animal type (beef or dairy cattle), animal subcategory (dairy cows, heifers (<2 years), steers (<2 years, bulls and calves), breed, production system and milk yield and composition (fat, CP, and milk N urea (MUN)). Cows eating only fresh pasture were classified as “grazing system” (GS), while cows eating pasture plus supplementation (concentrate, silage, supplementary crop, etc.) were classified as ”grazing and supplementation” (GSS). Remaining animals were classified as “confinement systems” (CS).
Category grouping information on rumen and blood parameters contained 5 variables, including blood urea-N (BUN) and, rumen concentration of acetate, propionate, butyrate and ammonia.
Intake category contained 26 variables, including methodology used to estimate the intake, total DMI, pasture DMI, concentrate DMI, silage DMI, other food DMI, NFC intake, NDF intake, ADF intake, NFC:CP ratio of the diet, ME intake, and CP intake.
Nitrogen partitioning category contained 17 variables, including N intake, NUE, urinary N excretion, dung N excretion, total N excretion, N excreted/kg BW, N excreted/kg milk, and technique used to estimate urinary N excretion.

2.3. Equations Used for N Partitioning

Nitrogen intake and its partitioning into urine and dung were carried out using equations reported in the literature (Table 1).
Equations used to estimate the N excretion into urine and dung in dairy cattle were selected from the study of Johnson, et al. [20], who evaluated different prediction models for N excretion reported in the literature data. According to Johnson, et al. [20], the urinary N excretion in lactating dairy cows was best predicted by equation reported by Reed, et al. [22], based on the lower values of root mean square prediction error (RMSPE). A similar procedure was used to identify the best equation to predict urinary N excretion in beef cattle. Equations to estimate urinary and dung N excretion were not used for studies reporting N excretion by full collection of excreta (urine or dung) or spot sampling (urine or dung), which represented 14% of database. Therefore, equations were used for studies where N partitioning was not directly measured in studies, which represented 86% of database. Nitrogen use efficiency was calculated as proportion of N intake retained in milk. We did not consider the N retained for animal requirements, due to N retention is associated with BW change for cows in positive energy balance [10]. Cows in early and mid-lactation are negative energy balance, suggesting no or low N retention. Additionally, Keim, et al. [23] determined that N retained for growth was 1.3–2.4%. Considering that BW change was not reported in studies and N retained for growth represented <2.5% of N intake, we did not consider N retained for animal requirements. This is a limitation of current study, however, it was related to the lack of information.

2.4. Quality Control

Quality control was carried out to reduce the errors during the data entry phase. During this process, a different person who entered data into the database checked if entered data corresponded to the original source. Additionally, data published in peer-review papers were not duplicated from those reported in theses or conference papers. In the case of duplication, peer review publications were maintained in the database instead of theses or conference papers. Information from peer-review publications was completed from thesis, which reported more specific information.

2.5. Statistical Analysis

Mixed models were carried out to evaluate the effect of type of animal, system, stage of lactation and season on NUE and N excretion into urine and dung. All of these were fixed variables, while experiment number was included as a random variable to account for any effects associated with individual experiments.
A mixed model was fitted to identify variables affecting NUE and N partitioning into urine and dung for dairy cattle. Variable selection was carried out using the forward stepwise procedure, with the Akaike criteria selection (AIC) used to fit the best model. Therefore, final models only included significant variables with the marginal regression explaining the degree of variance by fixed effects. Determinant coefficients (R2) for fixed effects (marginal R2) and incorporating the random effects (conditional R2) were computed based on Nakagawa and Schielzeth [29]. Multicollinearity was assessed by calculation of variance inflation factors (VIF) with variables having variance inflation factors greater than 5 removed from the models [30]. Variables included in the full models for NUE and urinary N excretion were independently evaluated using univariate models to determine the marginal R2. Each model included the individual variables as fixed effect while experimental ID was fitted as random variable.
It was observed that N intake, NUE and N excretion (urine and dung) were significantly modified by type of animals, therefore, the selection of variables influencing the N partitioning was carried out separately for beef cattle and dairy cattle. Nitrogen partitioning was affected by the production system and season of the experiment; however, it was not possible to carry out separate statistical analyses for these data, given the low number of observations registered for each system and season.
Given the low number of observations, it was not possible to identify variables determining NUE and N partitioning into urine and dung for beef cattle. In this case, only the effect of system and season on N partitioning was evaluated. All statistical analyses were carried out in the statistical language R version 4.0.5 [31].

3. Results and Discussion

3.1. Summary of Collated Data

A search of information allowed us to identify 71 studies, where peer-review papers represented 63% of studies, followed by thesis (23%) and conference papers (14%). However, we did not include all of these studies in the database due to information reported was not enough to estimate N partitioning (selection criteria list). In this way, the database was comprised of 145 observations (Table 2), which were compiled from 48 studies in 6 research centers and universities. Peer-review studies represented 67% of the database, followed by theses (31%) and conference papers (2%). All data entered in the database are presented in Supplementary Table S1.
Data for dairy cattle represented 81% of the database (117 observations), collated from 38 studies conducted in 5 institutions. Grazing and supplementation system was the most frequent system, representing 86% of dairy cattle dataset, followed by GS (13%). Data were mainly collated from early lactation (72%), followed by mid (16%) and late lactation (12%). Spring was the season supplying the greater amount of data for dairy cattle (55% of the dataset), followed by autumn (32%), summer (11%), and winter (2%) seasons.
Only 28 observations were found for beef cattle systems (19% of database, Table 2), compiled from 10 studies conducted in 3 research institutions. The confinement system was the most common production system, representing 78% of the beef cattle dataset, followed by GS (18%) and GSS (4%). The database included data from all year round, with spring representing 57%, followed by winter (25%), autumn (11%) and summer (7%) seasons.
A low number of observations on blood and rumen parameters were entered into the database (Table 3). For example, 63 observations for blood urea plasma were found for dairy cattle, while 0 data for beef cattle. Similarly, rumen concentration of propionate, acetate, butyrate and ammonia ranged between 27 and 29 observations. A high number of observations were found for milk yield and its concentration of fat and protein (119, 117 and 117 observations, respectively), while 79 observations for MUN were entered into the database.

3.2. Distribution of Data Collated for N Partitioning

For dairy cattle, N intake ranged between 436 to 566 g N/d (Confidence interval (CI): 95%. Table 3 and Figure 2). Nitrogen use efficiency (CI = 95%) ranged between 21.8 to 26.5%, however, extreme values under 20% and over 30% NUE were observed. Nitrogen in milk (CI = 95%) ranged between 110 to 142 g N/d and extreme values were rare. Urinary N excretion (CI = 95%) ranged between 195 and 284 g N/d, while dung N excretion was between 125 to 157 g N/d. For beef cattle, N intake ranged between 178 to 256 g N/d (Table 3), while NUE ranged between 21.3% to 27.0%. Urinary and dung N excretion ranged between 63–125 g N/d and 63–91 g N/d, respectively (CI = 95%).
Our results for N partitioning are partially in agreement with those previously reported in two databases in dairy cattle and beef cattle under confinement conditions [20,21,22], where mean values for N intake, N in milk, urinary N and dung N ranged between 432–545 g N/d, 112–147 g N/d, 148–192 g N/d and 144–176 g N/d, respectively. Urinary N excretion for Chilean cattle in this study is greater than values reported in previous databases on N partitioning, which can be mainly associated with the high number of studies carried out on grazing conditions, where dietary imbalances between energy and protein are expected, increasing N excretion throughout urine [32]. However, our results are similar to those reported by Aizimu, et al. [26], who built a New Zealand database for grazing dairy cows. According to Aizimu, et al. [26], N excretion and its excretion into milk, urine and dung ranged between 283–650 g N/d, 58–160 g N/d, 81–343 g N/d and 114–129 g N/d for Friesian cows, respectively, while for Jersey × Friesian cows ranged between 201–616 g N/d, 56–150 g N/d, 165–358 g N/d and 86–138 g N/d, respectively The above-described results support the idea that urinary N excretion is greater for grazing compared to confinement system, as a consequence to N supply from pasture exceeds the N requirements for dairy cows, increasing urinary N excretion [33]. Dung N values were found to be in the range reported in the literature. This agrees with previous reports indicating that an increase in the N intake has little effect on dung N excretion [33].
Nitrogen excretion per kilogram of milk (CI = 95%) varied between 14.1 to 18.1 g N/kg milk, although values under 10 g N/kg milk and over 20 g N/kg milk were also observed. Total N excretion per kg of BW (CI = 95%) ranged typically between 0.58 to 0.81 g N/kg BW, with some data over 1.0 g N/kg BW.

3.3. Effect of Type of Animal, System and DIM on N Partitioning

Nitrogen partitioning was modified by animal category (Table 4, p < 0.05). Nitrogen intake was 96.9% greater for dairy cattle compared to beef cattle, while NUE was 51% greater for dairy cattle. A lower NUE for beef compared to dairy cattle was reported in previous studies [34,35], which is mainly associated with the higher N retention in milk compared to that in meat. For example, Estermann, et al. [34] found that N retained in milk and the body was 103 and −4 g N/day for dairy cattle, respectively, while body N retention for beef cattle was 33 g N/d supporting the lower NUE. Total N excretion (urine and dung) was 70% greater for dairy cattle, mainly associated with increased urinary N excretion (+97%), while dung N excretion was just 34% greater for dairy cattle. The greater urinary and total N excretion for dairy cattle is mainly associated with its greater N intake compared to beef cattle. Several studies have reported that urinary N excretion increase as N intake is increased [24,33].
Nitrogen use efficiency for beef cattle was greater than that reported by Arias, et al. [16], who simulated the N partitioning of pasture-finished steers in Chile (17.9% for our study, compared to 13.4–16.3% in Arias, et al. [16]). However, if we disaggregate our NUE results for beef cattle according to the animal production system, the NUE for grazing animals was 16.1%, which is in agreement with the value reported by Arias, et al. [16].
Nitrogen excretion per kilogram of BW was 70% greater for dairy cattle compared to beef cattle (p < 0.01). This parameter is used in GHG inventories to estimate N2O emissions from urine and dung [14]. According to the IPCC guidelines [14], the default value for N excretion is 0.39 kg N/1000 kg BW for dairy cattle for Latin-American countries, ranging between 0.28 and 0.60 kg N/1000 kg BW for low and high milk yield cows, respectively. Therefore, N excretion observed for Chilean dairy cows (0.63 kg N/1000 kg BW) corresponded with high-performance dairy cows, which requires a greater dietary N content to satisfy the N requirements [7], explaining the greater N excretion. The N excretion per kilogram of BW for beef cattle was similar to that suggested by IPCC [36], which ranges between 0.29 and 0.36 kg N/1000 kg BW. Considering that N partitioning in our study was modified by animal category, system type, season and DIM (for dairy cattle), we analyzed separately from the type of animal.
For dairy cattle, N partitioning was partially modified by the system (Table 5). Nitrogen use efficiency was 13.3% greater for GSS compared with GS (p < 0.01), which is explained by the similar N intake between systems (p > 0.05) and greater N retained in milk for GSS (p < 0.01). Nitrogen use efficiency for grazing dairy cows agrees with results reported in a similar study (database) in New Zealand [26], where NUE for pasture-based systems ranged between 23–25%. Similarly, Correa-Luna, et al. [37] found that NUE ranged between 26–28% and 19–20% for high- and low-intensity systems, respectively, supporting the intensification of grazing dairy systems in Chile. According to Chase [38], NUE for dairy cattle can be divided into four categories: (1) NUE less than 20%, which is considered very low; (2) NUE between 20–25%, which can be potentially improved; (3) NUE between 25–30%, typical values achieve by experimental feeding; and (4) NUE greater than 30%, which is considered as above average and excellent. Therefore, NUE in Chilean pasture-based systems can be potentially improved, which is supported by the greater NUE for grazing dairy cows receiving supplementation (Table 5). Urinary N excretion was 10% greater for GS compared with GSS (p < 0.01). Several studies have reported that the majority of urinary N is excreted as urea, which is readily available for the enzymatic action of microorganisms in the soil, increasing the availability of N to be lost as NH3 and N2O [39], both considered as environmental pollutants. Therefore, the current results indicate that grazing dairy cows are excreting a greater N precursor for GHG emissions (N2O) and NH3 volatilization compared to GSS. Nitrogen partitioning was not modified by the stage of lactation (p > 0.05), whereas N intake (p = 0.07) and NUE (p = 0.06) tended to be greater in spring compared with autumn season. The greater NUE observed in spring compared with the autumn season was previously reported under in vitro conditions [40] and is mainly due to the greater WCS/CP ratio in spring pastures [41], the greater energy supply in the rumen due to faster DM and NDF fractional degradation rates and greater effective degradability, plus a lower soluble CP fraction [42]. Nitrogen use efficiency tended to be greater in spring (p = 0.1), which is a consequence of its greater retained N in milk compared to other seasons (p < 0.01). During spring, pastures in a temperate climate such as Southern Chile are characterized for a high N and WSC content [41,43,44], increasing the N retention in milk due to greater WSC/CP ratio of diet [3,45], supporting our results. The greater milk N for early lactation compared to mid-lactation (p < 0.01) is a consequence of high demands on the mammary gland, increasing the partitioning of nutrients towards milk synthesis at the beginning of lactation [46]. Despite greater milk N in spring, NUE did not differ among stages of lactation (p > 0.05).
Nitrogen partitioning for beef cattle was strongly affected by the animal production system (Table 6). Nitrogen intake was lower for CS compared to GS (p < 0.05) as expected, given that the CS diet is balanced according to animal requirements in a more precise and constant manner than in GS, due to the normal variation of N concentration in the grass during the year. Pastures in a temperate climate such as those of Southern Chile are characterized by their high concentration of CP, ranging between 15 and 28% depending on their phenological stage [6], which explains the higher N intake. The high CP concentration was associated with either N fertilizer application or soil N mineralization and its effect on N plant uptake [47]. In the study, NUE was 66% greater for CS compared to GS. The greater N intake and lower NUE for grazing compared to confinement systems suggest that N supply exceeds the N requirements of beef cattle under GS, therefore, all excess of N was not retained in the product (meat) and was excreted into the environment. The aforementioned is supported by the greater urinary and dung N excretion for GS compared to GSS and CS. The proportion of N excreted per kg of BW was 0.2 greater for grazing compared to confinement system, respectively. Nitrogen partitioning was not modified by season (p > 0.05).

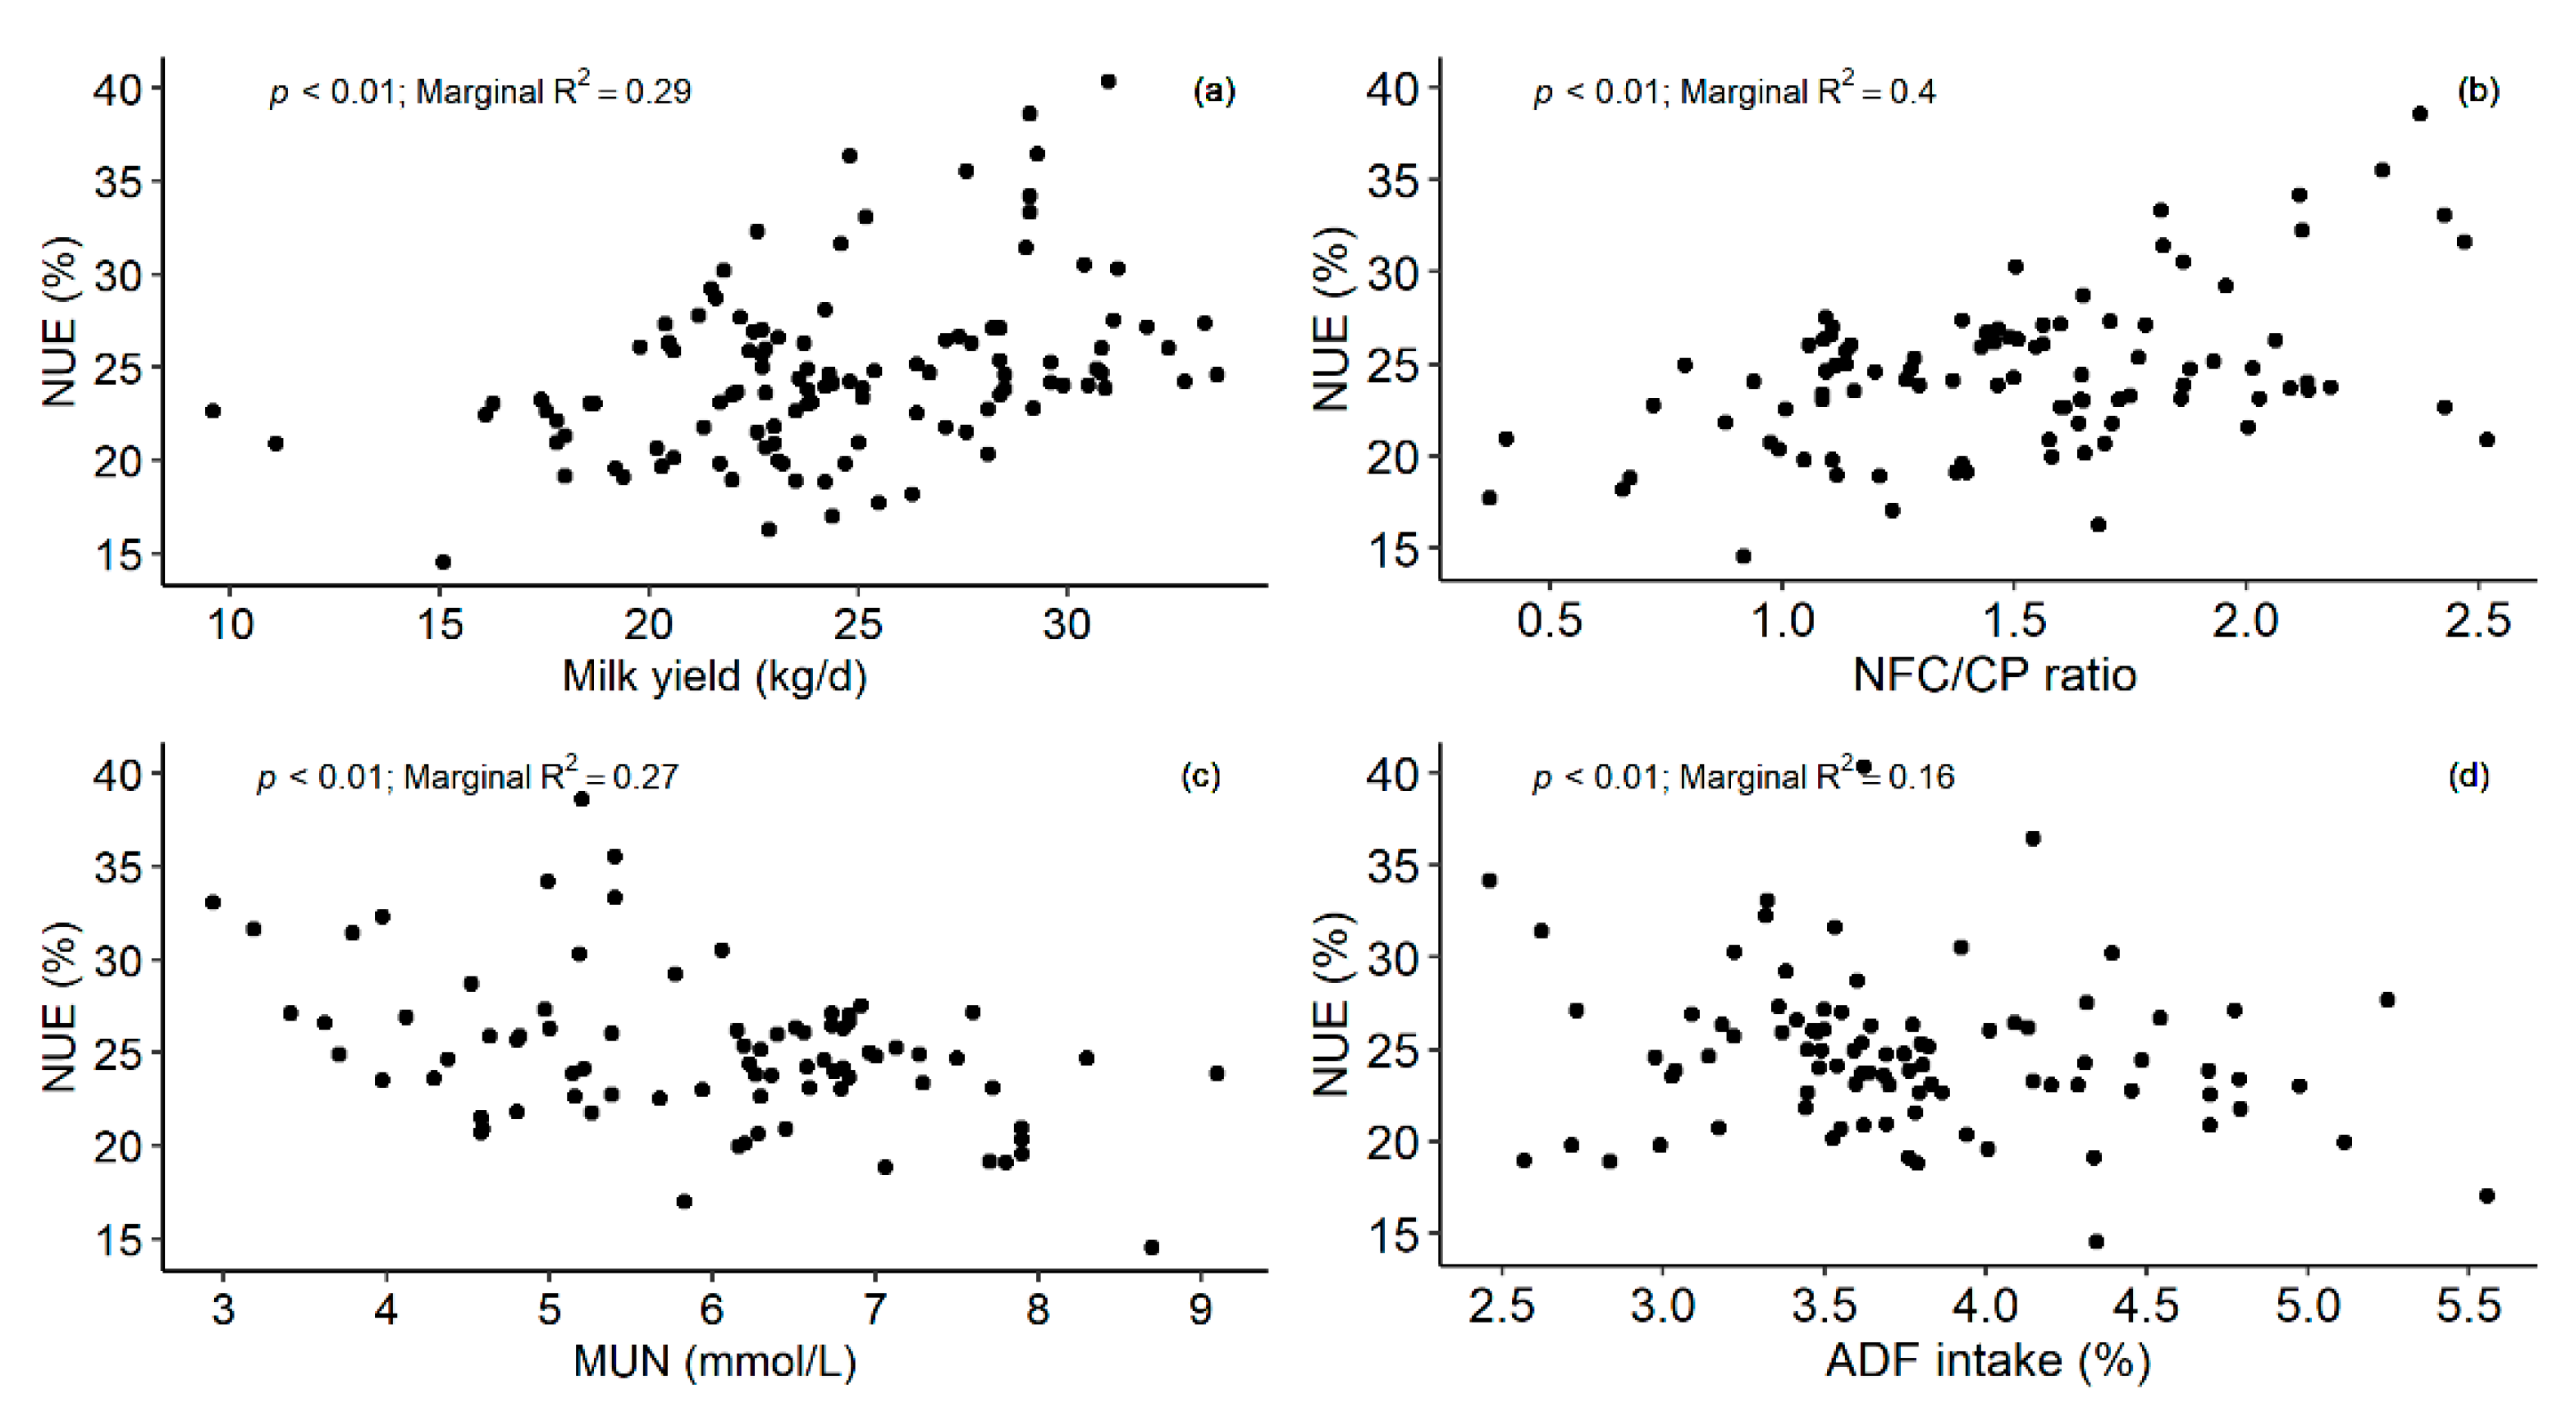
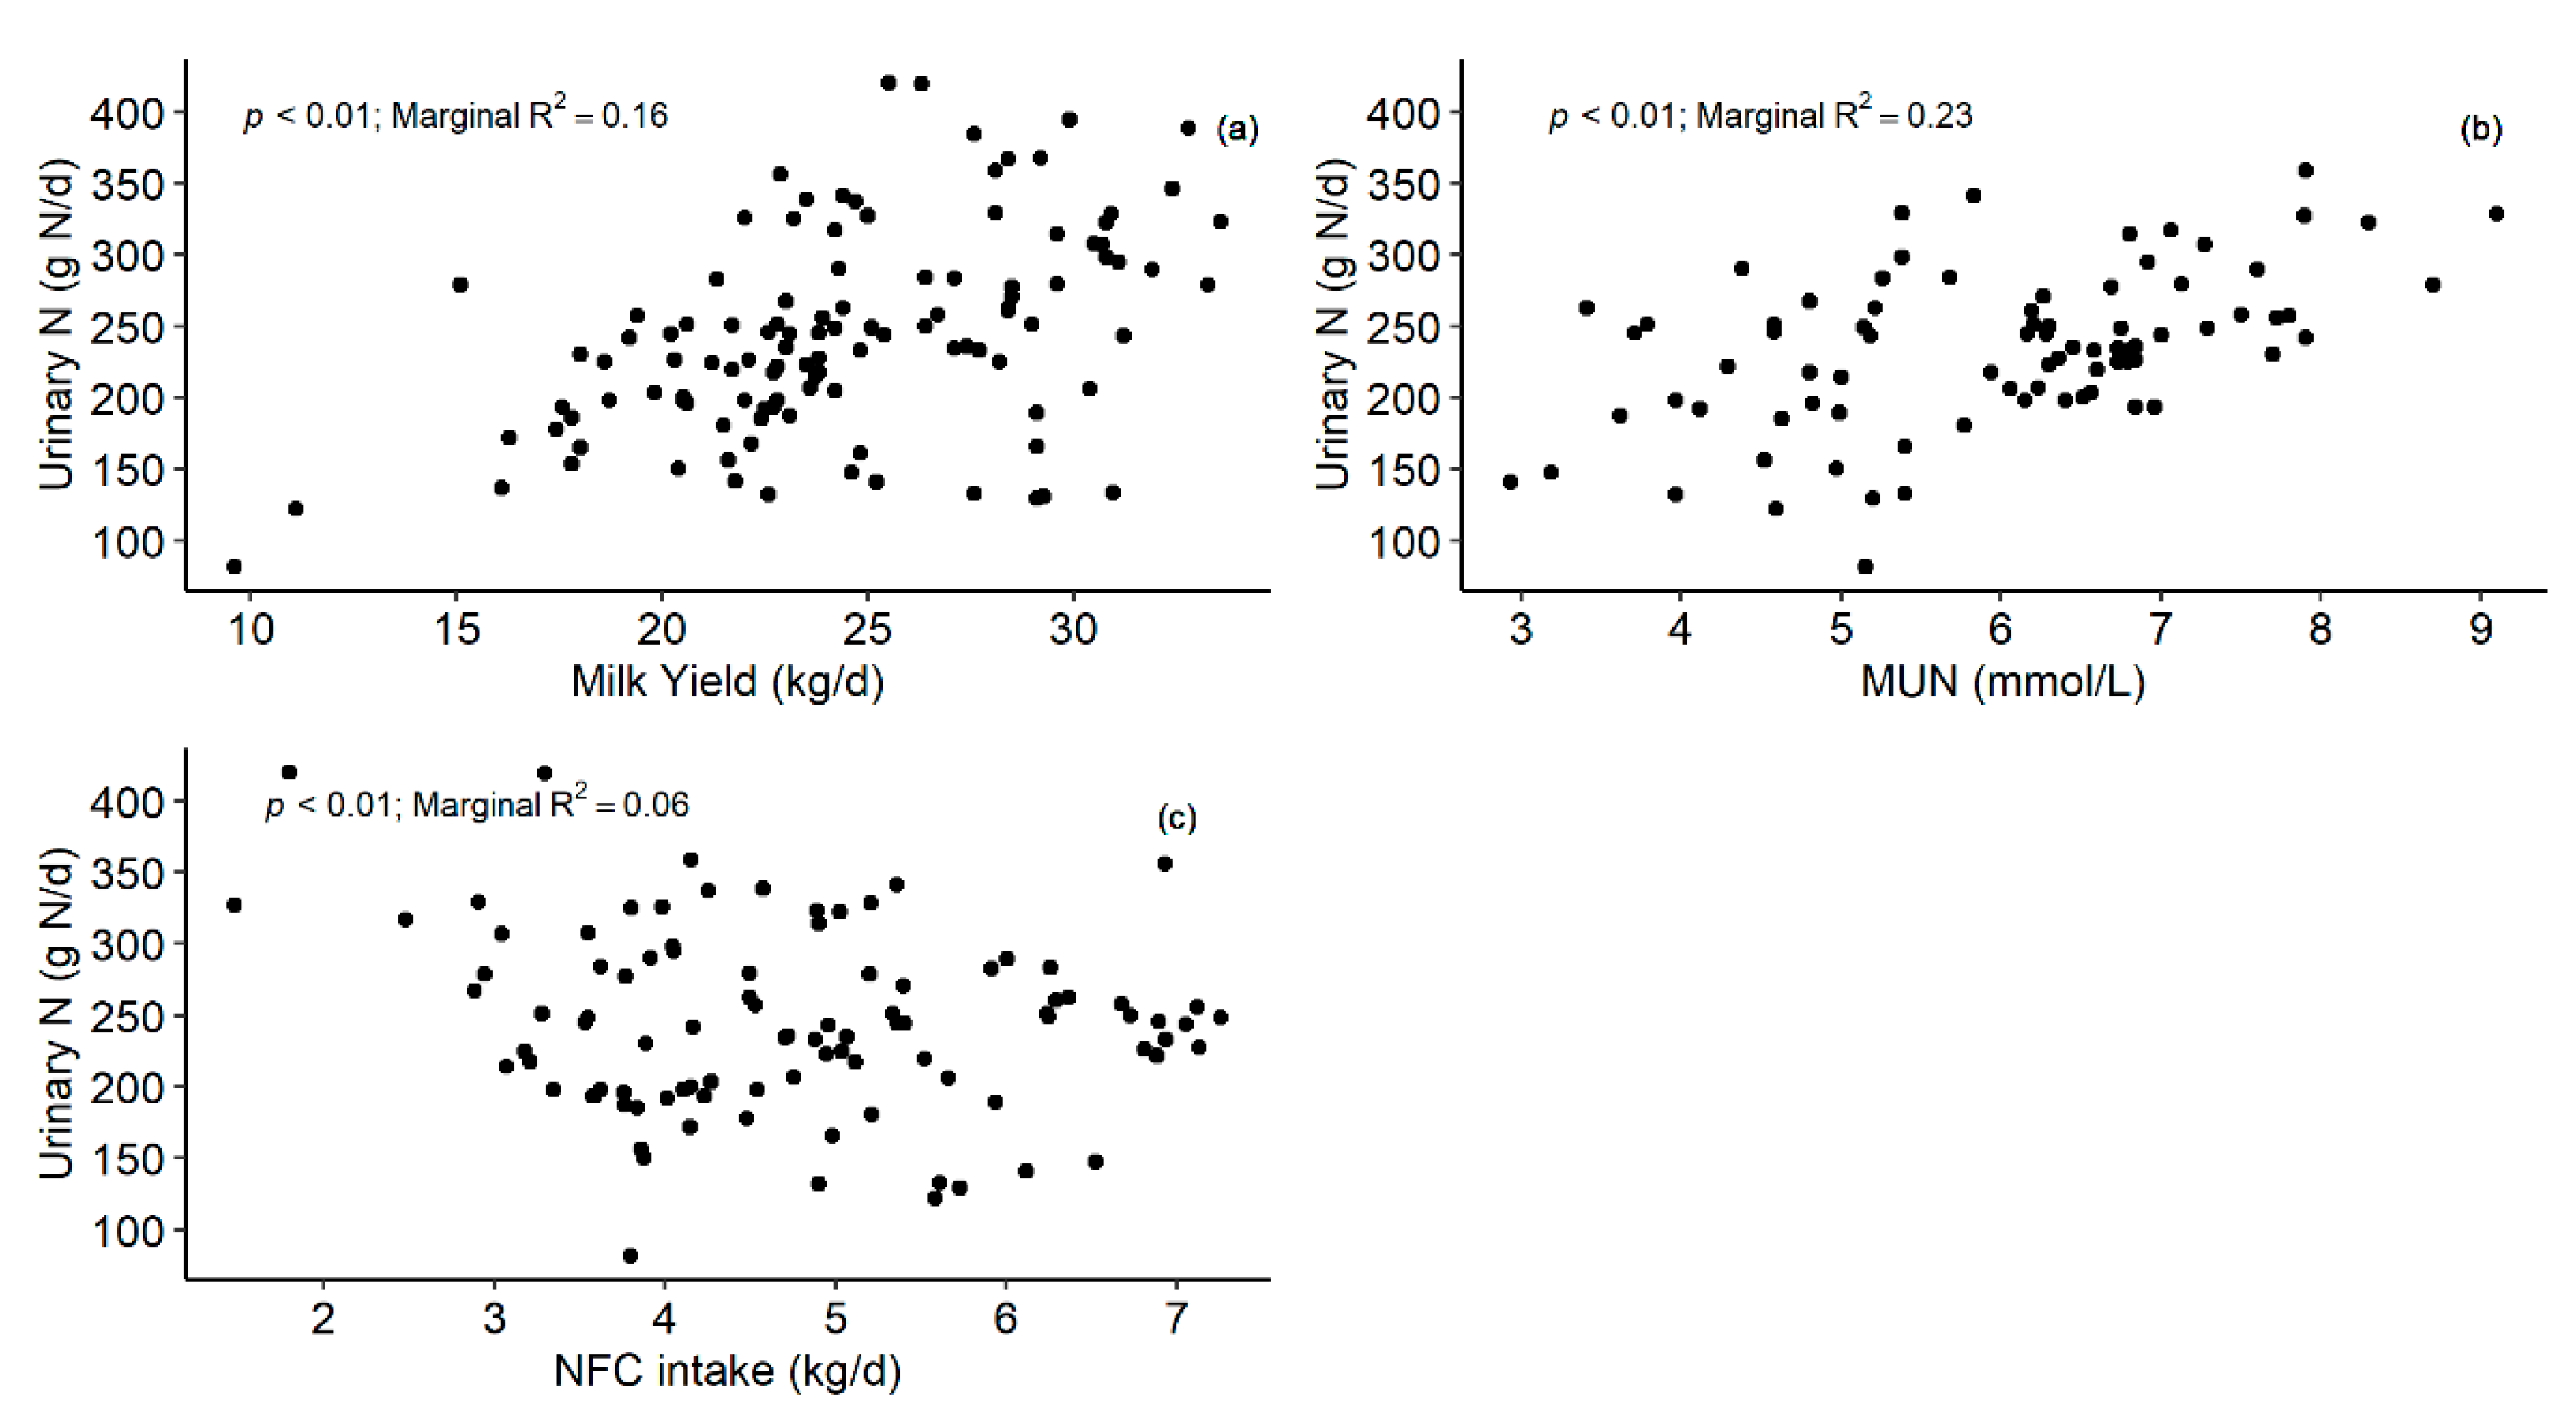
3.4. Variables Influencing N Partitioning of Dairy Cattle

Nitrogen use efficiency was positively influenced by milk yield (marginal R2 = 0.29; Figure 3a) and NFC/CP ratio (marginal R2 = 0.40; Figure 3b) and negatively influenced by MUN (marginal R2 = 0.27; Figure 3c), and ADF intake (marginal R2 = 0.16; Figure 3d), where the fixed effects of the model explained 58.7% of the variation (n = 78; marginal R2). All data collated from dairy cattle were based on grazing with or without supplementation, where pasture is characterized for a high N content and low supply of WSC [41,45]. Therefore, the greater NUE as NFC/CP ratio increased suggest an improvement in the supply of readily fermentable carbohydrates in the rumen, which increased the ruminal utilization of N by microorganisms and N retention into milk [24,45]. A similar result was reported by Keim and Anrique [3], where NUE was improved as WSC/CP ratio increased, suggesting a positive effect of soluble carbohydrates in the N balance. The above-described results are supported by the negative relationship between NUE and MUN. Milk urea N comes mainly from the breakdown of CP in the rumen, which is not utilized for the ruminal synthesis of microbial protein [48], therefore, a lower MUN suggests a greater utilization of N in the rumen and thereby, a greater N retention in milk [49,50]. This result indicates that increasing the supply of WSC may improve the NUE and reduce MUN, due to a greater N utilization by ruminal microorganisms in the grazing dairy system. Finally, it was observed that NUE was negatively influenced by ADF total intake, which can be related to the reduction in the availability of digested nutrients for animals fed high-fiber diets (for example, pasture-based systems) (Figure 3d). Thus, highly fibrous diets are more resistant to ruminal degradation and fermentation, resulting in a limited amount of energy available to microbial protein synthesis [51], reducing the N use efficiency in the rumen and its exportation into milk. Similar results were found in the metanalysis carried out by Phuong, et al. [52], where greater ADF content in the diet (i.e., low concentrate diet) was related to lower N and energy use efficiency.
Urinary N excretion was positively influenced by milk yield (marginal R2 = 0.16; Figure 4a), MUN (marginal R2 = 0.23; Figure 4b) and NFC intake (marginal R2 = 0.06; Figure 4c), where the fixed effects of the model explained 38.8% of the variation (n = 81; marginal R2). Several studies have reported a correlation between urinary N excretion and MUN [49,53], therefore, the current Chilean database supports the importance of MUN as a useful tool for monitoring the protein utilization in the gastrointestinal tract and N excretion of dairy cows. The direct negative relationship between NFC intake and urinary N excretion is related to the positive effect of NFC on N utilization in the rumen, reducing the circulating urea in the blood and its subsequent excretion throughout urine [33].
The estimated coefficients of determination for both models increased when considering the study as a random effect (Table 7). Particularly the conditional R2 were 0.88 and 0.81 for NUE and urinary N excretion models, respectively. Reed, et al. [22] reported that an important part of the total variance of N estimates can be associated with the study effect (20 to 58% of N variables in dairy cows). In our study, the variation explained by random effects (condition R2–marginal R2) included in the model were 29.5% and 42.3% for NUE and urinary N excretion, respectively. The greater impact of the study effect in urinary N excretion could be attributed to the daily variation of N excretion in cows consuming pasture-based diets, being affected by diet composition and eating patterns, requiring several samplings to properly characterize that variation [54]. Contrary to this, NUE calculations also include fecal and milk N which are more consistent during the day, explaining the lower variation between studies. A good fit in model predictions for NUE and urinary N excretion is observed in Figure 5, with no evidence of systematic bias in residual plots. However, it is evident that there are differences between studies, thus researchers conducting future studies should provide a detailed description of treatments and management to properly incorporate those results in this database.

3.5. Implication of Database

This is the first study collating data available in the literature on N partitioning of dairy and beef cattle in Chile, which can be used for the national GHG inventory team to improve the estimation of N partitioning in terms of N excretion (urine + dung), N excretion per kg BW, NUE, which are currently calculated using equations and expert judgment. Additionally, the national inventory of GHG and identification of strategies to reduce N excretion require specific information per country, which can be provided by the current database for Chilean livestock. The main limitation of this database is associated with the nature of the data since only 14% of urinary N excretion data entered in the database was measured in the studies. Therefore, 86% of urinary N excretion data was calculated using equations, which could reduce the accuracy of the results. Therefore, we encourage Chilean researchers to include N measurements from full urine collection or spot samples.
These data could be considered for NUE of different animal categories and systems and environmental implications of N pollution from cattle in Chile. This work constitutes the first approach on characterizing and compiling data about N intake and its partitioning into urine and dung, which allowed us to identify that N excretion was partially modified by animal category, system type and season of the year. Information reported here is relevant for the estimation of GHG emissions from livestock grazing systems in Southern Chile as it can contribute to a more accurate estimation of the national GHG inventory.
Nitrogen excretion was lower for beef cattle compared to dairy cattle. However, the number of heads of beef cattle (dairy and beef cattle used for meat purposes) represents 66.5% of the total of Chilean cattle [55], therefore, if we multiply the average total N excretion by type of animal category (dairy or beef cattle), the total N excretion expected would be greater from beef cattle. Despite the importance of beef cattle in Chilean livestock production, dairy cattle represented 80% of the database, therefore, we encourage researchers to evaluate different nutritional strategies to reduce the N excretion, maintaining a high daily weight gain, especially in pasture-based systems. Arias, et al. [56] showed that formulating rations based on metabolizable protein instead of CP system allows for a reduction in N intake, without differences in average daily gain and therefore a greater NUE.
There are several studies evaluating nutritional strategies to improve the final BW of animals and quality of meat in beef cattle, however, only a few studies were published reporting total DMI and N partitioning in Chile. Under this condition, it was not possible to identify key variables influencing NUE and N excretion (urine and dung), because data did not allow us to calculate the N partitioning of beef cattle. We encourage researchers working with beef cattle and also in other animal species such as sheep to report the information about DMI and consider including N excretion measurements and its partition into urine and dung.
Finally, this study supplies information to estimate the N excretion (kg N/1000 kg BW) derived from a Chilean dataset, which could be used to improve the national inventory of GHG.

4. Conclusions

This is the first study compiling the information available in the literature on N partitioning for dairy and beef cattle in Chile. It was observed that N partitioning was modified by the type of animal, where N intake, NUE and urinary N excretion were greater for dairy compared to beef cattle. Additionally, it was observed that GS (independent of the type of animal) had lower NUE and greater urinary N excretion compared to supplemented GS (dairy cattle) and feedlot (beef cattle). Finally, it was possible to identify that NUE was influenced by milk yield, MUN, the NFC/CP ratio of diet and ADF intake, while urinary N excretion was related to milk yield, MUN and the NFC/CP ratio of the diet in dairy cattle.

Supplementary Materials

The following are available online at https://www.mdpi.com/article/10.3390/agronomy12010015/s1. Table S1: Chilean database of nitrogen intake and its partitioning in dairy and beef cattle.

Author Contributions

Conceptualization, I.E.B. and I.C.; methodology, I.E.B., I.C., R.C. and J.P.K.; software, I.E.B. and A.M.; validation, R.C., A.M., I.C. and J.P.K.; formal analysis, I.E.B. and A.M.; investigation, I.E.B., R.C., I.C., J.P.K., R.G.P. and F.S.; resources, I.E.B., F.S. and M.A.; data curation, I.C. and R.C.; writing—original draft preparation, I.E.B.; writing—review and editing, I.E.B., I.C., F.S., M.A., R.G.P., J.P.K. and A.M.; visualization, M.A. and R.G.P.; supervision, I.E.B. and I.C.; project administration, I.E.B.; funding acquisition. I.E.B., I.C., F.S. and M.A. All authors have read and agreed to the published version of the manuscript.

Funding

This research received no external funding.

Data Availability Statement

Full Chileandatabase used for statistical analysis is available in Table S1.

Acknowledgments

The authors would like to thank the Agricultural Research Institute-Chile and Austral University of Chile to support this study.

Conflicts of Interest

The authors declare no conflict of interest.

References

  1. Delagarde, R.; Peyraud, J.; Delaby, L. The effect of nitrogen fertilization level and protein supplementation on herbage intake, feeding behaviour and digestion in grazing dairy cows. Anim. Feed. Sci. Technol. 1997, 66, 165–180. [Google Scholar] [CrossRef]
  2. Vérité, R.; Delaby, L. Relation between nutrition, performances and nitrogen excretion in dairy cows. Anim. Res. 2000, 49, 217–230. [Google Scholar] [CrossRef]
  3. Keim, J.P.; Anrique, R. Nutritional Strategies to Improve Nitrogen use Efficiency by Grazing Dairy Cows. Chil. J. Agric. Res. 2011, 71, 623–633. [Google Scholar] [CrossRef] [Green Version]
  4. Morales, Á.; Grob, D.; Balocchi, O.; Pulido, R. Productive and metabolic response to two levels of corn silage supplementation in grazing dairy cows in early lactation during autumn. Chil. J. Agric. Res. 2014, 74, 205–212. [Google Scholar] [CrossRef] [Green Version]
  5. Balocchi, O.A.; López, I.F. Herbage Production, Nutritive Value and Grazing Preference of Diploid and Tetraploid Perennial Ryegrass Cultivars (Lolium perenne L.). Chil. J. Agric. Res. 2009, 69, 331–339. [Google Scholar] [CrossRef] [Green Version]
  6. Calvache, I.; Balocchi, O.; Alonso, M.; Keim, J.P.; López, I.F. Thermal Time as a Parameter to Determine Optimal Defoliation Frequency of Perennial Ryegrass (Lolium perenne L.) and Pasture Brome (Bromus valdivianus Phil.). Agronomy 2020, 10, 620. [Google Scholar] [CrossRef]
  7. NRC. Nutrient Requirements of Dairy Cattle; National Academy Press: Washington, DC, USA, 2001. [Google Scholar]
  8. Angelidis, A.; Crompton, L.; Misselbrook, T.; Yan, T.; Reynolds, C.K.; Stergiadis, S. Evaluation and prediction of nitrogen use efficiency and outputs in faeces and urine in beef cattle. Agric. Ecosyst. Environ. 2019, 280, 1–15. [Google Scholar] [CrossRef]
  9. National Academies of Sciences, Engineering, and Medicine. Nutrient Requirements of Beef Cattle, 8th ed.; The National Academies Press: Washington, DC, USA, 2016; p. 494. [Google Scholar]
  10. Correa-Luna, M.; Donaghy, D.; Kemp, P.; Schutz, M.; López-Villalobos, N. Efficiency of Crude Protein Utilisation in Grazing Dairy Cows: A Case Study Comparing Two Production Systems Differing in Intensification Level in New Zealand. Animals 2020, 10, 1036. [Google Scholar] [CrossRef]
  11. Grossi, G.; Goglio, P.; Vitali, A.; Williams, A.G. Livestock and climate change: Impact of livestock on climate and mitigation strategies. Anim. Front. 2019, 9, 69–76. [Google Scholar] [CrossRef] [PubMed] [Green Version]
  12. Hafner, S.D.; Pacholski, A.; Bittman, S.; Burchill, W.; Bussink, W.; Chantigny, M.; Carozzi, M.; Génermont, S.; Häni, C.; Hansen, M.N.; et al. The ALFAM2 database on ammonia emission from field-applied manure: Description and illustrative analysis. Agric. For. Meteorol. 2018, 258, 66–79. [Google Scholar] [CrossRef] [Green Version]
  13. Sigurdarson, J.J.; Svane, S.; Karring, H. The molecular processes of urea hydrolysis in relation to ammonia emissions from agriculture. Rev. Environ. Sci. Bio/Technol. 2018, 17, 241–258. [Google Scholar] [CrossRef] [Green Version]
  14. IPCC. 2006 IPCC Guidelines for National Greenhouse Gas Inventories; IPCC: Geneva, Switzerland, 2006. [Google Scholar]
  15. MMA. Informe del Inventario Nacional de Gases de Efecto Invernadero de Chile Serie 1990–2016; MMA: Santiago, Chile, 2019. [Google Scholar]
  16. Arias, R.; Velásquez, A.; Toneatti, M. Simulación de la eficiencia de la utilización de nitrógeno en novillos finalizados a pastoreo en el sur de Chile. Arch. De Med. Vet. 2013, 45, 125–134. [Google Scholar] [CrossRef] [Green Version]
  17. Beltrán, I.E.; Al-Marashdeh, O.; Burgos, A.R.; Gregorini, P.; Balocchi, O.A.; Wittwer, F.; Pulido, R.G. The Order of Grass and Maize Silage Supplementation Modifies Milk Yield, Grazing Behavior and Nitrogen Partitioning of Lactating Dairy Cows. Animal 2019, 9, 373. [Google Scholar] [CrossRef] [Green Version]
  18. Keim, J.P.; Daza, J.; Beltrán, I.; Balocchi, O.A.; Pulido, R.G.; Sepúlveda-Varas, P.; Pacheco, D.; Berthiaume, R. Milk production responses, rumen fermentation, and blood metabolites of dairy cows fed increasing concentrations of forage rape (Brassica napus ssp. Biennis). J. Dairy Sci. 2020, 103, 9054–9066. [Google Scholar] [CrossRef]
  19. Muñoz, C.; Sánchez, R.; Peralta, A.M.T.; Espíndola, S.; Yan, T.; Morales, R.; Ungerfeld, E.M. Effects of feeding unprocessed oilseeds on methane emission, nitrogen utilization efficiency and milk fatty acid profile of lactating dairy cows. Anim. Feed. Sci. Technol. 2019, 249, 18–30. [Google Scholar] [CrossRef]
  20. Johnson, A.C.B.; Reed, K.F.; Kebreab, E. Short communication: Evaluation of nitrogen excretion equations from cattle. J. Dairy Sci. 2016, 99, 7669–7678. [Google Scholar] [CrossRef] [Green Version]
  21. Page, M.J.; McKenzie, J.E.; Bossuyt, P.M.; Boutron, I.; Hoffmann, T.C.; Mulrow, C.D.; Shamseer, L.; Tetzlaff, J.M.; Akl, E.A.; Brennan, S.E.; et al. The PRISMA 2020 statement: An updated guideline for reporting systematic reviews. BMJ 2021, 372, n71. [Google Scholar] [CrossRef]
  22. Reed, K.; de Moraes, L.E.F.D.; Casper, D.; Kebreab, E. Predicting nitrogen excretion from cattle. J. Dairy Sci. 2015, 98, 3025–3035. [Google Scholar] [CrossRef] [PubMed]
  23. Keim, J.P.; Rodriguez, J.R.; Balocchi, O.A.; Pulido, R.G.; Sepúlveda-Varas, P.; Pacheco, D.; Berthiaume, R.; Vargas-Bello-Pérez, E. Effect of dietary inclusion of winter brassica crops on milk production, feeding behavior, rumen fermentation, and plasma fatty acid profile in dairy cows. J. Dairy Sci. 2021, 104, 10699–10713. [Google Scholar] [CrossRef] [PubMed]
  24. Beltrán, I.E.; Gregorini, P.; Morales, A.; Balocchi, O.A.; Pulido, R.G. Interaction between herbage mass and time of herbage allocation modifies milk production, grazing behaviour and nitrogen partitioning of dairy cows. Anim. Prod. Sci. 2019, 59, 1837–1846. [Google Scholar] [CrossRef]
  25. Whelan, S.J.; Pierce, K.M.; McCarney, C.; Flynn, B.; Mulligan, F.J. Effect of supplementary concentrate type on nitrogen partitioning in early lactation dairy cows offered perennial ryegrass-based pasture. J. Dairy Sci. 2012, 95, 4468–4477. [Google Scholar] [CrossRef]
  26. Aizimu, W.; Al-Marashdeh, O.; Hodge, S.; Dewhurst, R.J.; Chen, A.; Zhao, G.; Talukder, S.; Edwards, G.R.; Cheng, L. Estimation of Nitrogen Use Efficiency for Ryegrass-Fed Dairy Cows: Model Development Using Diet- and Animal-Based Proxy Measures. Dairy 2021, 2, 435–451. [Google Scholar] [CrossRef]
  27. Huhtanen, P.; Nousiainen, J.I.; Rinne, M.; Kytölä, K.; Khalili, H. Utilization and Partition of Dietary Nitrogen in Dairy Cows Fed Grass Silage-Based Diets. J. Dairy Sci. 2008, 91, 3589–3599. [Google Scholar] [CrossRef] [Green Version]
  28. Kohn, R.A.; Dinneen, M.M.; Russek-Cohen, E. Using blood urea nitrogen to predict nitrogen excretion and efficiency of nitrogen utilization in cattle, sheep, goats, horses, pigs, and rats. J. Anim. Sci. 2005, 83, 879–889. [Google Scholar] [CrossRef] [PubMed] [Green Version]
  29. Nakagawa, S.; Schielzeth, H. A general and simple method for obtaining R2 from generalized linear mixed-effects models. Methods Ecol. Evol. 2012, 4, 133–142. [Google Scholar] [CrossRef]
  30. Craney, T.A.; Surles, J.G. Model-Dependent Variance Inflation Factor Cutoff Values. Qual. Eng. 2002, 14, 391–403. [Google Scholar] [CrossRef]
  31. R-Studio. R: A Language and Environment for Statistical Computing; R Foundation for Statistical Computing: Vienna, Austria, 2021. [Google Scholar]
  32. Sinclair, L.A.; Garnsworthy, P.C.; Newbold, J.R.; Buttery, P.J. Effects of synchronizing the rate of dietary energy and nitrogen release in diets with a similar carbohydrate composition on rumen fermentation and microbial protein synthesis in sheep. J. Agric. Sci. 1995, 124, 463–472. [Google Scholar] [CrossRef]
  33. Pacheco, D.; Waghorn, G. Dietary nitrogen–definitions, digestion, excretion and consequences of excess for grazing ruminants. Proc. New Zealand Grassl. Assoc. 2008, 70, 107–116. [Google Scholar] [CrossRef]
  34. Estermann, B.L.; Wettstein, H.-R.; Sutter, F.; Kreuzer, M. Nutrient and energy conversion of grass-fed dairy and suckler beef cattle kept indoors and on high altitude pasture. Anim. Res. 2001, 50, 477–493. [Google Scholar] [CrossRef] [Green Version]
  35. Groenestein, C.M.; Hutchings, N.J.; Haenel, H.D.; Amon, B.; Menzi, H.; Mikkelsen, M.H.; Misselbrook, T.H.; van Bruggen, C.; Kupper, T.; Webb, J. Comparison of ammonia emissions related to nitrogen use efficiency of livestock production in Europe. J. Clean. Prod. 2019, 211, 1162–1170. [Google Scholar] [CrossRef] [PubMed]
  36. IPCC. 2019 Refinement to the 2006 IPCC Guidelines for National Greenhouse Gas Inventories; IPCC: Geneva, Switzerland, 2019. [Google Scholar]
  37. Correa-Luna, M.; Donaghy, D.; Kemp, P.; Schutz, M.; López-Villalobos, N. Nitrogen Use Efficiency and Excretion in Grazing Cows with High and Low Milk Urea Nitrogen Breeding Values. Sustainability 2021, 13, 9827. [Google Scholar] [CrossRef]
  38. Chase, L. Nitrogen utilization in dairy cows-what are the limits of efficiency? Proc. Cornell Nutr. Conf. 2003, 2003, 233–244. [Google Scholar]
  39. Selbie, D.R.; Buckthought, L.E.; Shepherd, M.A. Chapter Four—The Challenge of the Urine Patch for Managing Nitrogen in Grazed Pasture Systems. Adv. Agron. 2015, 129, 229–292. [Google Scholar]
  40. Rivero, M.J.; Keim, J.P.; Balocchi, O.A.; Lee, M.R.; Rivero, M.J. In Vitro Fermentation Patterns and Methane Output of Perennial Ryegrass Differing in Water-Soluble Carbohydrate and Nitrogen Concentrations. Animals 2020, 10, 1076. [Google Scholar] [CrossRef] [PubMed]
  41. Loaiza, P.A.; Balocchi, O.; Bertrand, A. Carbohydrate and crude protein fractions in perennial ryegrass as affected by defoliation frequency and nitrogen application rate. Grass Forage Sci. 2017, 72, 556–567. [Google Scholar] [CrossRef]
  42. Keim, J.P.; Valderrama, X.; Alomar, D.; Lopez, I.F. In situ rumen degradation kinetics as affected by type of pasture and date of harvest. Sci. Agric. 2013, 70, 405–414. [Google Scholar] [CrossRef] [Green Version]
  43. Delagarde, R.; Peyraud, J.L.; Delaby, L.; Faverdin, P. Vertical distribution of biomass, chemical composition and pepsin––cellulase digestibility in a perennial ryegrass sward: Interaction with month of year, regrowth age and time of day. Anim. Feed. Sci. Technol. 2000, 84, 49–68. [Google Scholar] [CrossRef]
  44. Demanet, R.; Mora, M.L.; Herrera, M.Á.; Miranda, H.; Barea, J.M. Seasonal variation of the productivity and quality of permanent pastures in Andisols of temperate regions. J. Soil Sci. Plant Nutr. 2015, 15, 111–128. [Google Scholar]
  45. Hoekstra, N.; Schulte, R.P.O.; Struik, P.; Lantinga, E. Pathways to improving the N efficiency of grazing bovines. Eur. J. Agron. 2007, 26, 363–374. [Google Scholar] [CrossRef]
  46. Gross, J.J.; Bruckmaier, R.M. Invited review: Metabolic challenges and adaptation during different functional stages of the mammary gland in dairy cows: Perspectives for sustainable milk production. J. Dairy Sci. 2019, 102, 2828–2843. [Google Scholar] [CrossRef] [Green Version]
  47. Ortega, I.L.; Alfaro, M.; Martinez-Lagos, J. Soil nitrogen contribution to grasslands and its implication for nitrogen use efficiency. J. Soil Sci. Plant Nutr. 2016, 16, 310–322. [Google Scholar]
  48. Guliński, P.; Salamończyk, E.; Krzysztof, M. Improving nitrogen use efficiency of dairy cows in relation to urea in milk—A review. Anim. Sci. Pap. Rep. 2016, 34, 5–23. [Google Scholar]
  49. Kohn, R.A.; Kalscheur, K.F.; Russek-Cohen, E. Evaluation of Models to Estimate Urinary Nitrogen and Expected Milk Urea Nitrogen. J. Dairy Sci. 2002, 85, 227–233. [Google Scholar] [CrossRef]
  50. Kume, S.; Numata, K.; Takeya, Y.; Miyagawa, Y.; Ikeda, S.; Kitagawa, M.; Nonaka, K.; Oshita, T.; Kozakai, T. Evaluation of Urinary Nitrogen Excretion from Plasma Urea Nitrogen in Dry and Lactating Cows. Asian Australas. J. Anim. Sci. 2008, 21, 1159–1163. [Google Scholar] [CrossRef]
  51. Jetana, T.; Abdullah, N.; Halim, R.A.; Jalaludin, S.; Ho, Y.W. Effects of energy and protein supplementation on microbial-N synthesis and allantoin excretion in sheep fed guinea grass. Anim. Feed. Sci. Technol. 2000, 84, 167–181. [Google Scholar] [CrossRef]
  52. Phuong, H.N.; Friggens, N.C.; de Boer, I.J.M.; Schmidely, P. Factors affecting energy and nitrogen efficiency of dairy cows: A meta-analysis. J. Dairy Sci. 2013, 96, 7245–7259. [Google Scholar] [CrossRef]
  53. Nousiainen, J.; Shingfield, K.J.; Huhtanen, P. Evaluation of Milk Urea Nitrogen as a Diagnostic of Protein Feeding. J. Dairy Sci. 2004, 87, 386–398. [Google Scholar] [CrossRef] [Green Version]
  54. Beltran, I.E.; Gregorini, P.; Daza, J.; Balocchi, O.A.; Morales, A.; Pulido, R.G. Diurnal Concentration of Urinary Nitrogen and Rumen Ammonia Are Modified by Timing and Mass of Herbage Allocation. Animals 2019, 9, 961. [Google Scholar] [CrossRef] [Green Version]
  55. ODEPA Encuesta Ganado Bovino. 2019. Available online: https://www.odepa.gob.cl/estadisticas-del-sector/estadisticas-productivas (accessed on 3 May 2021).
  56. Arias, R.A.; Guajardo, G.; Kunick, S.; Alvarado-Gilis, C.; Keim, J.P. Effect of Two Nutritional Strategies to Balance Energy and Protein Supply in Fattening Heifers on Performance, Ruminal Metabolism, and Carcass Characteristics. Animals 2020, 10, 852. [Google Scholar] [CrossRef]
Figure 1. Summary of process for data collation.
Agronomy 12 00015 g001
Figure 2. Histograms for (a) Nitrogen (N) intake (b) Nitrogen use efficiency (NUE), (c) N in milk, (d) Urine N, (e) Dung N, (f) N excreted per milk and (g) N excreted per body weight (BW) Count = Number of observations.
Agronomy 12 00015 g002
Figure 3. Relationship between nitrogen use efficiency (NUE) and (a) Milk yield; (b) non-fibrous carbohydrates/crude protein (NFC/CP) ratio; (c) Milk urea nitrogen (MUN); and (d) acid detergent fiber (ADF) intake of the diet in dairy cattle.
Agronomy 12 00015 g003
Figure 4. Relationship between urinary N excretion and (a) Milk yield; (b) Milk urea Nitrogen (MUN); and (c) non-fibrous carbohydrates (NFC) intake in dairy cattle.
Agronomy 12 00015 g004
Figure 5. (a) Observed (●. black) or residual (. red) Nitrogen use efficiency (NUE. %) versus predicted values of model described in Table 7; (b) Observed (●. black) or residual (. red) urinary N excretion (g N/d) versus predicted values of model described in Table 7. The solid lines represent individual studies, while points represent the different treatments within each study. The dotted lines represent the line of unity.
Agronomy 12 00015 g005aAgronomy 12 00015 g005b
Table 1. Equations used to estimate nitrogen intake, nitrogen use efficiency and nitrogen excretion into urine and dung of Chilean cattle.
ParameterEquationReference
1Total N intake (TNI)TNI (g N/d) = ((% CP/6.25) × DMI)/100[24]
Dairy Cattle
2Milk N (MN)MN (g N/d) = Milk yield × (% CP in milk/6.38)/100[17,25,26]
3Total N excretion (TNE)TNE (g N/d) = TNI − MN-
4Nitrogen use efficiency (NUE)NUE (%) = MN/TNI × 100[17,24,26]
5Urinary N excretion (UNE)UNE (g N/d) = 104 + 0.855 × TNI – 13.2 × DMI − 6.8 × (ME × 4.184)[27]
6Dung N excretion (DNE)DFE (g N/d) = TNI − (UNE + MN)[24,28]
Beef cattle
7Nitrogen use efficiency (NUE)NUE (%) = (TNI − TNE)/TNI × 100[16]
8Urinary N excretion (UNE)UNE (g N/d) = −71.2 + 0.265 × TNI + 3.76 × CP + 0.468 × BW0.75[22]
9Dung N excretion (DNE)DNE (g N/d) = 0.506 + 0.352 × TNI[22]
10Total N excretion (TNE)TNE (g N/d) = UNE + DNE-
N: Nitrogen; CP: Crude protein; DMI: Dry matter intake; ME: Metabolizable energy; BW: Body weight.
Table 2. Summary of data collated for dairy and beef cattle for nitrogen use efficiency and urinary nitrogen excretion according to animal type, production system and season.
VariablesNitrogen Use Efficiency
CountPercent (%)
Dairy Cattle
System
Grazing1613.4
Grazing and supplementation10386.6
Season
Autumn3831.9
Spring6655.5
Summer1310.9
Winter21.7
Beef Cattle
System
Grazing517.9
Grazing and supplementation13.5
Feedlot2278.6
Season
Autumn310.7
Spring1657.2
Summer27.1
Winter725
Table 3. Summary of reported variables on nitrogen intake and its partitioning into products, urine and dung of Chilean cattle.
Variables 1Dairy CattleBeef Cattle
N 2MeanQ1 3Q3 4NMeanQ1Q3
Total N intake, g N/d117511.1436.8566.128231.5177.6256.4
NUE, %11724.721.826.52824.621.327
Urine N, g N/d117243.1194.72842894.8262.76124.5
Dung N, g N/d115143.2125.1157.42881.56390.8
Milk yield, kg milk/d11924.62228.4----
Milk Fat, %1173.83.64----
Milk Protein, %1173.33.13.4----
Milk N, g/d117125110.2143----
Milk Urea, mmol/L79656.8----
Blood urea plasma, mmol/L636.25.37.6----
Propionate, mmol/L2716.213.818.225.75.475.99
Acetate, mmol/L2752.343.360.521.029.2611.21
Butyrate, mmol/L2710.68.611.921.941.862.01
Rumen Ammonia, mmol/L298.66.110.4----
NFC intake944.73.85.620.710.6920.72
NFC/CP ratio941.51.11.820.670.560.78
Body weight, kg12353551455438415367460
1 N: Nitrogen; NUE: Nitrogen use efficiency; NFC: Non-fibrous carbohydrate; CP: Crude protein; 2 number of observations; 3 first quartile; 4 third quartile.
Table 4. Nitrogen intake and its partitioning into product, urine and dung (mean ± standard error) of dairy and beef cattle in Chile.
Variables 1Beef CattleDairy Cattlep-Value
N intake. g N/d227 ± 27447 ± 21.1<0.01
NUE. %17.9 ± 1.6227 ± 1.13<0.01
Urine N. g N/d101 ± 25.5199 ± 14.5<0.01
Dung N. g N/d94.4 ± 10.9126.6 ± 6.90.02
Total N excretion. g N/d192 ± 27.5327 ± 19.2<0.01
N excretion per 1000 kg BW/d0.37 ± 0.060.63 ± 0.04<0.01
N in milk. g N/d-117 ± 4.31-
N excreted/kg milk-16.4 ± 0.64-
1 N: Nitrogen; NUE: Nitrogen use efficiency; BW: body weight.
Table 5. Effect on system, stage of lactation and season on nitrogen partitioning of Chilean dairy cattle (mean ± standard error).
N 2
Intake g N/d
NUE 3 %N Milk g N/dUrinary N Excretion g N/dDung N Excretion g N/d
System
All grazing509 ± 2022.6 ± 0.99111 ± 4.52254 ± 13.8144 ± 6.37
Grazing and supplementation497 ± 1725.6 ± 0.78126 ± 3.97231 ± 11.9140 ± 4.22
p-value0.35<0.01<0.01<0.010.45
Days in milk
Early (0–100 d)512 ± 18.725.7 ± 0.92129 a ± 3.87243 ± 13.4143 ± 4.86
Medium (100–200 d)457 ± 39.723.7 ± 1.95106 b ± 8.35217 ± 28.3135 ± 10.36
Late (>200 d)480 ± 36.523.6 ± 1.93111 ab ± 7.96215 ± 25.7137 ± 10.9
p-value0.360.420.010.460.71
Season 1
Autumn456 ± 28.723.3 ± 1.3104 b ± 4.59211 ± 21138 ± 7.55
Spring534 ± 21.826.6 ± 0.99139 a ± 3.4254 ± 16142 ± 5.76
Summer457 ± 43.223.4 ± 1.98105 b ± 7214 ± 31.6140 ± 11.72
p-value0.070.1<0.010.220.89
1 Winter: no data available; 2 N: Nitrogen; 3 NUE: Nitrogen use efficiency. Means within a row with different letters differ (p < 0.05).
Table 6. Effect on system and season on nitrogen partitioning (mean ± standard error) of Chilean beef cattle.
N 1 Intake g N/dNUE 2 %Urinary N Excretion g N/dDung N Excretion g N/dN Excreted per 1000 kg BW 3
System
All grazing328 ± 31.916.1 ± 2.39153 ± 13.2115 ± 11.350.51 ± 0.07
Feedlot203 ± 25.426.8 ± 1.8779.1 ± 10.471.2 ± 9.090.31 ± 0.06
p-value<0.01<0.01<0.01<0.01<0.01
Season
Autumn182 ± 10117.7 ± 5.0889 ± 49.264.7 ± 37.10.54 ± 0.21
Winter173 ± 70.525.3 ± 3.467.3 ± 34.261.3 ± 260.25 ± 0.15
Spring275 ± 4925.2 ± 2.39113 ± 24.195.8 ± 18.20.37 ± 0.11
Summer178 ± 7725.0 ± 4.469.7 ± 34.263.3 ± 280.26 ± 0.16
p-value0.630.620.730.690.74
1 Nitrogen; 2 Nitrogen use efficiency; 3 Bodyweight.
Table 7. Variables influencing the nitrogen use efficiency and urinary N excretion for Chilean Dairy cattle.
Variable 1EstimateS.E 2p-Value
Nitrogen use efficiency 3
Intercept16.73.6<0.01
Milk yield (kg/d)0.450.08<0.01
NFC/CP ratio 44.120.7<0.01
Milk urea nitrogen (mmol/L)−0.470.270.09
ADF intake (kg/d)−1.650.5<0.01
Urine N excretion 5
Intercept84.8546.70.07
Milk urea nitrogen (mmol/L)16.054.7<0.01
Milk yield (kg/d)4.91.6<0.01
NFC intake (g/d)−14.44.39<0.01
1 Variable selection was carried out using the forward stepwise procedure, with AIC used to fit the best model; 2 Standard error; 3 Fixed effects explained 58.7% of variation, while the model explained 88.2% of variation (n = 78); 4 Non fibrous carbohydrates/Crude protein ratio of the diet; 5 Fixed effects explained 38.8% of variation, while the model explained 81.1% of variation (n = 81).
Publisher’s Note: MDPI stays neutral with regard to jurisdictional claims in published maps and institutional affiliations.

