
Detection of Epistasis for Seed and Some Phytochemical Traits in Coriander under Different Irrigation Regimes

 , , and
Abstract
:1. Introduction
2. Materials and Methods
2.1. Plant Material
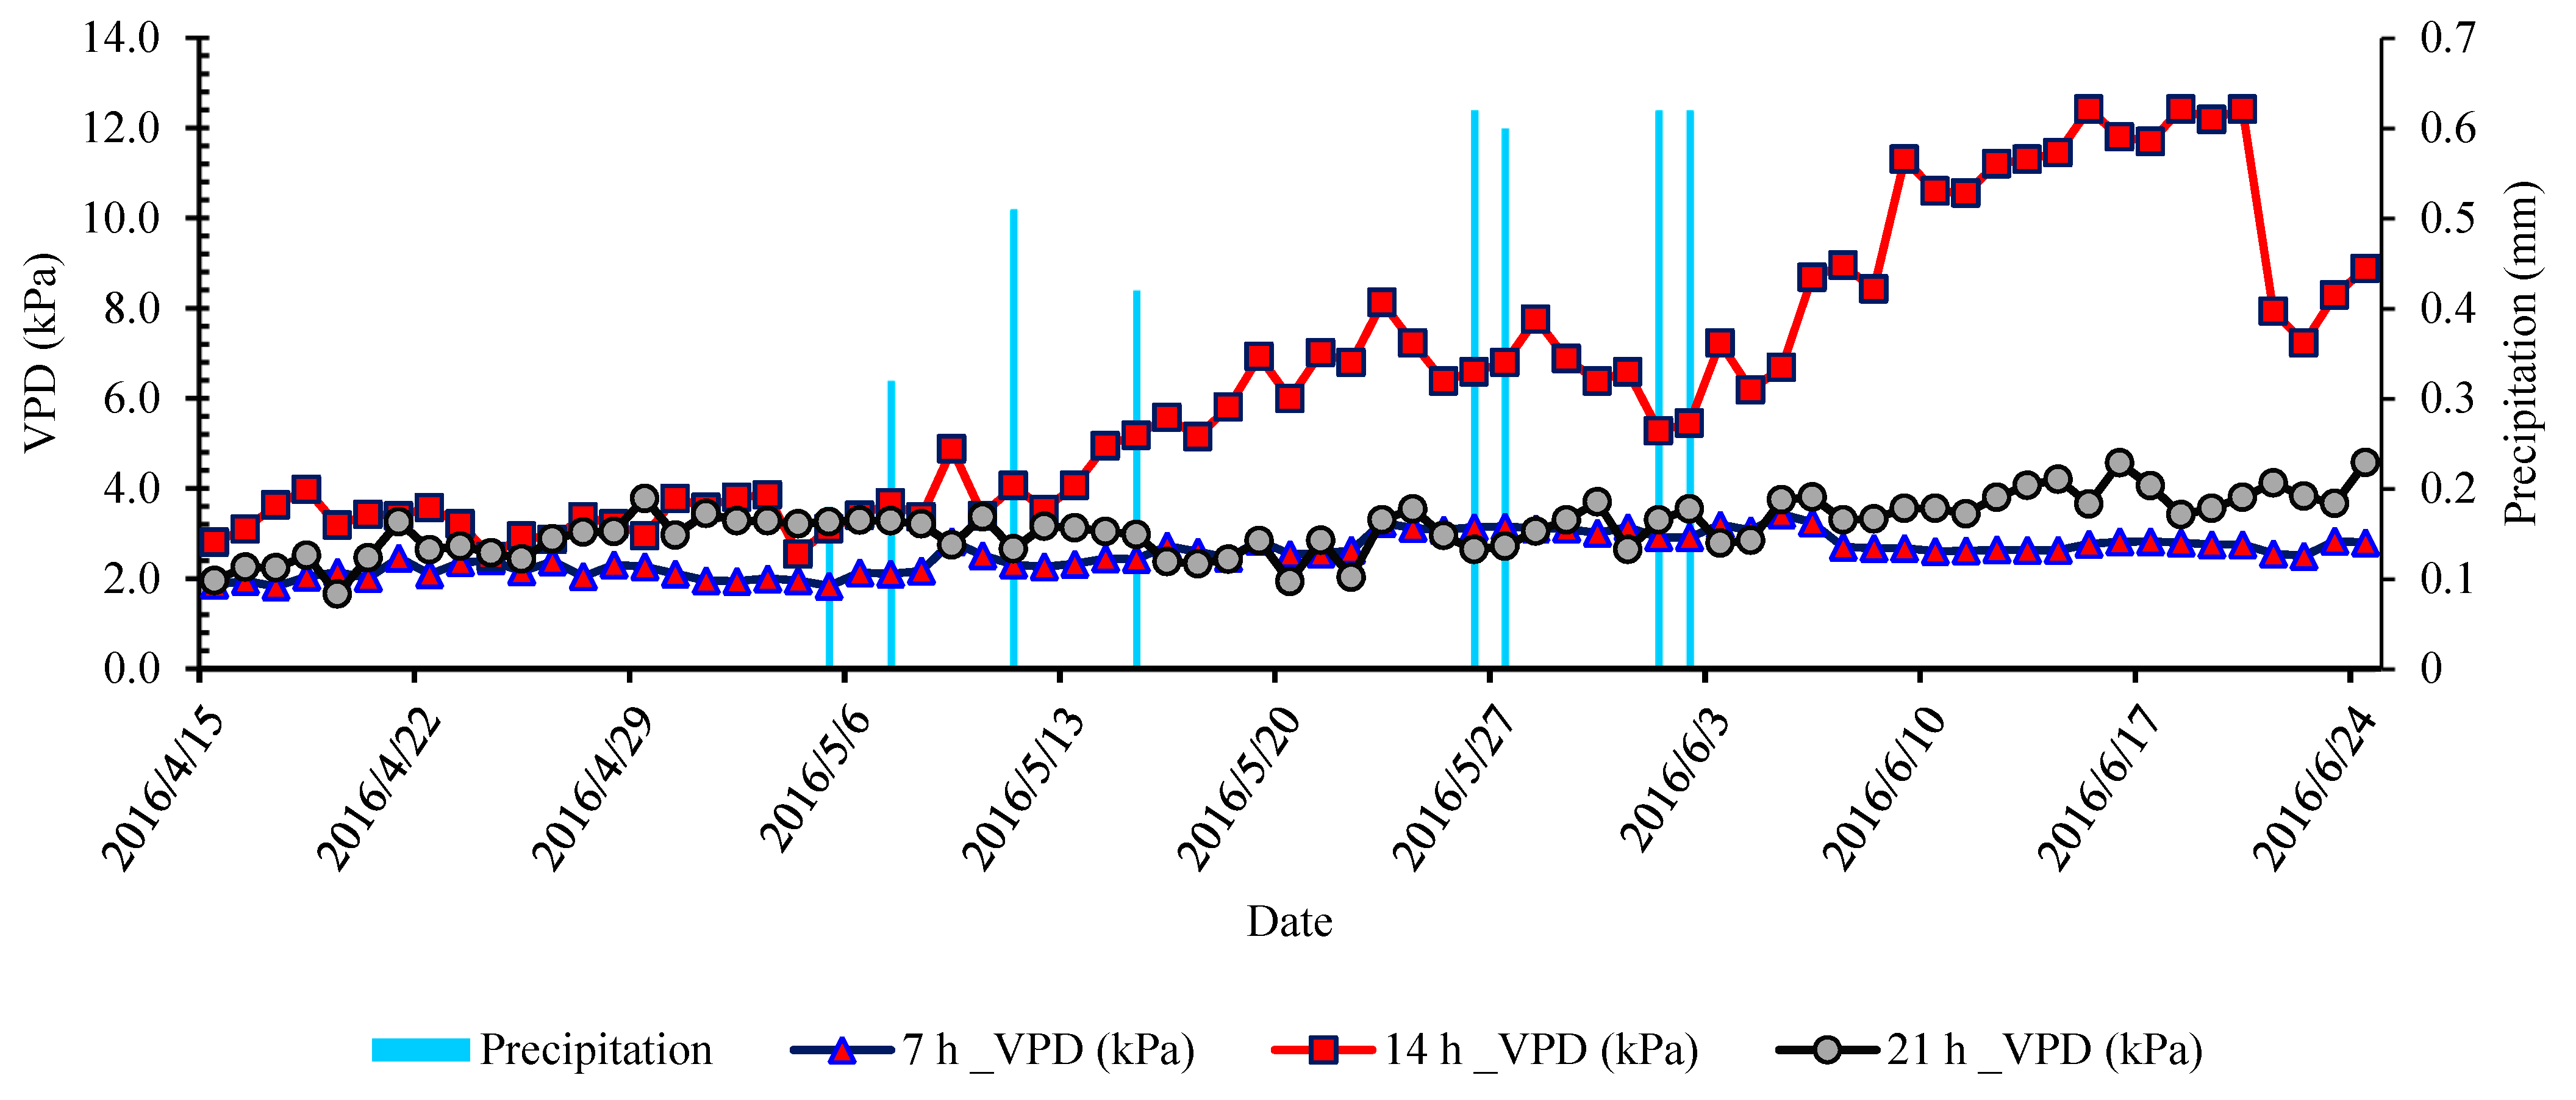
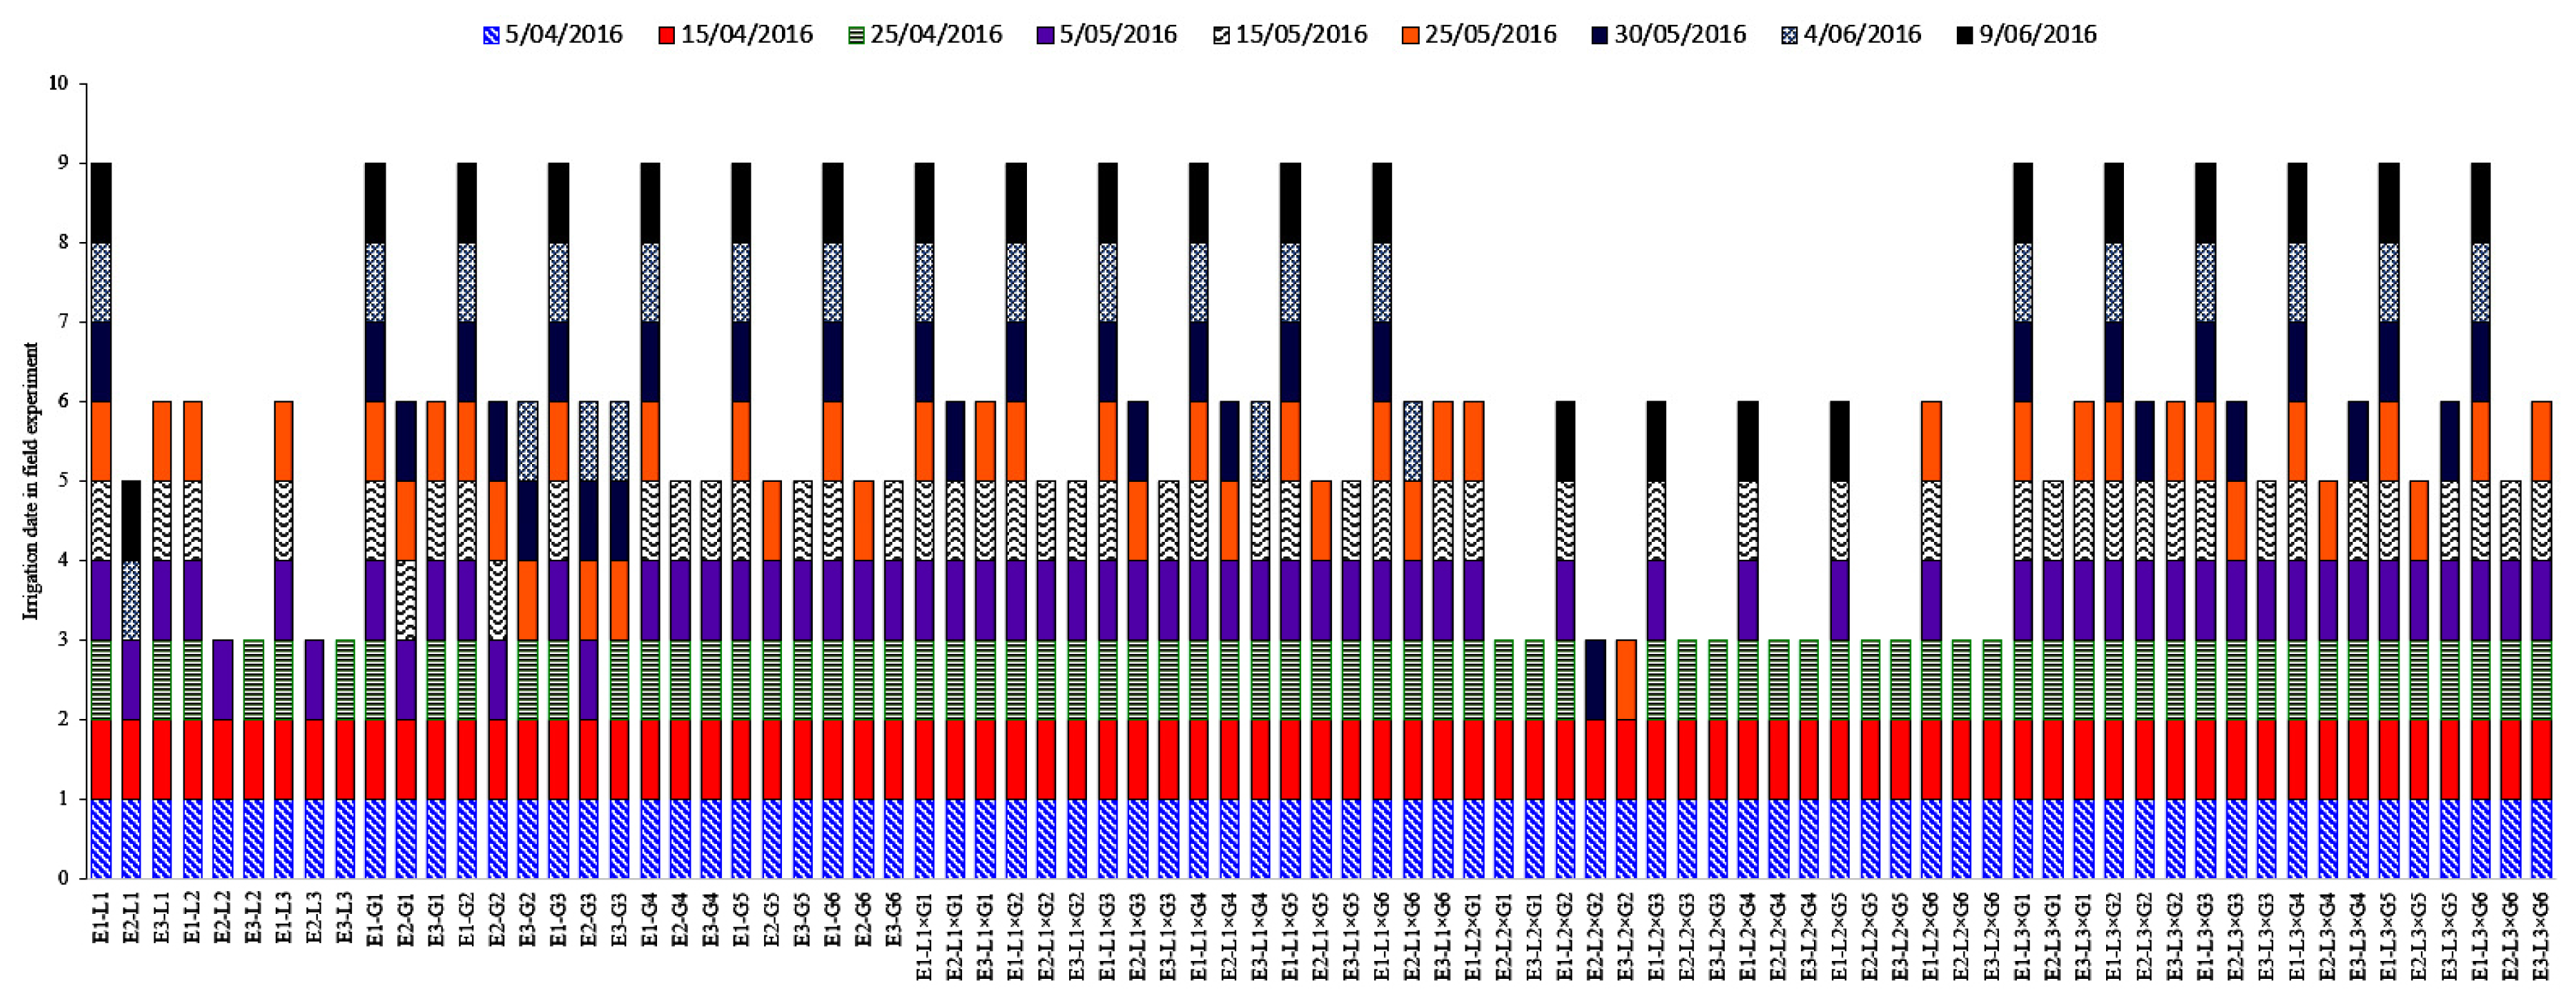
2.2. Experimental Site and Growth Conditions
2.3. Seed Yield Measurement
2.4. Essential Oil Extraction
2.5. Fatty Acid Extraction
2.6. Statistical Analysis
2.6.1. Analysis of Variance
2.6.2. Test for Epistasis
2.6.3. Individual Genotypic Epistasis
2.6.4. Additive Dominance Model
Estimation of the Additive (D) and Dominance (H) Variance Components of Variation
Average Degree of Dominance
Direction of Dominance
Broad-Sense Heritability and Narrow-Sense Heritability
3. Results
3.1. Irrigation Regime Influence on Measured Traits
3.2. Detection of Epistasis
3.3. Additive and Dominance Components
4. Discussion
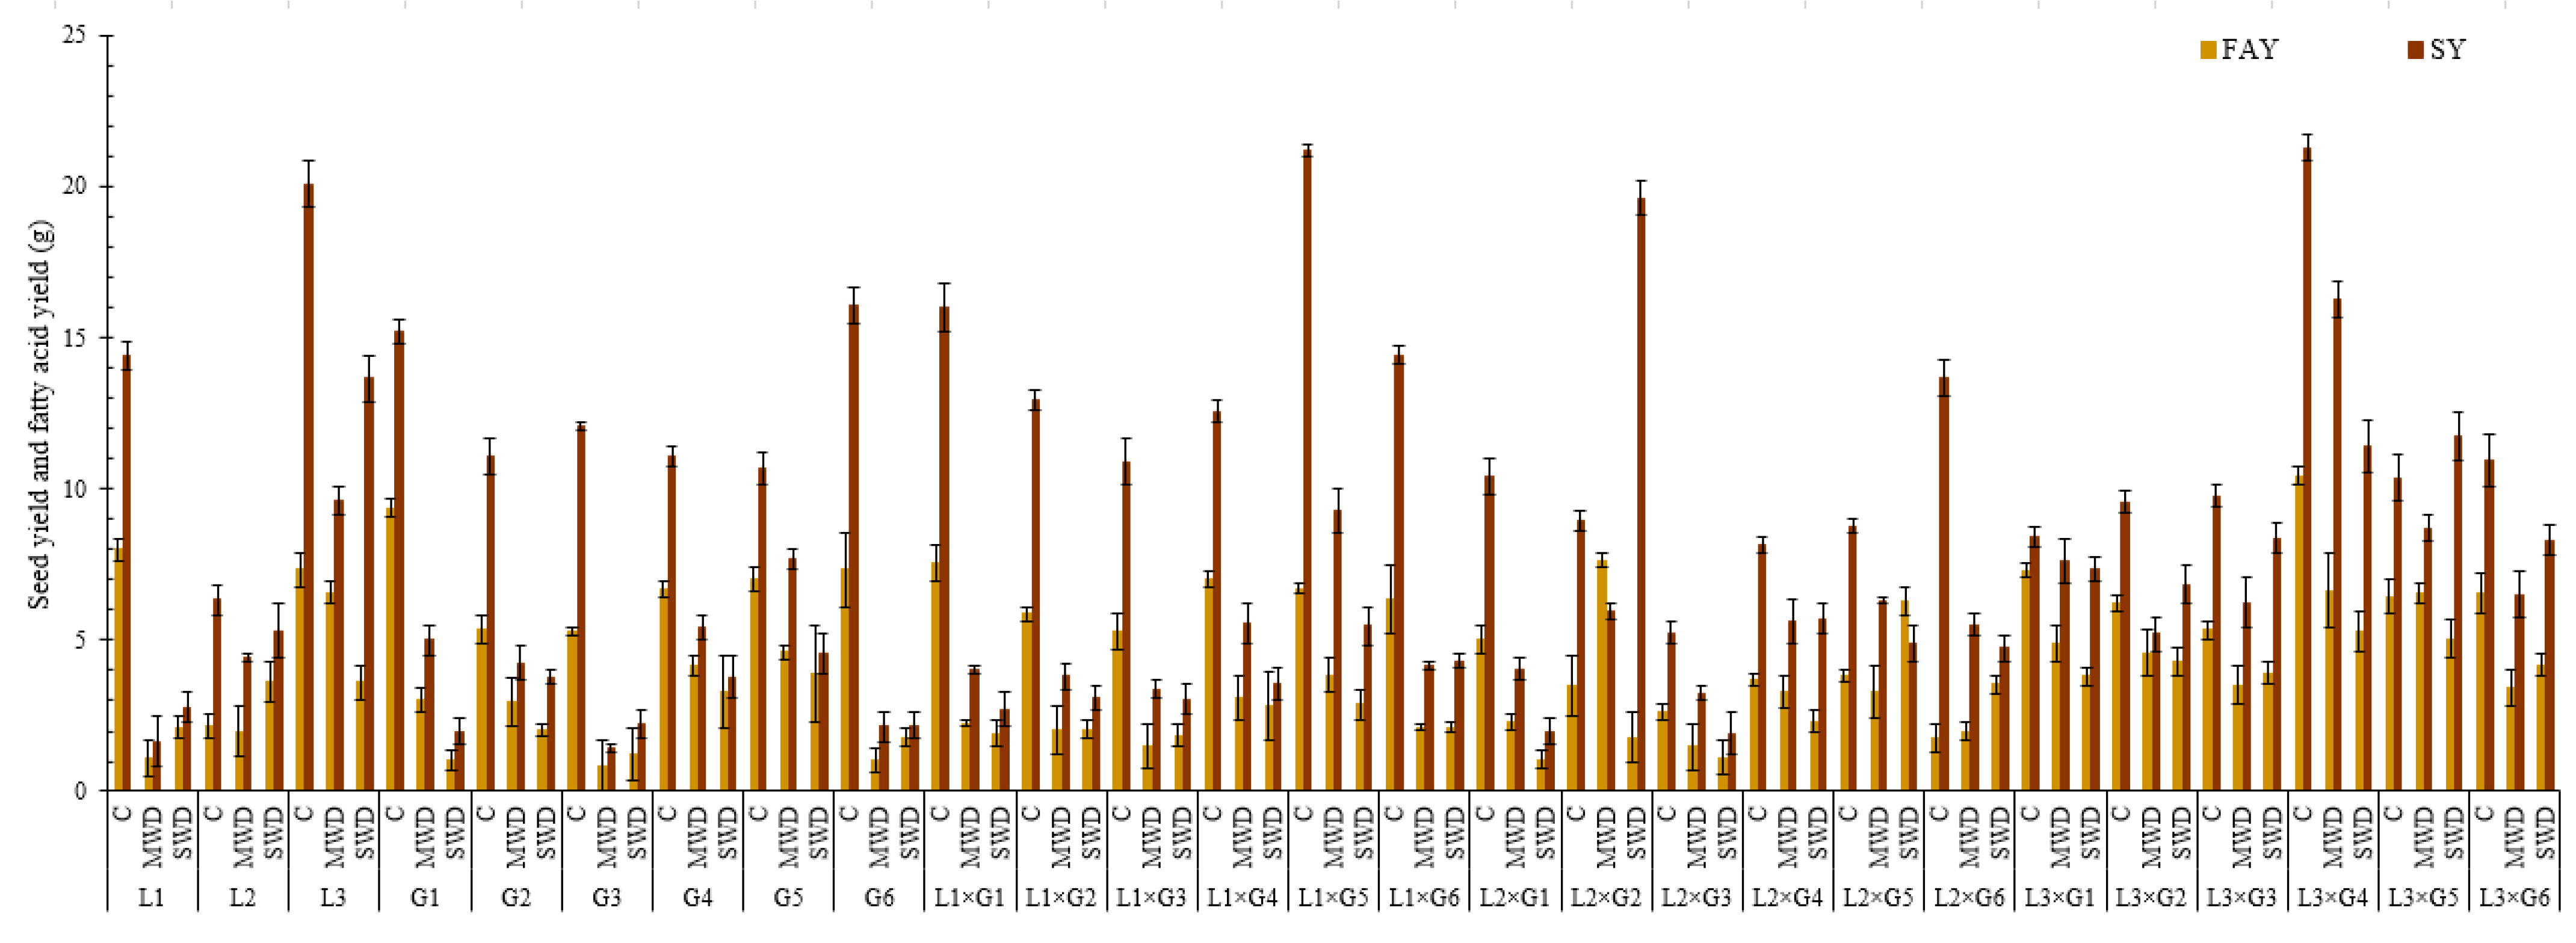
4.1. Seed Yield
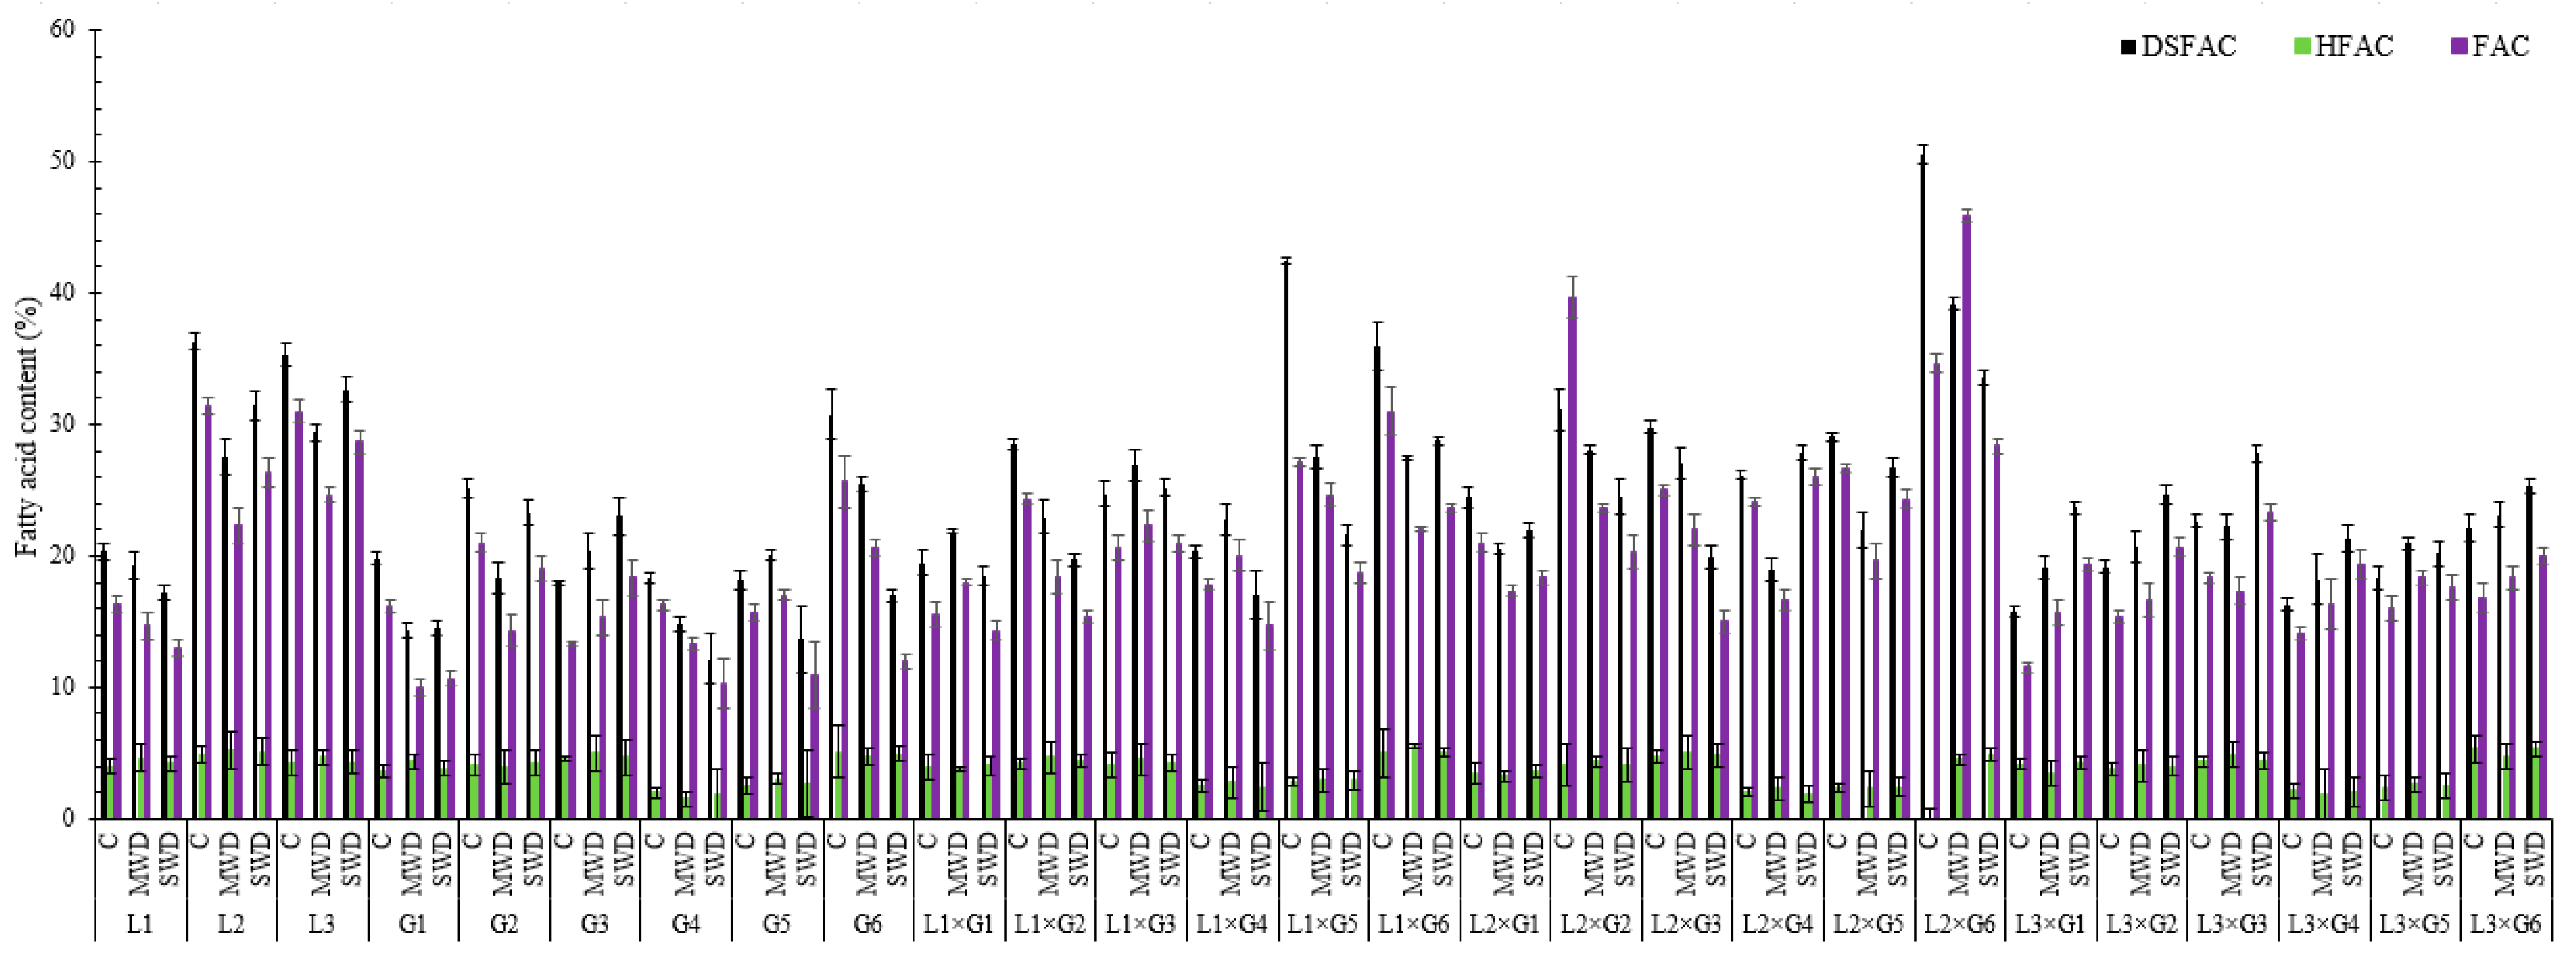
4.2. Fatty Acid Content
4.3. Essential Oil Content
4.4. Epistatic Deviations of Individual Coriander Genotypes
5. Conclusions
Author Contributions
Funding
Institutional Review Board Statement
Informed Consent Statement
Data Availability Statement
Conflicts of Interest
References
- Msaada, K.; Hosni, K.; Taarit, M.B.; Chahed, T.; Hammami, M.; Marzouk, B. Changes in fatty acid composition of coriander (Coriandrum sativum L.) fruit during maturation. Ind. Crop Prod. 2009, 29, 269–274. [Google Scholar] [CrossRef]
- Murphy, D. Designer oilseed crops. Genetic engineering of new oilseed crops for edible and non-edible applications. Agrofoodindustry hi-Tech. 1991, 2, 5–9. [Google Scholar]
- Moser, B.R.; Vaughn, S.F. Coriander seed oil methyl esters as biodiesel fuel: Unique fatty acid composition and excellent oxidative stability. Biomass Bioenergy 2010, 34, 550–558. [Google Scholar] [CrossRef]
- Evangelista, R.L.; Hojilla-Evangelista, M.P.; Cermak, S.C.; Isbell, T.A. Dehulling of coriander fruit before oil extraction. Ind. Crop Prod. 2015, 69, 378–384. [Google Scholar] [CrossRef]
- Lubbe, A.; Verpoorte, R. Cultivation of medicinal and aromatic plants for specialty industrial materials. Ind. Crop Prod. 2011, 34, 785–801. [Google Scholar] [CrossRef]
- Khodadadi, M.; Dehghani, H.; Jalali-Javaran, M.; Rashidi-Monfared, S.; Christopher, J.T. Numerical and graphical assessment of relationships between traits of the Iranian Coriandrum sativum L. core collection by considering genotype × irrigation interaction. Sci. Hortic. 2016, 200, 73–82. [Google Scholar] [CrossRef]
- Bettaieb, I.; Knioua, S.; Hamrouni, I.; Limam, F.; Marzouk, B. Water-deficit impact on fatty acid and essential oil composition and antioxidant activities of cumin (Cuminum cyminum L.) aerial parts. J. Agric. Food Chem. 2011, 59, 328–334. [Google Scholar] [CrossRef] [PubMed]
- Gholizadeh, A.; Dehghani, H.; Khodadadi, M.; Gulick, P.J. Genetic combining ability of coriander genotypes for agronomic and phytochemical traits in response to contrasting irrigation regimes. PLoS ONE 2018, 13, e0199630. [Google Scholar] [CrossRef]
- Rebey, I.B.; Jabri-Karoui, I.; Hamrouni-Sellami, I.; Bourgou, S.; Limam, F.; Marzouk, B. Effect of drought on the biochemical composition and antioxidant activities of cumin (Cuminum cyminum L.) seeds. Ind. Crop Prod. 2012, 36, 238–245. [Google Scholar] [CrossRef]
- Alinian, S.; Razmjoo, J. Phenological, yield, essential oil yield and oil content of cumin accessions as affected by irrigation regimes. Ind. Crop Prod. 2014, 54, 167–174. [Google Scholar] [CrossRef]
- Rotundo, J.L.; Westgate, M.E. Meta-analysis of environmental effects on soybean seed composition. Field Crop Res. 2009, 110, 147–156. [Google Scholar] [CrossRef]
- Bettaieb, I.; Zakhama, N.; Wannes, W.A.; Kchouk, M.; Marzouk, B. Water deficit effects on Salvia officinalis fatty acids and essential oils composition. Sci. Hortic. 2009, 120, 271–275. [Google Scholar] [CrossRef]
- Laribi, B.; Bettaieb, I.; Kouki, K.; Sahli, A.; Mougou, A.; Marzouk, B. Water deficit effects on caraway (Carum carvi L.) growth, essential oil and fatty acid composition. Ind. Crop Prod. 2009, 30, 372–379. [Google Scholar] [CrossRef]
- Ekren, S.; Sönmez, Ç.; Özçakal, E.; Kurttaş, Y.S.K.; Bayram, E.; Gürgülü, H. The effect of different irrigation water levels on yield and quality characteristics of purple basil (Ocimum basilicum L.). Agric. Water Manag. 2012, 109, 155–161. [Google Scholar] [CrossRef]
- Sangwan, N.; Farooqi, A.; Shabih, F.; Sangwan, R. Regulation of essential oil production in plants. Plant Growth Regul. 2001, 34, 3–21. [Google Scholar] [CrossRef]
- Leilah, A.; Al-Khateeb, S. Statistical analysis of wheat yield under drought conditions. J. Arid. Environ. 2005, 61, 483–496. [Google Scholar] [CrossRef]
- Upadhyaya, H.D.; Nigam, S.N. Epistasis for vegetative and reproductive traits in peanut. Crop Sci. 1998, 38, 44–49. [Google Scholar] [CrossRef]
- Sood, S.; Kalia, N.; Bhateria, S.; Kumar, S. Detection of genetic components of variation for some biometrical traits in Linum usitatissimum L. in sub-mountain Himalayan region. Euphytica 2007, 155, 107–115. [Google Scholar] [CrossRef]
- Khattak, G.; Haq, M.; Ashraf, M.; McNeilly, T. Genetic basis of variation of yield, and yield components in mungbean (Vigna radiata (L.) Wilczek). Hereditas 2001, 134, 211–217. [Google Scholar] [CrossRef]
- Barona, M.A.A.; Filho, J.M.C.; da Silva Santos, V.; Geraldi, I.O. Epistatic effects on grain yield of soybean [Glycine max (L.) Merrill]. Crop Breed. Appl. Biotechnol. 2012, 12, 231–236. [Google Scholar] [CrossRef] [Green Version]
- Patel, A.; Mehta, D.; Bhatia, V.; Vaddoria, M. Triple test cross analysis for fruit yield and some component characters in okra [Abelmoschus esculentus (L.) Moench]. Natl. J. Plant Improv. 2007, 9, 111–114. [Google Scholar]
- Saleem, M.; Atta, B.; Cheema, A.; Haq, M. Genetics of panicle-related traits of agronomic importance in rice through triple test cross analysis. Span. J. Agric. Res. 2005, 3, 402–409. [Google Scholar] [CrossRef] [Green Version]
- Khan, A.A.; McNeilly, T. Triple test cross analysis for salinity tolerance based upon seedling root length in maize (Zea mays L.). Breed. Sci. 2005, 55, 321–325. [Google Scholar] [CrossRef] [Green Version]
- Keerthi, C.; Ramesh, S.; Byregowda, M.; Chandrakant, N.; Vaijayanthi, P.; Shivakumar, M.; Mohan Rao, A. Epistasis-driven bias in the estimates of additive and dominance genetic variance in Dolichos Bean (Lablab purpureus L.) Var. Lignosus. J. Crop Improv. 2015, 29, 542–564. [Google Scholar] [CrossRef]
- Khattak, G.; Haq, M.; Ashraf, M.; Tahir, G. Triple test cross analysis for some morphological traits in mungbean (Vigna radiata (L.) Wilczek). Euphytica 2002, 126, 413–420. [Google Scholar] [CrossRef]
- Khattak, G.S.; Haq, M.A.; Ashraf, M.; Khan, A.J.; Zamir, R. Genetic architecture of secondary yield components in mungbean (Vigna radiata (L.) Wilczek). Breed. Sci. 2002, 52, 235–241. [Google Scholar] [CrossRef] [Green Version]
- Upadhyaya, H.D.; Nigam, S.N. Detection of epistasis for protein and oil contents and oil quality parameters in peanut. Crop Sci. 1999, 39, 115–118. [Google Scholar] [CrossRef]
- Ketata, H.; Smith, E.; Edwards, L.; McNew, R. Detection of Epistatic, Additive, and Dominance Variation in Winter Wheat (Triticum aestivum L. em Thell.). Crop Sci. 1976, 16, 1–4. [Google Scholar] [CrossRef]
- Jinks, J.; Perkins, J.M.; Breese, E. A general method of detecting additive, dominance and epistatic variation for metrical traits II. Application to inbred lines. Heredity 1969, 24, 45–57. [Google Scholar] [CrossRef] [Green Version]
- Kearsey, M.; Jinks, J. A general method of detecting additive, dominance and epistatic variation for metrical traits I. Theory. Heredity 1968, 23, 403–409. [Google Scholar] [CrossRef] [Green Version]
- Mehravi, S.; Ranjbar, G.A.; Mirzaghaderi, G.; Severn-Ellis, A.A.; Scheben, A.; Edwards, D.; Batley, J. De Novo SNP Discovery and Genotyping of Iranian Pimpinella Species Using ddRAD Sequencing. Agronomy 2021, 11, 1342. [Google Scholar] [CrossRef]
- Khodadadi, M.; Dehghani, H.; Javaran, M.J.; Christopher, J.T. Fruit yield, fatty and essential oils content genetics in coriander. Ind. Crop Prod. 2016, 94, 72–81. [Google Scholar] [CrossRef]
- Singh, R.; Chaudhary, B. Biometrical Methods in Quantitative Genetic Analysis; Kalyani Publication: New Dehli, India, 1985; pp. 39–78. [Google Scholar]
- McCann, J.C.; Dalton, T.J.; Mekuria, M. Breeding for Africa’s new smallholder maize paradigm. Int. J. Agric. Sustain. 2006, 4, 99–107. [Google Scholar] [CrossRef]
- Duan, B.; Yang, Y.; Lu, Y.; Korpelainen, H.; Berninger, F.; Li, C. Interactions between drought stress, ABA and genotypes in Picea asperata. J. Exp. Bot. 2007, 58, 3025–3036. [Google Scholar] [CrossRef] [Green Version]
- Tefera, H.; Peat, W. Genetics of grain yield and other agronomic characters in t’ef (Eragrostis tef Zucc Trotter). II. The triple test cross. Euphytica 1997, 96, 193–202. [Google Scholar] [CrossRef]
- Wolf, D.P.; Hallauer, A.R. Triple testcross analysis to detect epistasis in maize. Crop Sci. 1997, 37, 763–770. [Google Scholar] [CrossRef]
- Pooni, H.; Jinks, J. The efficiency and optimal size of triple test cross designs for detecting epistatic variation. Heredity 1976, 36, 215–227. [Google Scholar] [CrossRef] [Green Version]
- Cockerham, C.C. An extension of the concept of partitioning hereditary variance for analysis of covariances among relatives when epistasis is present. Genetics 1954, 39, 859. [Google Scholar] [CrossRef] [PubMed]
- Sriti, J.; Wannes, W.A.; Talou, T.; Mhamdi, B.; Hamdaoui, G.; Marzouk, B. Lipid, fatty acid and tocol distribution of coriander fruit’s different parts. Ind. Crop Prod. 2010, 31, 294–300. [Google Scholar] [CrossRef]
- Subbaraman, N.; Rangasamy, S.S. Triple test cross analysis in rice. Euphytica 1989, 42, 35–40. [Google Scholar] [CrossRef]
- Gholizadeh, A.; Dehghani, H.; Khodadadi, M. Quantitative genetic analysis of water deficit tolerance in coriander through physiological traits. Plant Genet. Resour. 2019, 17, 255–264. [Google Scholar] [CrossRef]
- Khattak, G.; Haq, M.; Ashraf, M.; Tahir, G.; Marwat, E. Detection of epistasis, and estimation of additive and dominance components of genetic variation for synchrony in pod maturity in mungbean (Vigna radiata (L.) Wilczek). Field Crop Res. 2001, 72, 211–219. [Google Scholar] [CrossRef]
- Mather, K.; Jinks, J. Biometrical Genetics; Chapman and Hall Ltd.: London, UK, 1971; pp. 14–19. [Google Scholar]
- Pooni, H.; Kumar, I.; Khush, G. A general method of detecting additive, dominance and epistatic variation for metrical traits. V. Triple test cross analysis of disomically inherited traits expressed in triploid tissues. Heredity 1994, 72, 563–569. [Google Scholar] [CrossRef] [Green Version]
- Devey, F.; Hayward, M.; Kearsey, M.; McAdam, N.; Eggleston, M. Genetic Analysis of Production Characters in Lolium: II. Triple Test Cross Analysis of Drill and Plot Performance. Plant Breed. 1989, 103, 63–72. [Google Scholar] [CrossRef]


| Source of Variation | df | Sum | Difference | ||
|---|---|---|---|---|---|
| MS | Expected MS | MS | Expected MS | ||
| Replications | r − 1 | MSr | MSr | ||
| Sums (L1i + L2i) | n − 1 | MSs | |||
| Difference (L1i – L2i) | n − 1 | MSd | |||
| Error | (r − 1)(n − 1) | MSe | MSe | ||
| Source of Variation | Mean Squares | |||||||||||||||||
|---|---|---|---|---|---|---|---|---|---|---|---|---|---|---|---|---|---|---|
| Epistasis | [i] Type Interaction | [j + l] Type Interaction | Epistasis × Replication | [i] Type × Replication | [j + l] Type × Replication | |||||||||||||
| WT. | C | MWD | SWD | C | MWD | SWD | C | MWD | SWD | C | MWD | SWD | C | MWD | SWD | C | MWD | SWD |
| d.f. Trait | 6 | 6 | 6 | 1 | 1 | 1 | 5 | 5 | 5 | 12 | 12 | 12 | 2 | 2 | 2 | 10 | 10 | 10 |
| SY | 18.51 ** | 77.88 ** | 103.38 ** | 77.33 ns | 434.63 ** | 551.08 ** | 6.82 ** | 6.52 * | 13.81 ** | 3.51 | 2.11 | 0.32 | 16.77 | 2.71 | 0.31 | 0.91 | 1.93 | 0.20 |
| PODS | 1372.22 ** | 171.11 ns | 231.27 ns | 409.02 ** | 576.98 ns | 472.32 ns | 1564.89 ** | 89.91 ns | 183.08 ns | 111.60 | 126.45 | 113.48 | 4.96 | 131.09 | 123.63 | 1.54 | 125.54 | 111.39 |
| POSH | 21.26 ns | 257.27 ns | 911.63 ** | 10.04 ns | 433.64 ns | 343.26 ns | 23.51 ns | 221.93 ns | 1025.37 ** | 8.41 | 147.22 | 114.25 | 5.01 | 157.28 | 98.27 | 9.56 | 85.28 | 117.42 |
| EOC | 0.01 ** | 0.06 ** | 0.04 * | 0.008 ns | 0.32 ** | 0.07 * | 0.01 ** | 0.02 ns | 0.03 * | 0.002 | 0.005 | 0.01 | 0.0004 | 0.002 | 0.03 | 0.003 | 0.005 | 0.007 |
| EOY | 13.01 ** | 1.12 ** | 6.11 ** | 27.18 ** | 4.63 ** | 27.08 ** | 10.10 ** | 0.42 ns | 1.86 * | 0.20 | 0.10 | 0.62 | 0.20 | 0.11 | 0.90 | 0.20 | 0.11 | 0.62 |
| DSFAC | 1946.16 ** | 352.36 * | 94.60 ns | 8984.87 ** | 1607.40 ** | 0.10 ns | 149.16 ** | 101.30 ns | 113.53 ns | 43.83 | 104.58 | 53.89 | 106.64 | 37.77 | 83.12 | 31.22 | 117.87 | 48.03 |
| HFAC | 1.32 ns | 1.50 ** | 0.34 ns | 0.05 ns | 3.61 ** | 0.02 ns | 1.55 ns | 1.11 ** | 0.44 ns | 0.52 | 0.002 | 0.21 | 0.02 | 0.0005 | 0.01 | 0.70 | 0.002 | 0.20 |
| FAC | 1962.58 ** | 329.77 * | 198.41 * | 9028.72 ** | 1458.08 ** | 0.05 ns | 549.31 ** | 104.00 ns | 238.10 * | 43.85 | 104.59 | 54.20 | 107.47 | 37.53 | 83.44 | 31.18 | 117.99 | 48.48 |
| FAY | 12,322.17 ** | 12,667.25 * | 84,002.48 ** | 38,567.90 ** | 71,297.22 ** | 385,980.70 ** | 7072.90 ** | 941.22 ns | 23,606.77 ** | 1119.22 | 3167.17 | 1975.77 | 1119.29 | 2236.47 | 6378.73 | 1119.22 | 3353.23 | 1095.11 |
| Source of Variation | Mean Squares | |||||
|---|---|---|---|---|---|---|
| Epistasis | [i] Type Epistasis | [j + l] Type Epistasis | Epistasis × WT | [i] Type × WT | [j + l] Type × WT | |
| d.f. Trait | 6 | 1 | 5 | 12 | 2 | 10 |
| SY | 225.82 | 145.86 | 241.81 | 152.42 ** | 187.23 ** | 19.88 ns |
| PODS | 189.47 | 112.33 | 204.88 | 324.57 ** | 224.85 * | 169.90 ** |
| POSH | 324.18 | 247.89 | 339.49 | 511.18 ** | 105.46 ns | 367.11 ** |
| EOC | 211.99 | 199.67 | 214.47 | 355.82 ** | 41.82 ns | 87.75 ** |
| EOY | 77.73 | 41.32 | 85.08 | 114.49 ** | 30.27 ns | 36.56 ** |
| DSFAC | 2645.57 | 1365.48 | 2901.58 | 888.77 ** | 523.22 ** | 654.59 ** |
| HFAC | 3542.38 | 2888.86 | 3673.04 | 5124.36 ** | 2689.74 ** | 2153.34 ** |
| FAC | 4589.26 | 4122.39 | 4682.66 | 2158.28 ** | 2654.36 ** | 1458.27 ** |
| FAY | 11,1256.74 | 13,518.32 | 130,804.47 | 10,989.88 ** | 45,856.38 ** | 11,567.30 ** |
| Source of Variation | Mean Squares Due to | |||||||||||
|---|---|---|---|---|---|---|---|---|---|---|---|---|
| Additive Component | Dominance Component | |||||||||||
| Sums (L1i + L2i) | Sums × Replication | Differences (L1i − L2i) | Difference × Replication | |||||||||
| WT. | C | MWD | SWD | C | MWD | SWD | C | MWD | SWD | C | MWD | SWD |
| d.f. Trait | 5 | 5 | 5 | 10 | 10 | 10 | 5 | 5 | 5 | 10 | 10 | 10 |
| SY | 19.71 ** | 7.18 ** | 3.31 ** | 1.40 | 1.06 | 0.22 | 3.71 ns | 0.31 ns | 0.22 ns | 1.30 | 0.20 | 0.21 |
| PODS | 980.85 ** | 1410.10 ** | 952.15 ** | 7.71 | 0.54 | 0.40 | 1631.00 ** | 322.97 ** | 118.96 ** | 3.53 | 0.20 | 0.43 |
| POSH | 881.43 ** | 1124.33 ** | 841.66 ** | 6.73 | 1.33 | 0.12 | 1423.24 ** | 258.22 ** | 241.45 ** | 5.11 | 2.23 | 0.70 |
| EOC | 0.08 ** | 0.04 ** | 0.05 ** | 0.01 | 0.003 | 0.007 | 0.003 ns | 0.01 ns | 0.01 ns | 0.006 | 0.004 | 0.004 |
| EOY | 1.51 * | 1.25 ** | 0.92 ** | 0.34 | 0.14 | 0.04 | 0.08 * | 0.11 ns | 0.20 ns | 0.02 | 0.06 | 0.09 |
| DSFAC | 785.77 ** | 249.31 ** | 176.55 ** | 15.72 | 38.04 | 28.84 | 251.40 ns | 121.68 * | 81.86 ns | 86.66 | 29.45 | 38.98 |
| HFAC | 12.64 ** | 14.34 ** | 14.74 ** | 0.004 | 0.001 | 0.001 | 0.63 ** | 0.71 ** | 0.62 ** | 0.004 | 0.001 | 0.003 |
| FAC | 719.49 ** | 173.96 * | 150.19 * | 15.73 | 38.03 | 28.73 | 248.95 ns | 127.88 * | 95.01 ns | 86.47 | 29.41 | 38.66 |
| FAY | 8150.11 ** | 2863.10 * | 1690.64 * | 592.50 | 703.11 | 359.48 | 4449.79 * | 907.07 ** | 431.90 * | 861.96 | 78.48 | 116.85 |
| Source of Variation | Mean Squares | |||||
|---|---|---|---|---|---|---|
| Additive Component | Dominance Component | |||||
| Sum | Sum × WT | Blocks (WT) | Difference | Difference × WT | Blocks (WT) | |
| d.f. Trait | 5 | 10 | 30 | 5 | 10 | 30 |
| SY | 21.84 ** | 8.06 * | 3.34 | 1.81 * | 1.47 * | 0.65 |
| PODS | 234.41 ns | 6444.36 * | 95.32 | 836.32 ** | 1002.51 ** | 183.25 |
| POSH | 562.36 ** | 789.35 ** | 121.32 | 697.45 ** | 793.11 ** | 148.36 |
| EOC | 0.07 ns | 0.10 ns | 0.05 | 0.01 ns | 0.02 ns | 0.01 |
| EOY | 1.04 ns | 1.17 ns | 0.63 | 0.16 * | 0.23 ** | 0.05 |
| DSFAC | 452.85 ** | 558.45 ** | 88.63 | 236.41 * | 367.77 ** | 78.92 |
| HFAC | 8.87 ns | 10.23 ns | 5.18 | 0.70 ns | 1.12 ** | 0.35 |
| FAC | 698.11 ** | 878.32 ** | 149.85 | 187.35 * | 287.21 ** | 65.23 |
| FAY | 6808.20 * | 8947.05 ** | 2174.65 | 3663.13 ** | 1062.01 ** | 754.10 |
| Genetic Component | Estimates | WT. | PODS | POSH | DSFAC | HFAC |
|---|---|---|---|---|---|---|
| Additive variance (VA) | (1/2) D | C | - | 648.7 ** | - | - |
| MWD | 939.6 ** | 939.6 ** | - | 9.6 ** | ||
| SWD | 561.1 ** | - | 98.4 ** | - | ||
| Dominance variance (VD) | (1/4) H | C | - | 542.5 ** | - | - |
| MWD | 107.6 ** | 107.6 ** | - | 0.25 ** | ||
| SWD | 117.5 ** | - | 14.3 ** | - | ||
| Dominance ratio () | C | - | 0.91 | - | - | |
| MWD | 0.34 | 0.33 | - | 0.16 | ||
| SWD | 0.46 | - | 0.38 | - | ||
| Narrow-sense heritability | VA/VP | C | - | 0.54 | - | - |
| MWD | 0.90 | 0.90 | - | 0.67 | ||
| SWD | 0.82 | - | 0.56 | - | ||
| Broad-sense heritability | VG/VP | C | - | 0.90 | - | - |
| MWD | 0.95 | 0.95 | - | 0.78 | ||
| SWD | 0.88 | - | 0.64 | - |
| Genotypes | SY | PODS | POSH | EOC | EOY | ||||||||||
| C | MWD | SWD | C | MWD | SWD | C | MWD | SWD | C | MWD | SWD | C | MWD | SWD | |
| TN-59-80 | −3.20 * | −3.23 ** | −4.48 ** | 0.67 ns | - | - | - | - | 24.77 ** | −0.05 ** | 0.06 ** | 0.05 ns | −0.81 ** | −0.69 ** | −0.68 ns |
| TN-59-160 | −3.10 * | −4.55 ** | −4.73 ** | −13.13 ** | - | - | - | - | −12.30 ** | −0.01 ns | 0.08 ** | 0.06 ns | −0.76 * | −0.62 ** | −0.78 ns |
| TN-59-353 | −2.33 ns | −6.87 ** | −4.67 ** | −2.37 ** | - | - | - | - | 28.57 ** | 0.14 ** | 0.28 ** | 0.28 ** | −4.94 ** | 0.61 ** | −1.96 ** |
| TN-59-347 | −1.90 ns | −5.17 ** | −9.90 ** | 13.17 ** | - | - | - | - | −2.63 ns | −0.02 ns | 0.08 ** | −0.03 ns | −0.37 ns | −1.01 ** | −1.54 ** |
| TN-59-10 | 0.83 ns | −4.82 ** | −4.62 ** | 46.23 ** | - | - | - | - | −8.60 ** | 0.01 ns | 0.13 ** | 0.01 ns | −0.20 ns | −0.31 ns | −1.06 * |
| Commercial | −2.73 * | −4.05 ** | −4.80 ** | −15.97 ** | - | - | - | - | 0.93 ns | 0.05 ** | 0.07 ** | 0.01 ns | −0.26 ns | −0.40 ns | −0.92 * |
| Genotypes | DSFAC | HFAC | FAC | FAY | |||||||||||
| C | MWD | SWD | C | MWD | SWD | C | MWD | SWD | C | MWD | SWD | ||||
| TN-59-80 | 42.30 ** | 20.44 ** | - | - | 0.44 ** | - | 43.25 ** | 20.00 ** | 12.33 ** | 62.53 ** | −33.40 ns | −75.78 * | |||
| TN-59-160 | 21.39 ** | 9.60 ** | - | - | 0.94 ** | - | 20.79 ** | 8.67 ** | −5.67 ** | 27.56 ns | −55.57 ns | −126.80 ** | |||
| TN-59-353 | 34.82 ** | 7.67 ** | - | - | 0.01 ns | - | 34.29 ** | 7.67 ** | 7.67 ** | 92.46 ** | −177.00 ** | −322.20 ** | |||
| TN-59-347 | 13.89 ** | 5.39 ns | - | - | 1.39 ** | - | 13.62 ** | 4.00 ns | 2.00 ns | 33.00 ns | −80.30 * | −135.82 ** | |||
| TN-59-10 | 12.47 ** | 4.12 ns | - | - | 0.12 ** | - | 13.43 ** | 4.00 ns | −6.00 ** | 95.90 ** | −71.28 * | −100.08 ** | |||
| Commercial | 9.17 ** | 9.47 ** | - | - | −0.19 ** | - | 9.01 ** | 9.67 ** | −10.67 ** | −33.73 ns | −58.33 * | −117.93 ** | |||
Publisher’s Note: MDPI stays neutral with regard to jurisdictional claims in published maps and institutional affiliations. |
© 2021 by the authors. Licensee MDPI, Basel, Switzerland. This article is an open access article distributed under the terms and conditions of the Creative Commons Attribution (CC BY) license (https://creativecommons.org/licenses/by/4.0/).
Share and Cite
Hanifei, M.; Mehravi, S.; Khodadadi, M.; Severn-Ellis, A.A.; Edwards, D.; Batley, J. Detection of Epistasis for Seed and Some Phytochemical Traits in Coriander under Different Irrigation Regimes. Agronomy 2021, 11, 1891. https://doi.org/10.3390/agronomy11091891
Hanifei M, Mehravi S, Khodadadi M, Severn-Ellis AA, Edwards D, Batley J. Detection of Epistasis for Seed and Some Phytochemical Traits in Coriander under Different Irrigation Regimes. Agronomy. 2021; 11(9):1891. https://doi.org/10.3390/agronomy11091891
Chicago/Turabian StyleHanifei, Mehrdad, Shaghayegh Mehravi, Mostafa Khodadadi, Anita Alice Severn-Ellis, David Edwards, and Jacqueline Batley. 2021. "Detection of Epistasis for Seed and Some Phytochemical Traits in Coriander under Different Irrigation Regimes" Agronomy 11, no. 9: 1891. https://doi.org/10.3390/agronomy11091891