Article

Genotype, Environment, Year, and Harvest Effects on Fruit Quality Traits of Five Blueberry (Vaccinium corymbosum L.) Cultivars

1
Department of Horticultural Science, North Carolina State University, Raleigh, NC 27695, USA
2
Department of Statistics, North Carolina State University, Raleigh, NC 27695, USA
3
USDA-ARS, National Clonal Germplasm Repository, 33447 Peoria Rd., Corvallis, OR 97333, USA
*
Author to whom correspondence should be addressed.
Professor Emeritus of Horticultural Science.
Agronomy 2021, 11(9), 1788; https://doi.org/10.3390/agronomy11091788
Submission received: 23 July 2021 / Revised: 30 August 2021 / Accepted: 4 September 2021 / Published: 7 September 2021
(This article belongs to the Collection Genetic Diversity Evaluation of the Fruit Trees)

Abstract

:
Blueberries (Vaccinium spp.) comprise a broad range of perennial woody species. Introgression of native species into cultivated germplasm has adapted Vaccinium germplasm to a range of climates and growing conditions for cultivated blueberry. Genetic differences signify phenotypic variance that is observed among blueberry accessions. In addition, variability in geographic and climatic growing conditions between environments or within the same environment across different years may further affect fruit and plant phenotypic expression. As a result, a phenotype is a function of genetic background (G), environment (E), and their interaction (G × E). In addition, other temporally regulated factors such as year (Y) and harvest time (H) impact plant and fruit quality phenotypic variation. Our research aimed to assess the genotypic performance of five blueberry cultivars, including ‘Echota’, ‘O’Neal’, ‘Reveille’, ‘Summit’, and ‘Sunrise’. The selected cultivars were phenotyped for various fruit quality-related traits over two sequential harvests in two years and two locations. Our results indicated that genotype was a significant source of variation for most phenotypic characteristics. Further, the effect of Y × H and G × Y × H significantly affected the majority of studied phenotypic traits. Within the studied genotypes, ‘Reveille’ and ‘O’Neal’ phenotypic stability were consistent across locations and years; additionally, ‘Summit’ phenotypic characteristics were stable across years, environments, and harvests. Clonal plant replicates within a genotype, harvest, and environment, in addition to individual fruit measures, were the most significant sources of variability.

1. Introduction

Within North America, the geographic range of native Vaccinium species ranges from Canada through Mexico, encompassing a broad spectrum of different climatic growing conditions. In the southeastern United States, select native Vaccinium species including V. angustifolium Aiton, V. arboreum Marsh, V. constablaei Gray, V. corymbosum L., V. darrowii Camp, V. elliottii Chapm., V. myrtilloides Michx., V. pallidum Aiton, V. tenellum Aiton, V. simulatum Small, V. stamineum L., and V. virgatum Aiton have been utilized in breeding populations for specific adaptations and trait introgression. Introgression of native species into cultivated germplasm has adapted Vaccinium germplasm to a range of climates and growing conditions for cultivated blueberry, resulting in both low-chill and high-chill adapted cultivars [1,2]). Breeding for low-chill and high-chill cultivation has enabled blueberry production expansion, increasing the geographic range and facilitating fresh market availability year-round due to longer production windows across regions. Furthermore, blueberry production has gained traction due to increased consumer and commercial attention due to recent reports regarding the health benefits of blueberry total anthocyanin content and anthocyanin composition, including aglycone, sugar moiety, and acyl group [3].
Genetic differences signify phenotypic variance and are observed as fruit flavor or size differences between different blueberry accessions. Variability in geographic and climatic growing conditions between environments may further affect fruit and plant phenotypic expression. A comparative study of geographically diverse locations found that blueberry cv. ‘Brightwell’ (V. virgatum) grown in higher altitude environments reported increased total soluble solids (TSS), flavonoids, phenols, proanthocyanidins, and anthocyanins in China [4]. In addition to altitude, environmental differences encompass climatic factors, including temperature and precipitation. Increased TSS can be attributed to decreased fruit volume and moisture loss resulting from reduced rainfall events [5]. Additionally, decreased precipitation during blueberry fruit ripening resulted in small, firm fruit, which correlated with increased soluble solids and acidity [6]. Water deficit treatments also decreased fruit antioxidant levels in blueberry [7]. Alternatively, increased TSS and decreased fruit weight resulted from warmer temperatures in tomato [8]. In addition, temperature also plays a role in anthocyanin content. Genetic control of apple anthocyanin biosynthesis was found to be regulated by temperature [9]. Hot climates decreased the expression of anthocyanin biosynthesis genes, which failed to accumulate red fruit pigmentation in apples grown in hot climates compared to those grown under temperate climate conditions [9].
Phenotypic expression and observed variation of plant growth and development are functions of both genetic background (G) and environment (E) and their interaction (G × E) [10]. Temporal variation can also impact plant and fruit quality phenotypic variation. Temporal regulation includes the effects of the year (Y) and harvest time (H), wherein biotic and abiotic events between years or maturation time between harvests are involved in fruit production and quality differences. Seasonal temperature differences over the years can significantly affect the fruit production of blueberries [11,12,13]. Winter temperatures control dormancy release. Thus, the earlier onset of warmer temperatures exemplified by the three-week earlier snowmelt in Vaccinium myrtillus in Norway in 2011 resulted in two-week earlier blooming compared with the 2010 production season [12]. Furthermore, severe weather events such as spring cold spells can cause significant cold injury to low-chill and precocious blueberry cultivars, impacting yield [14]. In addition to cold-related events, yearly differences in temperature fluctuations and precipitation events, including heatwaves, drought, and flooding, affect developing fruits’ quality [15,16]. Within a harvest season, weekly climate changes and increased growing degree days (GDD) can impact blueberry fruit maturation rates between sequential harvests within the same plant; exemplified by the and cause observed variation in phenolic, acid, and total soluble solid composition between harvests [17]. Within a harvest season, weekly climate changes and increased growing degree days (GDD) can impact blueberry fruit maturation rates between sequential harvests within the same plant; exemplified by the and cause observed variation in phenolic, acid, and total soluble solid composition between harvests [17]. By studying the impact of these interactions on phenotypic traits, we can evaluate factors affecting consistency in genotype performance.
In studying the effects of environment, years, harvests, and genotype on phenotypic traits, our research aimed to assess genotypic performance in select environments and evaluate phenotypic consistency. The cultivars used in this study are highbush blueberry ‘Echota’, ‘O’Neal’, ‘Reveille’, ‘Summit’, and ‘Sunrise’ (Supplementary Figure S1). The southern highbush (SHB) cultivars ‘O’Neal’ and ‘Summit’ have V. darrowii in their pedigrees; ‘Summit’ and ‘Reveille’ also have low-chill V. virgatum introgression; ‘Reveille’ has V. tenellum in its pedigree history. ‘Echota’ is a high-chill northern highbush (NHB) derived from a native low-chill North Carolina V. corymbosum accession (NC102). ‘Sunrise’ is a modern northern highbush cultivar developed from high-chill V. corymbosum parents with pedigrees containing V. angustifolium; as such, ‘Sunrise’ does not have low-chill species in its pedigree history. Using these selected cultivars in both North Carolina and Oregon environments, our research informs on the stability of fourteen phenotypic traits. The phenotypic stability of a trait across environments, years, and harvests indicates a greater emphasis on the genetic control of the trait, which is essential for blueberry genotype uniformity for commercial production. The objectives of this study were to evaluate the genetic consistency of five blueberry cultivars and assess them for phenotypic variation between two environments, two years of research, two sequential harvests per year, and their interactions. Further, we aimed to evaluate the correlation between phenotypic traits. The results of this study may impact blueberry breeding program decision-making for target environments and further identify blueberry production benchmarks for specified traits.

2. Materials and Methods

2.1. Plant Material

Fresh fruits were collected from selected cultivars from two field locations, NC State University (NCSU) Sandhills Research Station located in Jackson Springs, NC (35°11′ N, 79°40′ W and 176 m above sea level) and USDA-ARS National Clonal Germplasm Repository (NCGR) in Corvallis, OR (44°33′ N, 123°13′ W and 74 m above sea level), weekly from May through August in 2019 and 2020. The Jackson Springs soil is Fuquay sand and is amended by pine bark for acidification. The Jackson Springs location was irrigated with a Valley Linear Precision Irrigation system every 7–10 days. The Corvallis site soil is predominantly Malabon silty clay loam with a pH of 4.5–5.5 that is regularly amended with organic sawdust mulching. The Corvallis NCGR farm was irrigated via an underground sprinkler system that was run twice a week.
The studied genotypes consisted of Vaccinium corymbosum SHB, ‘O’Neal’, ‘Reveille’, and ‘Summit’, as well as the NHB ‘Echota’ and ‘Sunrise’. Each cultivar was represented by two clonal replicate plants planted 1 m apart in the field at each fixed location. The fruit ripening window was based on fruit maturity on a per genotype and location basis. Ripe fruits from each plant were harvested for two sequential weeks once the plant achieved a ripeness status of >30% blue fruit. A minimum of ten individual fruits were hand-harvested per clonal replicate of each genotype for each harvest. Fruit collected from Jackson Springs were stored at 4 °C for next-day analysis. Fruit collected at the Corvallis location were harvested and shipped overnight on ice and in refrigerated shipping conditions (4 °C) to the NC State University, Raleigh Campus, Blueberry Genetics and Genomics Laboratory for next-day analysis.
Ten fruit from each clonal replicate were randomly sampled per harvest at each location. The same random sample of fruit was used for firmness, weight, diameter, and puncture measurements; these fruits were later homogenized into a fruit purée for quantitative measurement of the phenotypic traits of TSS and TA. Pooling the fruit samples for colorimetric, TSS, and TA quantitative measures was conducted to ensure sufficient material for their respective procedures.

2.2. Phenotypic Trait Measurements

2.2.1. Colorimetric Analysis

Color indices were quantified for 40 mL volumetric samples of each genotype, replicate, and harvest, encased in a light-impermeable Zero Calibration Box (CM-A124 Konica Minolta). CIELAB values, L*, a*, and b*, were quantified using a Konica Minolta CR-5 Chroma Meter (Konica Minolta, Inc., Tokyo, Japan). Three automatic readings were taken per sample, and the instrument recorded the average of the three readings. Quantified values indicated spectrum position for color identification. Specifically, higher L* values indicate increased sample luminescence represented by light blue fruit; a* values are a red-green color spectrum where positive values are red and negative values are green; b* values are a blue-yellow color spectrum where positive values are yellow and negative values are blue. Luminescence (L*) values depreciate with fruit handling and bloom removal, observed by darker fruit skin and elevated a* and b* values. Therefore, CIELAB values were measured first in the phenotypic workflow prior to excessive fruit handling. The a* and b* values were converted to chroma (CRM) and hue (HUE) values according to the following equations [18].
C h r o m a = ( a * 2 + b * 2 ) θ = tan 1 b * a *   6.2832 360 h u e   a n g l e = θ   i f   a * > 0   a n d   b * 0   h u e   a n g l e = θ + 180   i f   a * < 0 h u e   a n g l e = θ + 360   i f   a * > 0   a n d   b * < 0

2.2.2. Fruit Firmness Measurements

Fresh fruit firmness (FRM) was quantified via a Firmtech II (BioWorks, KS, USA). The instrument load cell depression speed was set at 12 mm·s−1 with a table speed of 0.79 mm·s−1. Ten fruits were selected and measured per clonal genotype replicate and harvest. Individual fruits were positioned for equilateral compression by the Firmtech II instrument, which recorded fruit deflection force. Deflection force was quantified as grams necessary to compress the fruit 1 mm (g∙mm−1). Deflection force and compression arm height were calibrated with pure gum rubber balls, 15.4 mm in diameter, with a tensile strength of 2700 psi (MCMasterCarr part 96385K61) [19].

2.2.3. Fruit Weight and Size

Fruit weight (FW) was taken from these randomly selected individual fresh fruit (n =10) using a standard laboratory scale (Mettler Toledo, Columbus, OH). The square root of FW was taken and used in statistical analysis to stabilize the variance.
The diameter of the ten randomly selected and previously weighed fruits was measured via caliper from calyx to stem scar, gauging equatorial diameter (ED) and polar diameter (PD). The roundness index (RI) was determined as the ratio of polar diameter to the equatorial diameter for each fruit [20].
R I = P D E D

2.2.4. Texture Analysis

The mechanical force required to puncture the fruit skin of the same ten individual fruits used in diameter and weight measurements was determined using a TA.XTplus texture analyzer (Stable MicroSystem Ltd., Godalimng, UK). The texture analyzer was fitted with a 4 mm flathead probe as previously described [21]. The instrument’s decompression speed was set to 2.5 mm·s−1 with a retraction speed of 5 mm·s−1. The flathead probe applied a maximum force of 5 g, indicating completion of fruit puncture and platform contact, after which probe retraction was initiated. Consistent with firmness measurements, individual fruits were positioned equatorially for puncture. Exponent Connect software (Stable MicroSystem Ltd., Godalimng, UK) was used to produce graphical profiles for each fruit calculating absolute positive force (g) (APF), force at target (g) (FT), and distance at absolute positive force (mm) (DPF). APF is the pressure exerted upon the fruit at the time of puncture (Supplementary Figure S2). Likewise, the FT is the innate resistance to depression of the fruit upon initial contact with the flathead probe (Supplementary Figure S2). The DPF indicates the fruit’s elasticity (FE), measuring the distance from initial target contact to APF and fruit puncture. Using DPF divided by the ED of the blueberry, we established a ratio of FE.
F E = D P F E D
Total soluble solids (TSS) were measured from the supernatant of the fruit purée. The supernatant was extracted from homogenized (Fisher Scientific Homogenizer 150, Fisher Scientific, Pittsburg, PA) and centrifuged (10 min 4200 RPM/10,120× g with HIGHConic II Rotor ofSorvall Legend X1R Centrifuge, Fisher Scientific, Pittsburg, PA) fruit pulp of fresh fruit purée at room temperature (n =10) using a handheld ATAGO PAL-BX|ACID F5 refractometer (ATAGO, USA, Inc., Bellevue, WA, USA). The fruit was contained in a 50 mL centrifuge tube held in ice during homogenization to prevent purée heating and soluble solid decomposition [22]. A two-hundred microliter volume of liquid supernatant was extracted and placed on the refractometer sensor for TSS measurement, and the TSS values were recorded.

2.2.5. Titratable Acidity

Titratable acidity (TA) was measured using a Mettler Toledo G20S Compact Titrator (Mettler Toledo, Columbus, OH). The fruit was homogenized and vortexed, creating a blueberry fruit purée. Subsequently, 2 ± 0.01 g of the purée was mixed with 60 mL of water and subsequently titrated with 0.1 N NaOH to an endpoint of pH 8.2. Titratable acidity was converted to citric acid percentage using the following equation.
T i t r a t a b l e   A c i d i t y   % = m L   N a O H × 0.1   N   N a O H × m i l l i e q u i v a l e n t   f a c t o r × 100 s a m p l e   ( g )

2.2.6. Climatic Data

Monthly averages were extrapolated from maximum and minimum daily air and soil temperatures, as well as precipitation and evapotranspiration measures. These data were obtained during blueberry flower and fruit development, from March to August, using State Climate Office of North Carolina, Sandhill Research Station weather data, and the Hyslop weather station data maintained by Oregon State University (Corvallis, OR, USA).

2.2.7. Statistical Analysis

Statistical analyses for phenotypic data were performed using the REML method of Proc GLIMMIX in SAS v9.4 (SAS, Cary, NC, USA). All phenotypic traits were checked for variance stability and heteroskedasticity. Subsequently, stabilizing transformation was performed only on FW data, which was transformed by taking the square root of each data point. Environment (E) was analyzed as a blocking factor for five identical genotypes (G) between the Corvallis and Jackson Springs to evaluate statistical significance between sites for each phenotypic variable. Model 1 included environment (E), year (Y), genotype (G), harvest (H), random effects of replication (R), and their interactions. Replication refers to duplicate plants of each genotype and measures the variability among plants of the same genotype grown 1 m apart. Individual fruit replication within each clonal replicate plant for each measured phenotypic trait was used to estimate within-plant variability for these analyses:
Model 1
y i j k l m n = µ + E i + Y j + ε 1 i j + G k + E G i k + Y G j k + R ( G E ) m ( k i ) + E Y G i j k + R ( G E Y ) m ( k i j ) + H l + E H i l + Y H j l + H G l k + Y G H j k l + R ( G H E ) m ( l k i ) + R ( G H Y ) m ( l k j ) + E G H i k l + E Y H i j l + E Y G H i j k l + R ( G E H Y ) m ( l k i j ) + ε 2 i j k l m n
where y i j k l m n is the measured phenotypic trait of the ith environment in the jth year and lth sequential harvest for the kth genotype and the mth clonal plant replicate per genotype and the nth individual fruit. In this model, µ is the grand mean, and E i ,   Y j ,   G k ,   and   H l are the main effects of environment, year, genotype, and harvest, respectively, where i = 1, 2 environments; j = 1, 2 years; k = 1, 2, 3, 4, 5 genotypes; l = 1, 2 harvests; and m = 1, 2 clonal genotype replicates. Two-factor interactions included E G i k ,   Y G j k ,   E H i l ,   Y H j l ,   and   H G l k , representing the interactions between environment and genotype, year and genotype, environment and harvest, year and harvest, and harvest and genotype, respectively. Three-factor interactions included E Y G i j k , E G H i k l ,   and   E Y H i j l   for environment-by-year-by-genotype, environment-by-genotype-by-harvest, and environment-by-year-by-harvest. The four-factor interactions included only E Y G H i j k l , representing the interaction for environment-by-year-by-genotype-by-harvest. Clonal genotype replicates were present in both environments and were treated as a random effect. The random effects included whole plot error, ε 1 i j , of the E × Y interaction, random between-plant effects of the clonal replicate plants (all terms involving Rm), and the error between replicate measures of individual fruit for the phenotypic trait.
A second model (model 2) was developed for statistical analysis of pooled fruit. The phenotypic measurements on fruit purée comprised of the ten individual fruit per genotype, replicate, harvest, location, and year. This model included environment (E), year (Y), genotype (G), harvest (H), and their interactions while using the random effect of replication (R) for accounting for variability between plants:
Model 2
y i j k l m = µ + E i + Y j + ε 1 i j + G k + L G i k + Y G j k + R ( G E ) m ( k i ) + G E Y i j k + R ( G E Y ) m ( k i j ) + H l + E H i l + Y H j l + H G l k + G Y H j k l + R ( G E H ) m ( l k i ) + R ( G H Y ) m ( l k j ) + G E H i k l + E Y H i j l + G E Y H i j k l + ε 2 i j l k m
where y i j k l m is the measured phenotypic trait of the ith environment in the jth year and lth sequential harvest for the kth genotype and the mth clonal plant replicate per genotype. In this model, µ is the grand mean and E i ,   Y j ,   G k ,   and   H l are the main effects of environment, year, genotype, and harvest, respectively, where i = 1, 2 environments; j = 1, 2 years; k = 1, 2, 3, 4, 5 genotypes; l = 1, 2 harvests; and m = 1, 2 clonal genotype replicates. Two-factor interactions included E G i k ,   Y G j k ,   E H i l ,   Y H j l ,   and   H G l k , representing the interactions between environment and genotype, year and genotype, environment and harvest, year and harvest, and harvest and genotype, respectively. Three-factor interactions included E Y G i j k , E G H i k l ,   and   E Y H i j l for environment-by-year-by-genotype, environment-by-genotype-by-harvest, and environment-by-year-by-harvest. The four-factor interaction included only E Y G H i j k l , representing the interaction for environment-by-year-by-genotype-by-harvest. Clonal genotype replicates were present in both environments and were treated as a random effect. Similar to Model 1, the random effects included whole plot error, ε 1 i j , of the E × Y interaction and the error attributed to the interaction of the clonal genotypic replicate within genotype and environment with year and harvest.
Correlation analyses were performed for genotypes within each location using the R “psych” package [23] (Revelle 2021), were analyzed by the Pearson’s method [24], and were considered significant at a threshold of p < 0.05.

3. Results

3.1. Variance across Environments, Years, and Harvests

Analysis of variance for individual fruit-measured phenotypic traits indicated that genotype (G), environment (E), year (Y), harvest (H), and their interactions significantly influenced (p < 0.05) the majority of the evaluated traits. Model 1 was used for nine phenotypic traits that used individual fruit measurements, including FW, PD, ED, RI, FRM, APF, DPF, FT, and FE. After taking measures for FW, PD, ED, RI, FRM, APF, DPF, FT, and FE, the ten fruit were homogenized into a fruit purée for quantitative measurement of the five phenotypic traits analyzed using model 2. Collectively homogenizing ten fruit was performed so that measures including L*, CRM, HUE, TSS, and TA had sufficient material. Within model 1, environment (E) significantly impacted phenotypic traits, including RI and DPF (Table 1), where values were 4.9% greater and 4.8% lower, respectively, in the Corvallis environment (Table 2). In model 2, E was a significant source of variance for phenotypic traits including L*, CRM, TSS, and TA (Table 3). The fruit had significantly higher L*, CRM, and TA values at the Jackson Springs site, while the fruit from Corvallis had a higher TSS percentage (Table 2).
Only FRM in model 1 and L*, HUE, TSS, and TA in model 2 were impacted by the effect of year (Y) (Table 1 and Table 3). Overall, the first-year, L* and TSS measurements were >8% higher than the second year. In the second year, the measured FRM and TA were more than 13% of the first year. Compared to year 1, the HUE angle increased from 264.7 to 266.8 in year 2 (Table 2) (Supplementary Figure S3).
The difference between genotypes (G) was significant for all measured traits except for DPF and HUE (Table 1 and Table 3). For example, ‘Reveille’ had the lowest FW, PD, and ED, but the highest RI, FRM, APF, FT, FE, and TSS (Table 2, Figure 1 and Figure 2). Conversely, ‘Summit’ had the highest measured FW, PD, and ED and the lowest measured RI, FRM, and FT. Correspondingly, FW and ED have a moderate negative correlation with RI, FRM, APF, and FT (R2 > |0.40|) (Figure 3). On the other hand, ‘O’Neal’ had the lowest L* and CRM values, while ‘Echota’ had the highest L* and CRM values of the evaluated cultivars (Table 2). As expected, the L* and CRM had a strong positive correlation (R = 0.69) (Figure 3).
Compared with the G × E (location) interaction, G × Y (time) affected more phenotypic traits, including PD, ED, RI, and DPF in model 1 and L* in model 2. In contrast, the G × E interaction was only significant for FRM, DPF, FT, and TSS. Combining the sources of variation in the three-factor interaction of G × E × Y, FW, RI, and DPF were significant in model 1, and TSS and TA in model 2 (Table 1 and Table 3).
More so than either E or Y, Harvest (H) was a significant source of variation for both models 1 and 2. In total, H was significant for nine phenotypic traits, including FW, PD, ED, and RI in model 1, and L*, HUE, CRM, TSS, and TA in model 2 (Table 1 and Table 3). FW, PD, ED, L*, CRM, TA, and HUE were higher in the first harvest compared with the second harvest. In contrast, the second harvest increased in RI and TSS (see Section 3.2).
The effect of E on H was less significant as a source of variation in the model compared to the impact of Y on H. The interaction of E × H was only a significant source of variation in HUE in model 2 (Table 3). Overall, HUE decreased between harvests in Jackson Springs, while Corvallis increased between harvests ( see Section 3.2). Y × H had a more significant impact on phenotypic traits used in both models compared with E × H. Y × H was significant for phenotypic traits including FW, PD, and RI in model 1 and L*, HUE CRM, TSS, and TA in model 2 (Table 1 and Table 3). Phenotypic traits including FW, PD, and CRM decreased between sequential harvests in both years of study; conversely, RI and TSS increased between sequential harvests in both years of study (Tables 6 and 7). Both L* and HUE increased between harvests in the first year and decreased between harvests in the second year, whereas TA decreased between harvests in the first year, while increasing in the second year. The effect of G on H (G × H) was not a significant source of variance to any of the studied phenotypic traits (Table 1).
Complex three-way interactions included E × Y × H, G × E × H, G × Y × H, and G × E × Y × H. Among these, E × Y × H was significant for phenotypic traits including FW, PD, ED, L*, HUE, CRM, TSS, and TA; G × E × H was significant for L*; G × E × Y × H was significant for phenotypic traits including FW, L*, HUE, CRM, TSS, and TA. Though G × H was not significant in the models for any phenotypic trait, G × Y × H was a significant three-way interaction for twelve of the fourteen measured traits, including PD, ED, RI, FE, L*, HUE, CRM, TSS, and TA (Table 1 and Table 3).
More scrutiny of the variance components contributing to the total variance in the two models revealed that the most significant variation in model 1 was the within-plant error corresponding to individual fruit variation, which accounted for >42% for all phenotypic traits (Table 4). The dominant variance components were dependent upon the phenotypic trait of study, often with greater emphasis on G × E × replicate (R) and G × E × Y × H × R (Table 4). In model 2, G × E × H × R accounted >45% of the variation in all phenotypic traits (Table 5). The variance component G × E × Y × R accounted for 25–40% of model 2 variation.

3.2. Genotypic Means within Environment and Year

Among the genotypes, ‘Reveille’ had the most significant variability for nine measured traits across environmental locations (Table 6 and Table 7). Comparing between genotypic averages, ‘Reveille’ had the highest RI, FRM, APF, FT, FE, and TSS values (Table 2); however, within genotype analysis between environments, our research indicated that ‘Reveille’ had the most significant variability in FRM, APF, and FE (Table 6). Specifically, the Corvallis environment had increased measures in all fruit’s firmness-related traits compared with Jackson Springs (Figure 1D,E). Overall, ‘Reveille’ fruit’s firmness-related traits were greater within a respective environment than those observed in other genotypes. In Corvallis, ‘Reveille’ had significantly greater values than other genotypes in eight of the measured traits (RI, FRM, APF, DPF, FT, FE HUE, and TSS). In contrast, in Jackson Springs, ‘Reveille’ had significantly greater values than other genotypes in all of the above traits except for DPF and HUE. At the Jackson Springs site, ‘O’Neal’ had significantly lower values in nine of the fourteen traits (FRM, APF, DPF. FT, FE, L*, HUE, CRM, and TA). Among these traits, only L*, CRM, and TA were statistically significant compared to other genotypes in either environment (Figure 1F,H, Supplementary Figure S3). Compared to other genotypes in Corvallis, ‘Summit’ had significantly lower FRM, APF, DPF, FE, and TSS values and higher FW, PD, and ED. ‘Summit’ traits including, FW, PD, ED, FRM, APF, and FE were consistent with statistical comparisons between genotypes at the Jackson Springs location (Table 6 and Table 7).
Overall, FW, PD, ED, and TA increased from year 1 to year 2 in ‘O’Neal’ and ‘Reveille’ while FRM and HUE increased across years for all genotypes. ‘Summit’ lacked a second harvest in the second year of study in Corvallis; however, averages of FW, PD, ED, and TA increased between years of study (Table 6). All genotypes showed decreased measures of TSS across years (Figure 2D,G, Supplementary Figure S4). ‘Echota’ and ‘O’Neal’ had the most significant variation among genotypes across years; ‘Echota’ decreased in FW, RI, and TSS and ‘O’Neal’ decreased in RI, FRM, APF, DPF, FE, and HUE from year 1 to year 2 (Figure 2C–E, Supplementary Figure S4). Statistical analysis between genotypes showed that ‘Reveille’ and ‘Sunrise’ were more consistent across the years and showed consistency for phenotypic trait values within a genotype across environments (Table 6 and Table 7).

3.3. Correlation between Agronomic Traits

Individual fruit measures were averaged within each clonal replicate (per genotype, location, harvest, and year) for each studied trait that utilized individual fruit (FW, PD, ED, RI, FRM, APF, DPF, FT, and FE). Pairwise Pearson’s correlation between each of the fourteen studied agronomic traits was performed using phenotypic measures of L*, HUE, CRM, TSS, and TA and averages per clonal replicates for FW, PD, ED, RI, FRM, APF, DPF, FT, and FE (Figure 3). We identified five strong positive (>0.70) pairwise correlations. Strongly correlated traits included FW-PD (r = 0.87), FW-ED (r = 0.94), PD-ED (r = 0.83), APF-FT (r = 0.76), and APF-FE (r = 0.92). Measures of deflection (FRM), initial resistance to puncture (FT), and force required for fruit puncture (APF) are all fruit measures relating to the firmness and innate resistance to bruising. Additionally, FE was calculated by DPF, the depression of the probe on the fruit between FT and APF, and ED; therefore, DPF is related to both fruit volume and fruit firmness measures.
Further, we identified twenty-six moderately correlated phenotypic traits (|0.70|> |r| >|0.40|). Of the identified moderately correlated traits, ten were positively correlated, including RI-APF (r = 0.43), FRM-APF (r = 0.63), FRM-FT (r = 0.48), RI-FE (r = 0.40), FRM-FE (r = 0.53), FT-FE (r = 0.69), L*-CRM (r = 0.69), APF-TSS (r = 0.45), FE-TSS (r = 0.51), and CRM-TA (r = 0.46). The sixteen traits with a moderate negative moderate correlation included FW-RI (r = −0.47), ED-RI (r = −0.62), FW-FRM (r = −0.43), ED-FRM (r = −0.44), FW-APF (r = −0.50), PD-APF (r = −0.45), ED-APF (r = −0.58), ED-FT (r = −0.41), FW-FE (r = −0.63), PD-FE (r = −0.60), ED-FE (r = −0.67), FW-TSS (r = −0.48), PD-TSS (r = −0.42), ED-TSS (r = −0.50), RI-TA (r = −0.47), and TSS-TA (r = −0.43) (Figure 3).

4. Discussion

As blueberry production expands, it encompasses increased geographic and climatic diversity. Regions with compatible climates for both northern and southern highbush genotypes accommodate extended harvest windows. However, genotype response to diverse environments is largely uncharacterized. The main objective of the present study was to determine the extent of variation on fruit quality traits of five blueberry genotypes resulting from different sources of variation, including environment, year, harvest, and their interactions. Understanding the sources attributed to phenotypic plasticity informs that trait’s genetic control and stability [10]. This research evaluates sources of variation significant to phenotypic stability and genotypic performance in select environments. Additionally, our analysis over multiple environments, years, and harvests was previously uncharacterized in blueberry for this range of phenotypic traits.
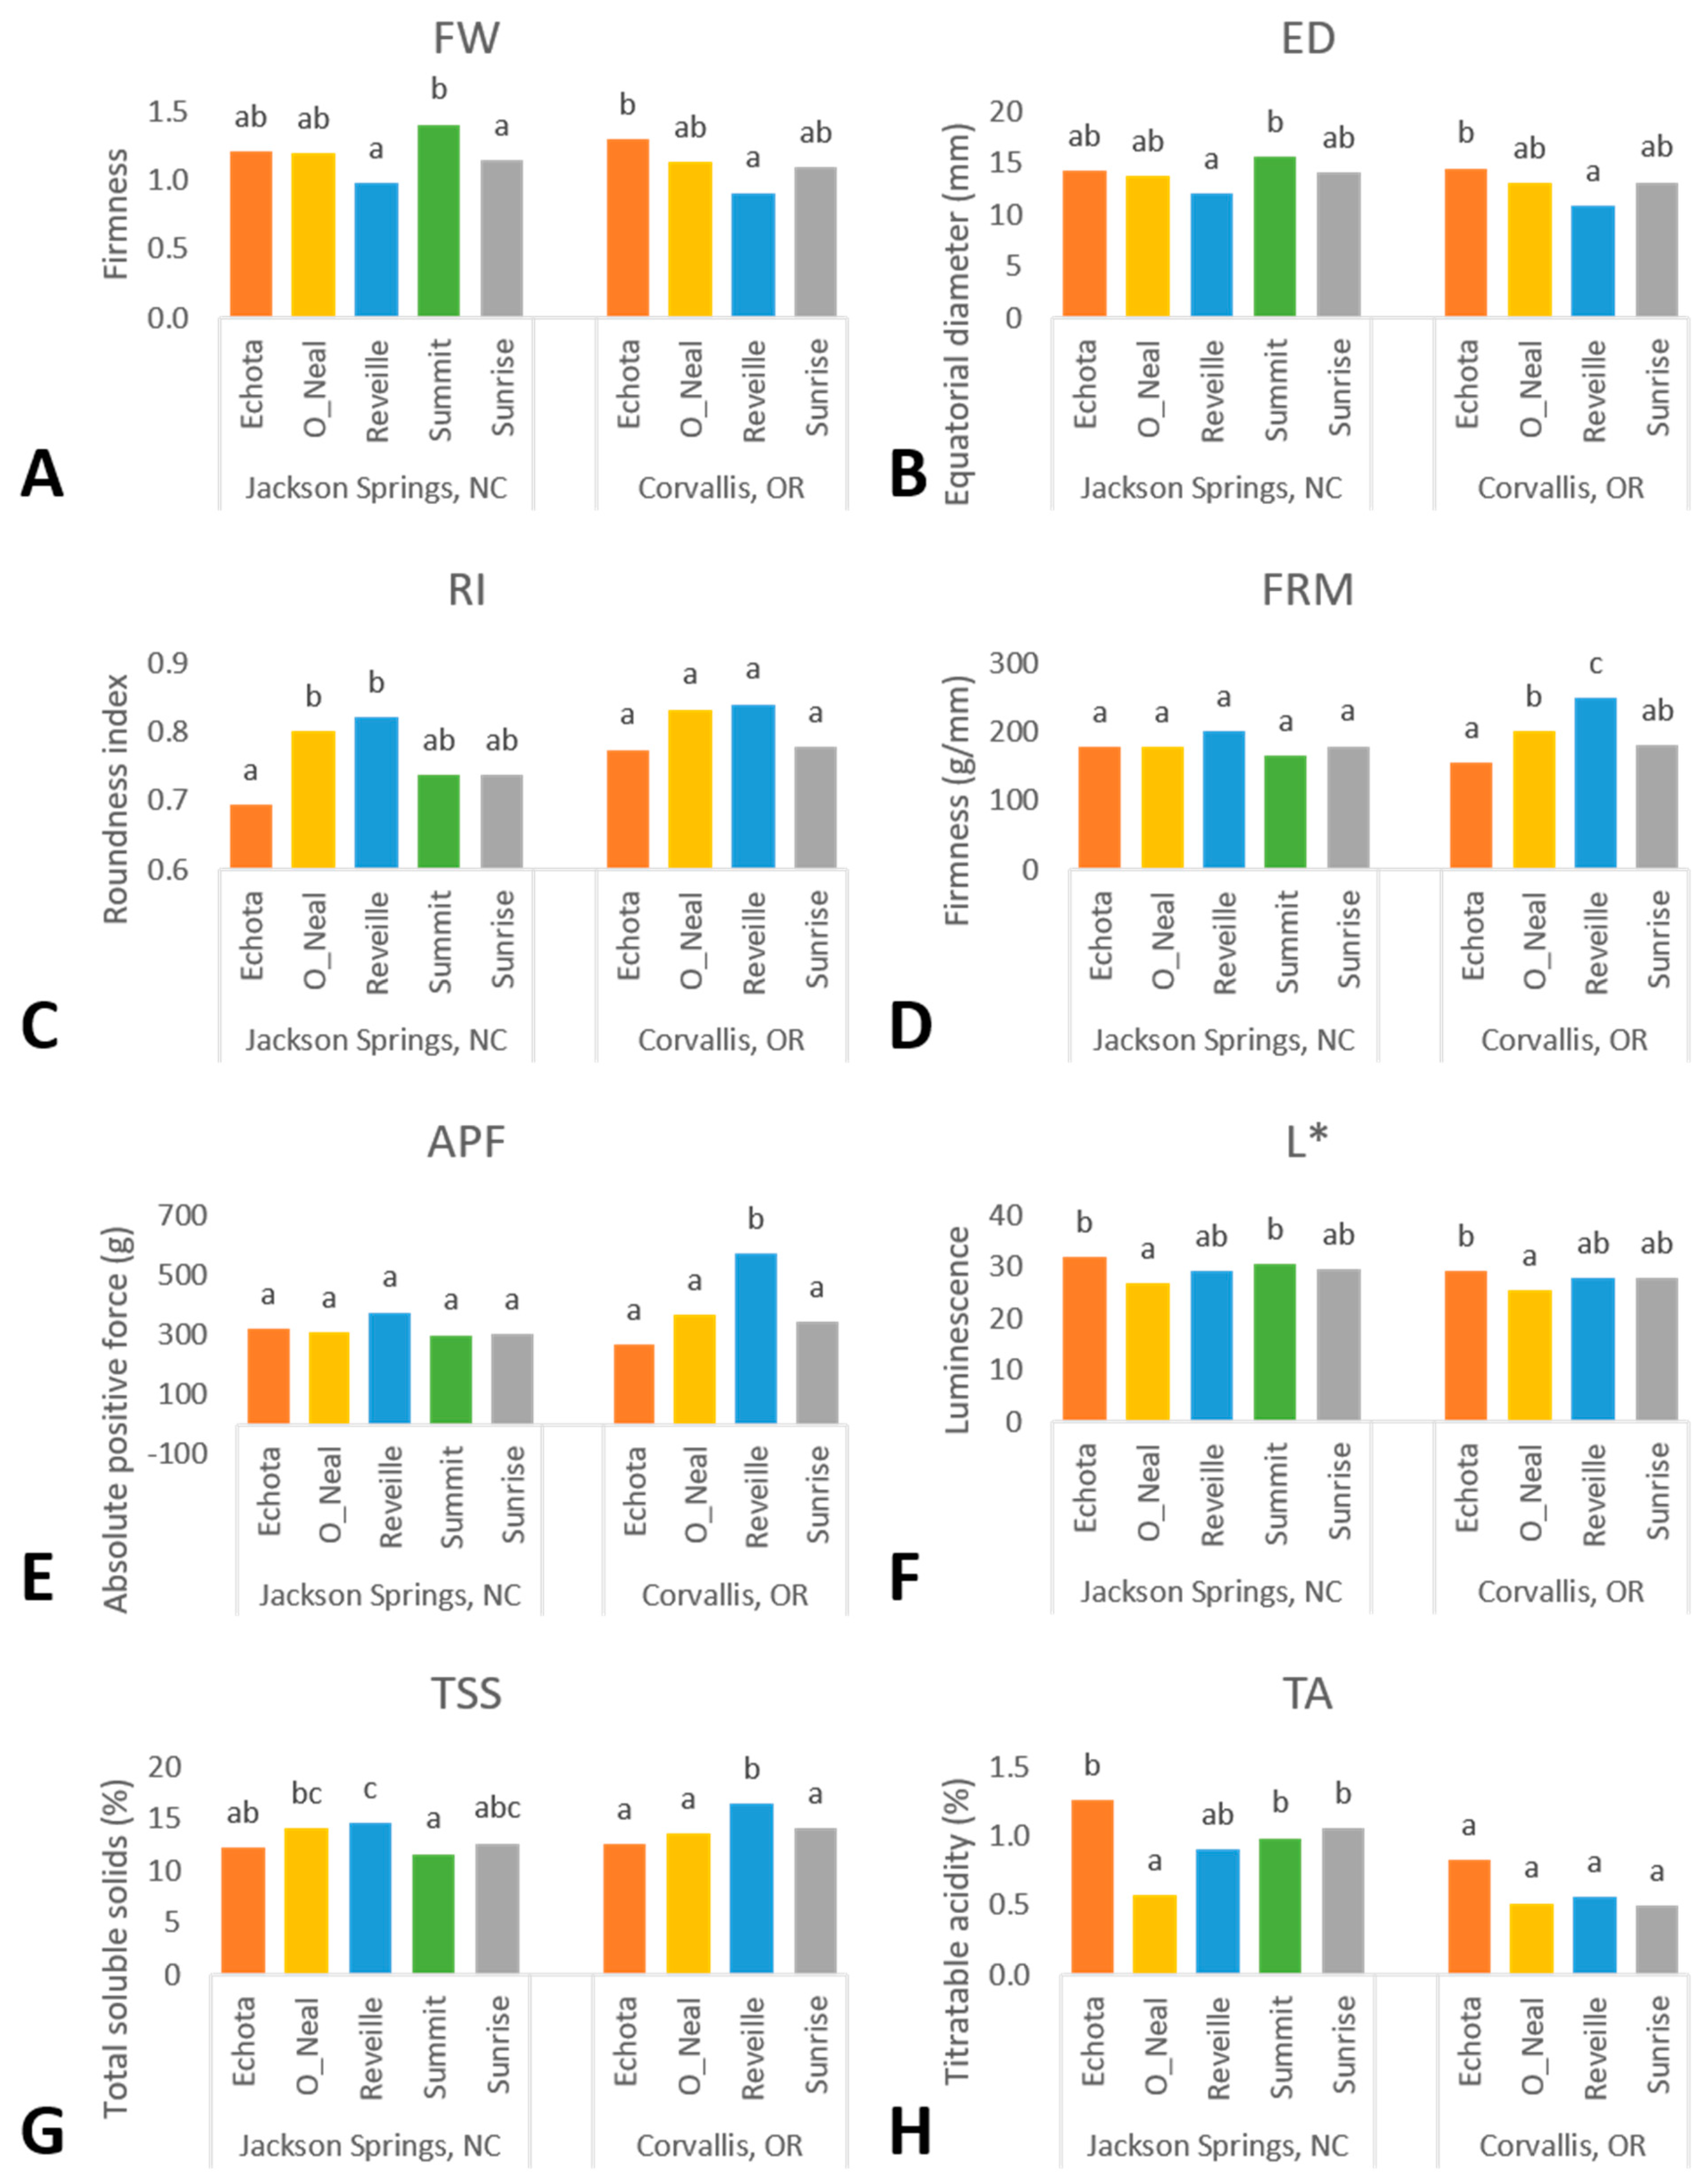
The selected environments saw differences in precipitation and air and soil temperatures. Corvallis had decreased net precipitation, air, and soil temperature, and increased evapotranspiration compared to the Jackson Springs environment in both years of study (Table 8). However, our results indicated that E, G × E, G × E × Y, and G × E × H were not significant sources of variation for the majority of the phenotypic traits in either model. Yearly climatic differences in rainfall and temperature events suggested a greater influence on phenotypic expression. Precipitation and evapotranspiration are transitory effects that fluctuate year to year. Environmental differences are more evident in soil and air temperature and their effect on fruit maturation times. Air and soil temperatures warmed more gradually, and fruit matured later at the Corvallis location compared with Jackson Springs. While similar to Corvallis regarding maximum air and soil temperatures in March, the Jackson Springs environment experiences temperature increases in April that are not observed until May at the Corvallis location. The warmer air and soil temperatures at the Jackson Springs site agree with previous studies, which found that increased daytime soil and air temperatures advanced reproductive and vegetative growth of blueberry plants grown in high tunnels. Advancing the timeline of reproductive growth ultimately accelerated the fruit ripening by five weeks compared to blueberries under field conditions [11]. Further, higher temperatures have been reported to induce pigment accumulation and accelerate ripening in blueberries [25].
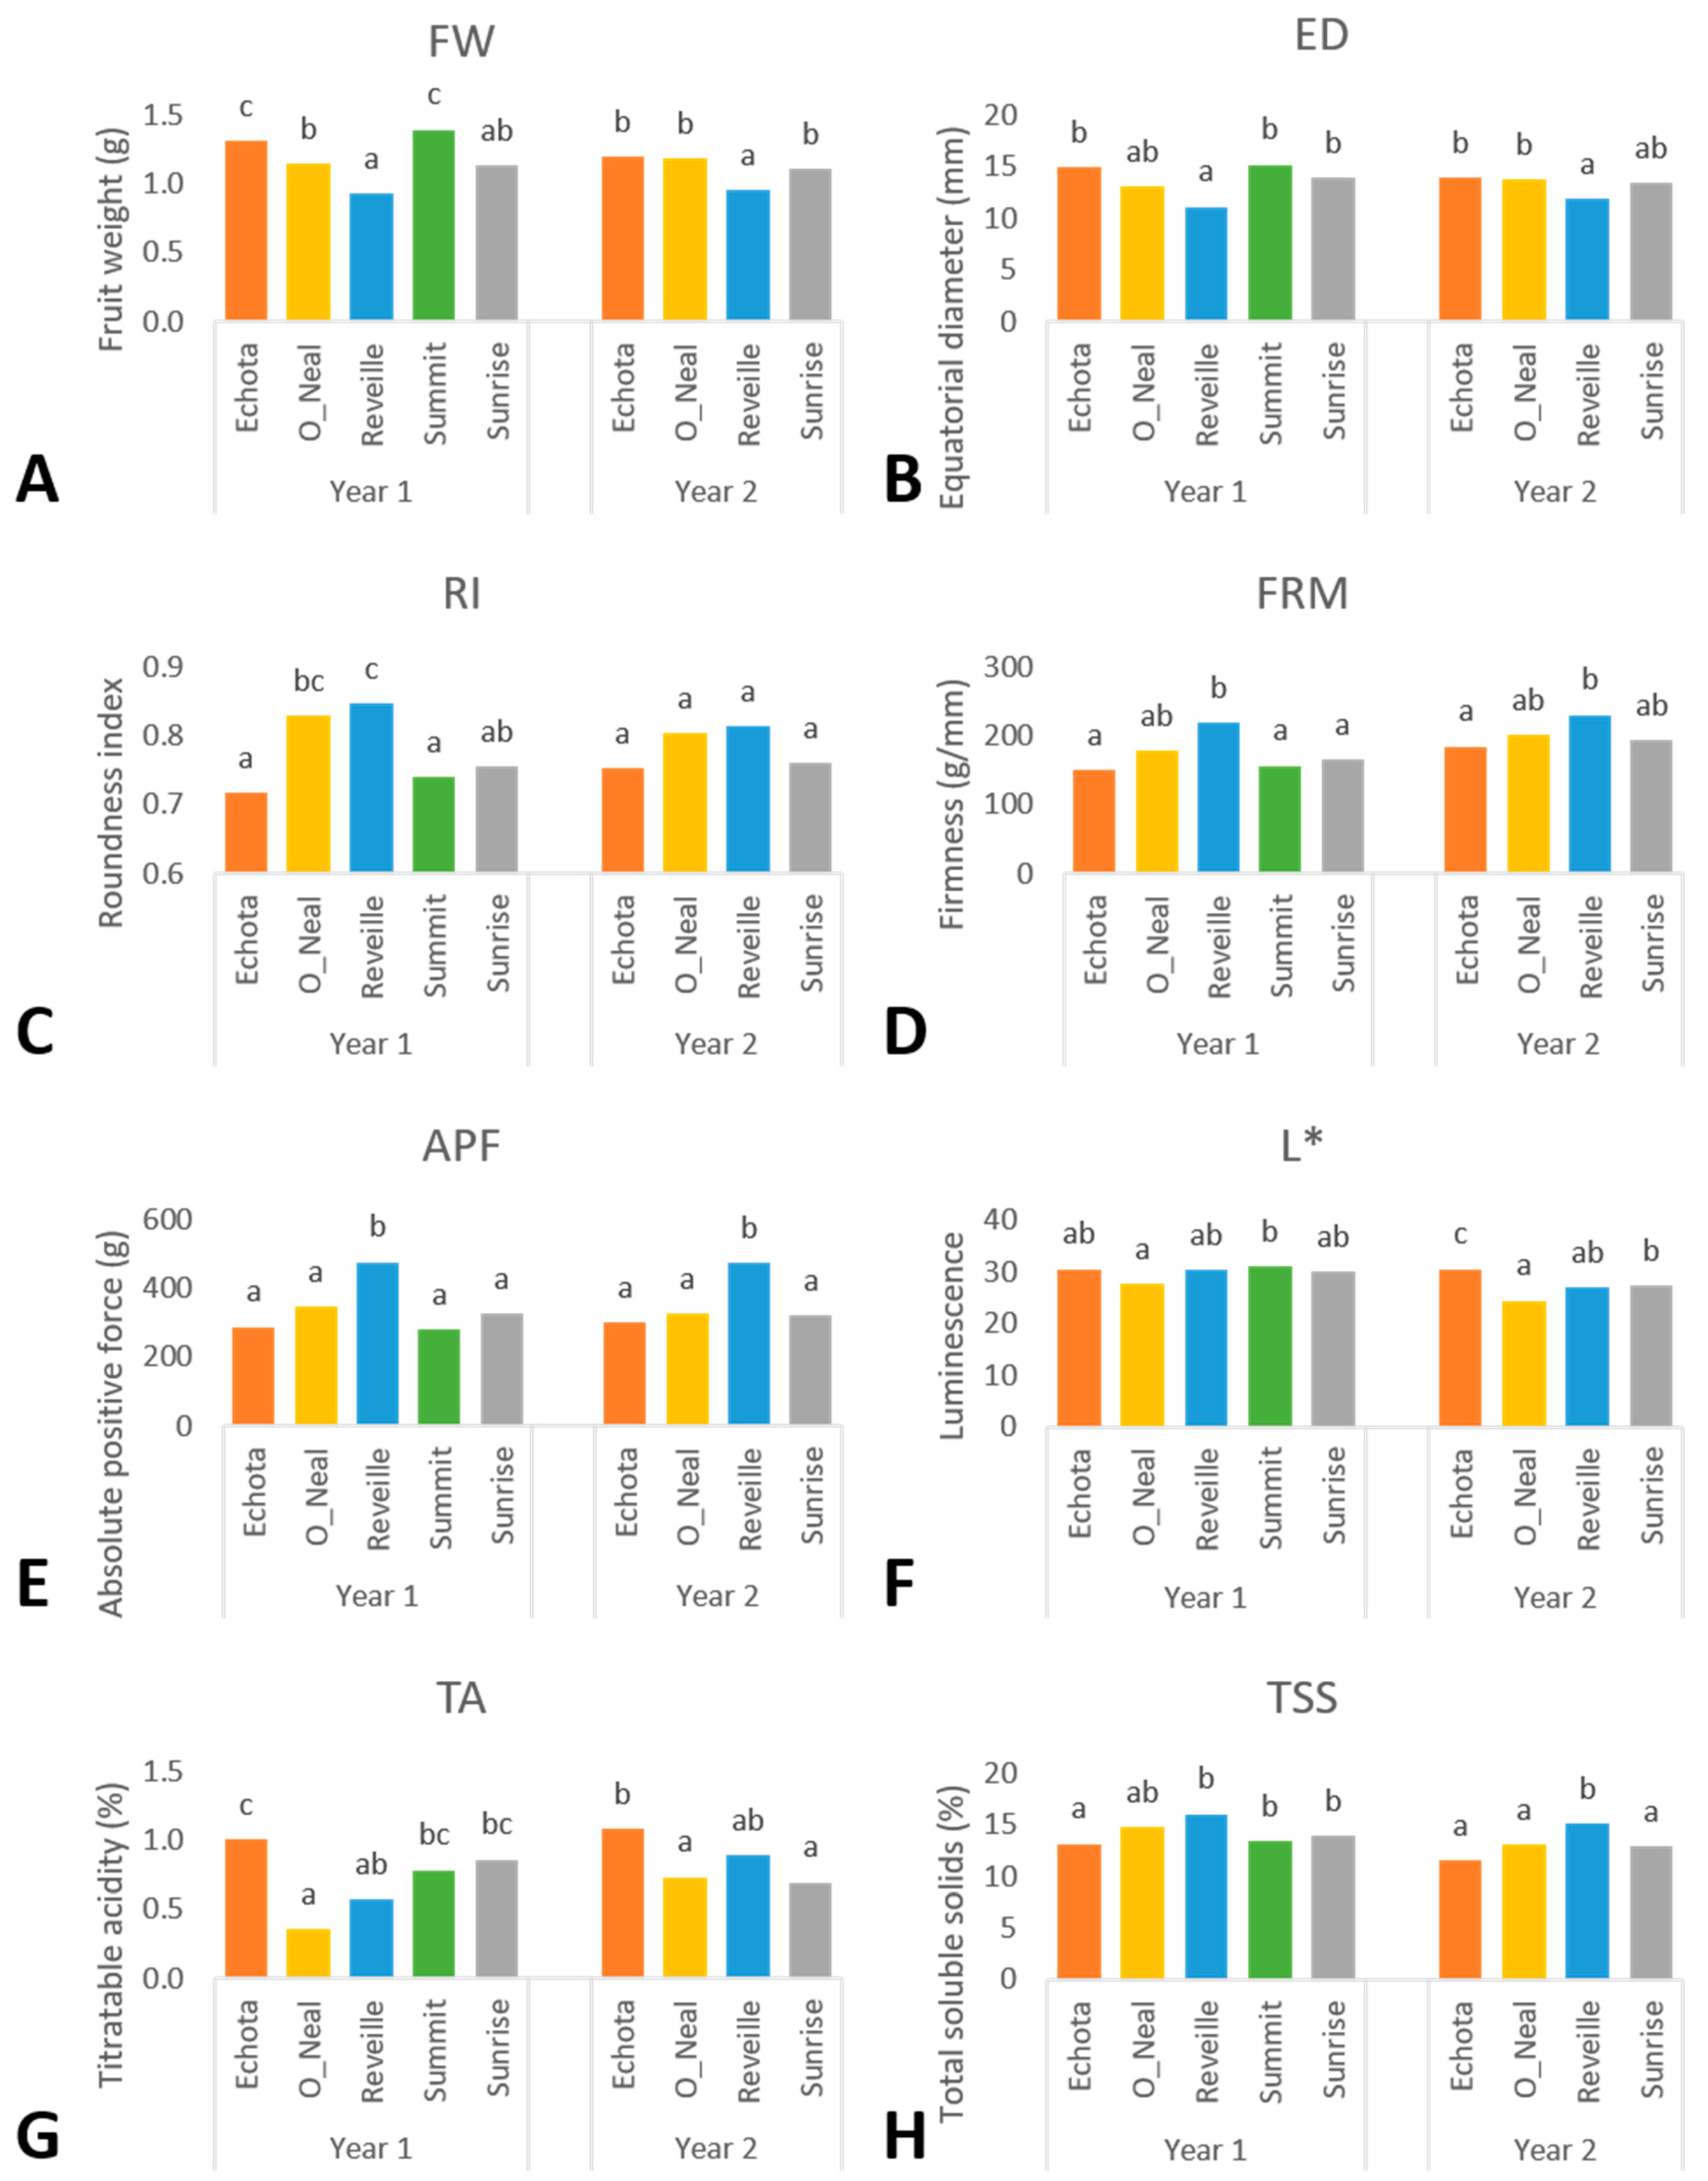
Yearly phenotypic variation is likely resultant from the differential precipitation and temperatures between years of analysis as observed within each environment—increased precipitation results in larger fruit in blueberry [6]. Across environments, fruit size metrics were not significantly different; however, they varied in accordance with annual precipitation events within a location. Within the Corvallis environment, increased precipitation in 2019 from rainfall events resulted in larger fruit, as exemplified by the 14% increase in FW in 2019 compared to 2020, Where precipitation in the Jackson Springs environment decreased by 13% between 2019 and 2020, FW was affected by a 26% decrease. The soil type in Jackson Springs is sandy, and it was amended by pine bark to acidify the soil and increase organic matter. The plants were irrigated by a linear movement irrigation system every 7–10 days. However, the soil did not have much capacity to retain moisture even after incorporating pine bark. Further, PD, ED, RI, and DPF decreased in the Jackson Springs environment from 2019 to 2020 and increased in Corvallis. Fruit volume metrics are likely to increase due to precipitation events within a location [6]. Conversely, water stress conditions, including high-temperature effects and drought conditions, negatively affect fruit volume metrics [16,26,27]. Fruit volume metrics increased at the Jackson Springs and decreased at the Corvallis locations between the years of the study, which correspond to increased temperatures during harvest. While high-chill northern blueberry cultivars are negatively impacted at temperatures ≥ 30 °C, noted by a reduced photosynthetic rate [28], low-chill-adapted blueberry cultivars have a higher estimated photosynthetic heat tolerance with no significant electrolytic leakage or superoxide radical accumulation observed at temperatures < 40 °C [29]. While high-chill northern blueberry cultivars are negatively impacted at temperatures ≥ 30 °C, noted by a reduced photosynthetic rate [28], low-chill-adapted blueberry cultivars have a higher estimated photosynthetic heat tolerance than northern high-chill-adapted cultivars with no significant electrolytic leakage or superoxide radical accumulation observed as a result of heat stress until at temperatures ≥ 40 °C [29]. In our findings, the maximum temperatures during harvest (May–June at the Jackson Springs location and July–August at the Corvallis location) exceeded 40 °C at both locations in both years of study. Overall, fruit volume metrics were higher in years with a lower mean temperature during harvest. The decreased fruit volume metrics in the NHB cultivars ‘Echota’ and ‘Sunrise’ were related to increased annual temperatures between years for both environments; these observations may support decreased photosynthetic rates due to of heat stress. Coinciding with years of lower maximum air temperatures, ‘Sunrise’ and ‘Echota’ had increased fruit volume metrics in Corvallis in the first year and Jackson Springs in the second year of study. However, it is noteworthy that the increased fruit volume metrics at the Jackson Springs location were likely significantly influenced by the three-fold increase in precipitation in the second year of study. Further research examining the effects between NHB and optimal fruit production temperature would establish a baseline for comparisons for fruit volume metrics.
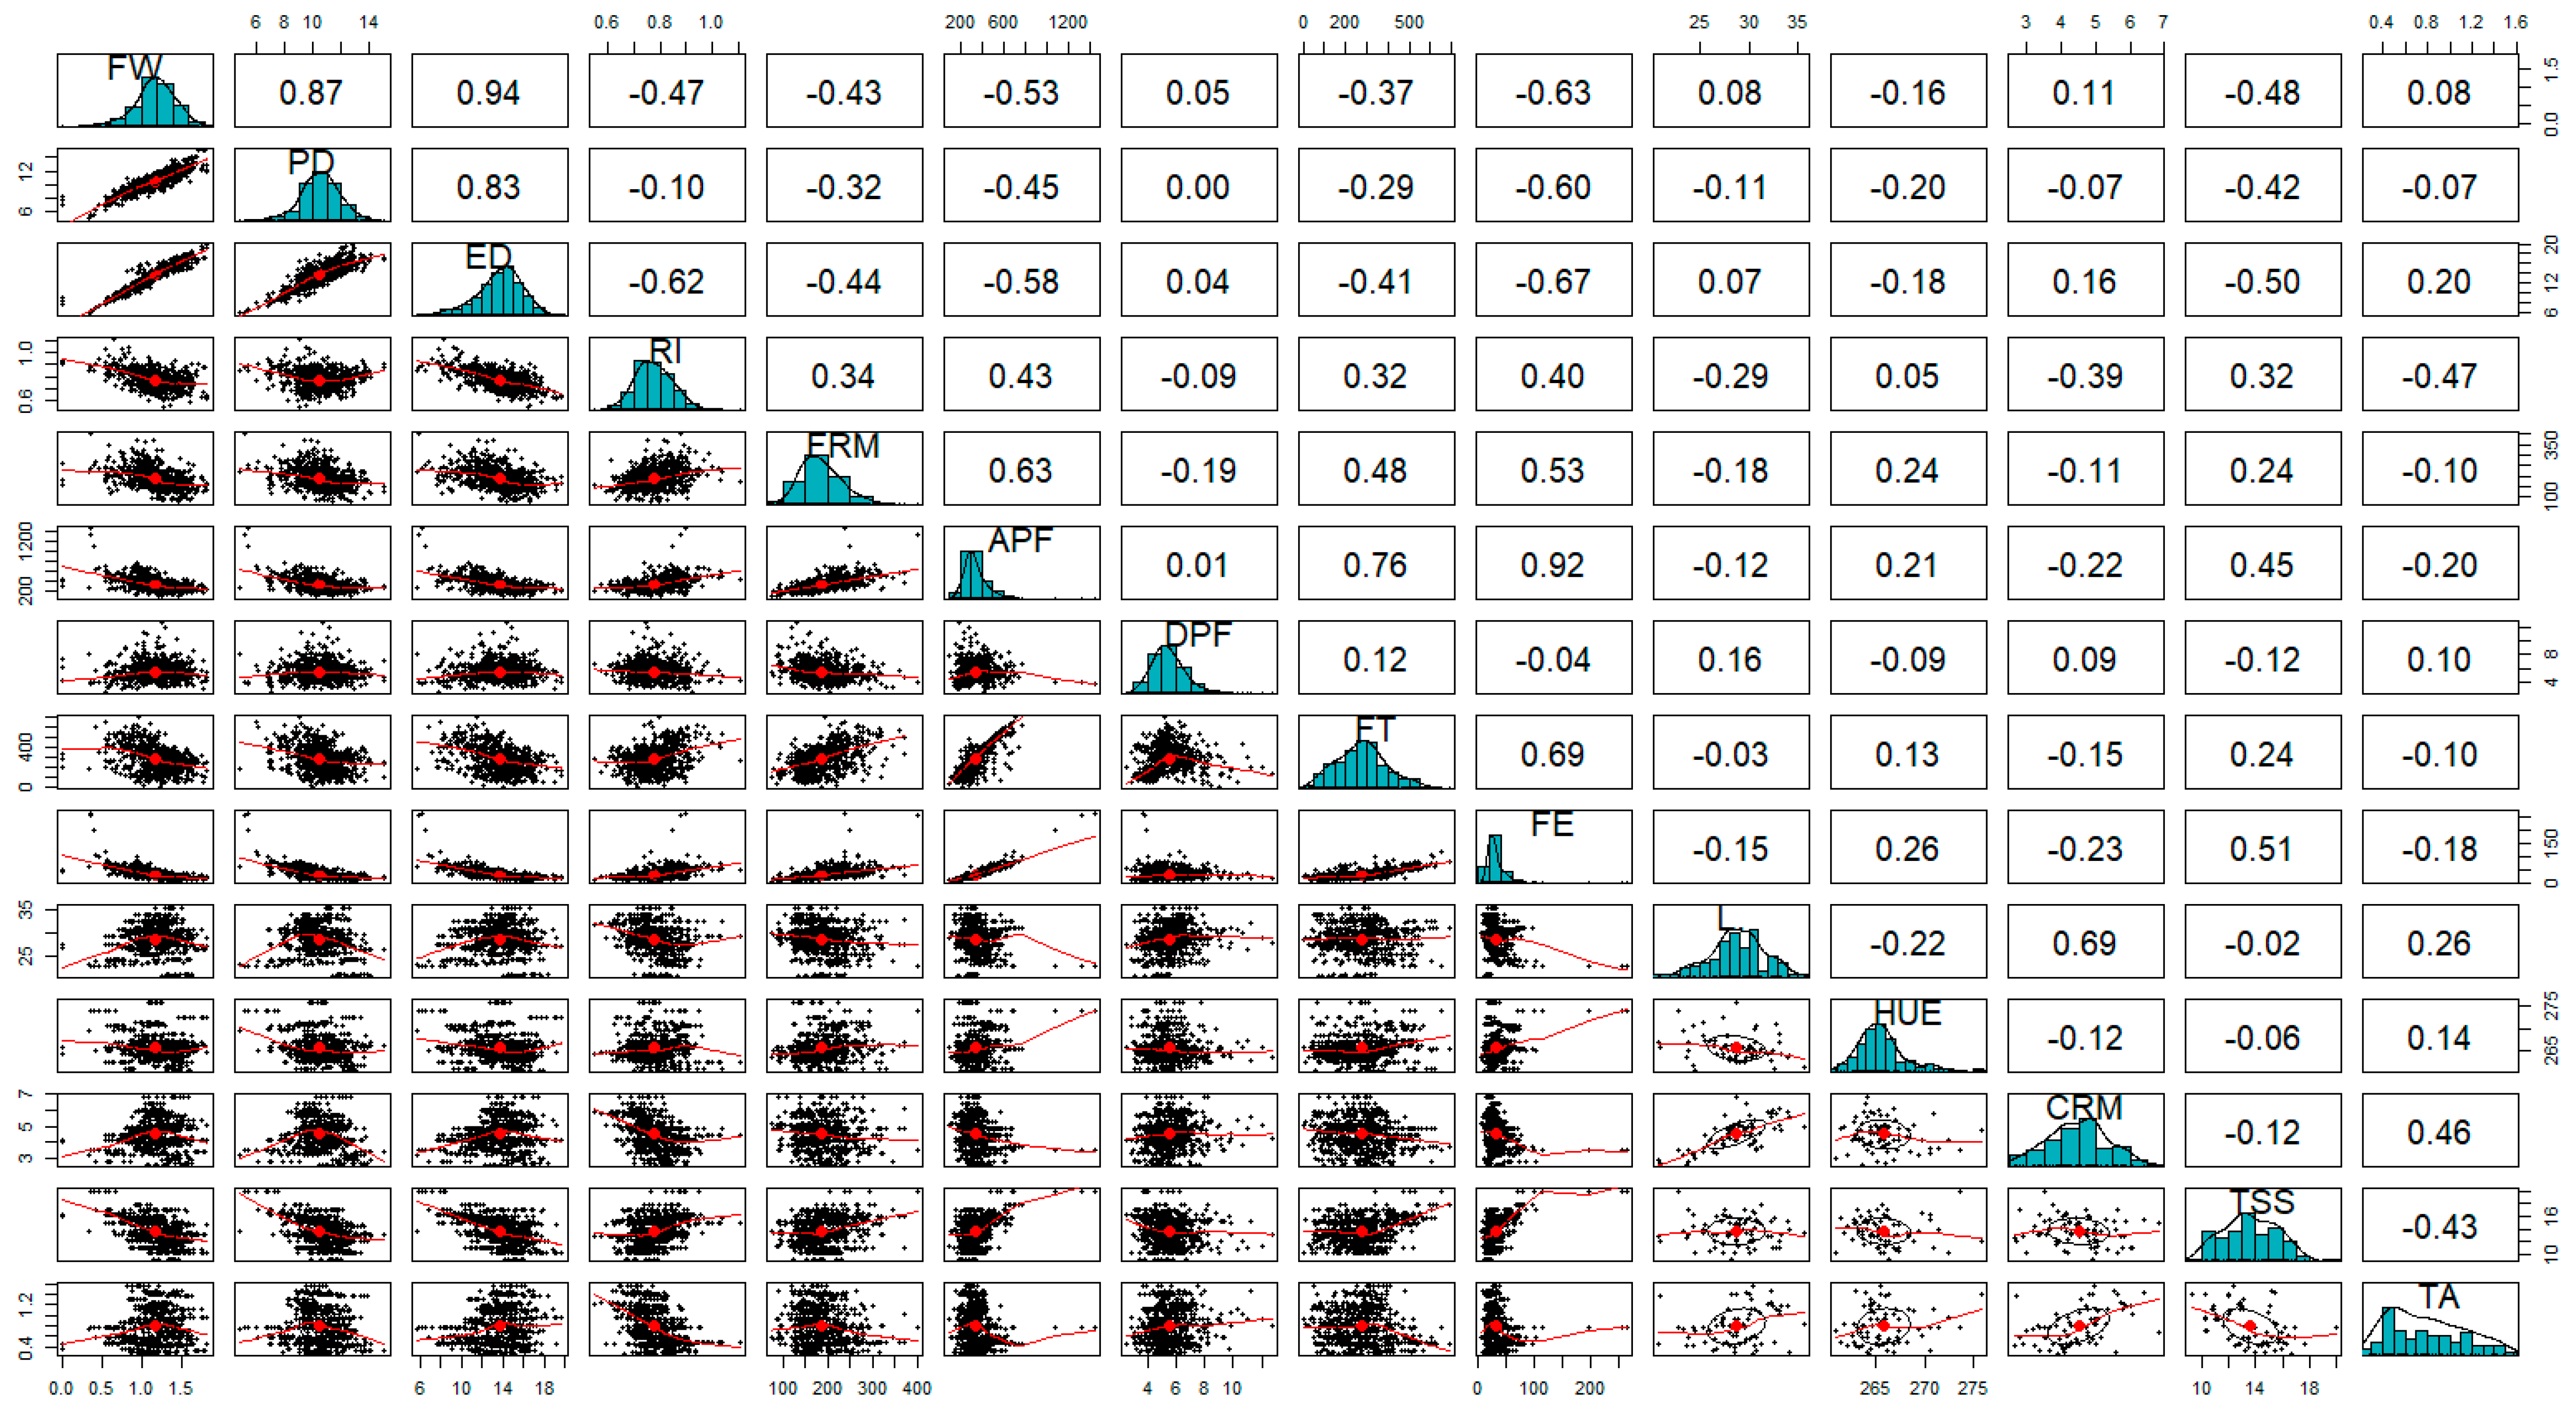
FW and ED had a moderate negative correlation with fruit firmness metrics, including FRM, APF, and FE (r > 0.40). We observed decreases of 17%, 6%, and 15% in traits, respectively, from 2019 to 2020 in Corvallis. Conversely, fruit volume metrics of FW, PD, ED, and DPF increased 14%, 9%, 10%, and 10%, respectively, from 2019 to 2020 in Corvallis. Previous reports indicate that decreased precipitation corresponds to firmer fruit [6]. While Corvallis plants are consistently irrigated twice a week, climate data reported minimal rainfall in July and August in both years of study and increased net evapotranspiration. Corresponding to increased evapotranspiration during harvest, FW, PD, and ED all decreased while FRM, APF, and FE all increased at Corvallis in 2020. At the Jackson Springs location, only APF and FE had increased values coinciding with increased evapotranspiration in 2019 compared with 2020. Contrasting with the expected increase in precipitation and reduced evapotranspiration in May and June 2020, FRM measurements were significantly higher in Jackson Springs. At the same time, FW also increased from 2019 to 2020, likely due to the three-fold increase in precipitation. Thus, both FW and FRM simultaneously increased in Jackson Springs between 2019 and 2020. FRM increased in ‘Echota’, ‘O’Neal’, and ‘Summit’, all of which increased FW. In contrast, ‘Reveille’ showed an increase in FW but a decrease in FRM. Only ‘Sunrise’ had a lower FW and higher FRM between years of the study in Jackson Springs. Contrary to environmental influences between the first and second years of study, ‘Echota’, ‘O’Neal’ and ‘Summit’ exhibited higher fruit volume-related metrics and lower FRM, APF, FT, and FE values. ‘Reveille’ reflected expectations of increased fruit volume metrics and decreased fruit firmness measurements at Jackson Springs from 2019 to 2020. The overall moderate negative correlation between FW-FRM and ED-FRM indicates that denser fruit with higher weight values and fruit with a larger equatorial diameter had lower fruit firmness. These correlations and an inverse relationship with precipitation and evapotranspiration suggest minimal temporal influence over these phenotypic traits.
While increased water uptake due to increased irrigation or precipitation in blueberry fruit positively correlates with fruit volume metrics, it negatively correlates with TSS [5]. The Jackson Springs location faced lower precipitation in May in 2019 and higher rainfall in June than 2020. More importantly, evapotranspiration was nearly 40% and 6% greater in May and June 2019, respectively, compared with 2020 at Jackson Springs. Blueberry plant water loss through evaporation reduced fruit volume metrics, including FW, PD, and ED, correlated with increased TSS values (r > 0.40). Corvallis experienced increased evaporation in 2020, which had decreased FW, PD, and ED and increased TSS.
Additionally, the increased air temperatures during harvest at each location may positively affect fruit TSS values. For example, at Jackson Springs, TSS values averaged across cultivars in 2019 were 21% greater than 2020, when May and June maximum air temperatures were 12.8% and 2.5% greater in 2019 than 2020. Comparatively, there was only a slight increase in both maximum air and soil temperature (<3% in July and August) and TSS (<2%) values in fruit collected from Corvallis in 2020. Corvallis blueberry harvest in July and August was hotter with cooler nighttime temperatures in 2020 compared with 2019; however, TSS showed a minimal increase. Contrary to our results, previous studies in blueberry report a negative correlation between decreasing light level or photosynthetic active radiation and canopy temperature with reduced fruit water content and fruit weight, while TSS increased [30].
In contrast, another study found a higher air and soil temperatures due to growing blueberry plants in high tunnels had no reported effect on TSS compared with control blueberry plants in the field [11]. These studies did not separate the light level and temperature treatment effects. Thus, conclusions may differ as there have not been studies that isolate the direct effect of air temperature and GDD without impacting light level and air movement on pre-harvest phenotypic characteristics in blueberry fruit. Similar to blueberry, red grapes are non-climacteric fruit that accumulates pigment during ripening. In grapes, high temperatures inhibit pigmentation and anthocyanin accumulation in select cultivars [31]. In contrast to Jackson Springs blueberry observations, reduced temperatures in grape, with a mean temperature of 20.3 °C, reflected increased TSS values compared to a warmer (37 °C/32 °C day/night) temperature treatment [32]. In a similar study, TSS was highest in interspecific wine grape hybrid held at a constant 25 °C for 15 to 37 days and lower at 20 °C and 30 °C, and TA was highest in fruit harvested from plants kept at 20 °C [33]. A study on tomatoes also found that increasing temperature from 26° C to 32 °C corresponded with increased TSS values [8].
Our results found a moderate negative correlation between TSS and TA. The relationship between decreased precipitation and fruit volume is positively correlated with TSS. However, we did not find any correlation between fruit volume metrics and TA. Interestingly while it has been shown that plants under decreased precipitation and increased water stress had higher TA and TSS [5,6], our results showed that there was a negative correlation between TSS and TA.
The HUE angle of blueberry defines the gradient of the blue color of the fruit on a color spectrum; values closer to 270° are considered darker blue, and values approaching 220° are lighter blue. CRM, on the other hand, indicates the level of color intensity or saturation. From 2019 to 2020, CRM values decreased in Jackson Springs and increased in Corvallis, coinciding with warmer harvest temperatures at each location. Chromaticity values have been related to pigment accumulation in fruit [34]. Previous results found that post-harvest fruit and blueberry puree had higher chroma values at lower temperatures, agreeing with our findings at the Jackson Springs location; however, these results were not significant between 4 °C and room temperature, 75 °C, and 100 °C in a study of three NHB blueberry cultivars. Overall, L* and HUE decreased and increased, respectively, between years in our study and do not correspond to temperature or rainfall events in either environment. This observation was consistent across G × Y except for ‘Echota’, for which L* values slightly increased between years of study in Corvallis. Fruit color is a factor of fruit ripeness and maturation, which can be altered by harvest time and anthocyanin accumulation. As blueberry fruit ripens, anthocyanin content increases, turning from green to blue with intermediate red or blush hues. Further, the fruits of most blueberry cultivars produce a wax coating or bloom, which can preclude color determination. Fruit bloom affects L* in the light-dark color perception of the fruit and is impacted by fruit handling and weather, diminishing the bloom coating. As such, we would expect L* values to have increased variability.
As a whole, blueberry fruit ripening is indicated by fruit pigment accumulation for one month. Plant fruit ripening and the blueberry reproductive cycle are based upon genotype and environmental factors controlling budbreak. Fruit derived from the same plant but collected at a later harvest due to a later fruit maturation window will have accumulated more GDD and increased opportunities for rainfall events and temperature increases. As such, we would expect to see differences between harvests. Our results identified significant differences in both ‘O’Neal’ and ‘Reveille’ regarding fruit volume metrics between harvests, as well as differences in L*, HUE, CRM, and TSS in ‘Echota’, ‘Reveille’, and ‘Sunrise’ between harvests.
It was intriguing that we did not find any consistent effect between harvests within a genotype across environments or years for any phenotypic trait. However, we did observe that TSS increased between harvests for most genotypes on an environment and yearly basis. While previous findings reported blueberry fruit decreasing in CRM values and L* during ripening, our results did not find any consistent trend in either CRM or L* [25]. However, a major difference between the previous study [25] and ours is the evaluation of blueberry fruit ripening stages covering pigmentation. Our study looks at similarly ripe fruit and examines fruit variation between successive harvests. Variation in fruit measures within a plant between successive harvests signify differences in GDD and temperature events between harvest timepoints. As fruit matured and accumulated anthocyanins, Spinardi et al. (2019) found that fruit shifted in hue angle from 290° (violet) to 210° (blue) during ripening. In contrast, our findings did not see a shift in HUE between harvests, further supporting the uniform ripeness of fruit between harvests.
Intriguingly, we did not find any differences in fruit firmness metrics associated with either harvest timepoint. A previous study examined the metrics between blueberry fruit ripeness and canopy position found that fruit six days post-optimal-ripeness were significantly less firm than optimally-ripe fruit [15]. While our study only evaluated ripe fruit, it is important to note that increased GDD did not impact fruit firmness metrics. While average harvest values of FRM and FT decreased between harvests, the difference was not significant. Further, fruit firmness metrics of APF and FE increased. Additional interactions with genotype, environment or year were not a significant source of variation with harvest effects for any measured fruit firmness metrics.
Genotype is an expected significant source of variation. Accordingly, all studied phenotypic traits displayed significant differences between genotypes apart from DPF, and HUE. Overall, ‘Reveille’ performed highest in fruit firmness metrics (FRM, APF, FT, and FE) across genotypes within either environment or year of study. ‘Summit’ consistently had higher fruit volume metric averages (FW, PD, and ED) across the evaluated genotypes in both the environments and years of the study. Similarly, ‘Echota’ had the second-highest values for fruit volume metrics, and, as with ‘Summit’, lower fruit firmness metrics were observed, including FRM, APF, PF, FT, and FE. ‘Echota’, followed by ‘Summit’, had the highest L* and CRM values rating across genotypes. Higher L* values signify lighter fruit skin coloration as a result of pigmentation or genotypic bloom production. The current market preference in blueberry visual appeal coincides with higher L* values and light blue blueberry fruit in addition to larger fruit size characteristics [35] displayed by both ‘Echota’ and ‘Summit’. ‘O’Neal’ was the least acidic genotype in this study and had a rounder fruit similar to ‘Reveille’ yet had the lowest L* and CRM values. ‘O’Neal’ was average among the majority of studied traits, representing both medium volume and firmness. Similarly, ‘Sunrise’ represented the median value for nearly every phenotypic trait; this observation was consistent in both environments for all phenotypic traits except for DPF, wherein ‘Sunrise’ had the highest DPF value across genotypes in Corvallis.

5. Conclusions

The results of this study indicated the presence of significant interactions among genotypes, years, environments, and harvests for all measured fruit quality parameters. Genotype is a significant source of variation for the majority of phenotypic traits. ‘Reveille’ and ‘O’Neal’ phenotypic stability were consistent across environments and years; moreover, ‘Summit’ phenotypic data across years, locations, and harvests suggested similar stability. Clonal plant replicates within genotype and environment, and individual fruit measures were the most significant source of variability. This research established thirty-one moderate-to-strong correlations between multiple phenotypic traits, including fruit volume, firmness, color, soluble solids, and acidity. Air and soil temperature, precipitation, and evaporation were variable between years and suggested influence on phenotypic measures. Overall, these data provide a valuable foundation for breeding blueberries in different target locations and elucidating climatic effects on fruit characteristics.

Supplementary Materials

The following are available online at https://www.mdpi.com/article/10.3390/agronomy11091788/s1, Figure S1: Neighbor Joining tree of five cultivars from NCSU (Jackson Springs, NC) and NCGR (Corvallis, OR) based on SNP data (Ashrafi et al. Unpub.) and outgroup. Vaccinium uliginosum (L.) was used as an outgroup, Figure S2: Texture analyzer graphical display of fruit puncture of genotypes ‘Echota’, ‘O’Neal’, ‘Reveille’, ‘Summit’, and ‘Sunrise’ and their respective force at target (FT) acquisition points, and absolute positive force (APF) puncture points for an individual fruit. Distance at positive force (DPF) (mm) is the distance the fruit depressed between FT and APF, Figure S3: Genotypic means of phenotypic traits including polar diameter (PD) (a), distance at positive force (DPF) (b), force at target (FT) (c), fruit elasticity (FE) (d), hue angle (HUE) (e), and chroma (CRM) (f) evaluated within environments Corvallis and Jackson Springs using Models 1 and 2 in PROC GLIMMIX (SAS v9.4, Cary). Means between genotypes followed by the same letter within an environement are not significantly different using the least squares means (LSMEANS) Tukey HSD multiple comparisons procedure (P < 0.05). ‘Summit’ was excluded in Corvallis statistical analysis due to the unbalanced harvests in Year 2, Figure S4: Genotypic means of phenotypic traits including polar diameter (PD) (a), distance at positive force (DPF) (b), force at target (FT) (c), fruit elasticity (FE) (d), hue angle (HUE) (e), and chroma (CRM) (f) evaluated within years 2019 and 2020 using Models 1 and 2 in PROC GLIMMIX (SAS v9.4, Cary). Means between genotypes followed by the same letter within a year are not significantly different using the least squares means (LSMEANS) Tukey HSD multiple comparisons procedure (P < 0.05). ‘Summit’ was excluded in Year 2 statistical analysis due to the unbalanced harvests in Corvallis.

Author Contributions

This research was completed as part of L.E.R.’s Ph.D. dissertation. L.E.R., N.B., and H.A. collaborated on the design, execution, analysis, and writing of this manuscript. L.E.R. wrote the original draft of the manuscript; H.A. managed the project; J.R.B. developed ‘Reveille’ and ‘O’Neal’ and planted the plants in Sandhills stations. N.B. collected fruit and shipped them to NC in two years, maintained the plants in Corvallis, OR, and contributed to writing and editing the manuscript. M.G. contributed statistical models, analyses, software and discussed the results. All authors have read and agreed to the published version of the manuscript.

Funding

The funding source of this study, including the scholarship of the Ph.D. candidate, Lauren E. Redpath, was provided by grant AFRI award # 2019-67013-29237.

Institutional Review Board Statement

Not applicable.

Informed Consent Statement

Not applicable.

Data Availability Statement

All raw and analyzed data of this study are available through supplementary materials.

Acknowledgments

The authors would like to thank the Sandhills research station in Jackson Spring, NC, and the USDA-ARS NCGR repository in Corvallis, OR, for their dedication to the maintenance and ir-rigation of the plants during the two years of this study. We also extend our thanks to the USDA-AFRI plant breeding grant that facilitated this study.

Conflicts of Interest

The authors declare that they have no competing interest.

Abbreviations

APF, Absolut Positive Force; DPF, Distance at Positive Force; E, Environment; ED, Equatorial Diameter; FE, Fruit Elasticity; FRM, Fresh Fruit Firmness; FT, Force at Target; FW, Fruit Weight; G, Genotype; G×E, Genotype by Environment; GDD, Growing Degree Days; H, Harvest; L, Location; L*a*b*, CIELAB color space; PD, Polar Diameter; RI, Roundness Index; SNP, Single Nucleotide Polymorphism; SSC, Soluble Solids Content; TA, Titratable Acidity; Y, Year.

References

  1. Cabezas, D.; de Bem Oliveira, I.; Acker, M.; Lyrene, P.; Munoz, P.R. Evaluating wild germplasm introgression into autotetraploid blueberry. Agronomy 2021, 11, 614. [Google Scholar] [CrossRef]
  2. Nishiyama, S.; Fujikawa, M.; Yamane, H.; Shirasawa, K.; Babiker, E.; Tao, R. Genomic insight into the developmental history of southern highbush blueberry populations. Heredity 2021, 126, 194–205. [Google Scholar] [CrossRef]
  3. Kalt, W.; Cassidy, A.; Howard, L.R.; Krikorian, R.; Stull, A.J.; Tremblay, F.; Zamora-Ros, R. Recent research on the health benefits of blueberries and their anthocyanins. Adv. Nutr. 2019, 11, 224–236. [Google Scholar] [CrossRef]
  4. Zeng, Q.; Dong, G.; Tian, L.; Wu, H.; Ren, Y.; Tamir, G.; Huang, W.; Yu, H. High altitude is beneficial for antioxidant components and sweetness accumulation of rabbiteye blueberry. Front. Plant Sci. 2020, 11, 1492. [Google Scholar] [CrossRef]
  5. Bryla, D.; Yorgey, B.; Shireman, A. Irrigation Management Effects on Yield and Fruit Quality of Highbush Blueberry. Acta Hortic. 2009, 810, 649–656. [Google Scholar] [CrossRef]
  6. Almutairi, K.F.; Bryla, D.R.; Strik, B.C. Potential of deficit irrigation, irrigation cutoffs, and crop thinning to maintain yield and fruit quality with less water in northern highbush blueberry. HortScience Horts 2017, 52, 625. [Google Scholar] [CrossRef] [Green Version]
  7. Lobos, T.E.; Retamales, J.B.; Ortega-Farías, S.; Hanson, E.J.; López-Olivari, R.; Mora, M.L. Pre-harvest regulated deficit irrigation management effects on post-harvest quality and condition of V. corymbosum fruits cv. Brigitta. Sci. Hortic. 2016, 207, 152–159. [Google Scholar] [CrossRef]
  8. Rodriguez-Ortega, W.M.; Martinez, V.; Rivero, R.M.; Camara-Zapata, J.M.; Mestre, T.; Garcia-Sanchez, F. Use of a smart irrigation system to study the effects of irrigation management on the agronomic and physiological responses of tomato plants grown under different temperatures regimes. Agric. Water Manag. 2017, 183, 158–168. [Google Scholar] [CrossRef]
  9. Lin-wang, K.; Micheletti, D.; Palmer, J.; Volz, R.; Lozano, L.; Espley, R.; Hellens, R.P.; Chagnè, D.; Rowan, D.D.; Troggio, M.; et al. High temperature reduces apple fruit colour via modulation of the anthocyanin regulatory complex. Plant Cell Environ. 2011, 34, 1176–1190. [Google Scholar] [CrossRef]
  10. Falconer, D.S.; Mackay, T.E. Introduction to Quantitative Genetics, 4th ed.; Addison Wesley Longman: Harlow, UK, 1996. [Google Scholar]
  11. Ogden, A.B.; Iersel, M.W.V. Southern highbush blueberry production in high tunnels: Temperatures, development, yield, and fruit quality during the establishment years. HortSci. Horts 2009, 44, 1850. [Google Scholar] [CrossRef] [Green Version]
  12. Selås, V.; Sønsteby, A.; Heide, O.M.; Opstad, N. Climatic and seasonal control of annual growth rhythm and flower formation in Vaccinium myrtillus (Ericaceae), and the impact on annual variation in berry production. Plant Ecol. Evol. 2015, 148, 350–360. [Google Scholar] [CrossRef]
  13. Hall, I.V.; Ludwig, R.A. The effects of photoperiod, temperature, and light intensity on the growth of the lowbush blueberry (Vaccinium angustifolium AIT.). Can. J. Bot. 1961, 39, 1733–1739. [Google Scholar] [CrossRef]
  14. Patten, K.; Neuendorff, E.; Nimr, G.; Clark, J.R.; Fernandez, G. Cold injury of southern blueberries as of function of germplasm and season of flower bud development. Hortscience 1991, 26, 18–20. [Google Scholar] [CrossRef] [Green Version]
  15. Lobos, G.A.; Bravo, C.; Valdés, M.; Graell, J.; Lara Ayala, I.; Beaudry, R.M.; Moggia, C. Within-plant variability in blueberry (Vaccinium corymbosum L.): Maturity at harvest and position within the canopy influence fruit firmness at harvest and postharvest. Postharvest Biol. Technol. 2018, 146, 26–35. [Google Scholar] [CrossRef]
  16. Yang, F.H.; Bryla, D.R.; Strik, B.C. Critical temperatures and heating times for fruit damage in northern highbush blueberry. HortScience 2019, 54, 2231–2239. [Google Scholar] [CrossRef] [Green Version]
  17. Zorenc, Z.; Veberic, R.; Stampar, F.; Koron, D.; Mikulic-Petkovsek, M. Changes in berry quality of northern highbush blueberry (Vaccinium corymbosum L.) during the harvest season. Turk. J. Agric. For. 2016, 40, 855–864. [Google Scholar] [CrossRef]
  18. McGuire, R.G. Reporting of objective color measurements. HortScience 1992, 27, 1254. [Google Scholar] [CrossRef] [Green Version]
  19. Prussia, S.E.; Tetteh, M.K.; Verma, B.P.; NeSmith, D.S. Apparent modulus of elasticity from Firmtech2 firmness measurements of blueberries. Trans. ASABE 2006, 49, 113–121. [Google Scholar] [CrossRef]
  20. Matiacevich, S.; Celis Cofré, D.; Silva, P.; Enrione, J.; Osorio, F. Quality parameters of six cultivars of blueberry using computer vision. Int. J. Food Sci. 2013, 2013, 419535. [Google Scholar] [CrossRef] [PubMed]
  21. Giongo, L.; Poncetta, P.; Loretti, P.; Costa, F. Texture Profiling of Blueberries (Vaccinium spp.) during Fruit Development, Ripening and Storage. Postharvest Biol. Technol. 2013, 76, 34–39. [Google Scholar] [CrossRef]
  22. Zorenc, Z.; Veberic, R.; Stampar, F.; Koron, D.; Mikulic-Petkovsek, M. Thermal stability of primary and secondary metabolites in highbush blueberry (Vaccinium corymbosum L.) purees. LWT-Food Sci. Technol. 2017, 76, 79–86. [Google Scholar] [CrossRef]
  23. Revelle, W. psych: Procedures for Psychological, Psychometric, and Personality Research. 2021. Available online: https://personality-project.org/r/psych-manual.pdf (accessed on 27 March 2021).
  24. Pearson, K. Note on Regression and Inheritance in the Case of Two Parents. Proc. R. Soc. Lond. 1895, 58, 240–242. [Google Scholar]
  25. Spinardi, A.; Cola, G.; Gardana, C.S.; Mignani, I. Variation of anthocyanin content and profile throughout fruit development and ripening of highbush blueberry cultivars crown at two different altitudes. Front. Plant Sci. 2019, 10, 1045. [Google Scholar] [CrossRef]
  26. Mingeau, M.; Perrier, C.; Améglio, T. Evidence of drought-sensitive periods from flowering to maturity on highbush blueberry. Sci. Hortic. 2001, 89, 23–40. [Google Scholar] [CrossRef]
  27. Fan-Hsuan, Y.; David, R.B.; Scott, T.O.; Bernadine, C.S.; Yanyun, Z. Thermal Cooling with Sprinklers or Microsprinklers Reduces Heat Damage and Improves Fruit Quality in Northern Highbush Blueberry. HortSci. Horts 2020, 55, 1365–1371. [Google Scholar] [CrossRef]
  28. Hancock, J.; Haghighi, K.; Krebs, S.; Flore, J.; Draper, A. Photosynthetic heat stability in highbush blueberries and the possibility of genetic improvement. HortScience 1992, 27, 1111–1112. [Google Scholar] [CrossRef] [Green Version]
  29. Chen, W.; Cen, W.; Chen, L.; Di, L.; Li, Y.; Guo, W. Differential sensitivity of four highbush blueberry (Vaccinium corymbosum L.) cultivars to heat stress. Pak. J. Bot. 2012, 44, 853–860. [Google Scholar]
  30. Lobos, G.A.; Retamales, J.B.; Hancock, J.F.; Flore, J.A.; Romero-Bravo, S.; del Pozo, A. Productivity and fruit quality of Vaccinium corymbosum cv. Elliott under photo-selective shading nets. Sci. Hortic. 2013, 153, 143–149. [Google Scholar] [CrossRef]
  31. Kliewer, W.M.; Torres, R.E. Effect of controlled day and night temperatures on grape coloration. Am. J. Enol. Vitic. 1972, 23, 71–77. [Google Scholar]
  32. Kliewer, W.M. Influence of temperature, solar radiation and nitrogen on coloration and composition of Emperor grapes. Am. J. Enol. Vitic. 1977, 28, 96–103. [Google Scholar]
  33. Poudel, P.R.; Mochioka, R.; Beppu, K.; Kataoka, I. Influence of temperature on berry composition of interspecific hybrid wine grape ‘Kadainou R-1’(Vitis ficifolia var. ganebu× V. vinifera ‘Muscat of Alexandria’). J. Jpn. Soc. Hortic. Sci. 2009, 78, 169–174. [Google Scholar] [CrossRef] [Green Version]
  34. Singha, S.; Baugher, T.A.; Townsend, E.C.; D’Souza, M.C. Anthocyanin distribution inDelicious’ apples and the relationship between anthocyanin concentration and chromaticity values. J. Am. Soc. Hortic. Sci. 1991, 116, 497–499. [Google Scholar] [CrossRef] [Green Version]
  35. Gilbert, J.L.; Olmstead, J.W.; Colquhoun, T.A.; Levin, L.A.; Clark, D.G.; Moskowitz, H.R. Consumer-assisted selection of blueberry fruit quality traits. HortScience 2014, 49, 864–873. [Google Scholar] [CrossRef]
Figure 1. Genotypic means of phenotypic traits including fruit weight (FW) (A), equatorial diameter (ED) (B), roundness index (RI) (C), firmness (FRM) (D), absolute positive force (APF) (E), luminescence (L*) (F), total soluble solids (TSS) (G), and titratable acidity (TA) (H) evaluated within environments Corvallis and Jackson Springs using models 1 and 2 in PROC GLIMMIX (SAS v9.4). Means between genotypes followed by the same letter within an environment are not significantly different using the least squares means (LSMEANS) Tukey HSD multiple comparisons procedure (p < 0.05). ‘Summit’ was excluded in Corvallis statistical analysis due to the unbalanced harvests in Year 2.
Agronomy 11 01788 g001
Figure 2. Genotypic means of phenotypic traits including fruit weight (FW) (A), equatorial diameter (ED) (B), roundness index (RI) (C), firmness (FRM) (D), absolute positive force (APF) (E), luminescence (L*) (F), total soluble solids (TSS) (G), and titratable acidity (TA) (H) evaluated within years, 2019 and 2020 using models 1 and 2 in PROC GLIMMIX (SAS v9.4). Means between genotypes followed by the same letter within a year are not significantly different using the least squares means (LSMEANS) Tukey HSD multiple comparisons procedure (p < 0.05). ‘Summit’ was excluded in Year 2 statistical analysis due to the unbalanced harvests in Corvallis.
Agronomy 11 01788 g002
Figure 3. Pearson’s correlation coefficients for fourteen phenotypic traits in five blueberry cultivars with two clonal replicates grown in two environments harvested over two sequential harvests per replicate over a two-year period. Phenotypic traits include fruit weight (FW), polar diameter (PD), equatorial diameter (ED), roundness index (RI), firmness (FRM), absolute positive force (APF), the distance at absolute positive force (DPF), force at target (FT), fruit elasticity (FE) luminescence (L*), hue angle (HUE), chroma (CRM), total soluble solids (TSS), and titratable acidity (TA).
Agronomy 11 01788 g003
Table 1. Analysis of variance (ANOVA) p-value summary of nine phenotypic traits evaluated using model 1 in PROC GLIMMIX (SAS v9.4) with five blueberry cultivars from two environments collectedover sequential harvests in 2019 and 2020.
FactorFW PDEDRIFRMAPFDPFFTFE
Environment (E) 0.2140.7220.0770.0300.2220.1040.0250.3680.069
Year (Y)0.1610.5420.6840.6510.0010.9760.1070.6790.471
Genotype (G)0.00080.0160.0020.0030.00020.0060.4680.0100.005
G × E0.3600.0830.6730.5430.0310.0830.0050.0390.209
G × Y0.1430.0150.0030.0700.3660.4340.0230.7670.688
G × E × Y0.0380.5260.0290.0700.7610.6840.0740.4160.616
Harvest (H)0.0020.0050.00040.0010.9290.2990.8810.8490.061
E × H0.3180.0850.2290.3780.8790.3880.1370.6900.172
Y × H0.0070.0230.4710.0460.1750.5560.3430.4910.108
G × H0.0920.0880.1850.5210.8450.8270.6010.7540.741
E × Y × H0.00010.0100.0430.4060.1050.3220.1580.2670.197
G × E × H0.1670.4150.2730.2950.8590.3530.6850.6110.403
G × Y × H0.0940.0002<0.00010.0110.7900.1200.9900.4930.007
G × E × Y × H0.0420.0540.0570.1220.1080.4580.5700.1460.464
FW = fruit weight; PD = polar diameter; ED = equatorial diameter; RI = roundness index; FRM = firmness; APF = absolute positive force; DPF = distance at absolute positive force; FT = force at target; FE = fruit elasticity. Treatment effects in bold are significant at p ≤ 0.05.
Table 2. Means of fourteen phenotypic traits across environments, years, harvests, and genotypes.
FW PDEDRIFRMAPFDPFFTFEL*HUECRMTSSTA
Environment
Jackson Springs1.19 a10.49 a13.98 a0.76 b180.90 a321.33 a5.65 a265.04 a28.36 a29.55 a265.40 a4.80 a13.02 b0.96 a
Corvallis1.16 a10.54 a13.33 a0.80 a192.27 a371.66 a5.38 b292.74 a36.28 a27.79 b266.16 a4.15 b14.30 a0.60 b
Year
Year 11.17 a10.47 a13.56 a0.78 a174.73 b348.31 a5.63 a283.89 a32.27 a29.92 a264.72 b4.43 a14.23 a0.73 b
Year 21.18 a10.56 a13.81 a0.77 a198.04 a340.82 a5.42 a271.60 a31.76 a27.51 b266.82 a4.57 a12.97 b0.87 a
Harvest
Harvest 11.21 a10.76 a14.21 a0.76 b186.74 a336.82 a5.51 a280.03 a29.48 a28.90 a265.87 a4.59 a13.17 b0.80 a
Harvest 21.13 b10.25 b13.11 b0.79 a185.57 a353.23 a5.54 a275.65 a34.82 a28.55 b265.62 a4.41 a14.09 a0.79 a
Genotype
‘Echota’1.27 10.55 14.39 0.73 167.42 293.38 5.63 233.16 20.75 30.49 265.28 5.19 12.34 1.05
‘O’Neal’1.20 11.03 13.60 0.82 189.13 337.53 5.29 269.96 28.20 26.21 265.58 3.8313.87 0.54
‘Reveille’0.95 9.49 11.54 0.83 224.26 469.91 5.42 374.81 52.18 28.61 266.95 4.49 15.50 0.73
‘Summit’1.40 11.40 15.62 0.73 166.92 288.91 5.74 231.03 25.51 29.84 266.13 4.79 12.88 0.88
‘Sunrise’1.13 10.33 13.72 0.76 178.84 320.2 5.58 268.76 31.86 28.66 264.91 4.22 13.31 0.8
FW = fruit weight (g); PD = polar diameter (mm); ED = equatorial diameter (mm); RI = roundness index; FRM = firmness (g·mm−1); APF = absolute positive force (g); DPF = distance at absolute positive force (mm); FT = force at target (g); FE = fruit elasticity; L* = luminescence; HUE = hue angle; CRM = chroma; TSS = total soluble solids (%); TA = titratable acidity (%). Means followed by the same letter(s) within a column under subheading of environment, year, harvest, and genotype are not significantly different using the least squares means (LSMEANS) Tukey HSD multiple comparisons procedure (p < 0.05).
Table 3. Analysis of variance (ANOVA) p-value summary of five phenotypic traits evaluated on fruit purée using model 2 in PROC GLIMMIX (SAS v9.4) with five blueberry cultivars from two environments collected over sequential harvests in 2019 and 2020.
FactorL* HUECRMTSSTA
Environment (E) 0.0002 0.1170.0070.001<0.0001
Year (Y)<0.0001<0.00010.745<0.00010.006
Genotype (G)0.00010.1330.002<0.00010.003
G × E0.3910.0610.6780.0120.137
G × Y0.0010.0130.1460.0690.005
G × E × Y0.0030.4950.3050.0870.001
Harvest (H)0.0490.9400.1460.0010.777
E × H0.6490.0020.1350.4020.410
Y × H<0.0001<0.0001<0.0001<0.0001<0.0001
G × H0.9450.5760.2020.5130.710
E × Y × H<0.0001<0.0001<0.0001<0.0001<0.0001
G × E × H0.0390.1100.3890.6190.198
G × Y × H<0.0001<0.0001<0.00010.003<0.0001
G × E × Y × H<0.0001<.0001<0.0001<0.0001<0.0001
L* = luminescence; HUE = hue angle; CRM = chroma; TSS = total soluble solids; TA = titratable acidity. Treatment effects in bold are significant at p ≤ 0.05.
Table 4. Variance component percentage of total variance of nine phenotypic traits evaluated on fresh fruits using model 1 in PROC GLIMMIX (SAS v9.4) with five blueberry cultivars from two environments collected over sequential harvests in 2019 and 2020.
Covariance FactorFW PDEDRIFRMAPFDPFFTFE
Whole Plot Error: Environment (E) × Year (Y)0.000.000.000.000.000.000.000.000.00
Genotype (G) × E × Replicate (R)6.937.8919.2520.720.0016.810.009.4714.29
G × E × Y × R8.9512.610.007.5111.320.002.319.780.00
Harvest (H) × G × E × R15.1816.1210.691.946.2319.560.004.7020.45
G × E × Y × H × R22.9115.6426.3710.8110.9812.163.796.3723.05
Error among individual fruit46.0347.7443.6959.0271.4751.4793.8969.6842.21
FW = fruit weight; PD = polar diameter; ED = equatorial diameter; RI = roundness index; FRM = firmness; APF = absolute positive force; DPF = distance at absolute positive force; FT = force at target; FE = fruit elasticity.
Table 5. Variance component percentage of the total variance of five phenotypic traits evaluated on fruit purée using model 2 in PROC GLIMMIX (SAS v9.4) with five blueberry cultivars from two environments collected over sequential harvests in 2019 and 2020.
Covariance FactorL* HUECRMTSSTA
Whole Plot Error: Environment (E) × Year (Y)1.690.003.700.003.13
Genotype (G) × E × Replicate (R)0.000.000.000.0011.86
G × E × Y × R33.0927.1239.3827.2125.61
Harvest (H) × G × E × R54.3351.8046.4567.0346.23
G × E × Y × H × R10.8821.0810.485.7713.17
L* = luminescence; HUE = hue angle; CRM = chroma; TSS = total soluble solids; TA = titratable acidity.
Table 6. Harvest means for each of the five cultivars within a year, environment, and genotype for fourteen phenotypic traits using model 1 in PROC GLIMMIX (SAS v9.4).
YearHarvestFW PDEDRIFRMAPFDPFFTFE
‘Echota’
Corvallis, Oregon
2019Harvest 11.34 a11.58 a15.53 a0.75 a142.97 a270.30 a5.97 a206.75 a17.48 a
Harvest 21.52 a12.00 a15.22 a0.79 a131.06 a227.83 a5.26 a163.86 a14.98 a
2020Harvest 11.19 a10.79 a13.99 a0.77 a166.60 a281.07 a5.40 a235.67 a20.64 a
Harvest 21.14 a10.50 a13.33 a0.79 a182.62 a291.97 a5.08 a220.62 a22.14 a
Jackson Springs, NC
2019Harvest 11.23 a9.44 a14.65 a0.65 a168.53 a330.29 a6.14 a264.91 a22.78 a
Harvest 21.15 a9.62 a14.14 a0.68 a157.65 a323.79 a6.39 a231.95 a23.57 a
2020Harvest 11.20 a9.66 a13.68 a0.71 a205.20 a303.02 a5.36 a262.55 a22.25 a
Harvest 21.27 a10.79 a14.54 a0.74 a184.74 a318.74 a5.43 a324.79 a22.19 a
‘Echota’
Corvallis, Oregon
2019Harvest 11.28 a11.96 a14.32 a0.84 a181.65 a389.54 a5.78 a315.97 a32.86 a
Harvest 21.35 a12.06 a14.42 a0.83 a190.79 a359.96 a5.14 a285.25 a31.64 a
2020Harvest 11.23 a10.93 a13.10 a 0.84 a226.74 a374.00 a5.25 a303.14 a28.89 a
Harvest 20.79 a8.64 a10.44 b0.83 a204.19 a350.23 a5.70 a285.49 a41.82 a
Jackson Springs, NC
2019Harvest 11.20 a10.77 a13.94 a0.78 b154.16 a272.86 a5.20 a220.53 a19.83 a
Harvest 20.75 b8.43 a9.70 b0.87 a186.32 a367.22 a4.99 a273.83 a39.64 a
2020Harvest 11.47 a12.68 a16.32 a0.78 a195.61 a316.28 a5.16 a275.67 a19.49 a
Harvest 21.37 a11.80 a15.29 a0.77 a179.64 a276.51 a5.30 a207.55 a18.24 a
‘Echota’
Corvallis, Oregon
2019Harvest 10.89 b8.63 a10.46 a0.82 a226.29 a491.59 a5.61 a453.87 a57.43 a
Harvest 21.05 a9.67 a11.51 a0.84 a239.00 a600.44 a5.34 a464.11 a63.38 a
2020Harvest 11.11 a10.79 a13.06 a0.83 a273.17 a528.53 a5.63 a482.06 a49.23 a
Harvest 20.59 b7.54 b8.64 b0.87 a255.82 a654.81 a4.71 a433.02 a96.83 a
Jackson Springs, NC
2019Harvest 10.98 a9.80 a12.10 a0.82 b218.29 a437.75 a4.96 a318.57 a44.86 a
Harvest 20.79 a9.32 a10.47 a0.90 a193.19 a376.66 a5.14 a271.20 a40.96 a
2020Harvest 11.05 a9.99 a12.53 a0.80 a184.30 a344.19 a5.90 a301.33 a34.85 a
Harvest 21.09 a10.01 a13.25 a0.76 a207.19 a343.81 a6.04 a288.90 a34.36 a
‘Echota’
Corvallis, Oregon
2019Harvest 11.52 a11.36 a16.58 a0.69 a144.93 a227.42 a4.96 a173.15 a20.06 a
Harvest 21.36 a11.00 a14.68 a0.75 a170.80 a286.73 a4.83 a219.61 a26.20 a
2020Harvest 11.3111.2315.540.72178.34278.194.43166.1224.97
Harvest 2 §
Jackson Springs, NC
2019Harvest 11.35 a11.19 a15.47 a0.73 a148.54 a302.83 a6.56 a274.01 a27.24 a
Harvest 21.34 a11.39 a14.59 a0.78 a163.04 a304.46 a6.16 a281.30 a26.92 a
2020Harvest 11.57 a12.02 a17.06 a0.71 a200.45 a304.16 a5.76 a232.78 a25.64 a
Harvest 21.37 a11.38 a15.45 a0.74 a153.27 a286.77 a6.66 a235.62 a25.14 a
‘Sunrise’
Corvallis, Oregon
2019Harvest 11.27 a11.67 a15.06 a0.78 a152.75 a328.55 a6.19 a285.58 a28.21 a
Harvest 21.21 a10.28 a13.50 a0.76 a146.72 a315.38 a6.61 a262.09 a30.89 a
2020Harvest 11.07 a9.93 a12.78 a0.78 a198.41 a315.17 a5.07 a220.69 a31.87 a
Harvest 20.84 a9.01 a11.59 a0.79 a221.32 a396.62 a4.74 a324.88 a47.02 a
Jackson Springs, NC
2019Harvest 11.04 a10.39 a14.58 a0.71 a171.01 a310.55 a5.10 a320.05 a30.02 a
Harvest 21.03 a9.50 a12.36 a0.77 a190.07 a350.86 a5.52 a303.74 a37.36 a
2020Harvest 11.26 a10.59 a14.58 a0.73 a175.99 a275.45 a5.48 a233.75 a26.26 a
Harvest 21.25 a11.06 a14.96 a0.74 a180.86 a280.46 a5.81 a207.68 a25.52 a
FW = fruit weight (g); PD = polar diameter (mm); ED = equatorial diameter (mm); RI = roundness index; FRM = firmness (g·mm−1); APF = absolute positive force (g); DPF = distance at absolute positive force (mm); FT = force at target (g); FE = fruit elasticity. Means followed by the same letter(s) within a year under subheading of environment, and genotype are not significantly different using the least squares means (LSMEANS) Tukey HSD multiple comparisons procedure (p < 0.05) between harvests. § ‘Summit’ did not have a second harvest in Corvallis, 2020.
Table 7. Harvest means for each of the five cultivars within a year, environment, and genotype for fourteen phenotypic traits using model 2 in PROC GLIMMIX (SAS v9.4).
YearHarvestL* HUECRMTSSTA
‘Echota’
Corvallis, Oregon
2019Harvest 127.48 b 264.06 a3.87 b11.75 a0.87 a
Harvest 229.24 a263.94 a4.54 a12.80 a0.57 a
2020Harvest 131.32 a264.43 b5.58 a12.20 a0.88 a
Harvest 228.64 b267.13 a4.86 b13.35 a0.99 a
Jackson Springs, NC
2019Harvest 132.15 a264.54 a5.78 a12.80 b1.24 a
Harvest 233.06 a263.30 a5.71 a15.15 a1.34 a
2020Harvest 132.93 a268.89 a5.93 a10.95 a1.08 a
Harvest 229.12 b265.90 b5.29 b9.75 a1.39 a
‘Echota’
Corvallis, Oregon
2019Harvest 124.03 a262.80 b2.92 a13.45 a0.43 a
Harvest 227.47 a266.43 a3.73 a13.95 a0.32 a
2020Harvest 126.61 a269.84 a3.97 a13.70 a0.64 a
Harvest 223.54 a268.47 a3.33 a13.39 a0.68 a
Jackson Springs, NC
2019Harvest 132.28 a264.18 a4.73 a15.3 a0.28 a
Harvest 227.11 a265.15 a4.09 a16.1 a0.42 a
2020Harvest 122.77 a263.43 a2.83 a11.1 a1.04 a
Harvest 224.83 a265.48 a4.87 a13.8 a0.56 b
‘Echota’
Corvallis, Oregon
2019Harvest 130.37 a268.04 a4.27 a16.10 a0.58 a
Harvest 231.05 a268.10 a3.71 b16.55 a0.40 b
2020Harvest 126.64 a266.8 b4.62 a15.35 b0.49 b
Harvest 223.69 b271.95 a3.42 b17.89 a0.76 a
Jackson Springs, NC
2019Harvest 131.06 a262.18 a4.77 a16.30 a0.64 a
Harvest 228.42 b264.05 a4.36 a15.05 a0.69 a
2020Harvest 127.69 a271.64 a4.84 b11.55 b1.17 a
Harvest 229.48 a263.31 b5.84 a15.45 a1.13 a
‘Echota’
Corvallis, Oregon
2019Harvest 129.12 a264.98 a5.03 a14.6 a0.22 a
Harvest 228.39 a265.32 a4.78 a14.0 a0.39 a
2020Harvest 127.87264.745.1916.50.46
Harvest 2 §
Jackson Springs, NC
2019Harvest 131.61 a267.43 a4.46 a12.05 a0.84 a
Harvest 234.41 a263.06 a4.86 a13.15 a0.57 a
2020Harvest 129.01 a269.73 a4.75 a10.50 a0.65 a
Harvest 227.41 a266.69 a4.58 a10.80 a0.35 a
‘Sunrise’
Corvallis, Oregon
2019Harvest 128.27 b263.07 a4.19 a14.25 a0.42 a
Harvest 230.69 a264.68 a3.75 a14.70 a0.50 a
2020Harvest 127.26 a265.72 a4.25 a12.35 b0.51 a
Harvest 224.80 b267.06 a3.14 b14.84 a0.58 a
Jackson Springs, NC
2019Harvest 130.34 a264.98 a4.97 a12.70 a1.34 a
Harvest 230.69 a264.57 a4.55 a14.00 a1.18 a
2020Harvest 129.30 a265.47 a5.00 a10.65 a0.93 a
Harvest 227.40 b264.08 a3.79 b13.20 a0.80 a
L* = luminescence; HUE = hue angle; CRM = chroma; TSS = total soluble solids (%); TA = titratable acidity (%). Means followed by the same letter(s) within a year under subheading of environment, and genotype are not significantly different using the least squares means (LSMEANS) Tukey HSD multiple comparisons procedure (p < 0.05) between harvests. § ‘Summit’ did not have a second harvest in Corvallis, 2020.
Table 8. Climatic conditions including air and soil temperature, precipitation, and evapotranspiration during blueberry fruit maturation and harvest season in Corvallis, OR and Jackson Springs, NC in 2019 and 2020.
Environment, YearAir Temperature (°C)
MarchAprilMayJuneJulyAugustTotal
MaxMinMaxMinMaxMinMaxMinMaxMinMaxMinMaxMin
Corvallis, 201934.1623.5634.1623.5639.3724.5443.1726.4344.9129.0146.7429.4841.6726.60
Corvallis, 202035.2521.6335.2521.6338.3225.3940.8528.0646.0228.9247.4628.6941.5826.54
Jackson Springs, 201933.4122.5840.7729.3046.7835.2647.6837.1050.4938.8548.9337.9746.9335.70
Jackson Springs, 202036.0426.4040.0627.7441.4430.5246.5136.3650.5339.0748.4739.0345.4034.54
Evaporation (EVP) (cm) and Precipitation (PRECP) (cm)
MarchAprilMayJuneJulyAugustTotal
EVPPRECPEVPPRECPEVPPRECPEVPPRECPEVPPRECPEVPPRECPEVPPRECP
Corvallis, 20190.006.256.9015.8015.074.6722.361.8523.671.6823.640.2918.324.86
Corvallis, 20200.006.7114.584.5014.637.6819.084.6727.050.0023.110.3219.683.43
Jackson Springs, 20198.3610.7911.5220.2415.806.1715.2110.3316.239.5513.719.3614.4811.13
Jackson Springs, 20206.886.0811.378.9211.3018.2314.349.1615.809.7712.348.6513.0210.94
Soil Temperature (°C)
MarchAprilMayJuneJulyAugustTotal
MaxMinMaxMinMaxMinMaxMinMaxMinMaxMinMaxMin
Corvallis, 201928.1923.0533.7928.8939.7232.3744.5936.4145.9337.9947.3539.9142.2835.11
Corvallis, 202029.8525.0934.4128.9338.1933.1240.8335.5045.2738.0846.6739.1341.0734.95
Jackson Springs, 201929.2334.5042.2431.7250.7439.0751.5940.8654.4342.7452.4241.5650.2839.19
Jackson Springs, 202036.4428.3542.7031.3145.2734.3451.5839.9155.4442.8752.5642.2649.5138.14
Publisher’s Note: MDPI stays neutral with regard to jurisdictional claims in published maps and institutional affiliations.

