Article

Marker-Assisted Pyramiding of Multiple Disease Resistance Genes in Coffee Genotypes (Coffea arabica)

by
Dênia Pires de Almeida
1,
Eveline Teixeira Caixeta
1,2,*,
Karoliny Ferreira Moreira
1,
Antonio Carlos Baião de Oliveira
2,3,
Kátia Nogueira Pestana de Freitas
1,
Antônio Alves Pereira
3,
Renato Domiciano Silva Rosado
4,
Laércio Zambolim
1 and
Cosme Damião Cruz
4
1
Instituto de Biotecnologia Aplicada à Agropecuária (Bioagro), Universidade Federal de Viçosa, Viçosa 36570-900, MG, Brazil
2
Brazilian Agricultural Research Corporation (Embrapa), Embrapa Coffee, Brasília 70770-901, DF, Brazil
3
Agricultural Research Company of Minas Gerais (Epamig), Viçosa 36570-075, MG, Brazil
4
Department of General Biology, Universidade Federal de Viçosa, Viçosa 36570-900, MG, Brazil
*
Author to whom correspondence should be addressed.
Agronomy 2021, 11(9), 1763; https://doi.org/10.3390/agronomy11091763
Submission received: 16 July 2021 / Revised: 20 August 2021 / Accepted: 24 August 2021 / Published: 1 September 2021
(This article belongs to the Special Issue Current Status and Management of Coffee Rust Disease)

Abstract

:
The use of resistant cultivars is the most effective strategy for controlling coffee leaf rust caused by the fungus Hemileia vastatrix. To assist the development of such cultivars, amplified fragment-length polymorphism (AFLP) markers linked to two loci of coffee resistance to races I and II as well as pathotype 001 of H. vastatrix were converted to sequence-characterized amplified region (SCAR) and cleaved amplified polymorphic site (CAPS) markers. In total, 2 SCAR markers and 1 CAPS marker were validated in resistant and susceptible parents as well as in 247 individuals from the F2 population. The efficiency of these markers for marker-assisted selection (MAS) was evaluated in F2:3 and backcross (BCrs2) populations genotyped with the developed markers and phenotyped with race II of H. vastatrix. The markers showed 90% efficiency in MAS. Therefore, the developed markers, together with molecular markers associated with other rust resistance genes, were used for F3:4 and BCrs3 coffee selection. The selected plants were analyzed using two markers associated with coffee berry disease (CBD) resistance, aiming for preventive breeding. MAS of F3:4 and BCrs3 individuals with all resistance loci was feasible. Our phenotypic and genotypic approaches are useful for the development of coffee genotypes with multiple genes conferring resistance to coffee leaf rust and CBD.

1. Introduction

To date, over 124 coffee species have been described, with Coffea arabica L. being the most economically important species worldwide. C. arabica is the only polyploid (2n = 4x = 44) of the genus and is predominantly autogamous [1]. The mating-type system is primarily based on self-pollination; as a result of the recent origin of the species and the low number of plants initially distributed worldwide, the genetic base of cultivated coffee is narrow [2,3,4,5,6]. Owing to its low genetic diversity, C. arabica is genetically vulnerable, and the crop can experience frequent pest and disease epidemics and other abiotic stresses.
Coffee leaf rust (CLR) caused by Hemileia vastatrix Berk. and Br. is the most economically important disease of coffee crops (particularly C. arabica), and can lead to over 50% production losses if the disease is not controlled and susceptible cultivars are used [7]. At present, fungicide application is the most common method of disease control; however, these chemicals must be rationally applied to avoid crop and environmental damage [8]. Thus, the use of resistant cultivars is the most appropriate method for control of CLR [9].
Some genetic sources of CLR resistance have already been identified. At least nine dominant genes present in different coffee species have been characterized [9,10,11]. For instance, the resistance genes SH1, SH2, SH4, and SH5 in C. arabica; SH6, SH7, SH8, and SH9 in C. canephora; and SH3 in C. liberica have been identified. Additional resistance genes have also been detected but remain to be characterized; these genes, alone or together with SH1 to SH9, confer resistance to over 50 physiological races of H. vastatrix [9,12,13,14]. These resistance genes have been introgressed into coffee plants to develop CLR-resistant cultivars along with other desirable agronomic traits, such as high yield, vegetative vigor, fruit ripening uniformity, plant architecture, resistance to other diseases and pests, and cup quality [15,16,17].
In general, coffee breeding programs involve complex and dynamic processes that are costly and time-consuming. In this context, molecular markers can accelerate the development of new coffee cultivars via marker-assisted selection (MAS) [16,18]. DNA markers are not affected by the environment and can be applied at any stage of plant development. The availability of markers linked to resistance genes allows for the identification of sources of resistance regardless of the presence of pathogen or race. Additionally, molecular markers can effectively aid the identification of genotypes harboring multiple resistance genes in the presence of a dominant or epistatic effect [18], allowing the pyramiding of multiple resistant genes in a single cultivar.
MAS and pyramiding approaches require the tagging of resistance genes by closely linked markers. Genetic mapping is an effective tool for the identification of such markers as well as for understanding inheritance and isolating disease resistance loci in plants [4,19,20,21]. Such maps with different types of molecular markers have been developed for C. arabica, and genes and quantitative trait loci (QTLs) associated with resistance to CLR [22,23,24,25,26] and coffee berry disease (CBD) [27,28] have been mapped.
Pestana et al. [26] identified markers flanking the QTLs present in Híbrido de Timor (HdT) UFV 443-03. HdT derivatives have been used worldwide as the major source of resistance to CLR, CBD, root knot nematode disease (Meloidgyne exigua), and bacteriosis (Pseudomonas syringae pv garcae) [9,29], and these derivatives have been proven to have good cup quality [17,30]. A linkage map constructed using HdT UFV 443-03 revealed at least two independent dominant QTLs conferring resistance to three different H. vastatrix pathotypes (race I, race II, and pathotype 001). The monitoring of these two loci using molecular markers will allow the introgression of these alleles into cultivars through breeding programs aimed at obtaining coffee plants with durable resistance to H. vastatrix. However, markers flanking both QTLs consist of amplified fragment-length polymorphisms (AFLPs). AFLP markers, being dominant, laborious, and difficult to evaluate, are not suitable for use in large populations, such as those used for MAS in breeding programs [31]. To overcome this problem, AFLP markers must be converted to locus-specific markers based on polymerase chain reactions (PCRs), such as cleaved amplified polymorphic sites (CAPS) and sequence-characterized amplified regions (SCARs) [32,33,34].
Therefore, the development of SCARs from AFLP markers linked to loci conferring resistance to CLR, and their use, together with markers associated with resistance to other H. vastatrix races and CBD, are paramount in MAS and represented the objectives of this study. The efficiency of these markers was tested, and the feasibility of selecting coffee genotypes with broad-spectrum resistance was explored.

2. Materials and Methods

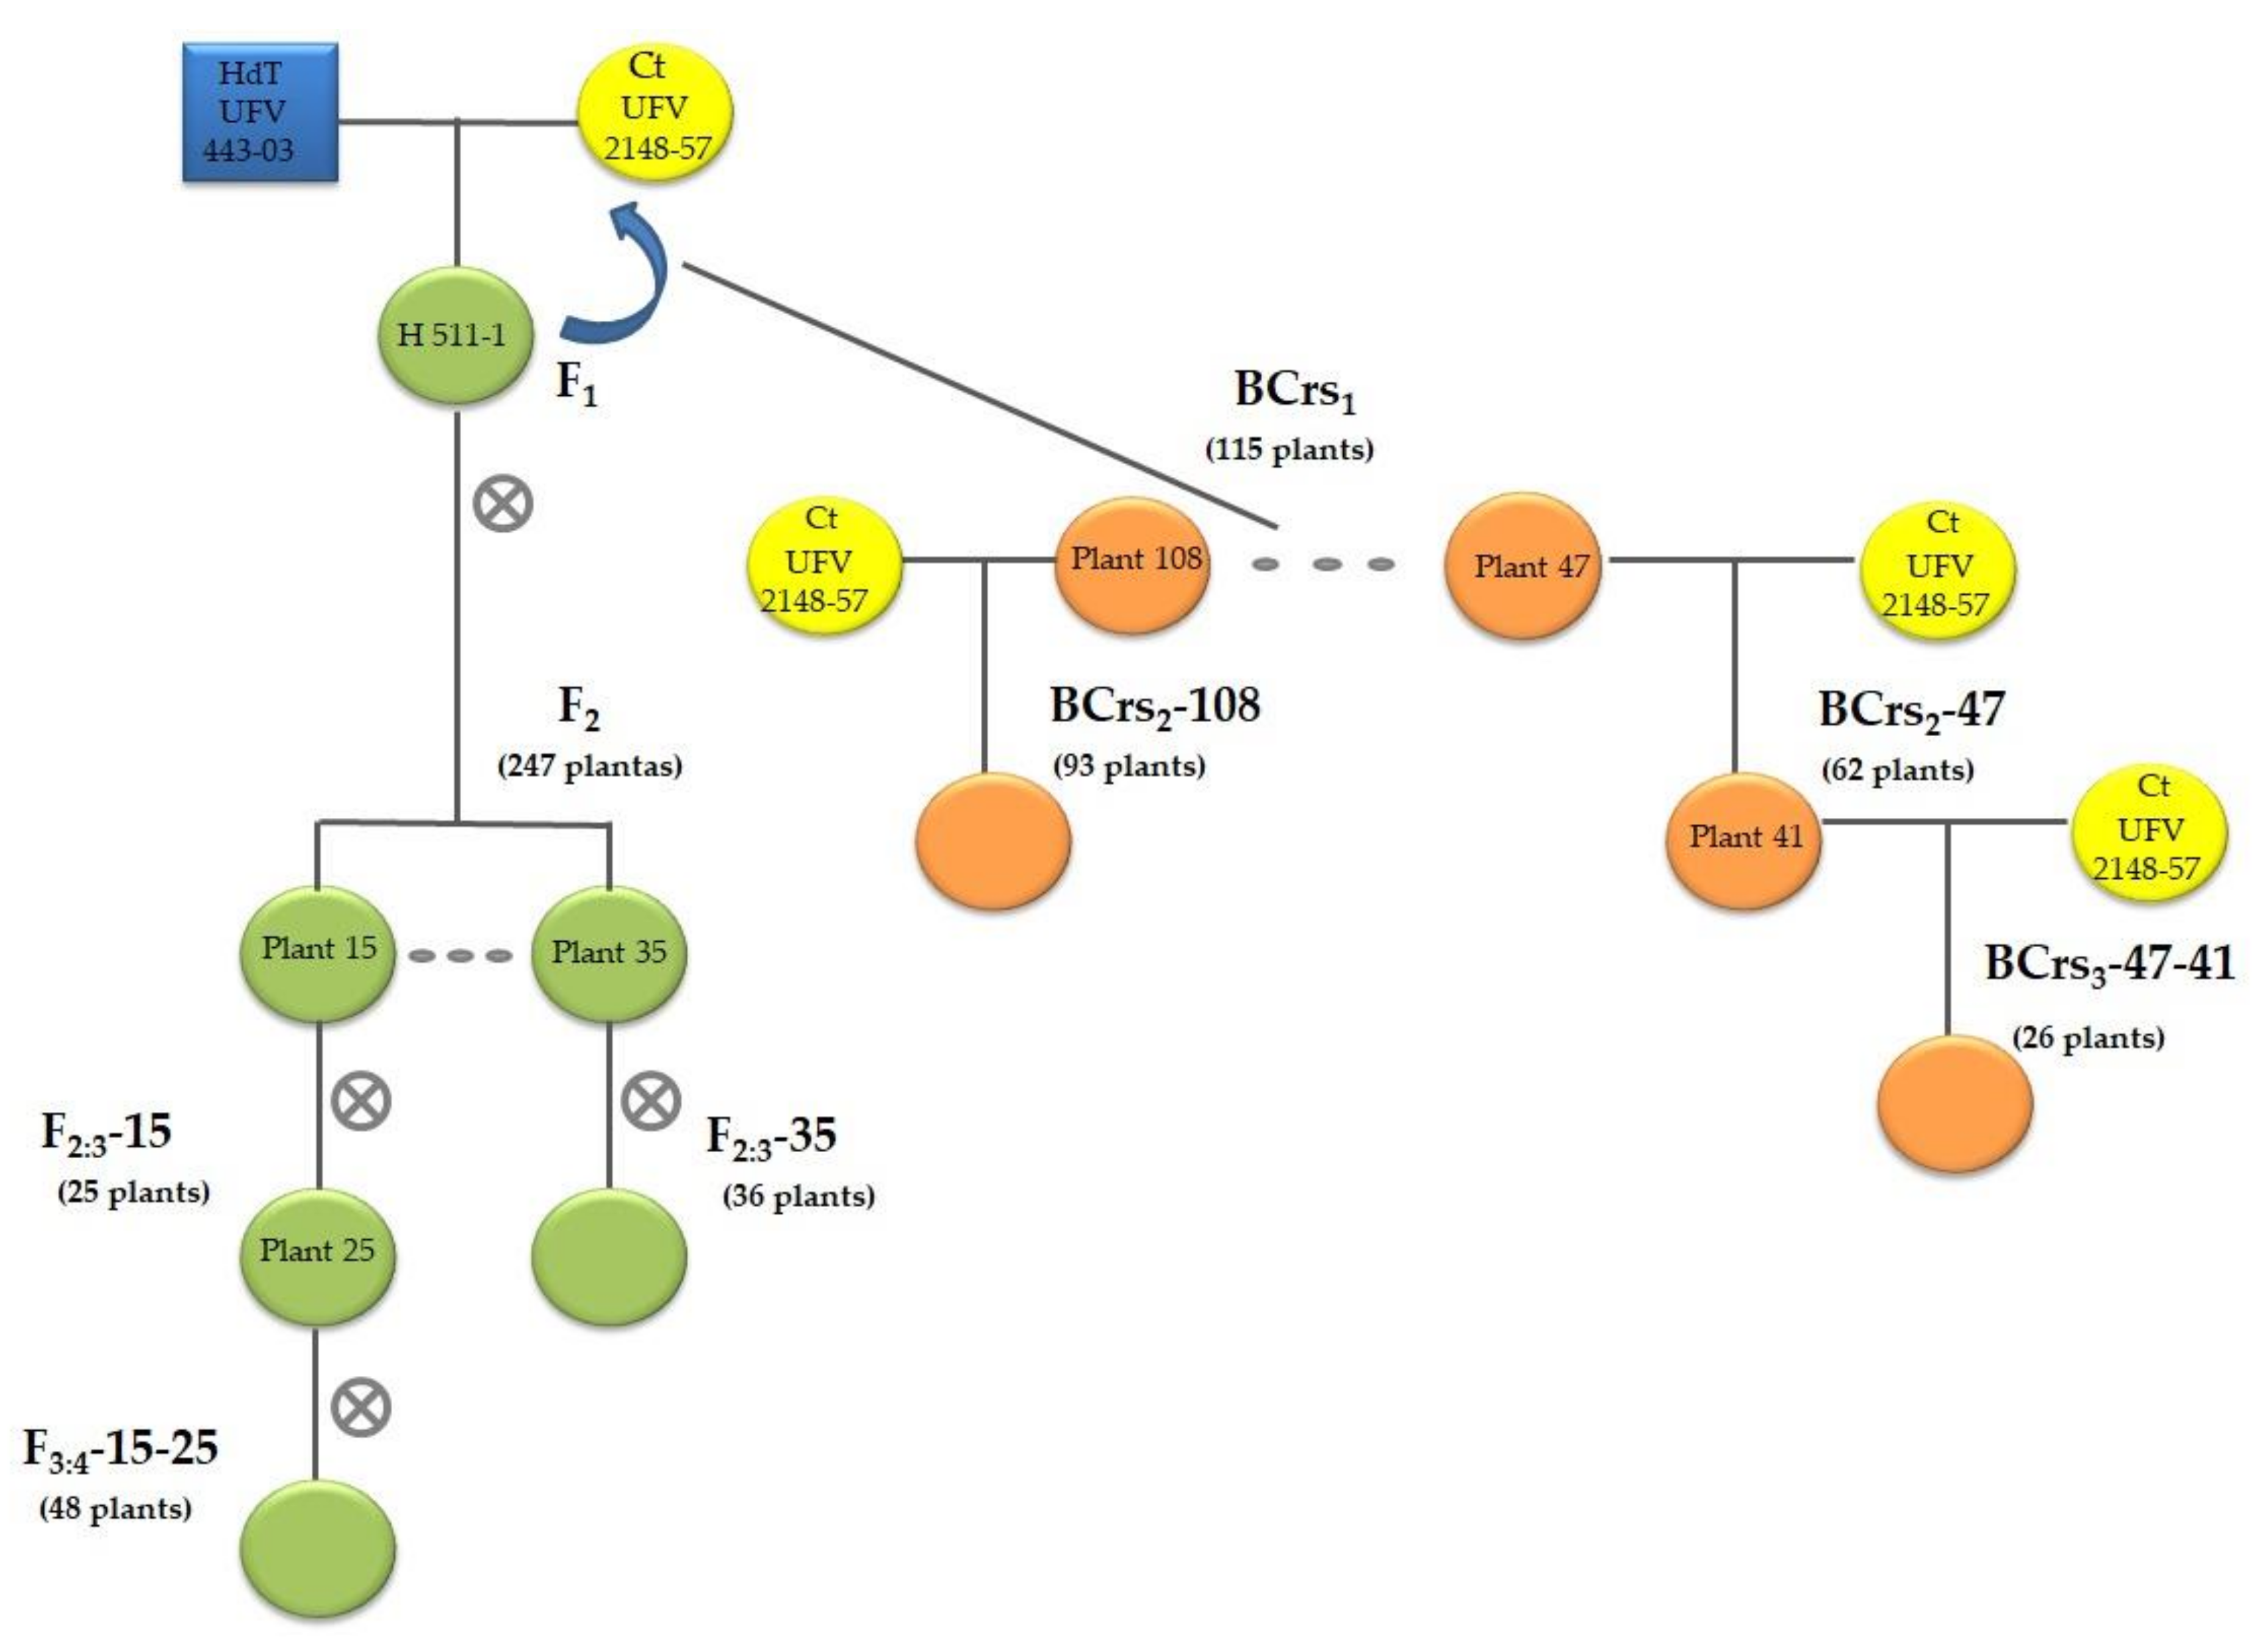
2.1. Plant Material and DNA Extraction

Accession HDT UFV 443-03 was used as the male parent in a controlled cross with the rust-susceptible cultivar Catuaí Amarelo IAC 64 (UFV 2148-57). A plant from the F1 generation, registered as H 511-1, was self-pollinated to obtain the segregating F2 generation (Figure 1), and 247 individuals from the F2 population were used to validate and locate the newly developed markers in the genetic map previously constructed by Pestana et al. [26]. The F1 plant (H 511-1) was also backcrossed with Catuaí Amarelo IAC 64 to carry out genetic analysis and breeding. To evaluate the efficiency of the developed markers for MAS, 2 F2 plants selected as resistant to CLR (plants 15 and 35) were self-pollinated under controlled conditions to generate 2 F2:3 populations, namely F2:3-15 and F2:3-35. Furthermore, 2 populations of the second susceptible backcross were also obtained by crossing the resistant plants of BCrs1 (plants 47 and 108) with the susceptible cultivar Catuaí Amarelo IAC 64 (UFV 2148-57) (Figure 1). Thus, the following populations were obtained: F2:3-15, with 25 individuals; F2:3-35, with 36 individuals; BCrs2-47, with 62 individuals; and BCrs2-108, with 93 individuals.
After confirming marker efficiency, 1 plant from the F2:3-15 population and 1 BCrs2-47 plant resistant to H. vastatrix were selected to generate the F3:4 population (F3:4-15-25) with 48 plants and the BCrs3 population (BCrs3-47-41) with 26 plants. The crosses were performed at the Universidade Federal de Viçosa (UFV), Minas Gerais (Figure 1).
Genomic DNA was extracted from young, fully developed leaves of the parents as well as of the F2, F2:3-15, F2:3-35, F3:4-15-25, BCrs2-47, BCrs2-108, and BCrs3-47-41 plants following the methodology described by Diniz et al. [35]. DNA quality was evaluated on an agarose gel (1%) and quantified using the NanoDrop 2000 spectrophotometer (Thermo Fisher Scientific). DNA samples were standardized at 25 ng·μL−1 and stored at −20 °C until analysis.

2.2. Disease Evaluation

Phenotypic analysis was conducted using an H. vastatrix isolate (race II) from the Coffee Biotechnology Laboratory (BioCafé, UFV). The isolate was maintained by periodic inoculations on cv. Catuaí Vermelho IAC 44 seedlings. For fungal multiplication, urediniospores were deposited on the abaxial surface of completely developed young leaves of cv. Catuaí Vermelho IAC 44 using a brush. The leaves were sprayed with distilled water to make the surface slightly wet. The inoculated plants were kept in the dark at 22 °C for 48 h and subsequently transferred to a growth chamber at 22 °C under a 12 h photoperiod. After abundant sporulation, urediniospores were collected and stored in gelatin capsules, which were placed in a desiccator with a sulfuric acid solution (1.8 density and 32.6% v/v concentration) at the bottom to maintain ~50% relative humidity inside the desiccator. The desiccator was placed in a refrigerator at 4 °C. At the time of inoculum preparation, the viability of H. vastatrix urediniospores was evaluated using a germination test in 2% agar-water medium. Only urediniospores with a viability of >30% were considered suitable for inoculation [36].
The F2:3-15, F2:3-35, BCrs2-47, and BCrs2-108 plants were inoculated with urediniospores of an H. vastatrix isolate (race II) under controlled conditions, using leaf discs approach and 3 replications [37]. Specifically, 16 leaf discs (1.5 cm in diameter) were obtained for each genotype which constituted the sample units. The urediniospores were inoculated onto the abaxial surface of each disc using a brush. Following inoculation, the discs were placed in germination boxes (plastic box 11 × 11 × 3 cm) containing moistened foam and nylon screen. The germination boxes were closed and maintained in the dark for 48 h at 22 °C and then transferred to a chamber at 22 °C under a 12 h light photoperiod. The disks were cleaned with cotton 48 h after inoculation.
The resistance or susceptibility evaluation was initiated when the susceptible parent started sporulating approximately 25 days after inoculation. The evaluation followed the scale of Tamayo et al. [38], which is based on the absence or presence of symptoms. Plants with scores from 1 to 3 were considered resistant (1 = no symptoms, 2 = small chlorotic lesions, and 3 = large chlorotic lesions without sporulation). Plants with scores from 4 to 6 were considered susceptible, as they presented urediniospores (4 = <25% of the lesion area with urediniospores, 5 = 25–50% of the lesion area with urediniospores, and 6 = >50% of the lesion area with urediniospores). Leaf samples were collected and inoculated at 3 different times.

2.3. SCAR and CAPS Marker Development

DNA from HdT UFV 443-03 and Catuaí Amarelo IAC 64 (UFV 2148-57) was amplified using AFLP primers to generate DNA fragments linked to CLR resistance loci [26]. The AFLP combinations used included E-CTG/MAAT1, E-CTT/MTGC3, E-CGA/TCC4, and E-CCC/MAGA1. The amplified fragments were visualized on a polyacrylamide denaturing gel (6%) stained with silver.
Polymorphic bands mapped close to the loci of interest were cut from the polyacrylamide gels using the protocol described by Caetano-Anollés and Trigiano [39]. The amplified products were cloned into the pGEMT-easy vector (Promega, Madison, Wisconsin). Escherichia coli DH5α competent cells were transformed as described by Sambrook et al. [40]. Plasmid DNA from the selected colonies was extracted using the Wizard® Plus SV Minipreps DNA Purification System kit (Promega, Madison, Wisconsin) following the manufacturer’s recommendations. The extracted DNA was sequenced using the ABI 3130XL Genetic Analyzer (Applied Biosystems) in the Coffee Plant Biotechnology Laboratory (BioCafé) located at the Institute of Biotechnology Applied to Agriculture (Bioagro), UFV, Viçosa, MG, Brazil. Low-quality sequences were removed, and consensus sequences were obtained using Sequencer 4.10.1 (Gene Codes Corporation, Ann Arbor, MI, USA). The sequences of vectors and adapters used in cloning were obtained using VecScreen (http://www.ncbi.nlm.nih.gov/tools/vecscreen/ accessed on 15 July 2021) and manually edited. The forward and reverse primers were designed using Primer3 (http://bioinfo.ut.ee/primer3-0.4.0/ accessed on 15 July 2021).

2.4. Linkage Map

Initial validation of the SCAR marker was performed based on its location on the linkage map constructed by Pestana et al. [26]. The SCAR marker was analyzed in the same mapping population, including 247 F2 individuals obtained from a cross between the resistant parent HdT UFV 443-03 and the susceptible parent Catuaí Amarelo IAC 64 (UFV 2148-57). PCR was performed using a 20 μL reaction mixture containing 50 ng of DNA, 0.1 μM of each primer, 0.15 mM of each dNTP (Promega), 2.0 mM of MgCl2, 1.0 U of Taq DNA polymerase (Invitrogen), and 1× PCR reaction buffer. DNA was amplified with a thermocycler (PTC-200; MJ Research and Veriti, Applied Biosystems), programmed as follows: initial denaturation at 94 °C for 5 min, followed by 35 amplification cycles of denaturation at 94 °C for 30 s, annealing at 65 °C for 30 s, and extension at 72 °C for 1 min, and final extension at 72 °C for 10 min. The products were visualized on an agarose gel (1.5%). The CaRHv10 marker was cleaved with the restriction enzyme RsaI (Thermos Life) following the manufacturer’s recommendations to generate the CAPS marker designated CaRHv10_CAPS.
The markers CBD-Sat207 and CBD-Sat235 [27], which are linked to genes conferring CBD resistance, were also localized in the genetic map. PCR was performed as described by Alkimin et al. [18].
Marker data were encoded, combined with the data of Pestana et al. [26], and analyzed using GENES [41]. Linkage groups (LG) were formed and ordered using a minimum LOD score of 3.0 and a maximum recombination value of 30%. The estimated recombination frequencies were converted to genetic distances (centiMorgans; cM). For QTL mapping, statistical analyses were performed as described by Lander and Botstein [42] using GENES [41]. The simple interval method was used for regression analysis. The coefficient of determination (R2) corresponded to the peak of large QTL significance at an LOD score of >3.0.
To confirm the LG formation on the genetic map, a correlation network [43] was created, showing the relationship between the markers of each LG and the phenotypic data. A simple Pearson’s correlation coefficient was used, with 1% and 5% probability based on t-test, in GENES [41]. The Fruchterman and Reingold [44] algorithm was used to create a force-directed layout for the correlation network in which the proximity between nodes (traits) was proportional to the absolute value of correlation between those nodes (represented for 1 of the 115 markers). Analyses were performed using GENES integrated with R 3.1.2. The correlation network was integrated using the Qgraph package [45]. The positive and negative correlations between variables were represented as green and red lines, respectively. The thickness of the lines represented the absolute value of correlation. The width of the line was controlled by applying a cutoff of 0.5.

2.5. Molecular Marker-Assisted Selection Efficiency

The F2, F2:3-15, F2:3-35, BCrs2-47, and BCrs2-108 plants were analyzed using the developed markers and inoculated with an H. vastatrix isolate (race II). The genotype of each plant was inferred based on the presence or absence of the DNA fragment linked to the resistance allele. The phenotype was obtained based on disease data, considering two phenotypic groups: resistant and susceptible. Plants scored as 1–3 (absence of urediniospores) were considered resistant and 4–6 (presence of urediniospores) as susceptible. The phenotypic and genotypic segregations of the populations were analyzed by the χ2 test, using the GENES software [41]. Estimated p value > 0.05 does not reject the hypothesis.
To test the selection efficiency (SE) of the developed SCAR and CAPS markers, the genotypic and phenotypic data of the coffee plants were compared (resistance or susceptibility) based on the following formula, as proposed by [46] with modifications:
SE = − {[(∑ resistant plants without the amplified fragment) + (∑ susceptible plants with the amplified fragment)/nº total plant] × 100} + 100

2.6. Marker-Assisted Selection of Coffee Exhibiting Multiple Disease Resistance

After validating their efficiency, the developed SCAR and CAPS markers were used to select resistant plants in the next generation of breeding (F3:4-15-25 and BCrs3-47-41). PCR was performed as described in Section 2.4. To obtain durable resistance and identify various rust resistance loci, the progenies were also analyzed using the CARF005 marker. This marker amplifies a DNA fragment that corresponds to the nucleotide binding-leucine rich repeat (CC-NBS-LRR) gene [47], which shares conserved sequences with other SH genes and expresses a characteristic polymorphic allele conferring distinct resistance phenotypes [13]. The PCR for CARF005 was performed in a 20 μL reaction mixture containing 50 ng of DNA, 0.1 μM of each primer, 0.15 mM of each dNTP (Promega), 1.0 mM of MgCl2, 1.0 U of Taq DNA polymerase (Invitrogen), and 1× PCR reaction buffer. Amplification was performed with initial denaturation at 94 °C for 5 min, followed by 35 amplification cycles of denaturation at 94 °C for 30 s, annealing at 61 °C for 30 s, and extension at 72 °C for 1 min, and final extension at 72 °C for 10 min. The products were visualized on an agarose gel (1.5%).
To identify coffee plants with multiple disease resistance, both populations were also analyzed using markers associated with CBD resistance [27]. PCR was performed as described by Alkimin et al. [18].

3. Results

3.1. Molecular Marker Development

From the C. arabica genetic map [26], four DNA fragments corresponding to the closest AFLP markers flanking the two resistance loci were selected, cloned, and sequenced. Primers were designed based on the obtained sequences (Table 1) and used for the analysis of both parents of the mapping population, the CLR-resistant HdT UFV 443-03 and CLR-susceptible Catuaí Amarelo IAC 64 (UFV 2148-57). The CaRHv8 marker derived from the AFLP marker linked to the QTL of LG 2 (QTL-LG2) and CaRHv9 derived from the AFLP marker linked to QTL-LG5 showed polymorphism between the coffee parents. CaRHv8 acted as a dominant marker linked in repulsion, being present only in the susceptible coffee parent, while CaRHv9 acted as a dominant marker linked in coupling. The same trend was observed for the AFLP marker, which originated the SCAR markers (Table 1).
The CaRHv7 (QTL-LG2) and CaRHv10 (QTL-LG5) markers showed no polymorphism between the resistant and susceptible parents when the fragments were analyzed on an agarose gel. They were also tested on a polyacrylamide gel, which offers a higher resolution, but they remained monomorphic. Thus, the CaRHv10 marker was converted to a CAPS marker. Following amplification of the resistant and susceptible coffee parents with the SCAR primer CaRHv10, the obtained fragments were sequenced, compared, and analyzed for the presence of restriction sites and single nucleotide polymorphisms (SNPs). The fragments were cleaved with the restriction enzyme RSAI, whose cleavage site was present only in the HdT DNA fragment. The CAPS marker was named CaRHv10_CAPS.
Since we could not successfully convert CaRHv7 in a polymorphic marker, the marker SSR016 [48], which is closely linked to it, was used to monitor QTL-LG2. Accordingly, both QTLs were monitored using a primer-specific marker; QTL-LG2 was flanked by SSR016 and CaRHv8 and QTL-LG5 by CaRHv9 and CaRHv10_CAPS.

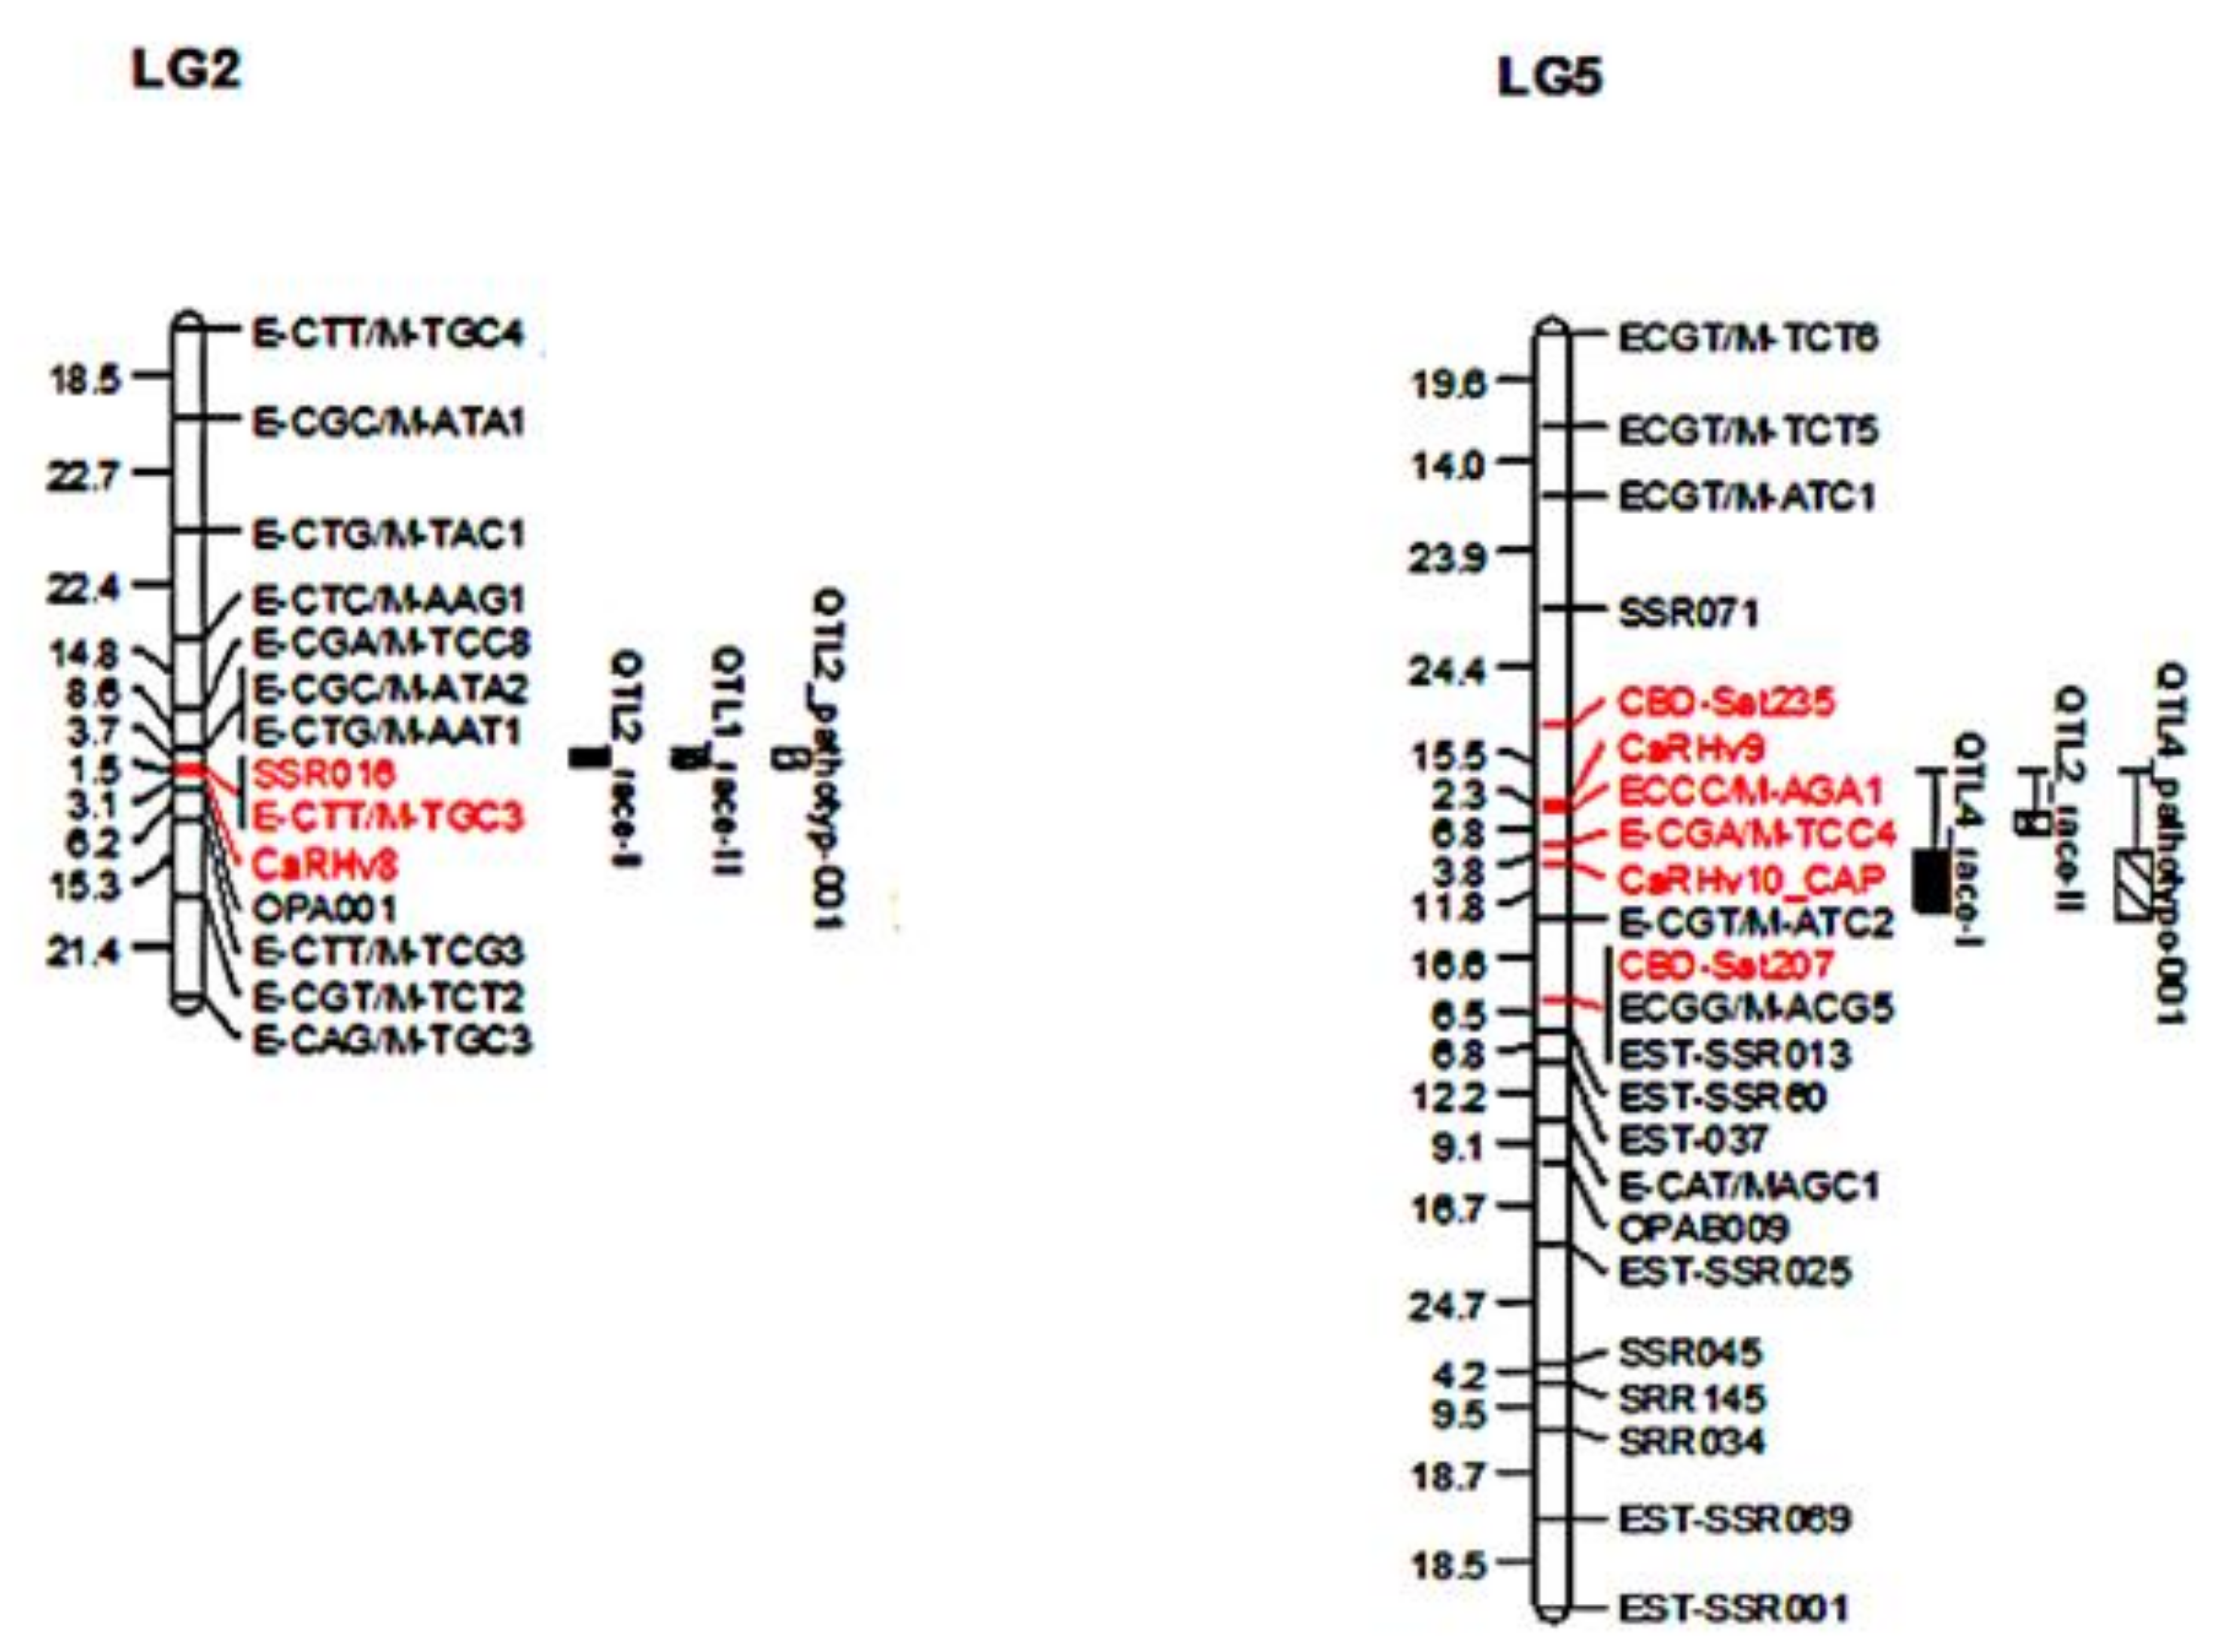
3.2. CaRHv8, CaRHv9, and CaRHv10_CAPS Marker Mapping

To validate and confirm the location of the developed CaRHv8, CaRHv9, and CaRHv10_CAPS markers on the linkage map constructed by Pestana et al. [26], the same 247 individuals of the F2 population mapping were analyzed. The joint data of the newly developed and previously used markers were processed using the same mapping algorithms. CBD-Sat207 and CBD-Sat235 markers were included in the analyses as they flank the genes associated with resistance to CBD—another important coffee disease. With the insertion of markers in the genetic map, LG10 and LG5 obtained by Pestana et al. [26] were joined. Therefore, LG5 in Figure 2 corresponds to LG5 joined to LG10 of the original map.
The results confirmed the mapping of the developed markers close to their respective AFLP markers. CaRHv8 maintained the same linkage order and was mapped at 3.0 cM from the original AFLP ECTT/MTGC3 in LG2. CaRHv9 was mapped at 2.3 cM from the AFLP ECCC/MAGA1, while CaRHv10_CAPS was mapped at 3.8 cM from the AFLP ECGA/MTCC4 in LG5. CBD-Sat207 and CBD-Sat235 were in LG5, flanking the QTL related to CRL resistance (Figure 2).
QTL analysis was performed using the data of all markers and phenotypic data of Pestana et al. [26] (coffee plants inoculated with H. vastatrix isolates from race I, race II, and pathotype 001). The same QTLs found to be associated with the resistance of coffee plants to the three H. vastatrix pathotypes in the previous study [26] were identified, including one locus in LG2 and another in LG5 (Figure 2).
To validate the grouping (LG) obtained in the genetic map and QTL identification, the genotypic and phenotypic data were also used for the correlation study, and a correlation network was created (Figure 3). This network represents the structure of a correlation matrix as a type of proximity graph. In the correlation network, the molecular markers of each LG were clustered. As the line width is proportional to the strength of the correlation, groups corresponding to all 11 LGs of the genetic map could be identified. The phenotypic data (for coffee resistance to the three H. vastatrix pathotypes) were strongly correlated with LG2 (green circles) and LG5 (dark blue circles) marker data, corroborating the importance and association of the molecular markers of these LGs with coffee resistance to race I, race II, and pathotype 001 of H. vastatrix. These results highlight the great potential of using correlation networks for mapping and their possible utility in studies of linkage disequilibrium in which the determinant causes of disequilibrium go beyond the factorial linkage.

3.3. Molecular Marker-Assisted Selection Efficiency

In the breeding program, the F1, F2, and BCrs1 coffee plants were inoculated with the three H. vastatrix pathotypes (race I, race II, and pathotype 001). Resistant plants were selected for the next generation. At this breeding stage, selection was based only on the phenotypic data (Figure 4). In a previous inheritance study of these populations with the same three H. vastatrix pathotypes, the resistance of HdT UFV 443-03 was shown to be conditioned by at least two dominant and independent loci [26]. Thus, in phenotypic analyses, the presence of a dominant allele in one of the two loci was sufficient for the individual to be resistant and selected for the next generation. Based on inheritance and genealogy, the genotypes of the F1, F2, and BCrs1 progenies were inferred (Figure 4).
The genotype definitions of the F2:3 and BCrs1 progenies were obtained based on the molecular patterns using CaRHv8, CaRHv9, CaRHv10-CAPS, and SSR16 markers, which flank both resistance QTLs. Molecular data also enabled the determination of the parental of F2:3 and BCrs1 progenies (Figure 4). The F1, F2:3, and BCr2 populations and their parents were genotyped with these markers and phenotyped with H. vastatrix race II to test the efficiency of the developed markers. Genotypic and phenotypic data are presented in Table 2.
CaRHv8 and SSR16 markers, linked to QTL-LG2, represented locus A of resistance. CaRHv8 acted as a dominant marker and was linked in repulsion. This marker represented allele a and identified individuals with genotypes _a and AA in the population. SSR16 acted as a codominant marker and identified individuals with genotypes AA, Aa, and aa in the populations. CaRHv9 and CaRHv10_CAPS, linked to QTL-LG5, represented locus B of resistance and acted as dominant markers linked in coupling. They identified individuals with genotypes B_ and bb. The genotypic segregation of molecular markers in different populations is shown in Table 2
The phenotypic data revealed that all individuals in the F2:3-15 population were resistant. Although the expected ratio was 15R:1S, the observed ratio was 16R, with 31% probability. In the F2:3-35 population, the segregation ratio was 15R:1S, with 100% probability; in the BCrs2-108 population, the segregation ratio was 12R:4S, with 18% probability; and in the BCrs2-47 population, the segregation ratio was 12R:4S, with 100% probability, at a 5% significance level. Based on both genotypic and phenotypic data, the markers showed high selection efficiency (SE) of 93.6%, 90.0%, 100.0%, and 97.3% for the BCrs2-47, BCrs2-108, F2:3 -15, and F2:3-35 populations, respectively (Table 2).
Further, genotypic and phenotypic data were used to infer the parent genotypes of the breeding populations. Plants 15 and 35 from the F2 population, used as parents for the two F2:3 progenies, showed the AaBb genotype. Based on this genotype, the progenies were predicted to constitute 9 (A_B_): 3 (A-bb): 3 (aaB_): 1 (aabb) (Figure 4), and based on phenotypic data, the segregation ratio was expected to be 15R:1S. However, no phenotypic segregation was observed in the F2:3-15 progeny (Table 2), because the sample size was insufficient to obtain all possible genotypes. From the F2:3 populations, seven coffee plants with the AAB_ genotype were identified and have the potential to produce the next generation in the breeding program.
Plants 47 and 108 from the BCrs1 population showed the AaBb genotype. Respectively, 18 and 24 plants from the BCrs2-47 and BCrs2-108 populations showed the AaB_ genotype and were selected for the next backcross (Table 2).

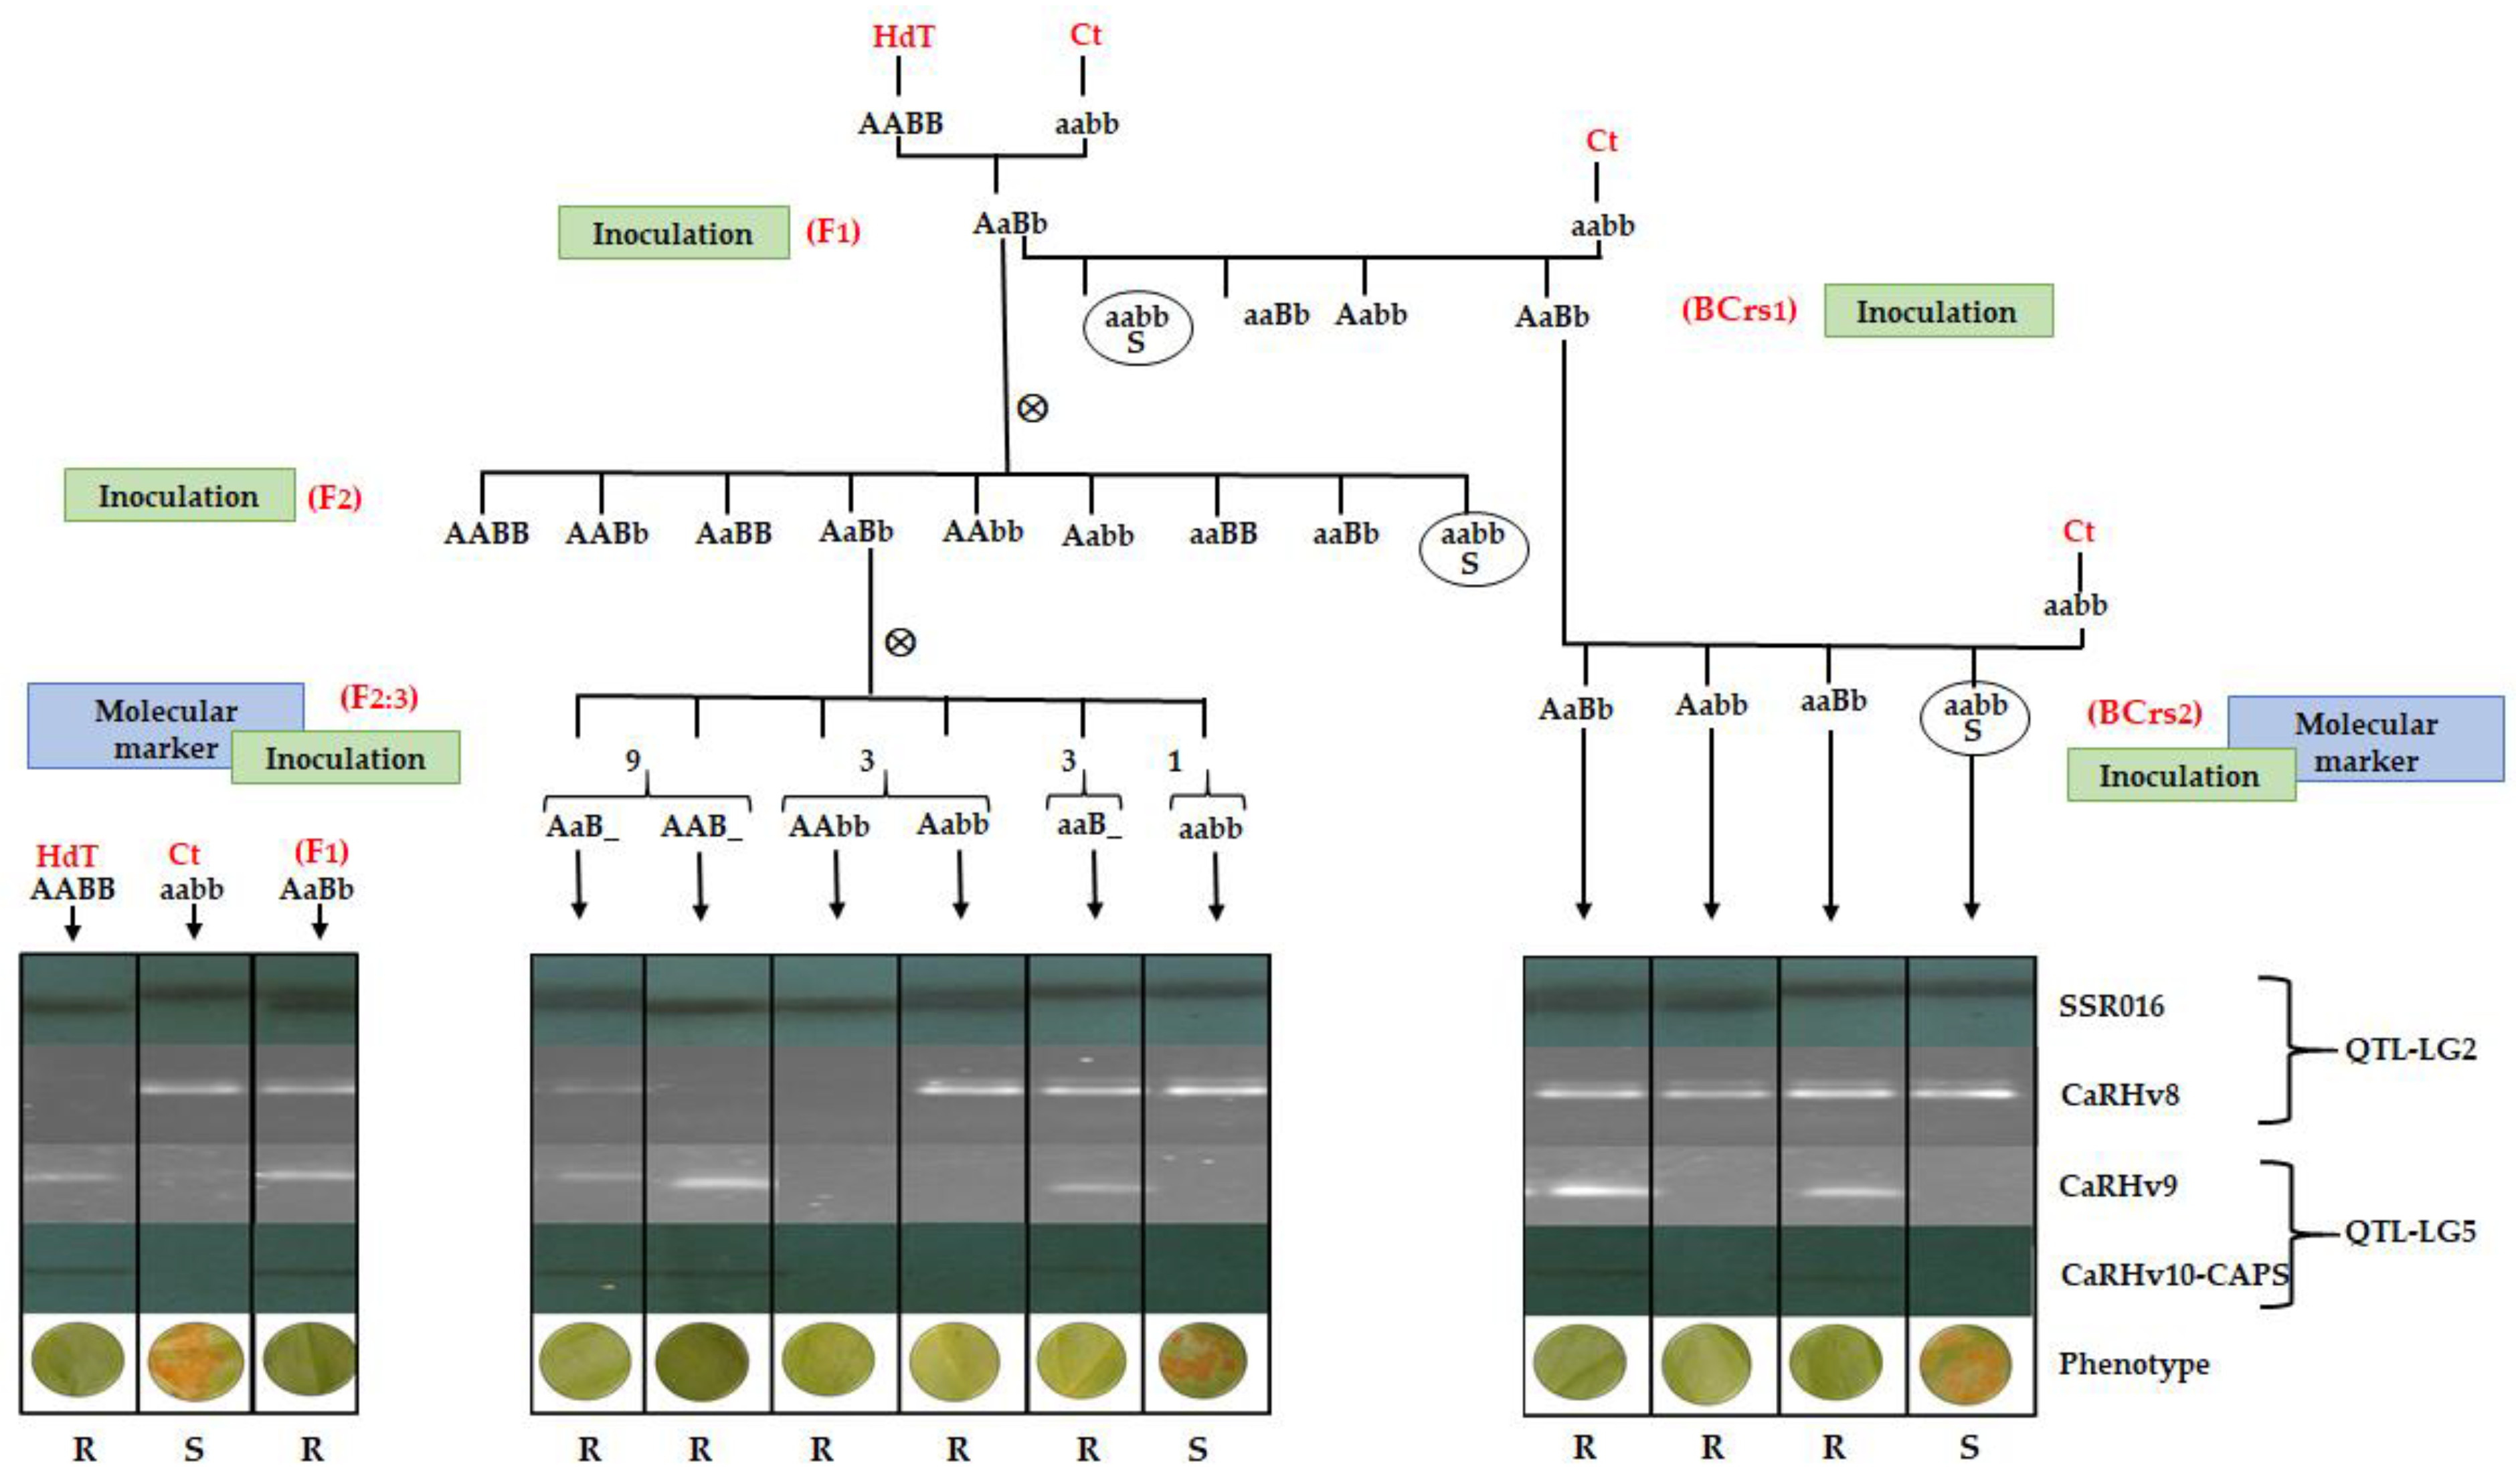
3.4. Selection of F3:4 and BCrs3 Plants with Loci A, B, and C of CLR Resistance and Locus D of CBD Resistance

After confirming the high efficiency of the developed markers in selecting resistant individuals in the F2:3 and BCrs2 populations (Table 2), plant 25 of the F2:3-15 population showing the AAB_ genotype was self-pollinated to produce the F3:4 population with 48 plants. This progeny was termed UFV H511-1-15-25, where H511-1 indicates the selected F1 plant, 15 indicates the selected F2, and 25 indicates the selected F3 plant, to form the F4 population. To obtain the BCrs3 population, plant 41 of the BCrs2-47 population showing the AaB_ genotype was crossed with the recurrent susceptible parent to produce the BCrs3 population with 26 plants, and this progeny was labeled UFV-H511-1-47-41. (Figure 1).
To detect the pyramiding of loci associated with the resistance of coffee to CLR caused by different H. vastatrix pathotypes and CBD, plant 25 of the F2:3-15 population, plant 41 of the BCrs2-47, and all F3:4 and BCrs3 plants were genotyped using different molecular markers. CaRHv8 (Locus A), SSR16 (Locus A), CaRHv9 (Locus B), and CaRHv10_CAPS (Locus B), which confer resistance to race I, race II, and pathotype 001 of H. vastatrix, were used to monitor the presence of QTL-LG2 and QTL-LG5. CARF005 (Locus C), a resistance gene analog (RGA) marker [13,46], associated with other loci conferring resistance to CLR was also used. This marker shares conserved sequences with other CLR resistance genes and displays a characteristic polymorphic allele conferring different resistance phenotypes [13]. In order to develop coffee genotype with multiple disease resistance genes, the markers CBD-Sat207 and CBD-Sat235 (Locus D) associated with resistance to CBD were included in the MAS approach.
Genotypic data showed that the parental, the plant 25 exhibited the AAB_C_DD genotype. Analyses of the F3:4 population showed that all 48 plants exhibited the AA genotype, with both markers for locus A (SSR-16 and CaRHv8). For loci B and C, no bb and cc genotypes were found, suggesting that all 48 F3:4 plants exhibited the AABBCC genotype of CLR resistance. In the evaluation of CBD resistance, all plants exhibited the DD genotype. Therefore, in the F3:4 population, all homozygotes harbored a resistance locus and exhibited the genotype AABBCCDD (Table 3).
For 26 plants of the BCrs3 population, the genotyping data for locus A showed r 10 and 15 plants exhibiting the genotypes Aa and aa, respectively. Unexpectedly, one plant presented the AA genotype; this plant probably resulted from self-pollination and was discarded. For locus B, 19 and 6 plants exhibited the Bb and bb genotypes, respectively. These data confirm that the parental BCrs2-47 exhibited the AaBb genotype. Distortion upon segregation was observed for locus B, probably because of the sample size. Similar segregation was found for locus C, at a ratio of 19Cc:6cc, suggesting that plant 41 of the BCrs2-47 population exhibited the AaBbCc genotype.
In genotyping of BCrs3 for CBD resistance (locus D), one self-pollinated plant was also observed, confirming the data showed by locus A. Differences in the presence of the resistance allele were found for both markers of the D locus. For the CBD-Sat207 marker, 16 and 9 plants showed the Dd and dd genotypes, respectively. For CBD-Sat235, 17 and 8 plants showed the Dd and dd genotypes, respectively (Table 3). Therefore, one plant from the UFV-H511-1-47-41 population showed the Dd genotype for one marker and the dd genotype for the other marker, indicating recombination of CBD-Sat207 and CBD-Sat235. This recombination may be explained by the distance of the CBD-Sat207 marker from the Ck 1 CBD resistance gene. According to Gichuru et al. [27], the estimated distance between this marker and the CBD resistance gene is 17.2 cM. To avoid the loss of the resistance gene, we considered only those plants with both markers comprising the D allele of resistance. Accordingly, we considered 17 plants with the Dd genotypes. Based on genotypic data, six plants with resistance alleles at all loci and exhibiting the genotype AaBbC_Dd were selected for use in breeding programs aimed at multiple disease resistance.

4. Discussion

To meet the demand of food production for the rapidly increasing world population while limiting the application of potentially pollutant pesticides, alternative strategies, such as the use of resistant cultivars, have been replacing traditional chemical control methods. However, developing rust-resistant coffee cultivars is a big challenge because of the long and laborious genetic breeding process and rapid pathogen evolution. The high variability of H. vastatrix threatens coffee production, as the pathogen can overcome the resistance of the planted cultivars, rendering disease control difficult [8,12]. Coffee genotypes previously resistant to all known rust pathotypes are already susceptible to hypervirulent H. vastatrix isolates [49,50]. Therefore, innovative approaches have been introduced in breeding programs to increase the accuracy and speed of the process and to allow for the development of more durable resistant cultivars. In our study, molecular markers flanking two independent loci associated with coffee resistance to different H. vastatrix pathotypes were developed, validated, and used to monitor resistance genes in breeding program.
In a previous study [26], AFLP markers associated with two QTLs conferring resistance to three H. vastatrix pathotypes (race I, race II, and pathotype 001) were identified. AFLP markers are multiplex and offer the advantage of analyzing a large number of markers in a single experiment; however, the laborious methodology limits their large-scale application in marker-assisted plant breeding [31,51,52]. Therefore, we converted AFLP markers to sequence-specific PCR-based markers to expand their application to coffee breeding programs. The developed SCAR and CAPS markers were located on the genetic map, allowing the use of markers flanking both QTLs. For breeding purposes, a combination of two markers flanking the loci of interest can facilitate locus monitoring and enhance selection accuracy in populations segregating for resistance [52,53]. We found that CaRHv9 marker was located at 1.01 cM from QTL-LG5. The use of molecular markers closely linked to resistance loci increased selection efficiency by decreasing the possibility of recombination between the marker and gene of interest. Closely linked and flanking markers combined with the recently compiled genome sequences [54] (C. arabica, https://www.ncbi.nlm.nih.gov/genome accessed on 15 July 2021) are anticipated to allow the identification of candidate genes conferring resistance and further our knowledge of the disease resistance process.
To confirm marker grouping in the genetic map and the location of QTLs of CLR resistance, correlation analysis using molecular data of all markers and phenotypic data of coffee plant resistance to the three H. vastatrix pathotypes (race I, race II, and pathotype 001) was performed. The correlation network confirmed the formation of 11 LGs on the C. arabica genetic map, which represents the basic number of chromosomes of the species (x = 11) (https://www.ncbi.nlm.nih.gov/genome accessed on 15 July 2021) [55,56]. As such, LG2 and LG5 marker data were correlated with phenotypic data, corroborating the presence of two independent CLR resistance loci in these LGs.
The efficiency of the developed markers in the selection of resistant coffee was evaluated by genotyping individuals from the F2:3 and BCrs2 breeding populations using molecular markers linked to the two QTLs and phenotyping with H. vastatrix race II. This race was selected because it is the most common and widespread race worldwide [7,8] and because both identified QTLs are associated with resistance to this race [26]. The developed molecular markers showed high selection efficiency with accuracy exceeding 90% in MAS. A combination of markers in the opposite linkage phase and co-dominant markers flanking the resistance QTLs enables us to infer the allelic constitution of individuals in a breeding population. The distinction between homozygous and heterozygous resistant plants was also feasible using some of these markers.
In previous studies, markers linked to different loci associated with coffee resistance to other races of H. vastatrix have also been identified, and all these markers can be used in MAS for pyramiding multiple resistance genes, with different resistance spectra against a single pathogen or multiple pathogens in the same genetic background [52]. The first coffee rust resistance markers were associated with the SH3 gene [22,23]. This gene was identified in C. liberica and introgressed in C. arabica by natural interspecific hybrids. The markers associated with SH3 were analyzed in our breeding populations and parents, but they lacked this gene as the breeding progenies did not present the C. liberica background.
In our breeding program, HdT UFV 443-03 was used as the disease resistance source. HdT accessions constitute interspecific hybrids between C. arabica and C. canephora and are the principal source of CLR resistance genes in C. arabica breeding programs worldwide [9,17]. This germplasm comprises genotypes with substantial genetic variability [2,29] and presents resistant traits of C. canephora and sensory traits of C. arabica [17,57].
For HdT rust resistance genes, a functional molecular marker, CARF005, has been identified and developed [13,47], and this marker is used in direct rust resistance screening. CARF005 tags a resistance gene analog encoding the disease resistance nucleotide binding-ARC (APAF-1, R protein, and CED-4) domain. The characterized gene shares conserved sequences with other SH genes and expresses a characteristic polymorphic allele conferring different resistance phenotypes [13]. This CLR resistance gene was detected in our breeding progenies. Monitoring of this gene and the two QTLs related to resistance using molecular markers can allow for the pyramiding of different resistance loci in a cultivar and achieving durable resistance to the most important coffee disease. The three resistance markers constituted distinct loci in the genetic map. To the best of our knowledge, few studies have used pyramiding and MAS approaches to select rust-resistant coffee cultivars [18,58,59].
Molecular markers linked to the CBD resistance gene have also been identified in HdT accessions [27]. A genetic map was constructed with eight AFLP and two SSR markers linked to this gene and located in a segment of 11 cM. We used the two SSR markers aiming at preventive breeding, as the markers enable the identification of resistant progenies even in the absence of pathogen. CBD can lead to up to 80% loss of crop production in C. arabica if no control is applied [28]. Although this disease is currently restricted to Africa [18,60], there are concerns of its spread to other producer countries. Climatic conditions in some coffee-producing regions of America and Asia are conducive to the growth of this fungus; therefore, CBD is a quarantinable disease with a risk of becoming endemic [60]. Therefore, introducing CBD resistance genes into coffee cultivars is a strategic approach to address this potential disease.
The new SCAR and CAPS molecular markers, in addition to other markers linked to different loci of resistance to H. vastatrix (CLR) and Colletotrichum kahawae (CBD), were used for the selection of coffee plants with multiple resistance. MAS enables the advancement of genetic breeding using individuals with resistance alleles at all loci. In the F4 population, plants homozygous for all resistance loci (fixed resistance allele) were detected (AABBCCDD), and in the BCrs3 population, plants heterozygous for all loci were detected (A_B_C_D_). The development and validation of specific markers, which are easy to reproduce and evaluate, are critical for the rapid advancement of coffee breeding programs. Molecular markers can reliably distinguish between resistance genes of diverse specificities and successfully control their transfer during crossing and selection, thereby substantially increasing the efficiency of introgression in breeding for the two most important diseases of coffee.
The introduction of multiple resistance genes in cultivars is the most promising approach for developing resistant cultivars [61,62,63]. Gene pyramiding is an effective way to enhance durable disease resistance in crops. This breeding strategy may achieve broad-spectrum and long-lasting resistance and protect crops from naturally mixed pathogens [64,65]. In this regard, disease-resistant cultivars can make substantial contributions to ecologically sustainable coffee production and socioeconomic benefits for the global coffee market.

5. Conclusions

The molecular markers developed and validated in the present study constitute an important tool with the potential for application in the selection of coffee cultivars with durable resistance to H. vastatrix. The efficiency of the markers was confirmed, and they were used to select coffee cultivars harboring distinct loci for resistance to two major coffee diseases—CLR and CBD. The implementation of these markers in coffee breeding programs improved efficiency in the selection and enabled discarding of plants that do not have the resistance genes. Moreover, individuals homozygous and heterozygous for resistance alleles could be identified. The information gathered and the methodology developed in this work are useful for efficient breeding and development of cultivars with broad-spectrum resistance to ensure sustainable coffee production. Development of cultivars combining yield and quality with durable resistance to CLR and CBD can greatly increase the sustainability of global arabica coffee production.

Author Contributions

Conceptualization, D.P.d.A. and E.T.C.; Formal Analysis, D.P.d.A., E.T.C., R.D.S.R., and C.D.C.; Investigation, D.P.d.A., K.F.M., A.C.B.d.O., K.N.P.d.F., A.A.P., and L.Z.; Methodology, D.P.d.A. and K.F.M.; Writing—Review and Editing, D.P.d.A. and E.T.C. All authors have read and agreed to the published version of the manuscript.

Funding

This work was financially supported by the Brazilian Coffee Research and Development Consortium (Consórcio Pesquisa Café, CBP&D/Café), the Foundation for Research Support of the State of Minas Gerais (FAPEMIG), the National Council of Scientific and Technological Development (CNPq), the National Institutes of Science and Technology of Coffee (INCT/Café), and Coordination for the Improvement of Higher Education Personnel (CAPES).

Institutional Review Board Statement

Not applicable.

Informed Consent Statement

Not applicable.

Data Availability Statement

Not applicable.

Conflicts of Interest

The authors declare that they have no conflict of interests.

References

  1. Davis, A.P.; Govaerts, R.; Bridson, D.M.; Stoffelen, P. An annotated taxonomic conspectus of the genus Coffea (Rubiaceae). Bot. J. Linn. Soc. 2006, 152, 465–512. [Google Scholar] [CrossRef] [Green Version]
  2. Setotaw, T.A.; Caixeta, E.T.; Pereira, A.A.; Oliveira, A.C.B.; Cruz, C.D.; Zambolim, E.M.; Zambolim, L.; Sakyiama, N.S. Coefficient of Parentage in L. Cultivars Grown in Brazil. Crop Science 2013, 53, 1237. [Google Scholar] [CrossRef]
  3. Sousa, T.V.; Caixeta, E.T.; Alkimim, E.R.; Oliveira, A.C.B.; Pereira, A.A.; Sakiyama, N.S.; de Resende Júnior, M.F.; Zambolim, L. Population structure and genetic diversity of coffee progenies derived from Catuaí and Híbrido de Timor revealed by genome-wide SNP marker. Tree Genet. Genomes 2017, 13. [Google Scholar] [CrossRef] [Green Version]
  4. Merot-l'Anthoene, V.; Tournebize, R.; Darracq, O.; Rattina, V.; Lepelley, M.; Bellanger, L.; Tranchant-Dubreuil, C.; Coulée, M.; Pégard, M.; Metairon, S.; et al. Development and evaluation of a genome-wide Coffee 8.5K SNP array and its application for high-density genetic mapping and for investigating the origin of Coffea arabica L. Plant Biotechol. J. 2019, 17, 1418–1430. [Google Scholar] [CrossRef] [Green Version]
  5. Sánchez, E.; Solano, W.; Gatica-Arias, A.; Chavarría, M.; Araya-Valverde, E. Microsatellite DNA fingerprinting of Coffea sp. germplasm conserved in Costa Rica through singleplex and multiplex PCR. Crop Breed. Appl. Biotechnol. 2020, 20. [Google Scholar] [CrossRef]
  6. Scalabrin, S.; Toniutti, L.; Gaspero, G.D.; Scaglione, D.; Magris, G.; Vidotto, M.; Pinosio, S.; Cattonaro, F.; Magni, F.; Jurman, I.; et al. A single polyploidization event at the origin of the tetraploid genome of Coffea arabica is responsible for the extremely low genetic variation in wild and cultivated germplasm. Sci. Rep. 2020, 10, 4642. [Google Scholar] [CrossRef] [Green Version]
  7. Zambolim, L.; Caixeta, E.T. An overview of physiological specialization of coffee leaf rust—New designation of pathotypes. Int. J. Curr. Res. 2021, 13, 15479–15490. [Google Scholar]
  8. Zambolim, L. Current status and management of coffee leaf rust in Brazil. Trop. Plant Pathol. 2016, 41, 1–8. [Google Scholar] [CrossRef] [Green Version]
  9. Talhinhas, P.; Batista, D.; Diniz, I.; Vieira, A.; Silva, D.N.; Loureiro, A.; Tavares, S.; Pereira, A.P.; Azinheira, H.G.; Guerra-Guimarães, L.; et al. The coffee leaf rust pathogen Hemileia vastatrix: One and a half centuries around the tropics. Mol. Plant Pathol. 2017, 18, 1039–1051. [Google Scholar] [CrossRef] [Green Version]
  10. Bettencourt, A.J.; Noronha-Wagner, M. Genetic factors conditioning resistance of Coffea arabica L. to Hemileia vastatrix Berk & Br. Agron. Lusit. 1971, 31, 285–292. [Google Scholar]
  11. Bettencourt, A.J.; Rodrigues, C.J. Principles and pratice of coffee breeding for resistance to rust and other diseases. Coffee Agron. 1988, 4, 199–234. [Google Scholar]
  12. Várzea, V.M.P.; Marques, D.V. Population variability of Hemileia vastatrix vs. coffee durable resistance. In Durable Reistance to Coffee Leaf Rust; Zambolim, L., Zambolim, E.M., Várea, V.M.P., Eds.; Universidade Federal de Viçosa: Viçosa, Brazil, 2005; pp. 53–74. [Google Scholar]
  13. Barka, G.D.; Caixeta, E.T.; Ferreira, S.S.; Zambolim, L. In silico guided structural and functional analysis of genes with potential involvement in resistance to coffee leaf rust: A functional marker based approach. PLoS ONE. 2020, 15, e0222747. [Google Scholar] [CrossRef]
  14. Almeida, D.P.; Castro, I.S.L.; Mendes, T.A.O.; Alves, D.R.; Barka, G.D.; Barreiros, P.R.R.M.; Zambolim, L.; Sakiyama, N.S.; Caixeta, E.T. Receptor-like kinase (Rlk) as a candidate gene conferring resistance to Hemileia vastatrix in coffee. Sci Agric. 2021, 78, 1–9. [Google Scholar] [CrossRef]
  15. Barbosa, I.P.; Costa, W.G.; Nascimento, M.; Cruz, C.D.; Oliveira, A.C.B. Recommendation of Coffea arabica genotypes by factor analysis. Euphytica 2019, 215, 178. [Google Scholar] [CrossRef]
  16. Sousa, T.V.; Caixeta, E.T.; Alkimim, E.R.; Oliveira, A.C.B.; Pereira, A.A.; Sakiyama, N.S.; Zambolim, L.; Resende, M.D.V. Early Selection Enabled by the Implementation of Genomic Selection in Coffea arabica Breeding. Front. Plant Sci. 2019, 9. [Google Scholar] [CrossRef] [PubMed] [Green Version]
  17. Setotaw, T.A.; Caixeta, E.T.; Zambolim, E.M.; Sousa, T.V.; Pereira, A.A.; Oliveira, A.C.B.; Cruz, C.D.; Zambolim, L.; Sakiyama, N.S. Genome Introgression of Híbrido de Timor and Its Potential to Develop High Cup Quality C. arabica Cultivars. J. Agric. Sci. 2020, 12, 64. [Google Scholar] [CrossRef] [Green Version]
  18. Alkimim, E.R.; Caixeta, E.T.; Sousa, T.V.; Pereira, A.A.; de Oliveira, A.C.B.; Zambolim, L.; Sakiyama, N.S. Marker-assisted selection provides arabica coffee with genes from other Coffea species targeting on multiple resistance to rust and coffee berry disease. Mol. Breed. 2017, 37, 6. [Google Scholar] [CrossRef] [Green Version]
  19. <named-content content-type="background:white">Lin, M.; Corsi, B.; Ficke, A.; Tan, K.C.; Cockram, J.; Lillemo, M. Genetic mapping using a wheat multi-founder population reveals a locus on chromosome 2A controlling resistance to both leaf and glume blotch caused by the necrotrophic fungal pathogen Parastagonospora nodorum. Theor. Appl. Genet. 2020, 133, 785–808. [Google Scholar]
  20. Muellner, A.E.; Eshonkulov, B.; Hagenguth, J.; Pachler, B.; Michel, S.; Buerstmayr, M.; Hole, D.; Buerstmayr, H. Genetic mapping of the common and dwarf bunt resistance gene Bt12 descending from the wheat landrace PI119333. Euphytica 2020, 216, 1–15. [Google Scholar] [CrossRef]
  21. Galiano-Carneiro, A.L.; Kessel, B.; Presterl, T.; Gaikpa, D.S.; Kistner, M.B.; Miedaner, T. Multi-parent QTL mapping reveals stable QTL conferring resistance to Gibberella ear rot in maize. Euphytica 2021, 217, 1–13. [Google Scholar] [CrossRef]
  22. Prakash, N.S.; Marques, D.V.; Varzea, V.M.P.; Silva, M.C.; Combes, M.C.; Lashermes, P. Introgression molecular analysis of a leaf rust resistance gene from Coffea liberica into C. arabica L. Theor. Appl. Genet. 2004, 109, 1311–1317. [Google Scholar] [CrossRef]
  23. Mahé, L.; Combes, M.-C.; Várzea, V.M.P.; Guilhaumon, C.; Lashermes, P. Development of sequence characterized DNA markers linked to leaf rust (Hemileia vastatrix) resistance in coffee (Coffea arabica L.). Mol. Breed. 2008, 21, 105–113. [Google Scholar] [CrossRef]
  24. Diola, V.; de Brito, G.G.; Caixeta, E.T.; Maciel-Zambolim, E.; Sakiyama, N.S.; Loureiro, M.E. High-density genetic mapping for coffee leaf rust resistance. Tree Genet. Genomes 2011, 7, 1199–1208. [Google Scholar] [CrossRef] [Green Version]
  25. Romero, G.; Vásquez, L.M.; Lashermes, P.; Herrera, J.C. Identification of a major QTL for adult plant resistance to coffee leaf rust (Hemileia vastatrix) in the natural Timor hybrid (Coffea arabica x C. canephora). Plant Breed. 2014, 133, 121–129. [Google Scholar] [CrossRef]
  26. Pestana, K.N.; Capucho, A.S.; Caixeta, E.T.; de Almeida, D.P.; Zambolim, E.M.; Cruz, C.D.; Zambolim, L.; Pereira, A.A.; de Oliveira, A.C.B.; Sakiyama, N.S. Inheritance study and linkage mapping of resistance loci to Hemileia vastatrix in Híbrido de Timor UFV 443-03. Tree Genet. Genomes 2015, 11. [Google Scholar] [CrossRef] [Green Version]
  27. Gichuru, E.K.; Agwanda, C.O.; Combes, M.C.; Mutitu, E.W.; Ngugi, E.C.K.; Bertrand, B.; Lashermes, P. Identification of molecular markers linked to a gene conferring resistance to coffee berry disease (Colletotrichum kahawae) in Coffea arabica. Plant Pathol. 2008, 57, 1117–1124. [Google Scholar] [CrossRef]
  28. Gimase, J.M.; Thagana, W.M.; Omondi, C.O.; Cheserek, J.J.; Gichimu, B.M.; Gichuru, E.K. Quantitative trait loci (QTL) mapping of resistance to coffee berry disease (Colletotrichum kahawae Waller Bridge) in Coffea arabica L. variety Rume Sudan. Afr. J. Agric. Res. 2020, 16, 1184–1194. [Google Scholar] [CrossRef]
  29. Silva, R.A.; Zambolim, L.; Castro, I.S.L.; Rodrigues, H.S.; Cruz, C.D.; Caixeta, E.T. The Híbrido de Timor germplasm: Identification of molecular diversity and resistance sources to coffee berry disease and leaf rust. Euphytica 2018, 214, 153. [Google Scholar] [CrossRef]
  30. Bertrand, B.; Guyot, B.; Anthony, F.; Lashermes, P. Impact of the Coffea canephora gene introgression on the beverage quality of C. arabica. Theor. Appl. Genet. 2003, 107, 387–394. [Google Scholar] [CrossRef] [PubMed]
  31. Lopes, M.S.; Lopes, M.T.G.; Figueira, A.; Camargo, L.E.A.; Fungaro, M.H.P.; Carneiro, M.S.; Vieira, M.L.C. Marcadores moleculares dominantes (RAPD e AFLP). Biotecnologia Ciência Desenvolvimento 2002, 5, 56–60. [Google Scholar]
  32. Kumar, S.; Saxena, S. Sequence Characterized Amplified Regions Linked with Apomictic Mode of Reproduction in Four different apomictic Cenchrus Species. Mol. Plant Breed. 2016, 7, 1–14. [Google Scholar] [CrossRef]
  33. Moncada, M.D.P.; Tovar, E.; Montoya, J.C.; González, A.; Spindel, J.; McCouch, S. A genetic linkage map of coffee (Coffea arabica L.) and QTL for yield, plant height, and bean size. Tree Genet. Genomes 2016, 12, 5. [Google Scholar] [CrossRef]
  34. Zhang, N.; Xu, B.; Bi, Y.; Lou1, Q.; Chen, J.; Qian, C. Development of a Muskmelon Cultivar with Improved Resistance to Gummy Stem Blight and Desired Agronomic Traits Using Gene Pyramiding. Czech J. Genet. Plant Breed. 2017, 53. [Google Scholar] [CrossRef] [Green Version]
  35. Diniz, L.E.C.; Sakiyama, N.S.; Lashermes, P.; Caixeta, E.T.; Oliveira, A.C.B.; Zambolim, E.M.; Loureiro, M.E.; Pereira, A.A.; Zambolim, L. Analysis of AFLP markers associated to the Mex-1 resistance locus in Icatu progenies. Crop. Breed. Appl. Biotechnol. 2005, 5, 387–393. [Google Scholar] [CrossRef]
  36. Zambolim, L.; Chaves, M.C. Efeito de baixas temperaturas e do binomio temperatura-umidade relativa sobre a viabilidade dos uredosporos de Hemileia vastatrix Berk. et Br. e Uromyces phaseoli typica arth. Experientiae 1974, 17, 151–184. [Google Scholar]
  37. Eskes, A.B.; Toma-Braghini, M. The effect of leaf age on incomplete resistance of coffee to Hemileia vastatrix. Netherlands J. Plant Pathol. 1982, 88, 219–230. [Google Scholar] [CrossRef]
  38. Tamayo, P.J.; Vale, F.X.R.; Zambolim, L.; Chaves, G.M.; Pereira, A.A. Resistência do Catimor à ferrugem e virulência de raças fisiológicas de Hemileia vastatrix Berk. & Br. Fitopatol. Bras. 1995, 20, 572–576. [Google Scholar]
  39. Caetano-Anollés, G.; Trigiano, R.N. Recovery of DNA Amplification Products from Silver-Stained polyacrrylamide Gels. Methods in MolecularBiology. In PCR Cloning Protocols-From Molecular Cloning to Genetic Engineering; White, B.A., Ed.; Humana Press: Totowa, NJ, USA, 1996; pp. 111–127. [Google Scholar]
  40. Sambrook, J.; Fritsch, E.F.; Maniatis, T. Molecular Cloning: A Laboratory Manual, 2nd ed; Cold Spring Harbor Laboratory Press: New York, NY, USA, 1989. [Google Scholar]
  41. Cruz, C.D. Programa Genes—Ampliado e integrado aos aplicativos R, Matlab e Selegen. Acta Sci. Agron. 2016, 38, 547–552. [Google Scholar] [CrossRef] [Green Version]
  42. Lander, E.S.; Botstein, D. Mapping mendelian factors underlying quantitative traits using RFLP linkage maps. Genetics 1989, 121, 185–199. [Google Scholar] [CrossRef]
  43. Rosado, R.D.S.; Rosado, L.D.S.; Borges, L.L.; Bruckner, C.H.; Cruz, C.D.; Dos Santos, C.E.M. Genetic diversity of sour passion fruit revealed by predicted genetic values. Agron. J. 2019, 111, 165–174. [Google Scholar] [CrossRef]
  44. Fruchterman, T.M.J.; Reingold, E.M. Graph drawing by force-directed placement. Softw. Pract. Exp. 1991, 21, 1129–1164. [Google Scholar] [CrossRef]
  45. Epskamp, S.; Cramer, A.O.; Waldorp, L.J.; Schmittmann, V.D.; Borsboom, D. qgraph: Network visualizations of relationships in psychometric data. J. Stat. Softw. 2012, 48, 1–18. [Google Scholar] [CrossRef] [Green Version]
  46. Alzate-Marin, A.L.; Cervigni, G.D.; Moreira, M.A.; Barros, E.G. Seleção assistida por marcadores moleculares visando ao desenvolvimento de plantas resistentes a doenças, com ênfase em feijoeiro e soja. Fitopatol. Bras. 2005, 30, 333–342. [Google Scholar] [CrossRef] [Green Version]
  47. Alvarenga, S.M.; Caixeta, E.T.; Hufnagel, B.; Thiebaut, F.; Maciel-Zambolim, E.; Zambolim, L.; Sakiyama, N.S. Marcadores moleculares derivados de sequências expressas do genoma café potencialmente envolvidas na resistência à ferrugem. Pesquisa Agropecuária Brasileira 2011, 46, 890–898. [Google Scholar] [CrossRef]
  48. Combes, M.C.; Andrzejewski, S.; Anthony, F.; Bertrand, B.; Rovell, P.; Graziosi, G.; Sashermes, P. Characterization of microsatellites loci in Coffea arabica and related coffee species. Mol Ecol. 2000, 9, 1171–1193. [Google Scholar] [CrossRef]
  49. Prakash, N.; Devasia, J.; Das Divya, K.; Manjunatha, B.; Seetharam, H.; Kumar, A.; Jayarama. Breeding for rust resistance in Arabica—Where we are and what next? In Proceedings of the 25th International Conference on Coffee Science (ASIC), Armenia, Colombia, 8–13 September 2014; p. B10. [Google Scholar]
  50. Silva, D.N.; Várzea, V.; Paulo, O.S.; Batista, D. Population genomic footprints of host adaptation, introgression and recombination in coffee leaf rust. Mol. Plant Pathol. 2018, 19, 1742–1753. [Google Scholar] [CrossRef] [PubMed] [Green Version]
  51. Negi, M.S.; Devic, M.; Delseny, M. Identification of AFLP fragments linked to seed coat colour in Brassica juncea and conversion to a SCAR marker for rapid selection. Theor. Appl. Genet. 2000, 101, 146–152. [Google Scholar] [CrossRef]
  52. Jaber, E.H.A.; Srour, A.Y.; Zambounis, A.G.; Vakalounakis, D.J.; Doulis, A.G. Identification of SCAR markers linked to the Foc gene governing resistance to Fusarium oxysporum f. sp. cucumerinum in cucumber cv. SMR-18. Eur. J. Plant Pathol. 2020, 157, 845–855. [Google Scholar] [CrossRef]
  53. Wu, P.; Xie, J.; Hu, J.; Qiu, D.; Liu, Z.; Li, J.; Li, M.; Zhang, H.; Yang, L.; Liu, H.; et al. Development of molecular markers linked to powdery mildew resistance gene Pm4b by combining SNP discovery from transcriptome sequencing Data with Bulked Segregant Analysis (BSR-Seq) in Wheat. Front. Plant Sci. 2018, 9. [Google Scholar] [CrossRef] [Green Version]
  54. Denoeud, F.; Carretero-Paulet, L.; Dereeper, A.; Droc, G.; Guyot, R.; Pietrella, M.; Zheng, C.; Alberti, A.; Anthony, F.; Aprea, G.; et al. The coffee genome provides insight into the convergent evolution of caffeine biosynthesis. Science 2014, 345, 1181–1184. [Google Scholar] [CrossRef] [PubMed] [Green Version]
  55. Charrier, A.; Berthaud, J. Botanical classification of coffee. In Coffee: Botany, Biochemistry and Production of Beans and Beverage; Clifford, M.N., Wilson, K.C., Eds.; AVI Publishing Company: Westport, CT, USA, 1985; pp. 13–47. [Google Scholar]
  56. Clarindo, W.R.; Carvalho, C.R. First Coffea arabica karyogram showing that this species is a true allotetraploid. Plant Syst. Evol. 2008, 274, 237. [Google Scholar] [CrossRef]
  57. Van der Vossen, H.A.M. The cup quality of disease-resistant cultivars of Arabica coffee (Coffea arabica). Expl. Agric. 2009, 45, 323–332. [Google Scholar] [CrossRef]
  58. Valencia, A.; Morales, A.Y.; Moncada, P.M.I.; Cortina, H.A.; Herrera, J.C. Introgresion of the SH3 gene resistant to rust (Hemileia vastatrix) in improved lines of CASTILLO® variety (Coffea arabica L.). ournal Plant Breed. Crop Sci. 2017, 9, 130–138. [Google Scholar] [CrossRef]
  59. Prakash, N.S.; Muniswamy, B.; Hanumantha, B.T.; Sreenath, H.L.; Sundaresha; Kumar, D.; Suresh, N.; Santhosh, P.; Soumya, P.R.; Bhat, A.M.; et al. Marker assisted selection and breeding for leaf rust resistance in coffee (Coffea arabica L.) -some recent leads. Indian J. Genet. Plant Breed. 2011, 71, 185–189. [Google Scholar]
  60. Van der Vossen, H.A.M.; Walyaro, D.J. Additional evidence for oligogenic inheritance of durable host resistance to coffee berry disease (Colletotrichum kahawae) in arabica coffee (Coffea arabica L.). Euphytica 2009, 165, 105–111. [Google Scholar] [CrossRef]
  61. Horgan, F.G.; Bernal, C.C.; Vu, Q.; Almazan, M.L.P.; Ramal, A.F.; Yasui, H.; Fujita, D. Virulence adaptation in a rice leafhopper: Exposure to ineffective genes compromises pyramided resistance. Crop Prot. 2018, 113, 40–47. [Google Scholar] [CrossRef] [PubMed]
  62. Pilet-Nayel, M.-L.; Moury, B.; Caffier, V.; Montarry, J.; Kerlan, M.-C.; Fournet, S.; Durel, C.-E.; Delourme, R. Quantitative Resistance to Plant Pathogens in Pyramiding Strategies for Durable Crop Protection. Front. Plant Sci. 2017, 8. [Google Scholar] [CrossRef] [Green Version]
  63. Sharma, A.; Srivastava, P.; Mavi, G.S.; Kaur, S.; Kaur, J.; Bala, R.; Singh, T.P.; Sohu, V.S.; Chhuneja, P.; Bains, N.S. Resurrection of wheat cultivar ‘PBW343’using marker assisted gene pyramiding for rust resistance. Front. Plant Sci. 2021, 12, 42. [Google Scholar] [CrossRef]
  64. Das, G.; Rao, G.J.N.; Varier, M.; Prakash, A.; Prasad, D. Improved Tapaswini having four BB resistance genes pyramided with six genes/QTLs, resistance/tolerance to biotic and abiotic stresses in rice. Sci. Rep. 2018, 8, 2413. [Google Scholar] [CrossRef] [Green Version]
  65. Liu, R.; Lu, J.; Zhou, M.; Zheng, S.; Liu, Z.; Zhang, C.; Du, M.; Wang, M.; Li, Y.; Wu, Y.; et al. Developing stripe rust resistant wheat (Triticum aestivum L.) lines with gene pyramiding strategy and marker-assisted selection. Genet. Resour. Crop Evol. 2020, 67, 381–391. [Google Scholar] [CrossRef]
Figure 1. Crosses performed to test the developed markers and for marker-assisted selection of coffee with multiple disease resistance. ⊗ = controlled self-pollination.
Agronomy 11 01763 g001
Figure 2. LG2 = Linkage Group 2 of the C. arabica genetic map, containing the marker CaRHv8 (red) and its originated AFLP marker E-CTT\M-TGC3 (red). LG5 = Linkage Group 5 of the C. arabica genetic map, containing the markers CaRHv9, CaRHv10_CAPS, and their originated AFLP markers CBD-Sat207 and CBD-Sat235 (red). The names of the molecular markers are indicated to the right of the bar, and the distances in cM are shown to the left of the bar.
Agronomy 11 01763 g002
Figure 3. Correlation network among the molecular markers of each linkage groups (LG) of the genetic map and phenotype obtaining by coffee inoculation with race I, race II, and the pathotype 001 of Hemileia vastatrix. LG1–LG11 = Linkage Groups of the genetic map, 1–115 = molecular markers. Phenotypic data: R1 = race I, R2 = race II, and P01 = pathotype 001. The width of the line is proportional to the intensity of the correlation.
Agronomy 11 01763 g003
Figure 4. Scheme of the genotypes inferred by inoculation or molecular characterization of the population in the breeding process. Individual genotypes of each population under study. Inoculation and or molecular markers analyses used in each population are indicated. HdT = resistant parent, Híbrido de Timor UFV 443-03; Ct = susceptible parent, Catuaí Amarelo IAC 64 (UFV 2148-57); F1 = first generation of self-pollination; F2 = second generation of self-pollination; F2:3 = third generation of self-pollination; BCrs1 = first generation of susceptible backcross population; BCrs2 = second generation of susceptible backcross population. R = resistant genotype; S = susceptible genotype; ⊗ = controlled self-pollination.
Agronomy 11 01763 g004
Table 1. AFLP primers linked to the resistance locus and their respective SCAR and CAPS.
AFLP Marker
E-CTG/MAAT1E-CTT/MTGC3E-CCC/MAGA1E-CGA/MTCC4
LG a2255
Linkage bCoupledRepulsionCoupledCoupled
Size AFLP c670 pb600 pb220 pb800 pb
Developed markerCaRHv7CaRHv8CaRHv9CaRHv10_CAPS
Size SCAR d108 pb272 pb151 pb340 pb
Marker typeSCARSCARSCARCAPS
Primer F eGAACGATTGAGGATGCCAAGACCTTCTAGTGTTACCGAGGATGATGAAGAAGAGCGCATAGCGACACATCGTGAACGTGGAG
Primer R fTGTCAAAGTGGTACGGAGGATCTTAGCGCCATGAATAGCCAGTCTAAGACCAGAATCAGATGGCAGCTGAACAACCGAACTCA
Annealing temp (°C)65656565
a LG = linkage group of the genetic linkage map of Pestana et al. [26]. b Linkage of the marker to the resistance locus, coupled = linkage to the resistance allele; repulsion = linkage to the susceptible allele. c Size of the fragment amplified by the AFLP marker. d Size of the fragment amplified by the SCAR marker. e Forward primer f Reverse primer.
Table 2. Expected genotypes of coffee and segregation analyses for rust resistance in the BCrs2 and F2:3 populations.
Genotypic Markers SegregationPhenotypic Disease Segregation
Breeding PopulationExpect Ratio aSSR16 CaRHv8 Locus A (QTL-LG2)CaRHv9 CaRHv10_CAPS Locus B (QTL-LG5)Obs Num Gen bExpec Num Gen cChi-Squared Χ2 (P)Expect Ratio d R:SObs Num e PheExpect Num f PheChi-Squared Χ2 (P)SE g
RSRS
HdT (UFV443-03)__AAAAB_B_AABBAABB
Ct (UFV 2148-57)__aa_aBbbbAabbAabb
F1 (H 511-1)__Aa_aB_B_AaBbAaBb
BCrs2-471:1:1:1Aa_abbbb14 Aabb15.,5 Aabb1.74 (0.63)12R:4S471547150 (1)93.6
Aa_aB_B_18 AaB_15.5 AaB_
aa_aB_B_18 aaB_15.5 aaB_
aa_abbbb12 aabb15.5 aabb
BCrs2-1081:1:1:1Aa_abbbb22 Aabb23.25Aabb0.29 (0.96)12R:4S593469245.62 (0.18)90.0
Aa_aB_B_24 AaB_23.25 AaB_
aa_aB_B_25 aaB_23.25 aaB_
aa_abbbb22 aabb23.25 aabb
F2:3 -159:3:3:1AAAAB_B_7 AAB_5 AAB_4.58 (0.47)15R:1S2502411.04 (0.31)100
AAAAbbbb4 AAbb2 AAbb
Aa_aB_B_7 AaB_9 AaB_
Aa_abbbb2 Aabb3 Aabb
aa_aB_B_5 aaB_5 aaB_
aa_abbbbAabb1 aabb
F2:3-359:3:3:1AAAAB_B_7 AAB_7 AAB_0.21 (0.99)15R:1S3333330 (1)97.3
AAAAbbbb2 AAbb2 AAbb
Aa_aB_B_15 AaB_14 AaB_
Aa_abbbb4 Aabb4 Aabb
aa_aB_B_6 aaB_7 aaB_
aa_abbbb2 aabb2 aabb
a Expected ratio of genotypes; b Observed number of genotypes; c Expected number of genotypes; d Expected ratio of phenotypes; e Observed number of phenotypes; f Expected number of phenotypes; g Selection efficiency of markers in breeding populations.
Table 3. Genotypic data of theF3:4-15-25 and the BCrs3-47-41 progenies obtained by SAM aiming to pyramid the allele for resistance to CLR and CBD.
PopulationsLocus ALocus BLocus CLocus DGenotype
CaRHv8SSR16CaRHv9CaRHv10_CAPSCARF005CBD-Sat207CBD-Sat235
-aAAAAAaAaB-bbB-BbC-ccDDDdddDDDddd
HdT AABBCCDD
Ct aabbccdd
F3:4 -15-25 (48 plants) 48 (AABBCCDD)
BCrs3-47-41 (26 plants) 6 (AaBbCcDd)
1 (AaBbCcdd) or (AaBbCcDd)
1 (AaBbCcdd)
5 (aaBbCcDd)
1 (AaBbccDd)
1 (Aabbccdd)
3 (aaBbCcDd)
2 (aaBbCcdd)
1 (aabbCcdd)
1 (aabbccDd)
3 (aabbccdd)
1 (AABBCCDD)
Gray = alleles identified by the correspondent molecular marker; HdT = resistant parent, Híbrido de Timor UFV 443-03; Ct = susceptible parent, Catuaí Amarelo IAC 64 (UFV 2148-57); F3:4-15-25 = fourth generation of self-pollination; BCrs3-47-41 = third generation of a susceptible backcross population.
Publisher’s Note: MDPI stays neutral with regard to jurisdictional claims in published maps and institutional affiliations.

