Article

A Comparative Study of Standard Center Pivot and Growers-Based Modified Center Pivot for Evaluating Uniformity Coefficient and Water Distribution

by
Hussein Al-Ghobari
and
Ahmed Z. Dewidar
*
Department of Agricultural Engineering, College of Food and Agriculture Sciences, King Saud University, P.O. Box 2460, Riyadh 11451, Saudi Arabia
*
Author to whom correspondence should be addressed.
Agronomy 2021, 11(8), 1675; https://doi.org/10.3390/agronomy11081675
Submission received: 5 August 2021 / Revised: 18 August 2021 / Accepted: 20 August 2021 / Published: 23 August 2021
(This article belongs to the Special Issue Modernization and Optimization of Irrigation Systems)

Abstract

:
The center pivot irrigation system is a type of irrigation technology used to apply water effectively and uniformly over a wide variety of areas and topographies. These irrigation systems’ uniformity of water application greatly affects water use, energy consumption, and crop production. Performance tests of the standard lateral galvanized and modified polyethylene plastic pipes in the center pivot irrigation systems were conducted in different regions of Saudi Arabia. Water distribution depths along the laterals, coefficient of uniformity (CU), and distribution uniformity of the low quarter (DU) were determined. The results revealed that profiles of water distribution ranged from 4 to 14 mm for the standard-center pivot irrigation systems, while those for the modified-center pivot irrigation systems ranged from 6.5 to 50 mm. Standard-center pivot irrigation systems’ CU values ranged from 74 to 90%, with an average of 86%. In comparison, the modified-center pivot irrigation systems’ CU values ranged from 62 to 83%, with an average of 78%. The DU values ranged from 60 to 82% for the standard-center pivot irrigation systems, with an overall average of 77%. For the modified-center pivot irrigation systems, the DU values, in contrast, ranged from 31 to 75%, with an average of 65%. Thus, the accuracy and uniformity of the standard-center pivot irrigation systems are superior to those that have been modified. Additionally, a statistical model was developed to investigate the relationship between the water losses and the main climatic factors under field operating conditions. Therefore, the study results are expected to draw attention to standard lateral pipes’ value on the one hand and demonstrate the detrimental consequences of growers’ incorrect practices in pivot irrigation systems, motivating them to take strong action against these activities, on the other hand.

1. Introduction

Center pivots are a technologically advantageous irrigation option, as they have a very high performance. In today’s irrigation developments all over the world, center pivots are widely used. A center pivot irrigation system consists basically of a pipeline (lateral) fitted with wheels and motorized structures (towers) [1]. The irrigation pivot is positioned in the center of the field, allowing the entire system to rotate around the point of its center of gravity. Sprinkler outlets are mounted on top of the pipeline, which is supported by steel trusses between tower structures. Each tower has a motor of 1 hp and is set on two large wheels, usually 30 to 60 m apart [1].
In recent years, center pivot irrigation systems have grown enormously around the world due to their ability to apply water in a highly effective and uniform manner [2]. Other advantages of center pivot irrigation systems are that they require less labor and deliver water-soluble fertilizers cost-effectively across a wide range of soil, crop, and topographic conditions. [2]. In Saudi Arabia, approximately two-thirds of all irrigated areas use a center pivot irrigation system [1]. By using center pivot irrigation systems, Saudi Arabian farmers have successfully used light sandy soils to support agricultural production on marginal lands that cannot be irrigated by surface systems. During the last three decades, a significant portion of Saudi Arabia’s desert areas has been turned into intensively irrigated agricultural land. The government’s support and incentive for farmers to help maintain the country’s food supply contributed to this shift. This rise in irrigated land has resulted in a notable increase in the strain on the water supply, causing problems with the availability. In 1992, non-renewable groundwater supplies provided about 92% of irrigation water, accounting for more than 85% of overall national water use [3]. As a result, the number of center pivot irrigation systems has rapidly increased in Saudi Arabia.
Farmers in Saudi Arabia complained of excessive corrosion in lateral piping of center-pivot irrigation systems that irrigate vast agricultural areas with a variety of water quality standards. As a result, many farms have replaced the lateral high-cost steel pipes with polyethylene pipes in order to reduce corrosion. Polyethylene laterals, which are equipped with short drop tubes, were directly positioned under the standard steel pipe and above the ground surface at 150–200 cm. Farmers initiated this redesign with information drawn from their own experience and technicians, without involving the center pivot dealers and designers who rely on a predetermined pressure for each sprinkler. Additionally, no evaluations were conducted on these modified center pivot irrigation systems to test their performance and the overall water distribution. Depending on the water’s salinity, this replacement occurs every 3 to 5 years by the center pivot irrigation owners. Accordingly, the modified-center pivot irrigation systems need to be assessed, as those systems may not be well designed and functioning properly.
On the farm level, optimization of irrigation can save both water and labor and increase the harvests of crops. [4]. Effective water management will be necessary for irrigated agriculture to guarantee sustainability. Thus, irrigation systems must handle and utilize water as effectively as possible in order to prevent unnecessary losses [5,6]. Application efficiency and crop yield are highly dependent on the sprinkler uniformity coefficient [7,8,9]. Water stress lowers yields and raises both the financial and environmental costs due to low distribution uniformity [10]. The uniformity of sprinkling irrigation is often measured by the Christiansen’s uniformity coefficient (CU) [11]. Harrison and Perry [12] categorized the CU of center pivot irrigation system as “excellent (>90%)”, “good (85–90%)”, “fair (80–85%)”, and “poor (<80%)”. In addition, the natural resources conservation service [13] has determined that chemigation should be applied to center pivot systems with CU values above 85%.
Center pivot irrigation systems are conventionally evaluated by transected cans that are uniformly spaced and arranged radially away from the pivot point. Many factors may affect water application’s uniformity, the most important of which are incorrect sprinkler nozzling and spacing, variations in lateral pressure distribution, and wind speed [14,15,16,17,18,19,20]. Many researchers have studied the performance of center pivot irrigation systems [21,22,23,24,25,26,27,28,29,30]. For example, Ortiz et al. [31] indicated that a CU value of 80% could be adequate to ensure good uniformity of crop yields for individual irrigation events. Therefore, evaluating the center pivot sprinkler’s performance in Saudi Arabia was imperative, especially for those modified systems. The study aimed to investigate the lateral configuration effect of the standard and modified-center pivot irrigation system on the uniformity coefficient and water distribution under field conditions.

2. Materials and Methods

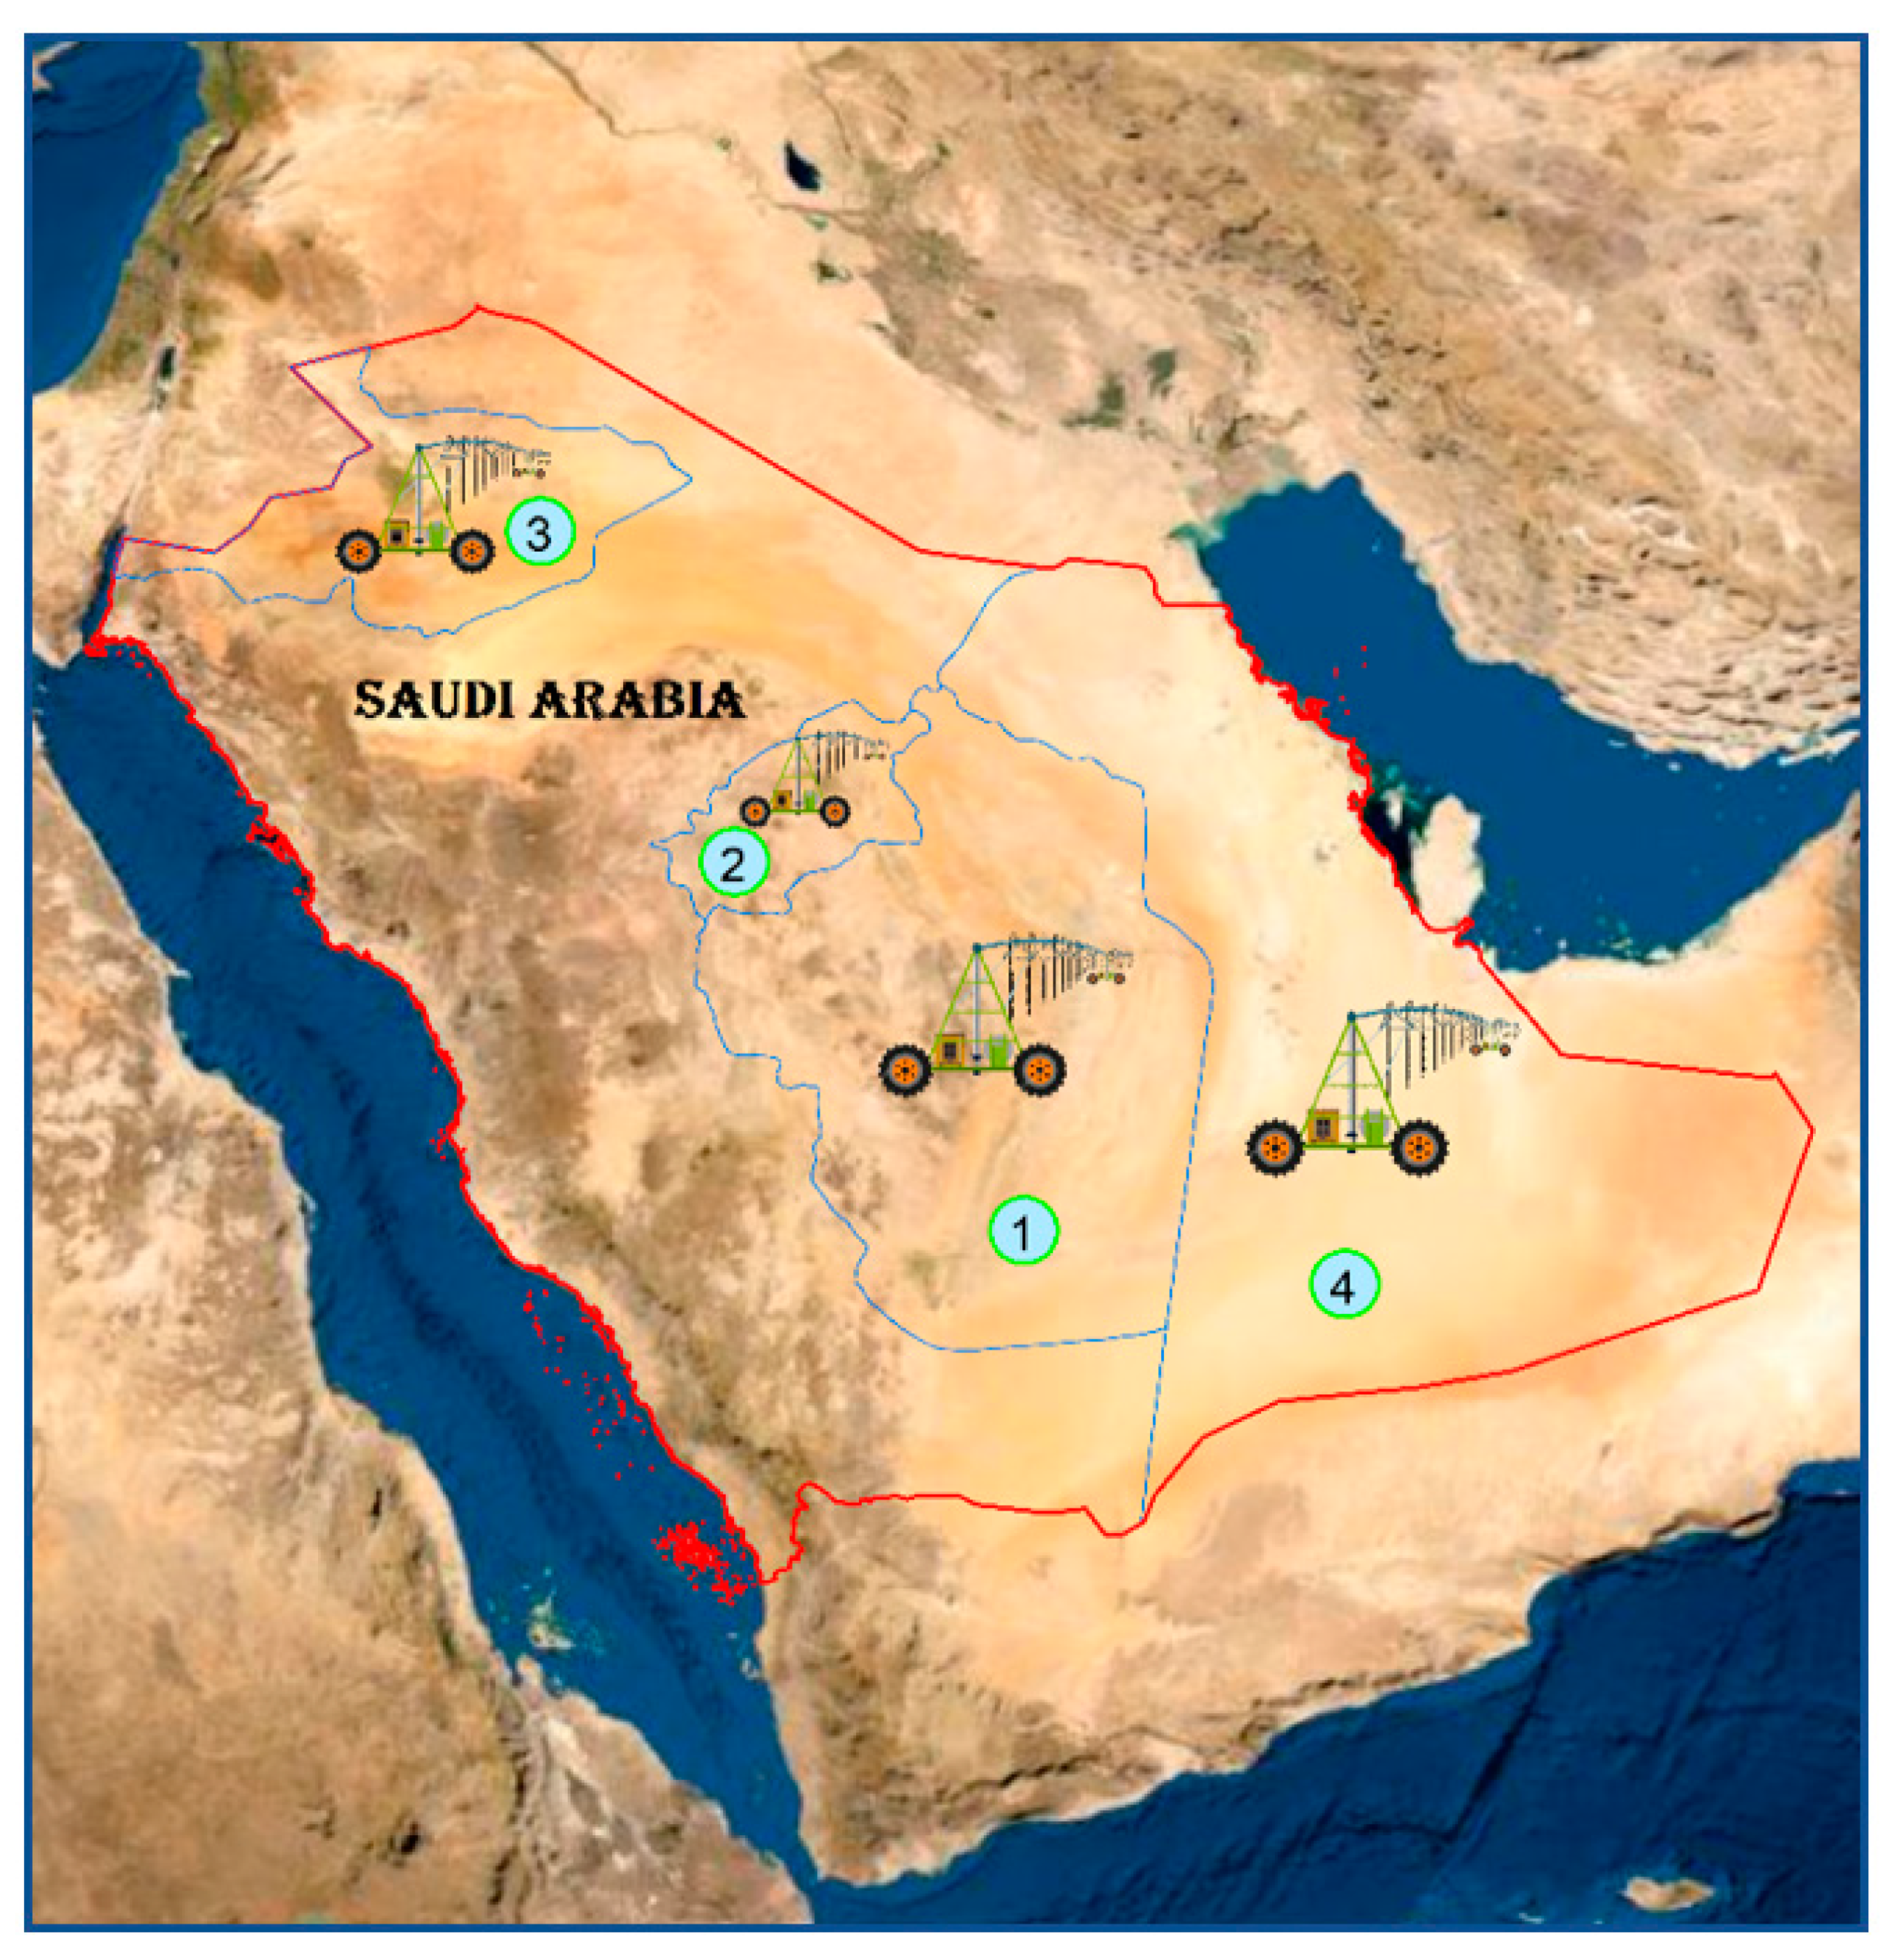
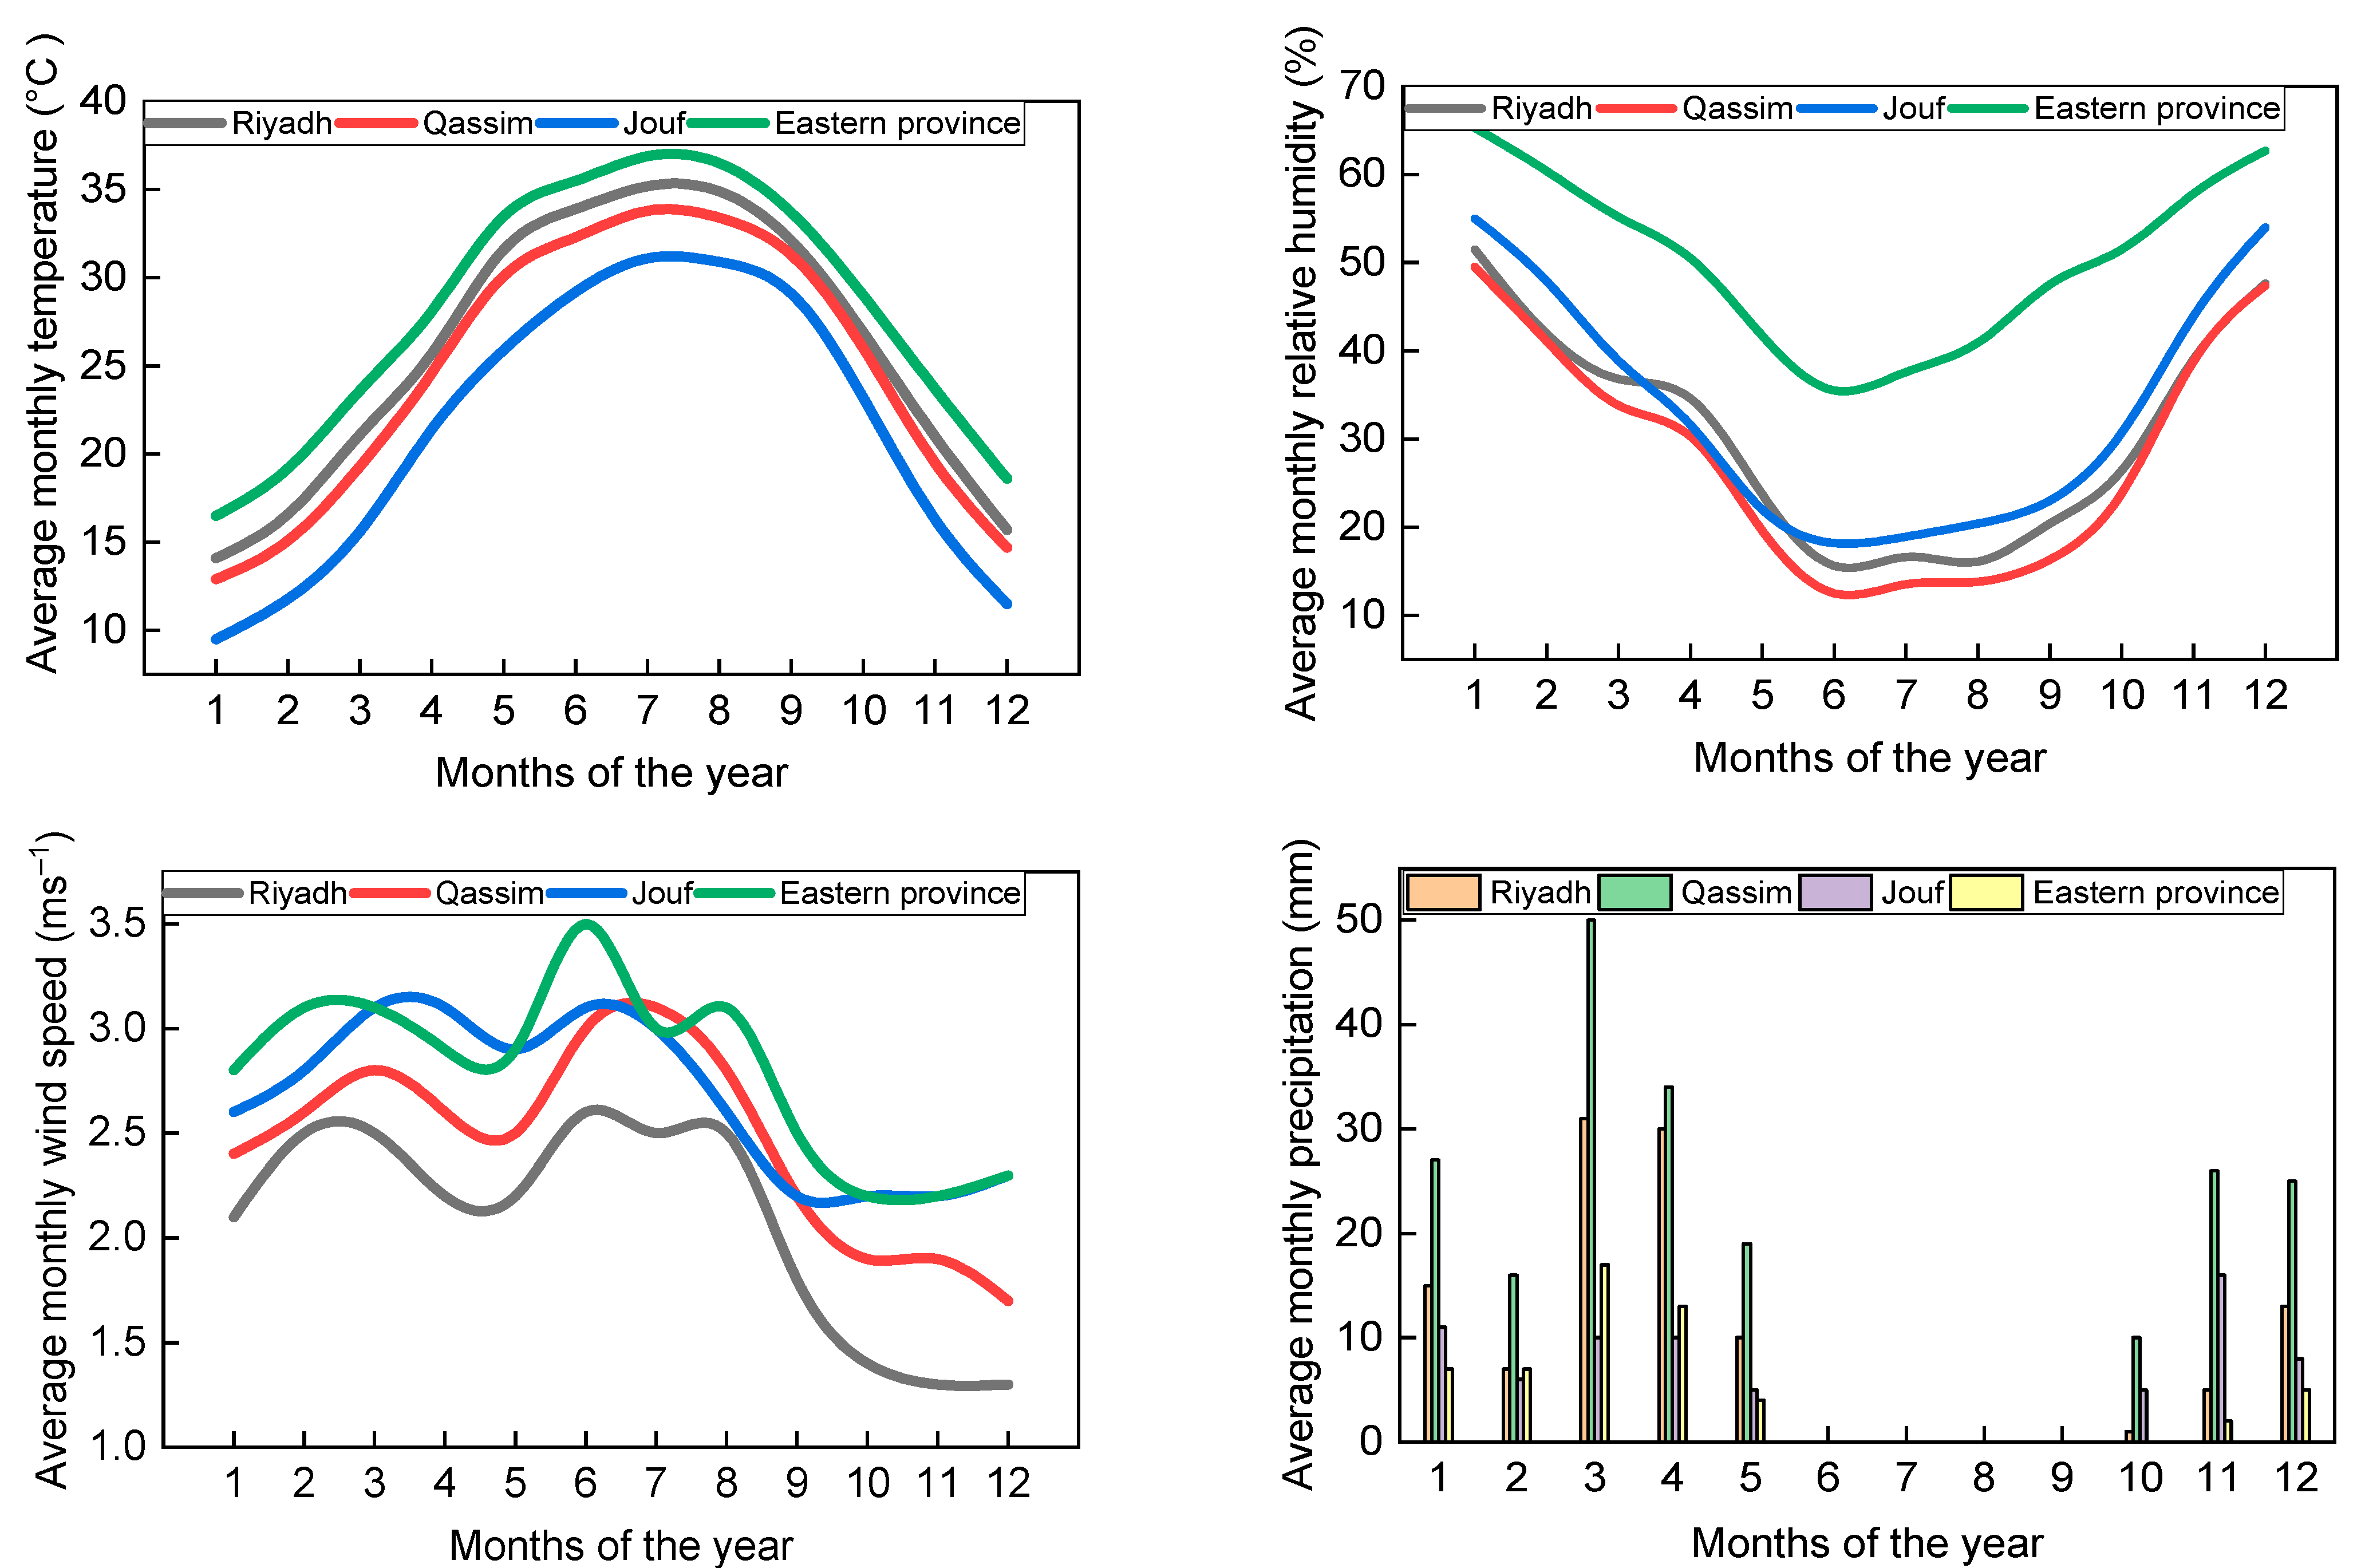
2.1. Study Locations

For the field evaluations, a total of 16 low-pressure center pivot irrigators were employed in four different regions of Saudi Arabia, namely Riyadh, Qassim, Jouf, and the eastern province (Figure 1). Saudi Arabia’s climate is characterized by high daytime temperatures and low nighttime temperatures. Except for the southwest that has a semi-arid environment, this country has a desert climate pattern. The study areas’ climatic characteristics are depicted in Figure 2. Wind speeds ranged from a minimum of 1.3 ms−1 in Riyadh to a maximum of 3.5 ms−1 in the eastern province. The air temperature ranged from 9.5 °C in Jouf to 37 °C in the eastern province. The annual precipitation level ranged between 55 mm year−1 in the eastern province and 207 mm year−1 in Qassim. Qassim, with a relative humidity of 12.5%, had the lowest average humidity. In contrast, the eastern province, with a relative humidity of 65%, had the highest average humidity. Sandy loam is the dominant soil texture in the studied regions. Deep well aquifers were the sources of water for irrigation in the study areas. Each well’s electrical conductivity was measured in order to determine the irrigation water salinity. For the four locations, the average electrical conductivity was between 0.46 and 6 dS m−1.

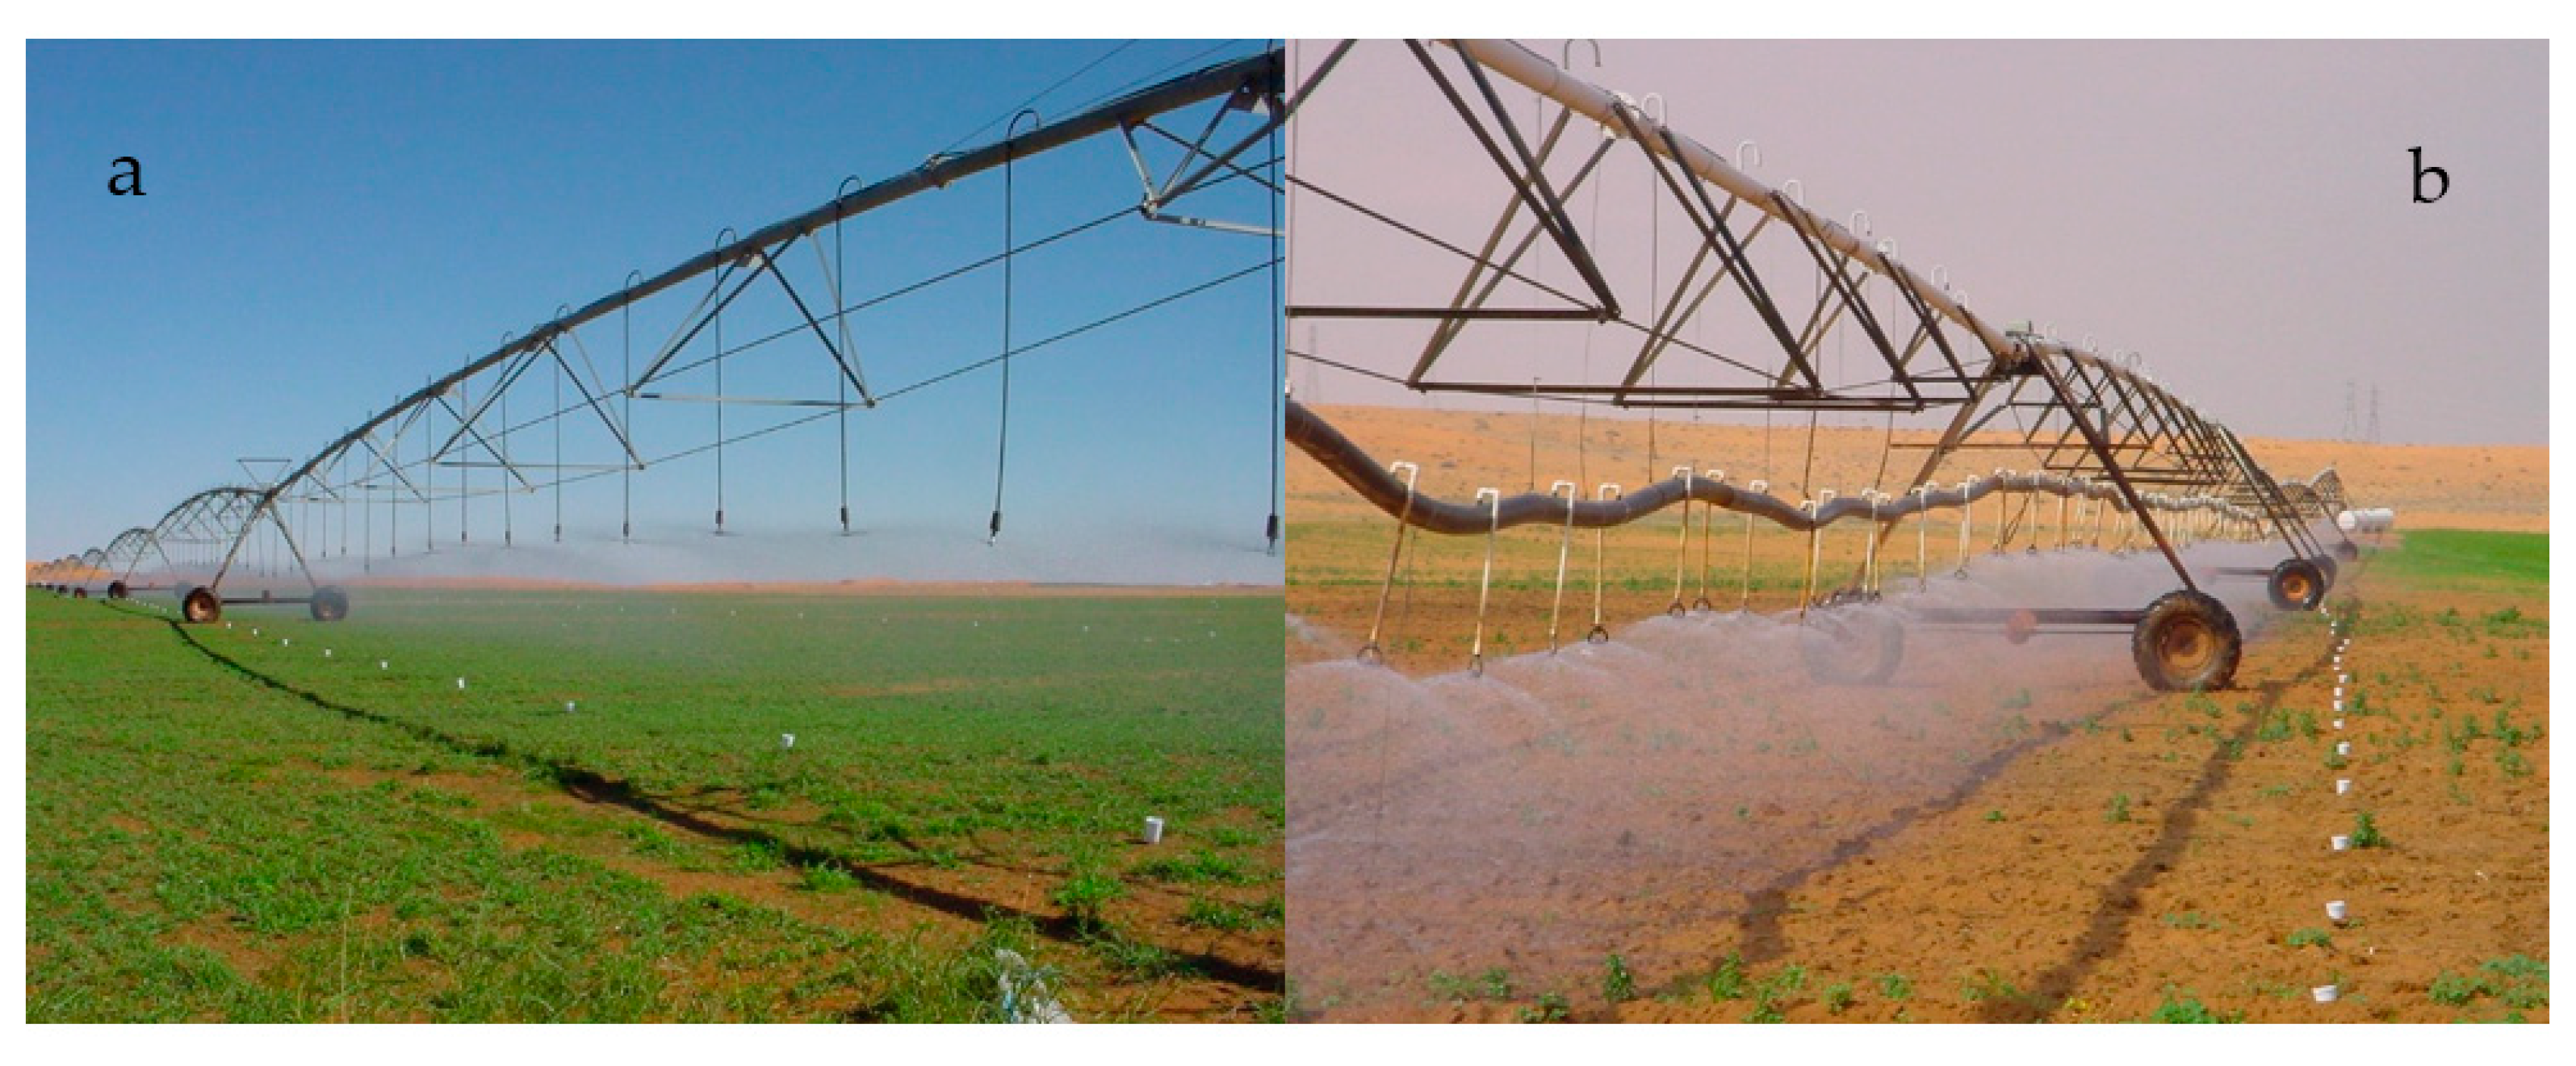
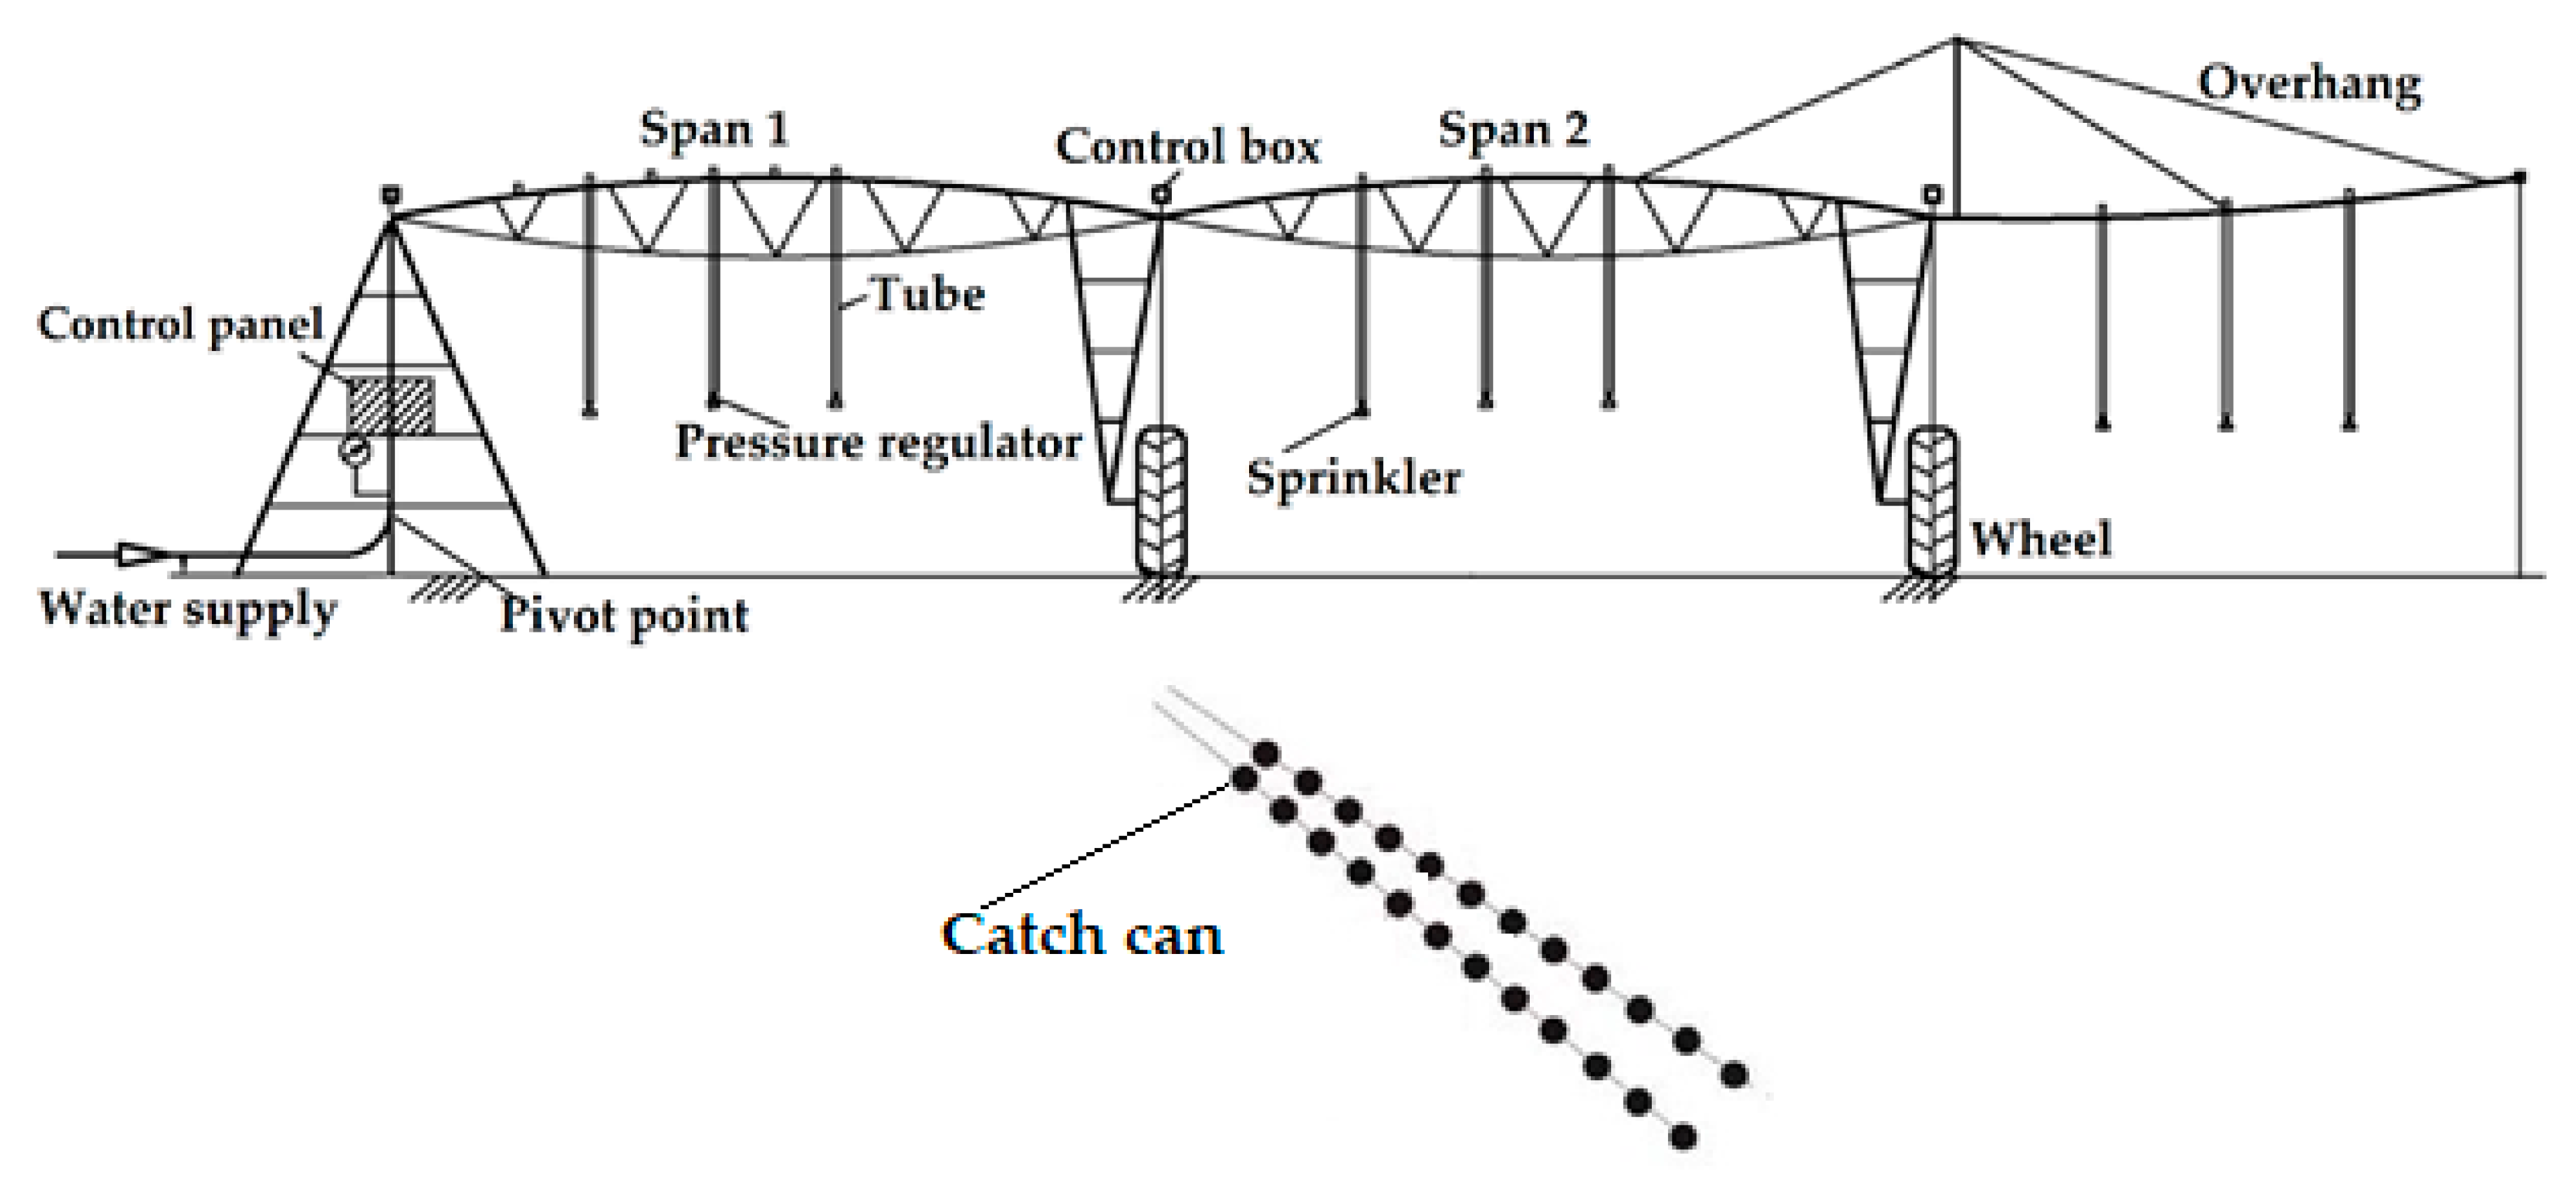
2.2. Center Pivot Used in The Study Areas

Farms involved in the study were either owned by farmers or by companies specializing in agricultural production. Although some farms were fitted with the center pivot of both standard and modified lateral systems, most farms were equipped with the modified ones. In these center pivot irrigation systems, the standard pivot lateral (Figure 3a) was made of a galvanized steel pipe. Instead, the center pivot irrigation systems with modified laterals have a polyethylene pipe of the same diameter, positioned below the standard lateral (Figure 3b).

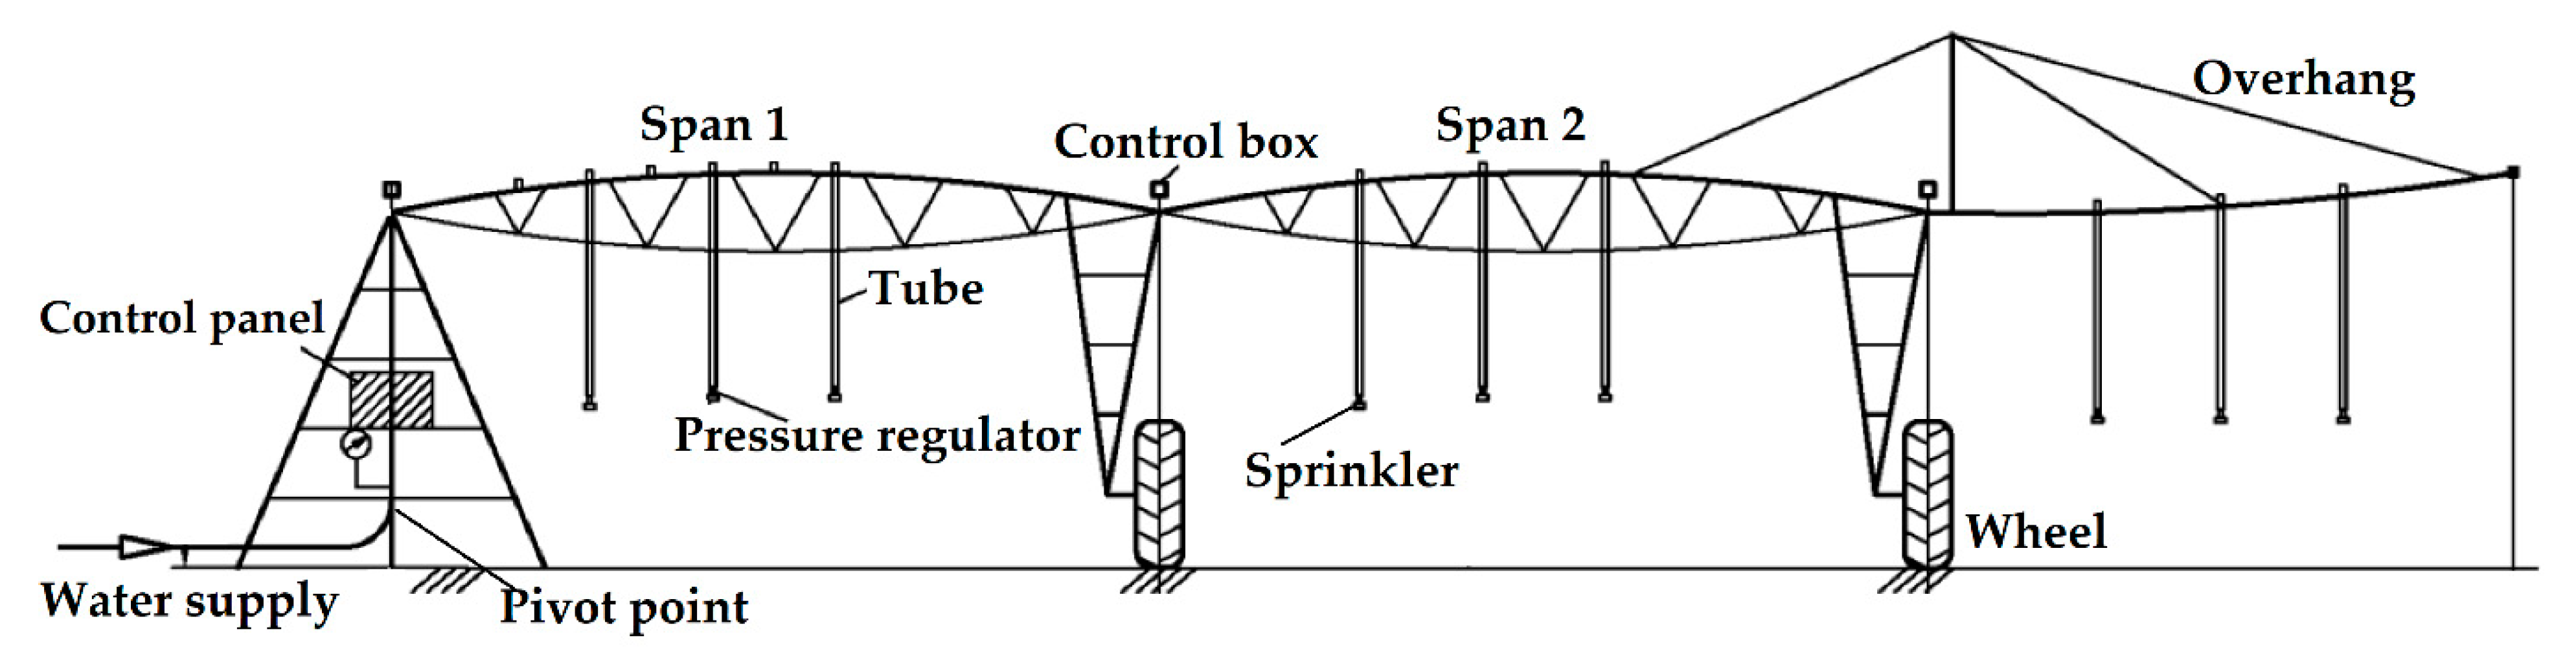
2.3. General Center Pivot Characteristics

Figure 4 shows the center pivot irrigation system’s structural components. The system’s operational age in the four study regions ranged from 5 to 20 years, and the towers ranged in number between 6 and 8. Compared to the standard lateral height specifications (3 m), The modified lateral’s height was approximately 1.5 m to 2.0 m above the soil surface. These center pivot irrigation systems with modified laterals have a range of drop-tube lengths between 0.5 and 1.0 m. None of the sprinklers installed along a modified lateral of the center pivot irrigation systems were equipped with pressure regulators.

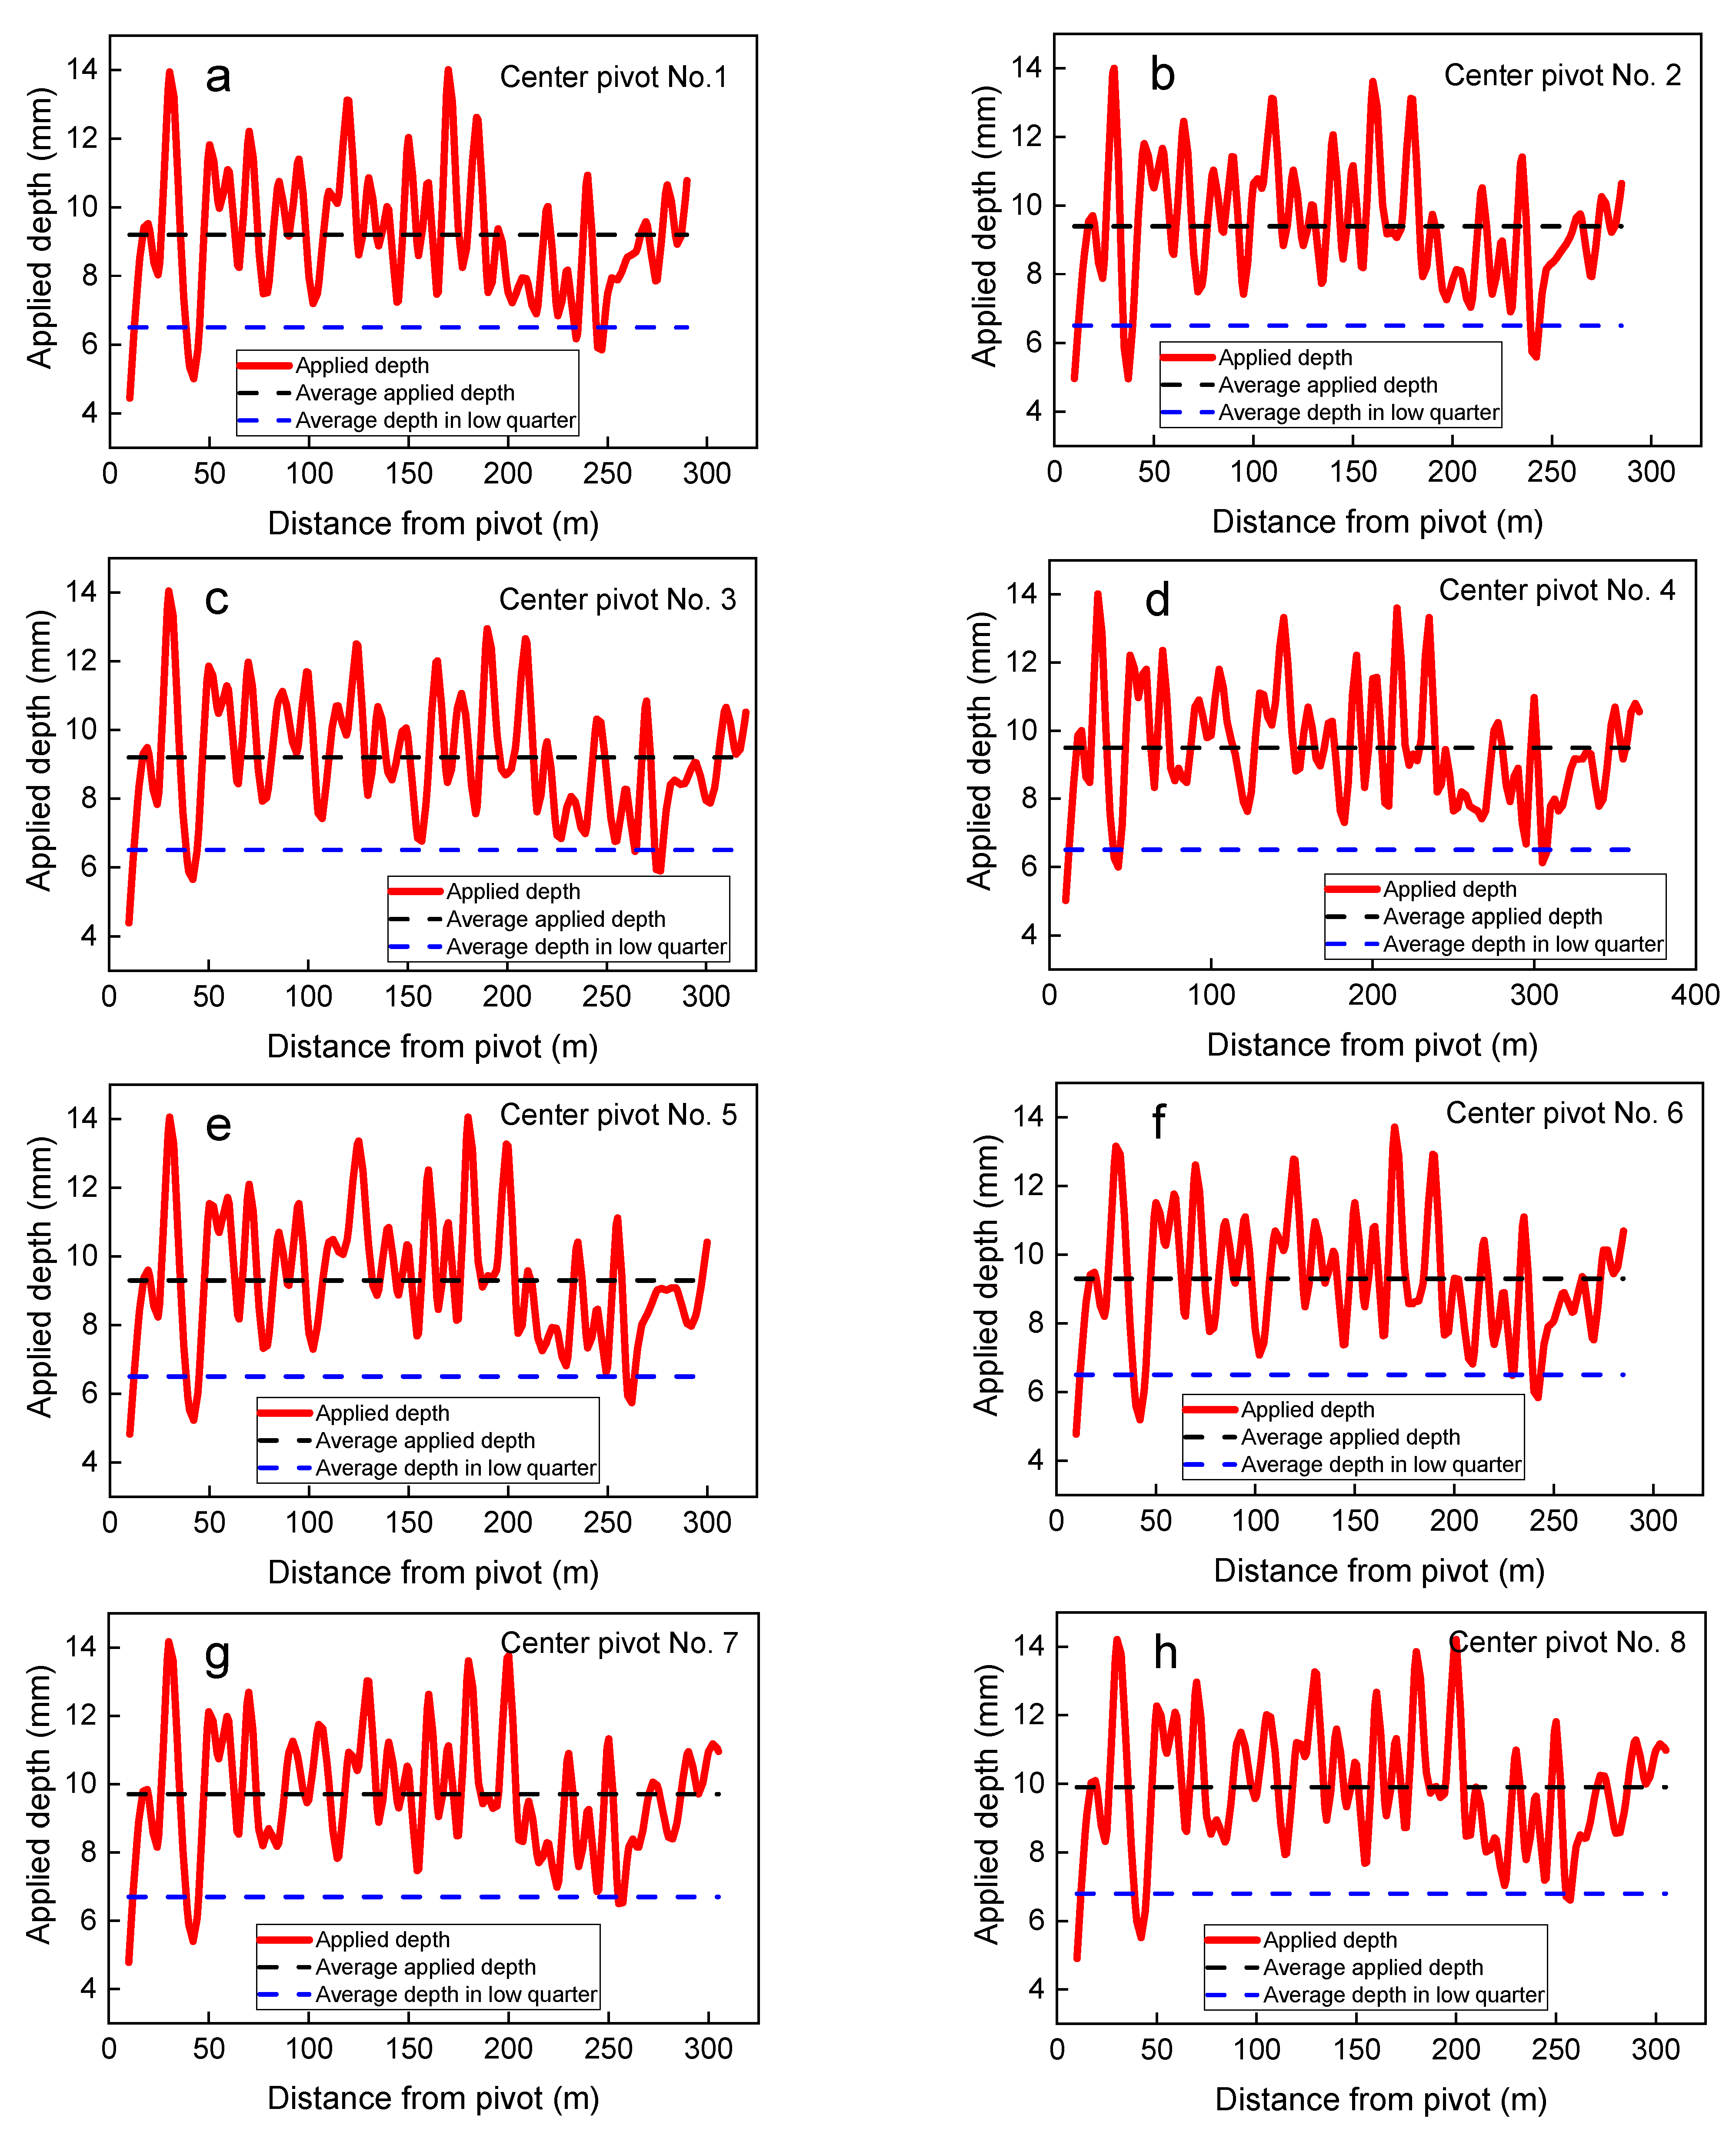
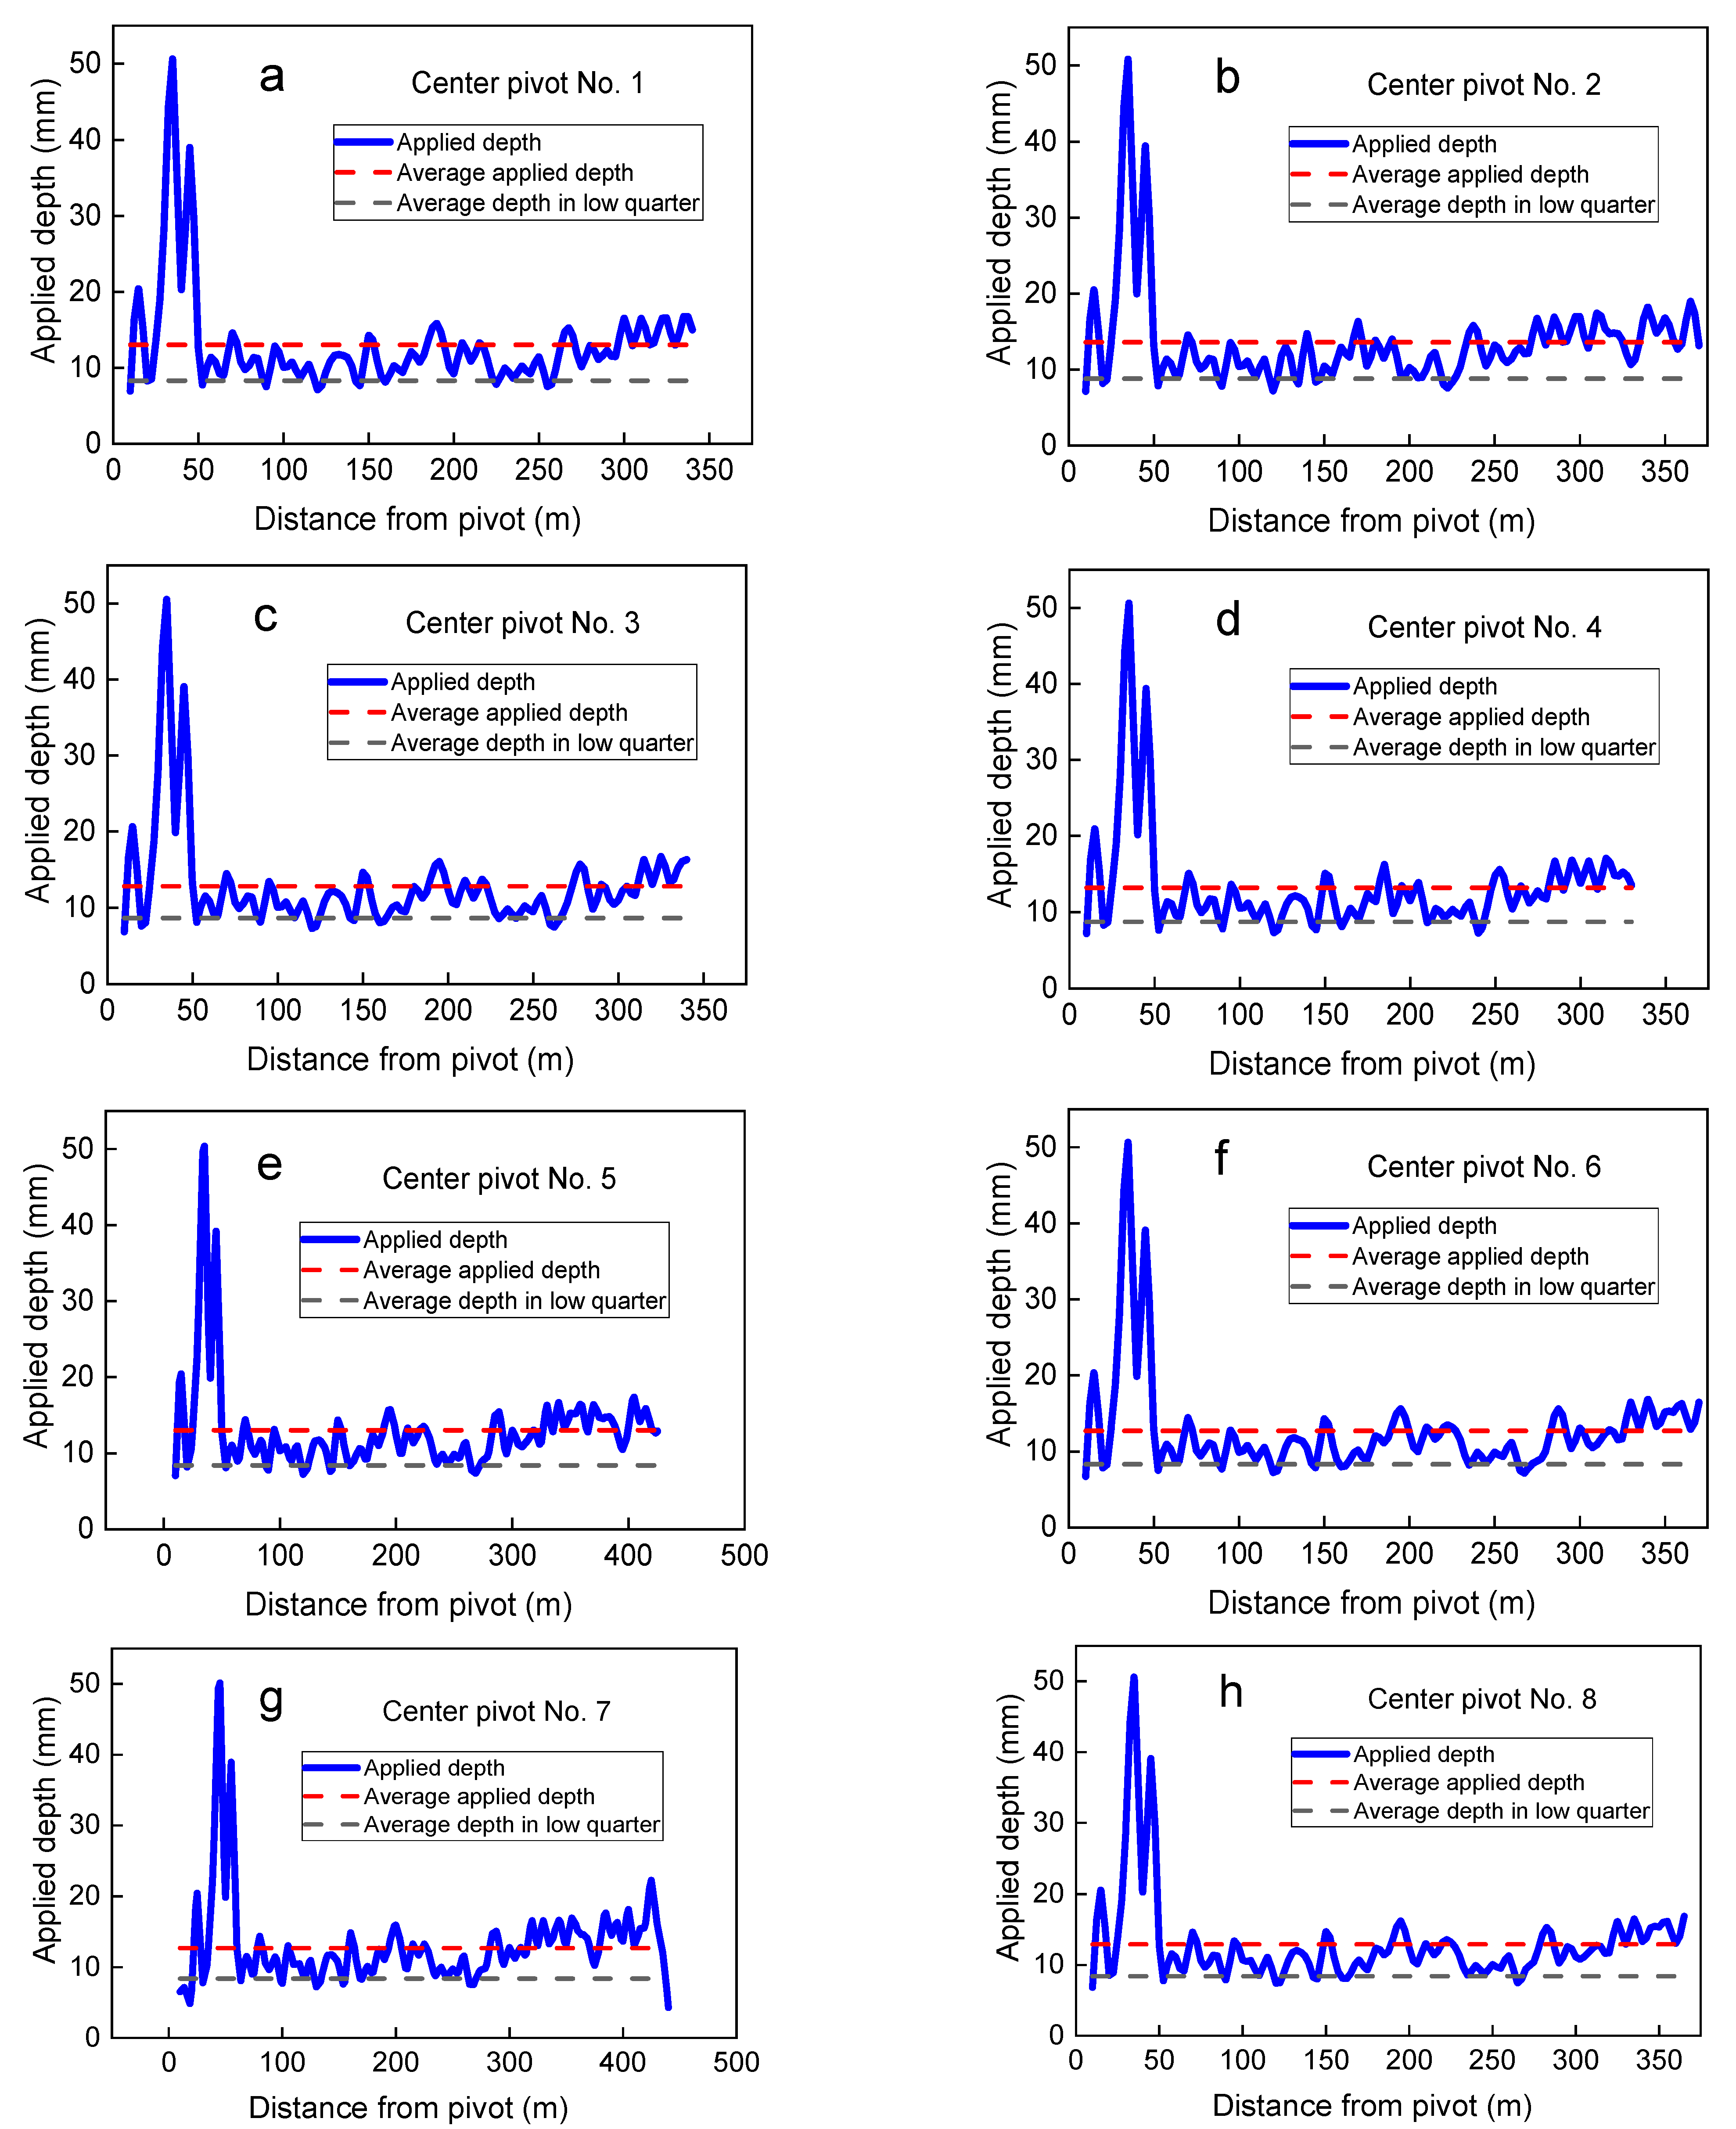
2.4. Evaluation Procedures

Field evaluations were conducted on bare soil or soil with early stages of alfalfa crop (Medicago sativa). All of the measurements were carried out early in the morning under the standard field conditions as quickly as possible to minimize the collectors’ evaporation. Two radial lines of catch cans were employed in each system, as shown in Figure 5. The distance between the catch cans was 5 m, with a diameter of 16 cm inside and a height of 15 cm [32,33]. The catch cans were positioned along a line that radially extended from the pivot point. Both lines were distanced sufficiently from the pipeline to allow the system to carry out the test conditions.

2.5. Sprinklers Efficiency and Distribution Uniformity

The depth of application was assessed by measuring water taken from dual-row catch cans, radially positioned with a spacing of 5 m along the laterals. According to the ASABE [34], the average water depth collected from the catch cans is the composite depth of both rows, which is given by:
A D w = i = 1 n | D s S s | i = 1 n | S s |
where ADw is the average weighted depth of water collected from catch cans (mm), Ds is the depth of water (mm) collected by a catch can at a distance S (m) from the center pivot, s is a subscript indicating the location to a distance S, and n is the catch cans number.
For evaluating the water distribution uniformity of the center pivot irrigation systems, both the uniformity coefficient (CU) of Heermann and Hein [21] and the distribution uniformity (DU) in the low quarter were calculated (Equations (2) and (3)).
C U = [ 1 i = 1 n S s | D s i = 1 n D s S s i = 1 n S s | i = 1 n D s S s ] × 100
D U = A D w 25 A D w × 100
where ADw25 is the average water depth (mm) obtained by 25% of the cans that collected the minimum water amount within the span, weighted according to the distance to the center pivot.

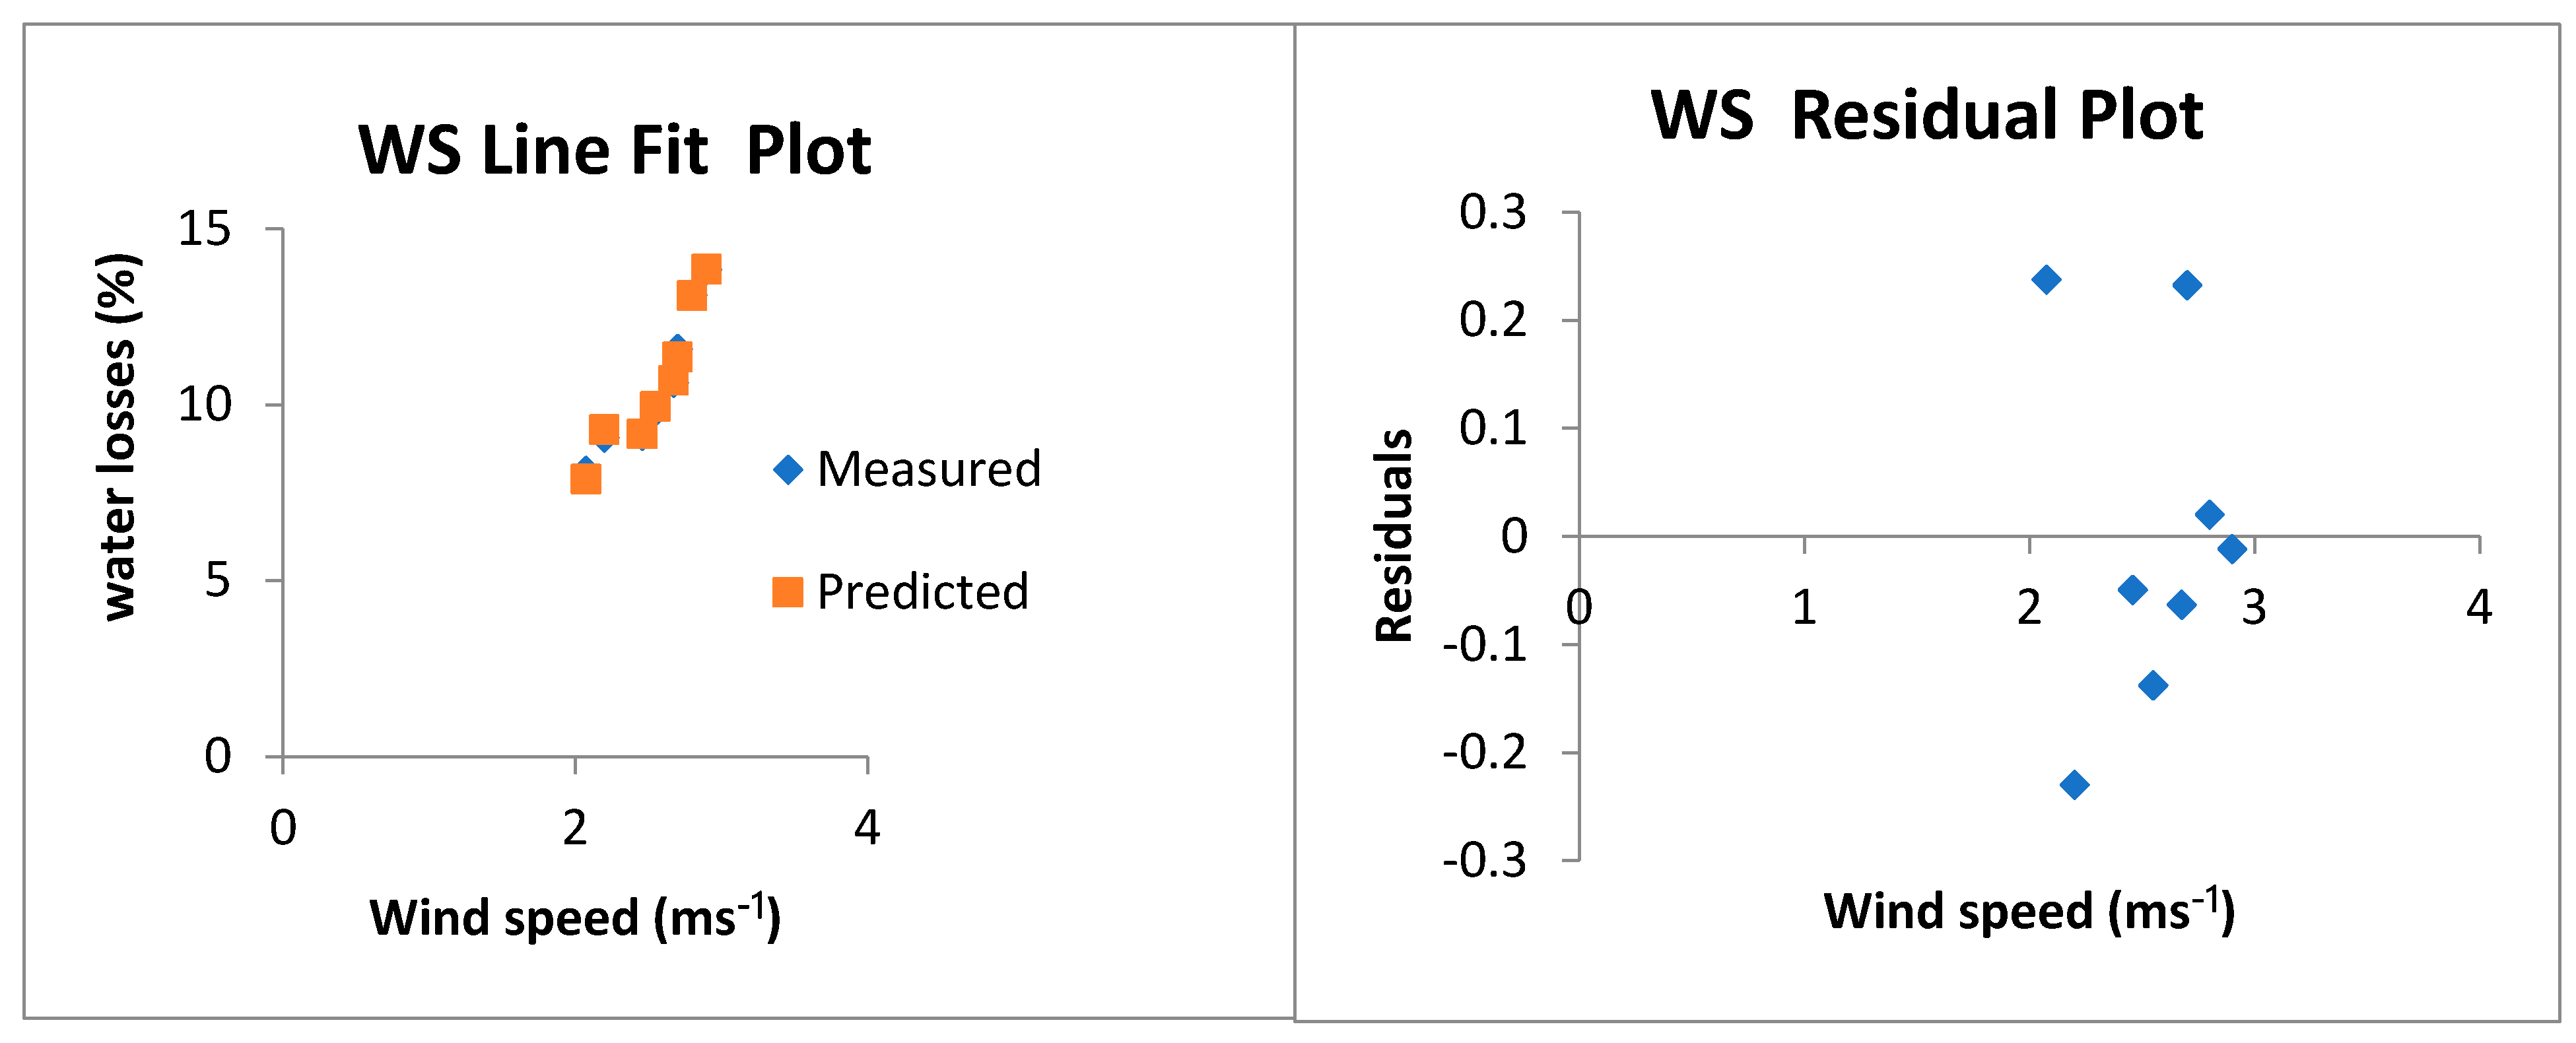
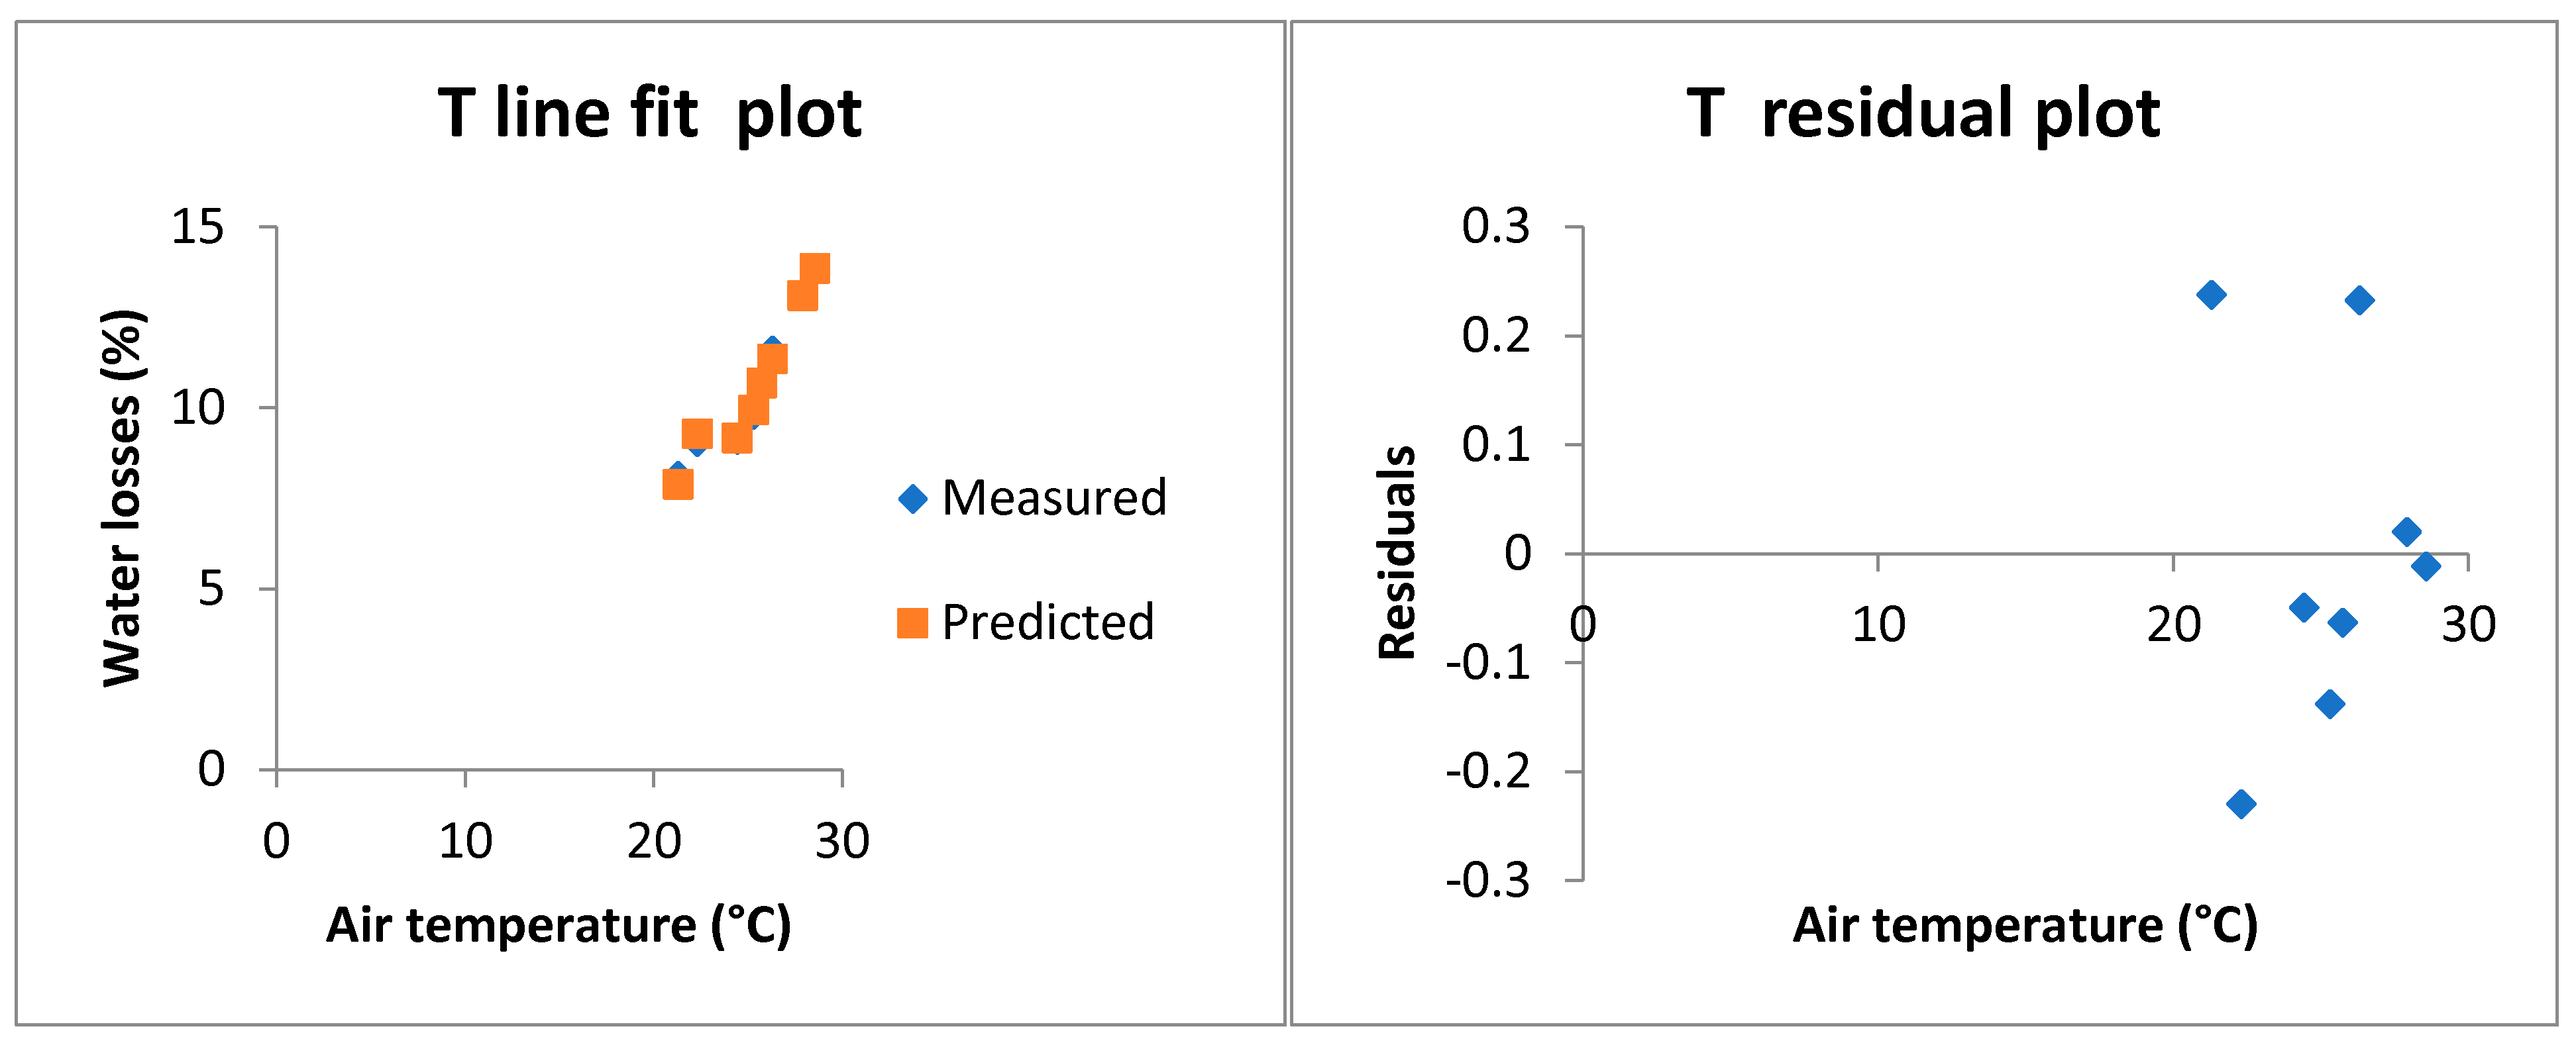
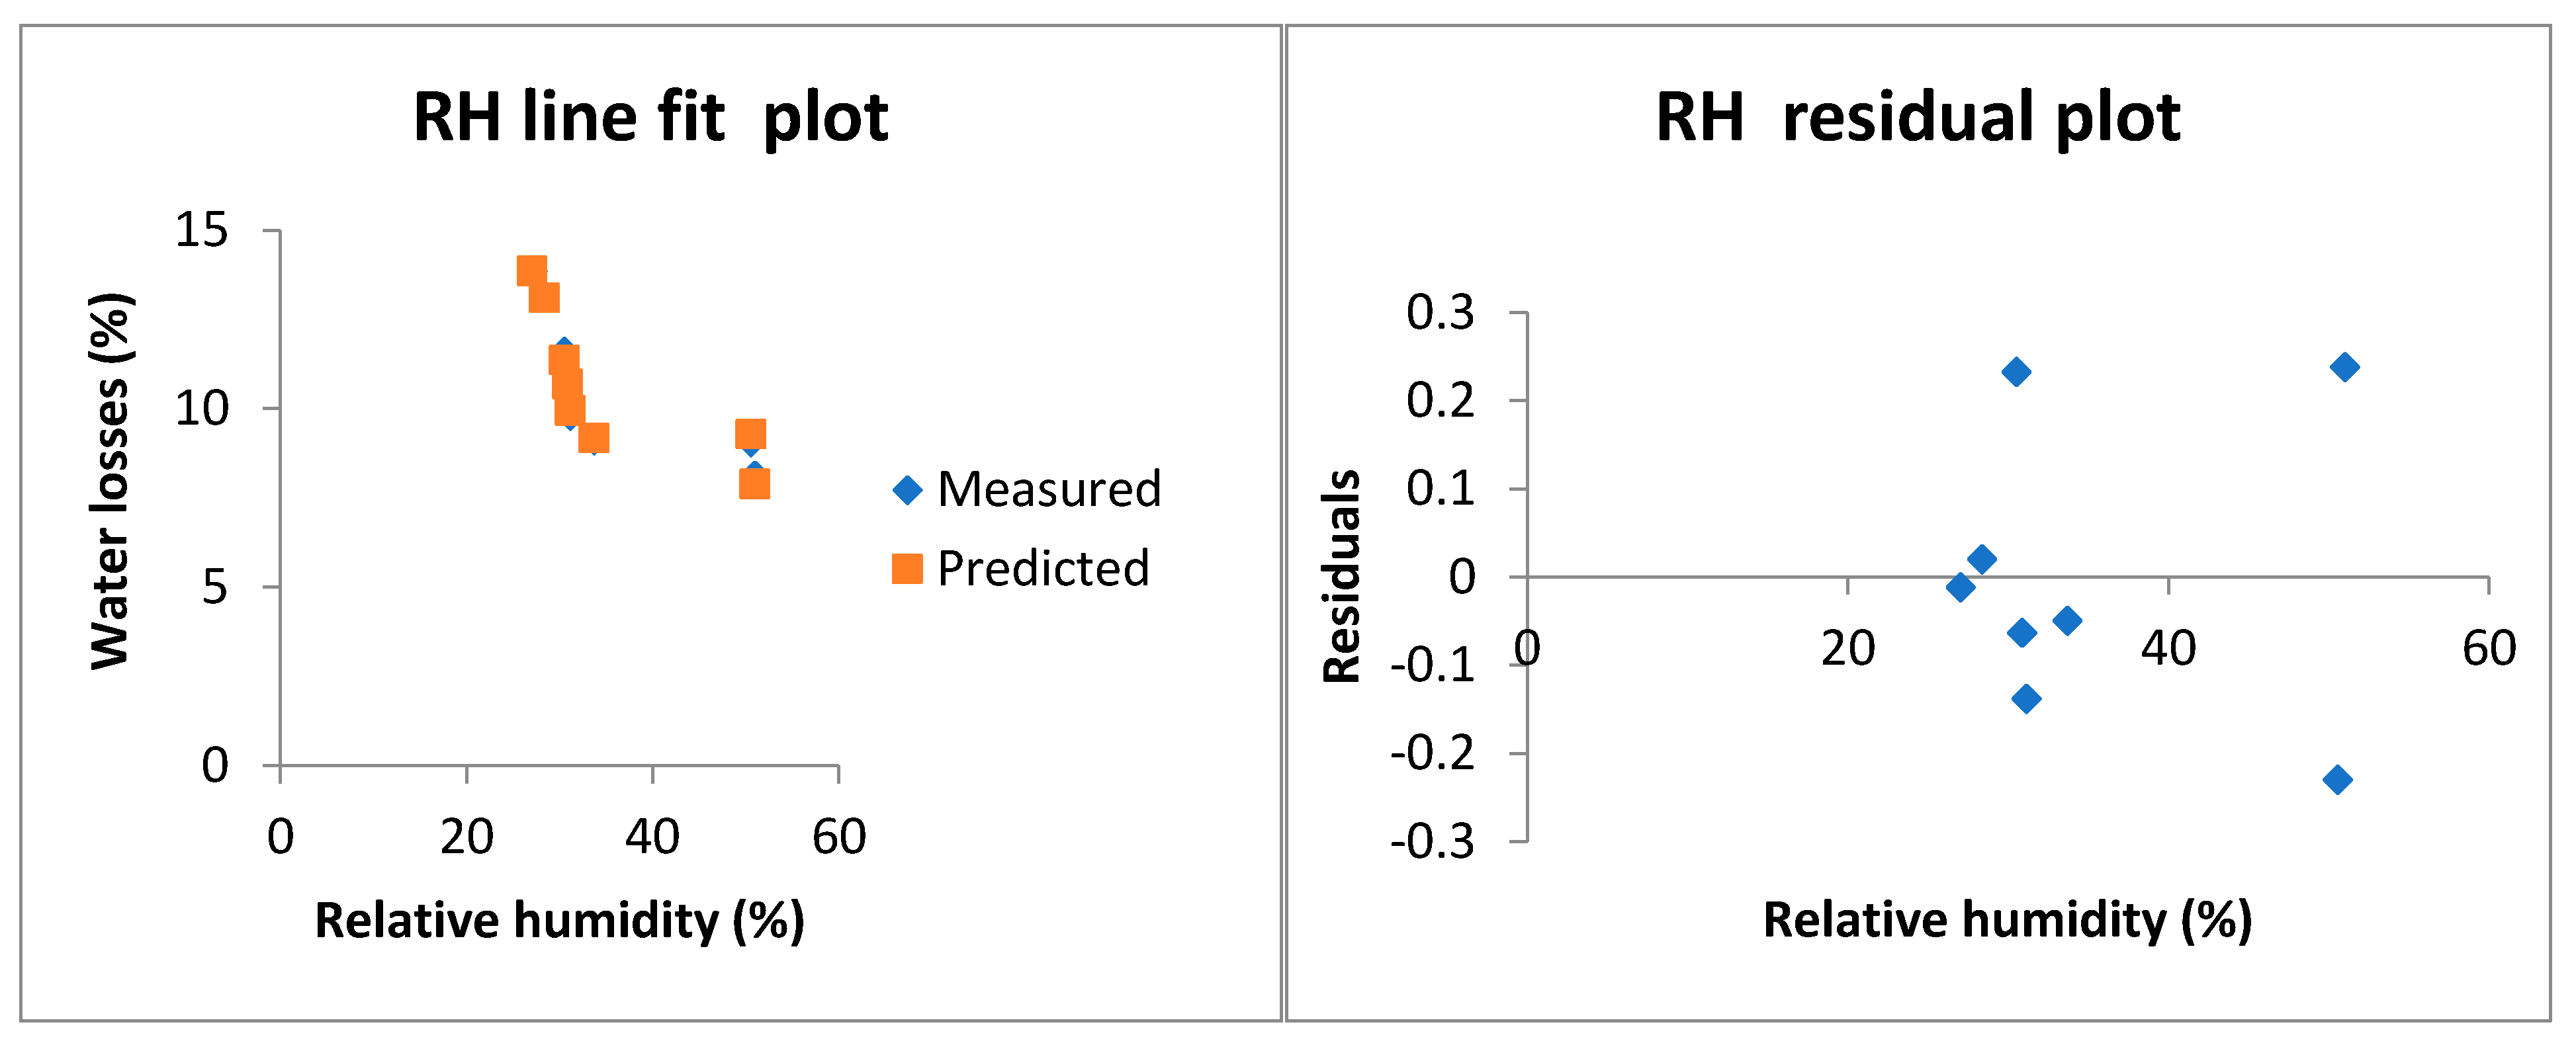
2.6. Multiple Linear Regression

Multiple linear regression (MLR) is a method for modeling the linear relation of a dependent (response) variable with one or more independent variables (predictors). The general equation for the MLR is as follows:
y = b 1 x 1 + b 2 x 2 + + b n x n + c
where y is the dependent variable; b1, b2, …, bn are the regression coefficients; and x1, x2, …, xn are the independent variables.
The mathematical relationship between MLR and water loss was developed in this study, utilizing data from standard-center pivot irrigation systems to estimate water losses as a function of wind speed, temperature, and relative humidity. (Equation (5)).
W l o s s e s = β 0 + β 1 W S + β 2 T + β 3 R H
where Wlosses is the water losses (%), WS is the wind speed (m s−1), T is the air temperature (°C), and RH is the relative humidity (%).
In order to evaluate the predictive MLR, the standard error, correlation coefficient, t statistic, and probability value (p-value) for independent parameters were used.

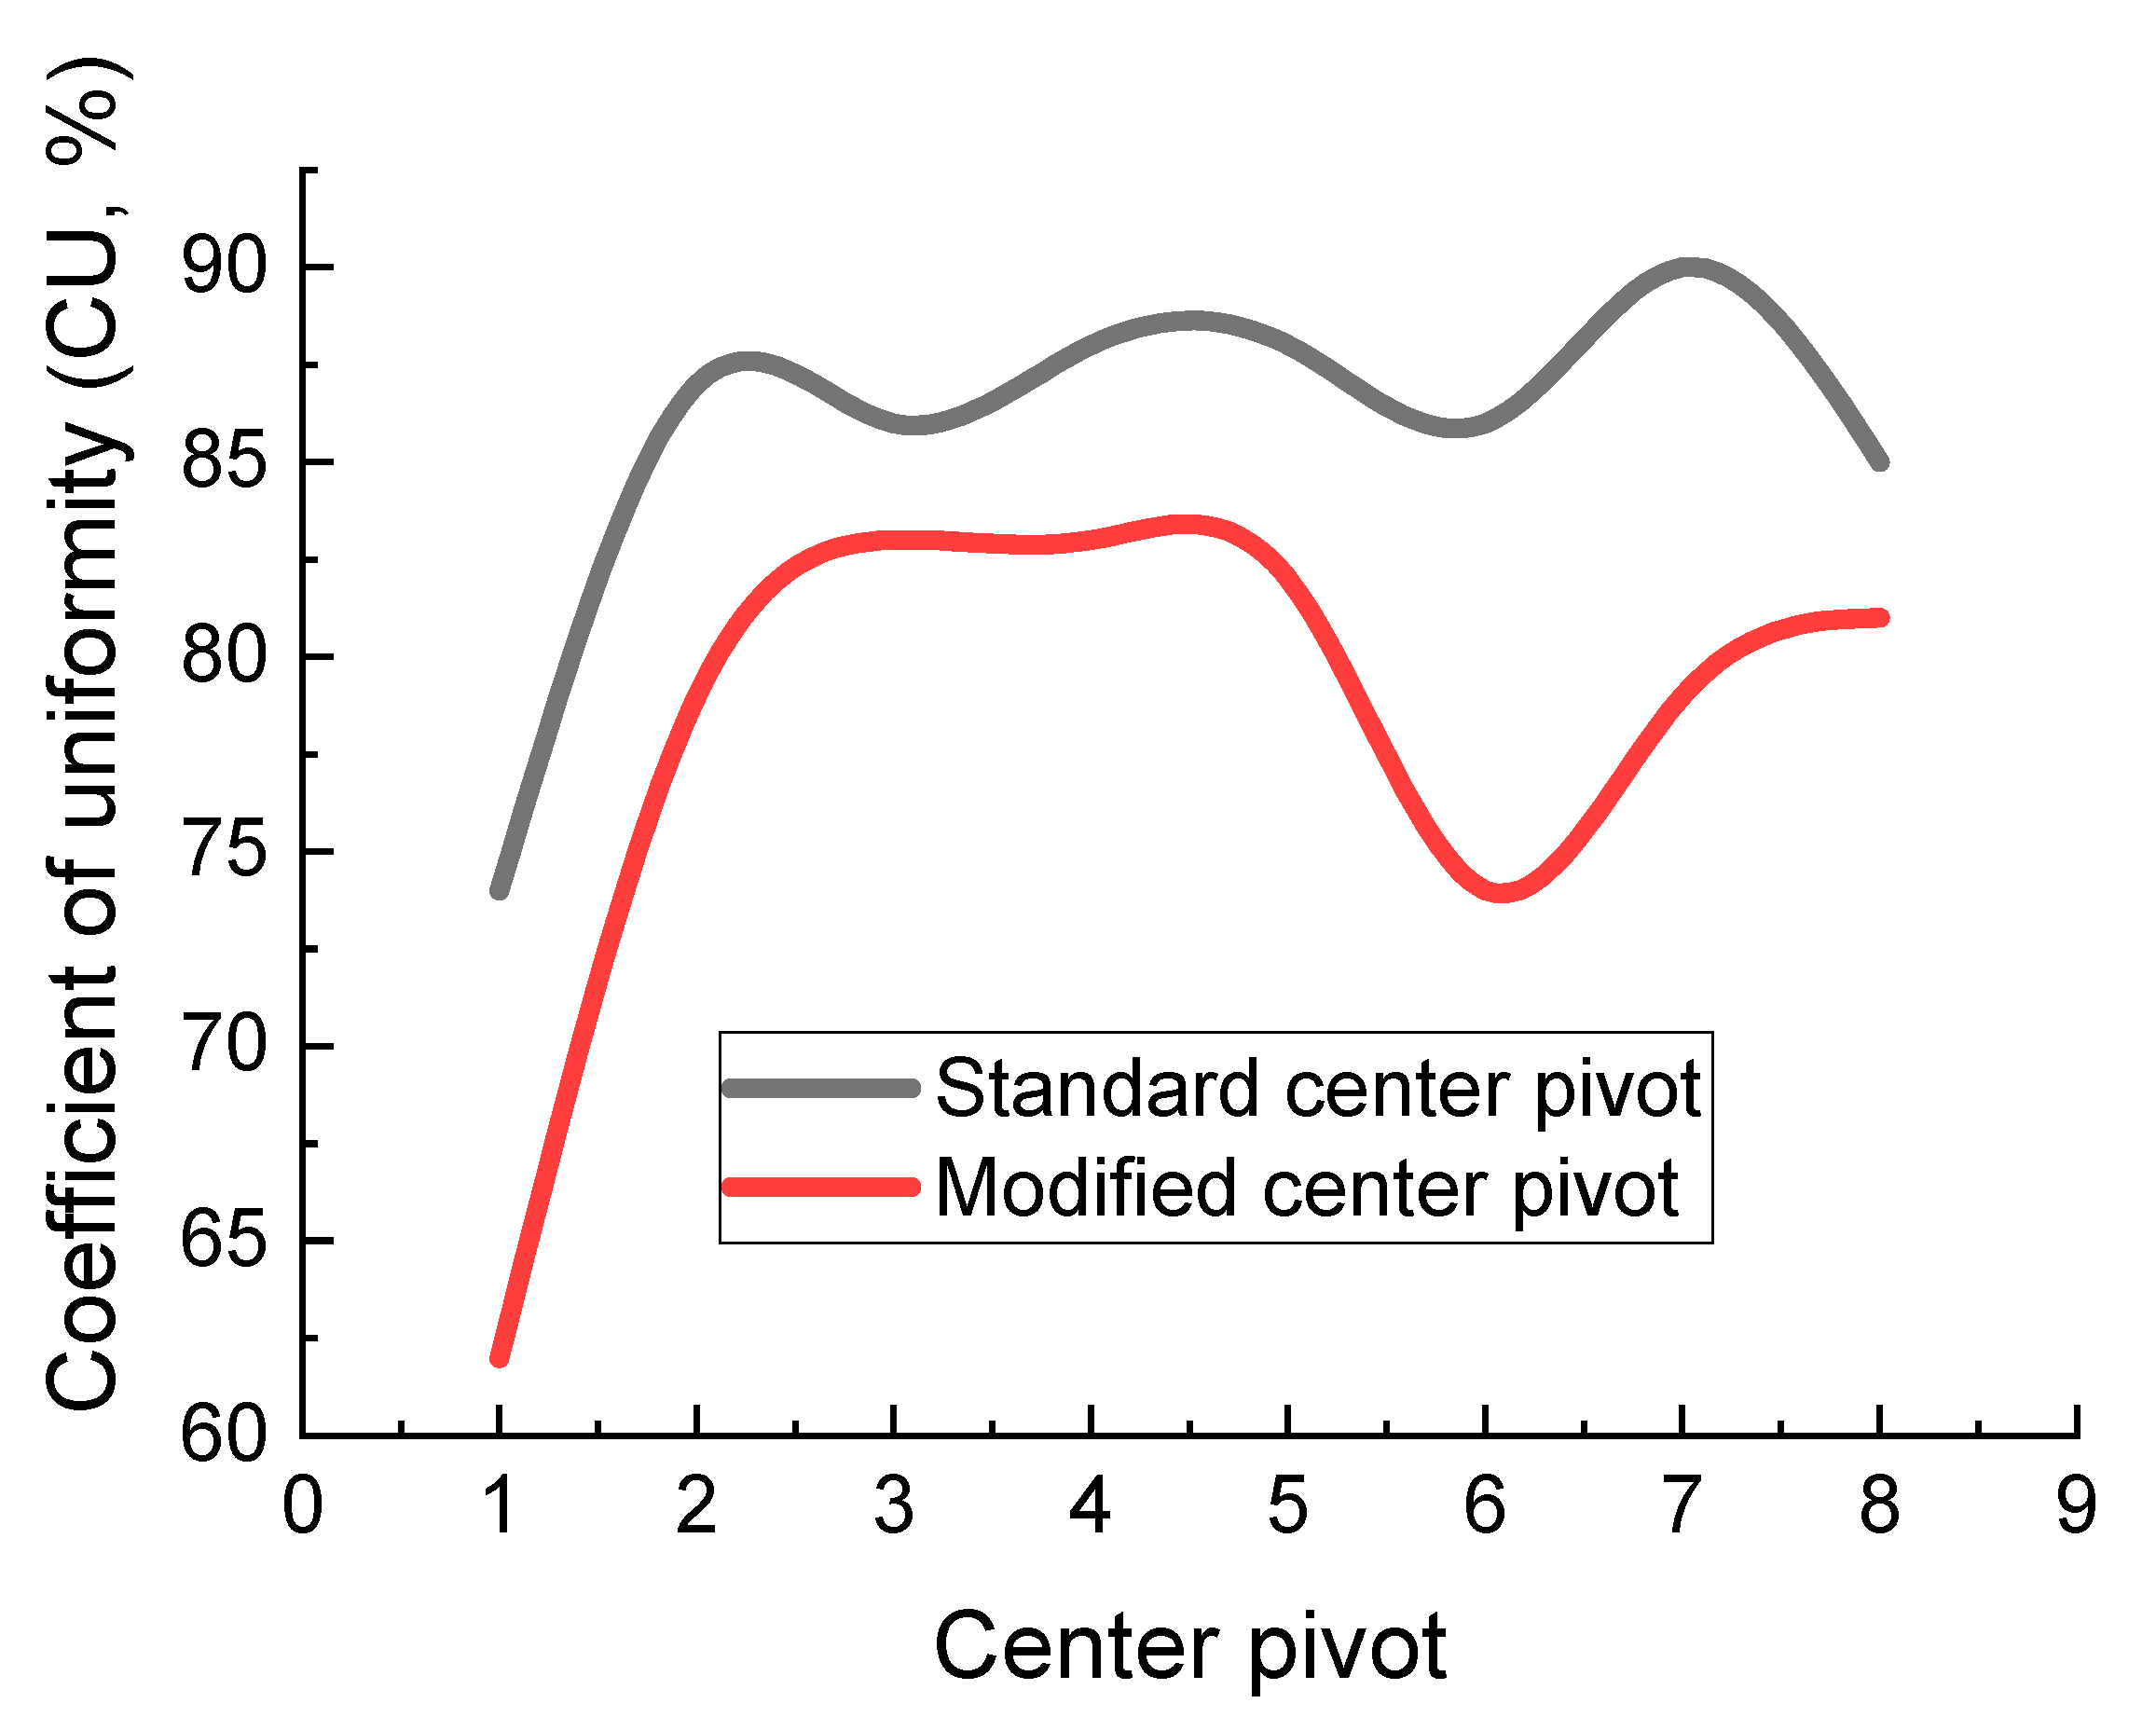
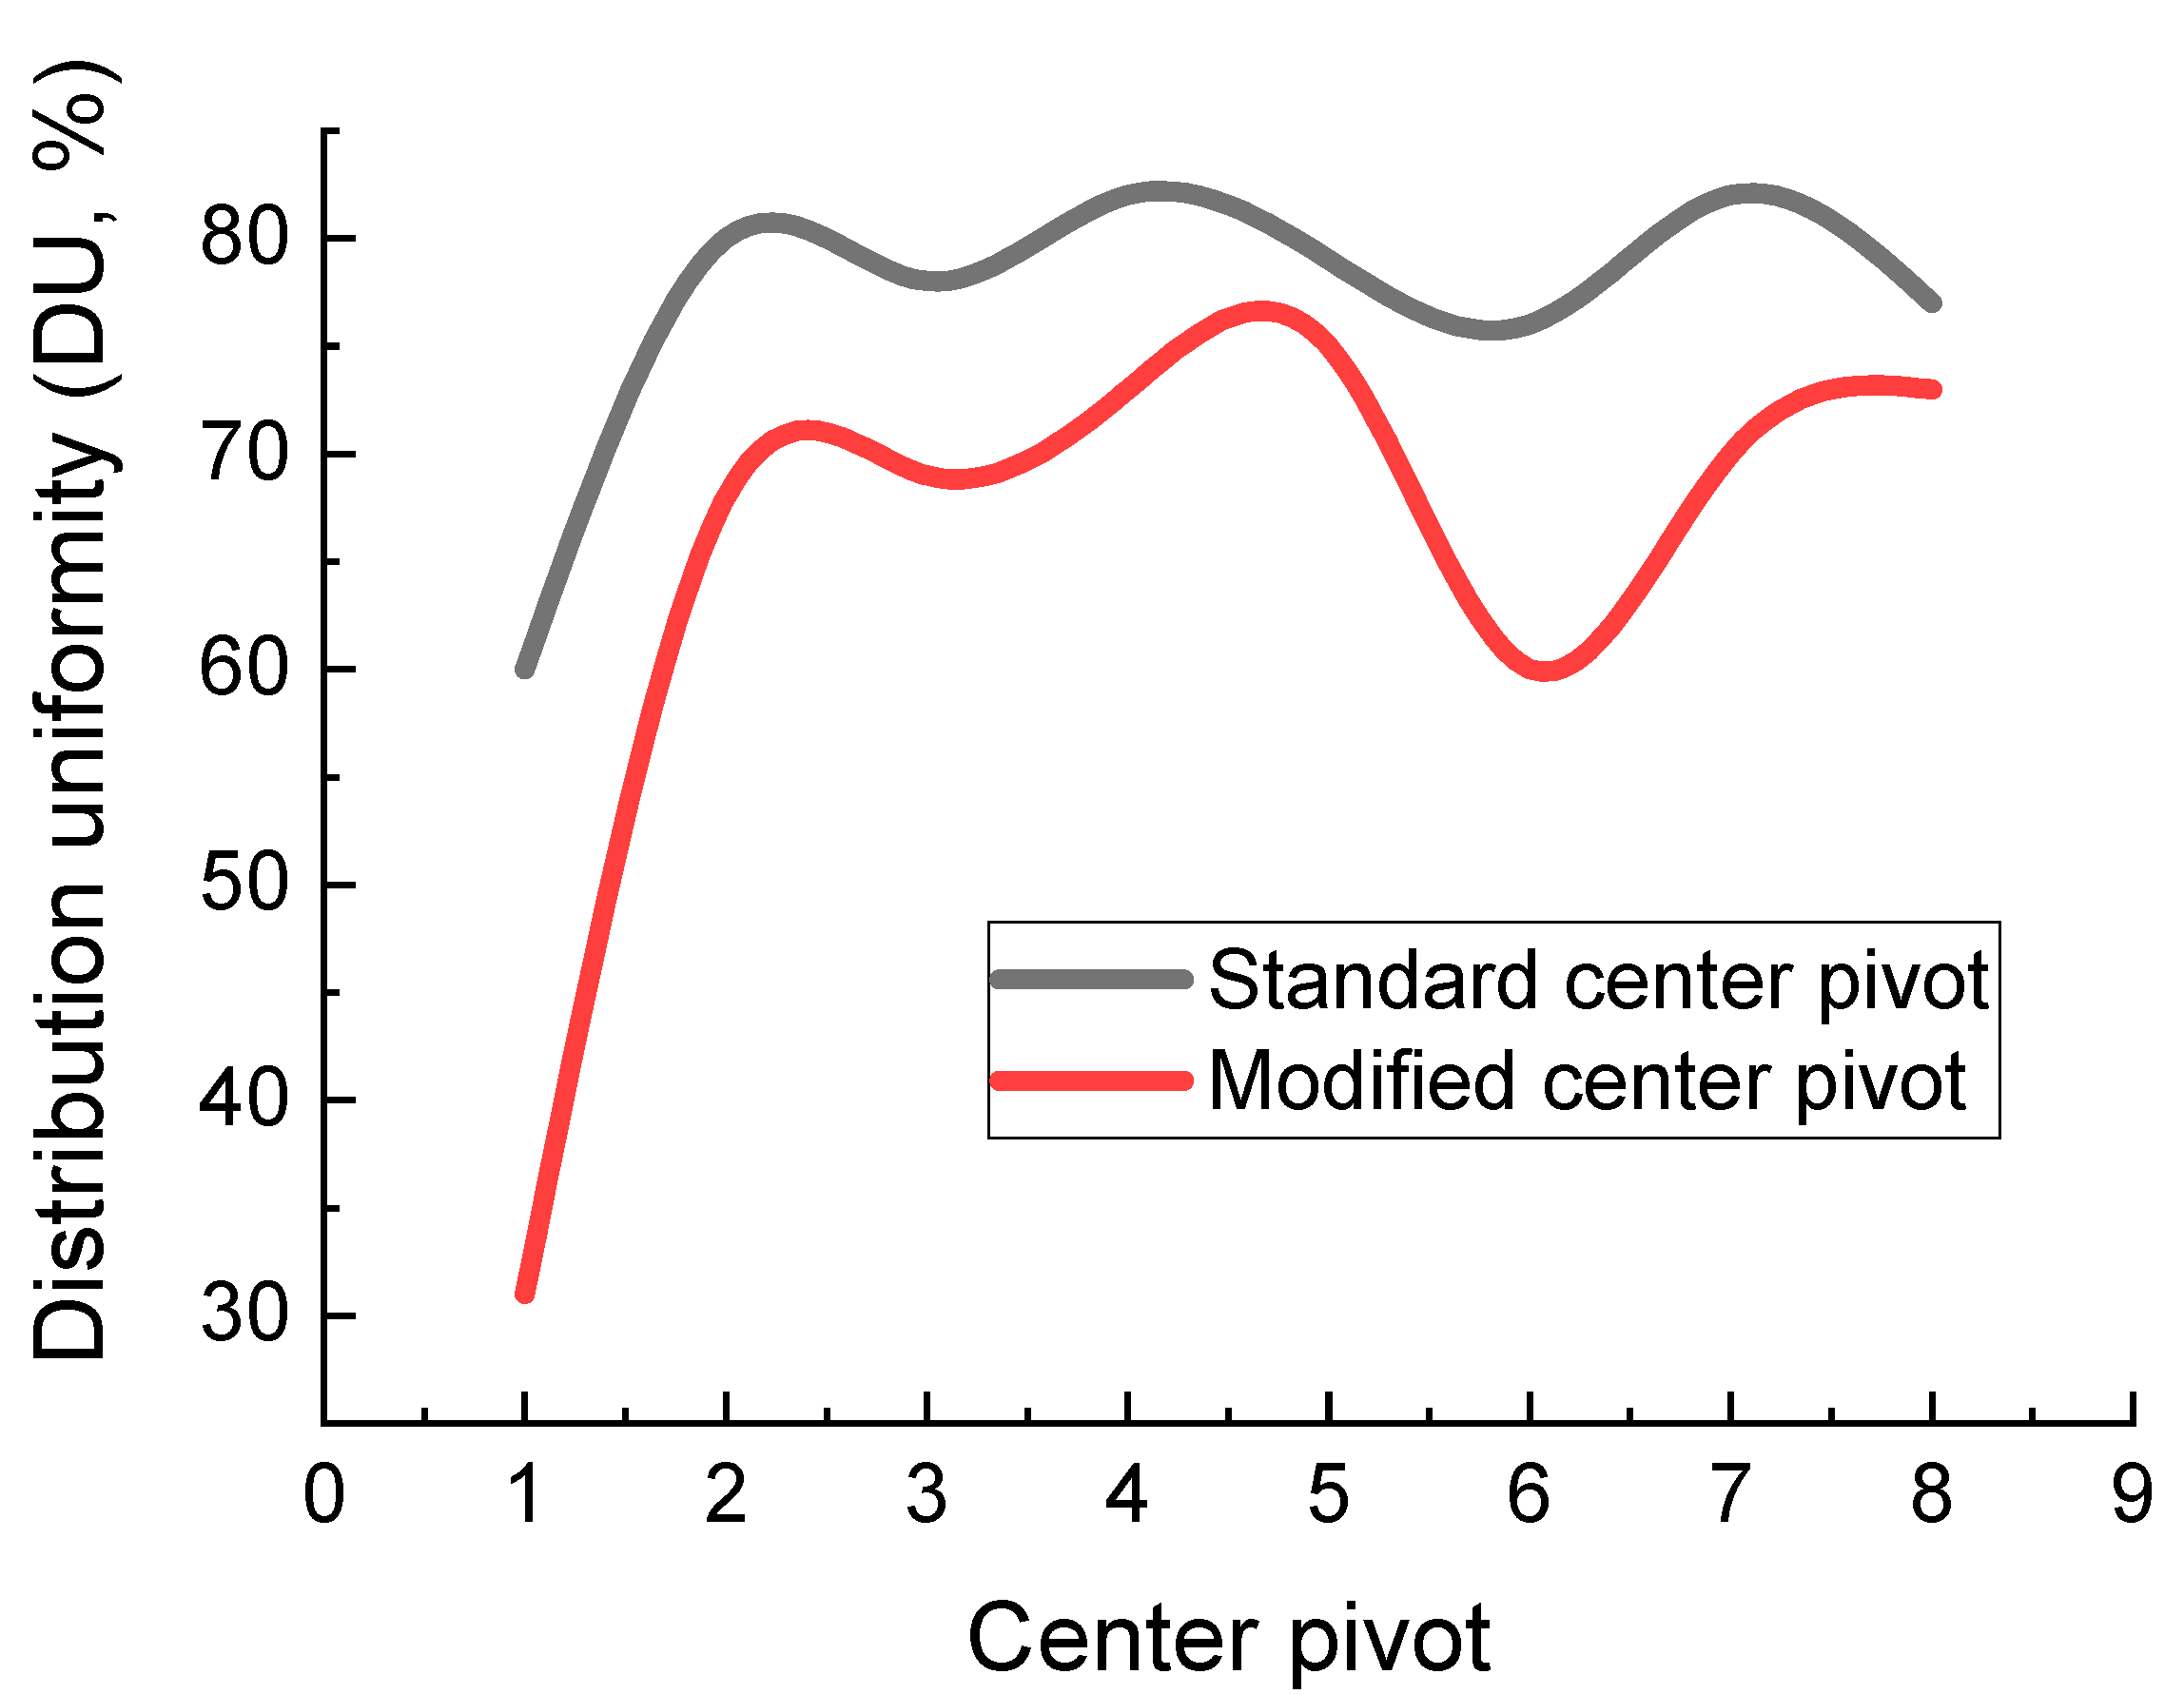
3. Results and Discussion

Irrigation water uniformity indicates how uniformly water is applied over the soil for various irrigation conditions. Figure 6a–h and Figure 7a–h show the water distribution profiles, average applied depths, and average depths in a low quarter of application for both the standard and modified laterals of the tested center pivot systems, respectively. For each of the tested 16-center pivot irrigation systems, the profiles represent depths of water collected within each can along the laterals. Figure 6a–h and Figure 7a–h indicate that substantial areas of the tested center pivot systems received less water than the average applied amount. Additionally, there was a considerable variation in the depth of water applied along the lateral from one system to another, particularly in cases where laterals were modified.
Water distribution profiles ranged from 4 to 14 mm for the 8-standard center pivot irrigation systems (Figure 6a–h), while those for the 8-modified center pivot irrigation systems ranged from 6.5 to 50 mm (Figure 7a–h). Similarly, for 8-center pivot irrigation systems fitted with standard laterals, the average low-quarter application depths ranged from 6.5 to 6.8 mm. In contrast, for the 8-modified center pivot irrigation systems, the average low-quarter application depths ranged from 8.3 to 8.8 mm.
It is worth noting that the water depths for the modified-center pivot irrigation systems were greater than those for the standard-center pivot irrigation systems. This indicates that the modified-center pivot irrigation systems applied more water to the irrigated areas than the standard-center pivot irrigation systems at the same travel speed. The higher applied depths were mainly due to the changes in lateral configuration introduced by the farmers, resulting in pressure variations, incorrect nozzling, inaccurate water patterns, and lateral leakage.
The performance index values were calculated to compare how well both the standard and modified-center pivot irrigation systems distributed the irrigation water. Equations (2) and (3) were utilized to compute the values of CU and DU, respectively, for the 16-center pivot irrigation systems. Results are shown in Figure 8, which compares the CU for the standard- and modified-center pivot irrigation systems. The index values of the CU were clearly lower for the modified-center pivot irrigation systems than for standard-center pivot irrigation systems. Standard-center pivot irrigation systems’ CU values ranged from 74 to 90%, with an average of 86%. In comparison, the modified-center pivot irrigation systems’ CU values ranged from 62 to 83%, with an average of 78%.
Figure 9 illustrates the DU values for the two standard and modified-center pivot irrigation systems. The DU values ranged from 60% to 82% for the standard-center pivot irrigation systems, with an overall average of 77%. For the modified-center pivot irrigation systems, the DU values, in contrast, ranged from 31% to 75%, with an average of 65%. Thus, the accuracy and uniformity of the standard-center pivot irrigation systems were superior to those that had been modified.
In most modified-center pivot irrigation systems, the values for CU and DU were below acceptable levels [33], with an average of 78% and 65%, respectively. In comparison, irrigation water for most standard-center pivot irrigation systems was distributed more uniformly, with average CU and DU values of 86% and 77%, respectively, being acceptable values [33]. As a result, the standard-center pivot irrigation systems performed better than the modified ones, with the water being applied more uniformly. On the contrary, poor uniformity and large variations in water depth along the laterals were more noticeable within the modified-center pivot irrigation systems. Consequently, these modified-center pivot irrigation systems would negatively impact irrigated crop fields’ overall growth and yield.
Non-uniformity of the modified-center pivot irrigation systems resulted from incorrect lateral placement, which had many variations in height (Figure 3b), on the one hand, and nozzle pressure variations along the laterals, on the other hand. Furthermore, the sprinkler discharges and application depth patterns along the modified-center pivot laterals differed from those with the standard-center pivot systems.
Analysis of Variance (ANOVA) was used to compare the CU and DU values for both the modified and standard-center pivot irrigation systems using a one-way analysis of a t-test. The least significant difference (LSD) was used to compare the performance indices of the two systems at the 5% and 1% probability levels. Statistical analysis showed a significant difference in CU and DU values for the modified and standard-center pivot irrigation systems at both the 1% and 5% levels. This indicates that the lateral configuration significantly impacted these modified-center pivot systems’ performance indicators, leading to poor performances. As a result, the center pivot system’s performance and irrigation water distribution would be greatly affected by those changes, leading to increased water losses and decreases in crop yield.
Statistically, the influence and relationship of the independent variables (wind speed, temperature, and relative humidity) with the dependent variable (water losses) were analyzed. The standard error, t-statistic, and p-value of the analyzed data are displayed in Table 1. At an alpha level of 0.05, the p-value revealed a significant effect between the independent variables and the water losses. Wind speed, temperature, and relative humidity were influential variables in calculating the water losses, wherein the standard errors of those variables were ±2.67, ±0.26, and ±0.02, respectively. Furthermore, Figure 10, Figure 11 and Figure 12 depict the predicted and measured water loss values using the MLR model. These figures demonstrate that the MLR’s predicted values are consistent with those obtained from the field. Furthermore, the wind speed and air temperature variables were directly proportional to the water losses, where increased wind speed and air temperature led to increased water loss. Such results corroborate those of Ortiz et al. [31], who stated that wind speed is one of the main factors influencing water distribution patterns in sprinkler irrigation systems. As a result, water losses can be minimized by operating the center pivot irrigation systems early in the morning or when the air temperature and wind speed are at their lowest levels.

4. Conclusions

Replacing the standard lateral galvanized pipes with modified polyethylene plastic ones in the center pivot irrigation systems is popular among Saudi Arabian farmers. The study’s main objective was to investigate the performance of the standard- and modified-center pivot irrigation systems on the uniformity coefficient and water distribution under field conditions. The results showed that the water distribution was influenced by the modified laterals of the tested-center pivot irrigation systems, leading to low-performance indexes, most of which were lower than acceptable levels. Results analysis revealed that the modified lateral of center pivot irrigation systems delivered water with non-uniform depth distribution and a low uniformity along the polyethylene developed lateral pipe compared to the standard designed ones. The non-uniformity of the modified-center pivot irrigation systems was mainly due to the incorrect lateral placement, nozzle pressure variations, and leakage along the laterals. Failure to maintain a predetermined pressure at each sprinkler of the modified-center pivot irrigation systems will cause water distribution variation along the laterals, leading to increased water losses and decreases in crop yield. The study results are expected to draw attention to standard lateral pipes’ value for sprinkler irrigation system users and provide valuable information on water application and losses associated with center pivot irrigation systems for facing aridity and water scarcity.

Author Contributions

Conceptualization and methodology, H.A.-G.; data curation, software, formal analysis, and writing—original draft, A.Z.D.; writing—review and editing, H.A.-G. and A.Z.D. Both authors have read and agreed to the published version of the manuscript.

Funding

The work was funded by the Deanship of Scientific Research at King Saud University through research group number RG-1441-321.

Institutional Review Board Statement

Not applicable.

Informed Consent Statement

Not applicable.

Data Availability Statement

Not applicable.

Acknowledgments

The authors extend their appreciation to the Deanship of Scientific Research at King Saud University for funding this work through research group no. RG-1441-321.

Conflicts of Interest

The authors declare no conflict of interest.

References

  1. Al-Ghobari, H.M. Effect of center pivot system lateral configuration on water application uniformity in an arid area. J. Agric. Sci. Technol. 2014, 16, 577–589. [Google Scholar]
  2. Valín, M.I.; Cameira, M.R.; Teodoro, P.R.; Pereira, L.S. DEPIVOT: A model for center-pivot design and evaluation. Comput. Electron. Agric. 2012, 87, 159–170. [Google Scholar] [CrossRef]
  3. Ministry of Finance and National Economy (MFNE). Statistical Yearbook; Central Department of Statistics, MFNE: Riyadh, Saudi Arabia, 2008. [Google Scholar]
  4. Evans, R.G.; Sadler, E.J. Methods and technologies to improve efficiency of water use. Water Resour. Res. 2008, 44, 1–15. [Google Scholar] [CrossRef]
  5. Merriam, J.L.; Burt, C.M.; Clemmens, A.J.; Solomon, K.H.; Howell, T.A.; Strelkoff, T.S. Irrigation performance measures: Efficiency and uniformity. J. Irrig. Drain. Eng. 1999, 125, 97–99. [Google Scholar] [CrossRef]
  6. Dukes, M.D.; Perry, C. Uniformity testing of variable-rate center pivot irrigation control systems. Precis. Agric. 2006, 7, 205–218. [Google Scholar] [CrossRef]
  7. Li, J.; Rao, M. Sprinkler water distributions as affected by winter wheat canopy. Irrig. Sci. 2000, 20, 29–35. [Google Scholar] [CrossRef]
  8. Dechmi, F.; Playán, E.; Faci, J.M.; Tejero, M. Analysis of an irrigation district in northeastern Spain: I. Characterisation and water use assessment. Agric. Water Manag. 2003, 61, 75–92. [Google Scholar] [CrossRef] [Green Version]
  9. El-Ansary, M.Y.; El-Gindy, A.M.; Awad, M.A.; Wasif, E. Evaluation of the Alternate Sets Management of Sprinkler Irrigation. In Proceedings of the 11th Annual Conference of Misr Society of Agricultural Engineering, Kafr El-Sheikh, Egypt, 15–16 October 2003. [Google Scholar]
  10. Clemmens, A.J.; Solomon, K.H. Estimation of global irrigation distribution uniformity. J. Irrig. Drain. Eng. 1997, 123, 454–461. [Google Scholar] [CrossRef]
  11. Christiansen, J.E. Irrigation by Sprinkler, California Agricultural Experimental Station Bull; No. 670; University of California at Davis: Davis, CA, USA, 1942. [Google Scholar]
  12. Harrison, K.; Perry, C. Evaluating and Interpreting Application Uniformity of Center Pivot Irrigation Systems, Circular 911; University of Georgia Cooperative Extension: Athens, GA, USA, 2013. [Google Scholar]
  13. Natural Resources Conservation Service (NRCS). Conservation Practice Standard: Irrigation System, Sprinkler, Code 442; United States Department of Agriculture, Natural Resources Conservation Service: Washington, DC, USA, 2003. [Google Scholar]
  14. Keller, J.; Bliesner, R.D. Sprinkle and Trickle Irrigation, 1st ed.; Van Nostrand Reinhold: New York, NY, USA, 1990; p. 643. [Google Scholar]
  15. Abo-Ghobar, H.M. Losses from low-pressure center-pivot irrigation systems in a desert climate as affected by nozzle height. Agric. Water Manag. 1992, 21, 23–32. [Google Scholar] [CrossRef]
  16. Al-Ghobari, H.M. The Effect of travel speed on spray losses from center pivot systems. J. King Saud Univ. Sci. 1996, 8, 111–123. [Google Scholar]
  17. Louie, M.J.; Selker, J.S. Sprinkler head maintenance effects on water application uniformity. J. Irrig. Drain. Eng. 2000, 126, 142–148. [Google Scholar] [CrossRef]
  18. Playán, E.; Salvador, R.; Faci, J.M.; Zapata, N.; Martínez-Cob, A.; Sánchez, I. Day and night wind drift and evaporation losses in sprinkler solid-sets and moving laterals. Agric. Water Manag. 2005, 76, 139–159. [Google Scholar] [CrossRef] [Green Version]
  19. Al-Ghobari, H.M. The performance of the center pivot irrigation systems under Riyadh region conditions in Saudi Arabia. J. Saudi Soc. Agric. Sci. 2010, 9, 55–68. [Google Scholar]
  20. Zhang, L.; Merkley, G.P.; Pinthong, K. Assessing whole-field sprinkler irrigation application uniformity. Irrig. Sci. 2013, 31, 87–105. [Google Scholar] [CrossRef]
  21. Heermann, D.F.; Hein, P.R. Performance characteristics of self-propelled center-pivot sprinkler irrigation system. Trans. ASAE 1968, 11, 11–15. [Google Scholar]
  22. James, L.G.; Blair, S.K. Performance of low pressure center pivot systems. Trans. ASAE 1984, 27, 1753–1757. [Google Scholar] [CrossRef] [Green Version]
  23. Von Bernuth, R.D.; Gilley, J.R. Evaluation of center pivot application packages considering droplet induced infiltration reduction. Trans. ASAE 1985, 28, 1940–1946. [Google Scholar] [CrossRef]
  24. Hanson, B.R.; Wallender, W.W. Bidirectional uniformity of water applied by continuous-move sprinkler machines. Trans. ASAE 1986, 29, 1047–1053. [Google Scholar] [CrossRef]
  25. Johnson, G.C.; Rochester, E.W.; Hatch, L.U.; Curtis, L.M.; Yoo, K.H. Analysis of center pivot irrigation systems operating in a humid-area environment. Trans. ASAE 1987, 30, 1720–1725. [Google Scholar] [CrossRef]
  26. Tarjuelo, J.M.; Montero, J.; Honrubia, F.T.; Ortiz, J.J.; Ortega, J.F. Analysis of uniformity of sprinkle irrigation in a semi-arid area. Agric. Water Manag. 1999, 40, 315–331. [Google Scholar] [CrossRef]
  27. Li, Y.; Bai, G.; Yan, H. Development and validation of a modified model to simulate the sprinkler water distribution. Comput. Electron. Agric. 2015, 111, 38–47. [Google Scholar] [CrossRef]
  28. Li, Y.; Hui, X.; Yan, H.; Chen, D. Effects of Travel Speed and Collector on Evaluation of the Water Application Uniformity of a Center Pivot Irrigation System. Water 2020, 12, 1916. [Google Scholar] [CrossRef]
  29. Chakraborty, M.; Khot, L.R.; Peters, R.T. Assessing suitability of modified center pivot irrigation systems in corn production using low altitude aerial imaging techniques. Inf. Process. Agric. 2020, 7, 41–49. [Google Scholar] [CrossRef]
  30. Al-agele, H.A.; Mahapatra, D.M.; Prestwich, C.; Higgins, C.W. Dynamic Adjustment of Center Pivot Nozzle Height: An Evaluation of Center Pivot Water Application Pattern and the Coefficient of Uniformity. Appl. Eng. Agric. 2020, 36, 647–656. [Google Scholar] [CrossRef]
  31. Ortiz, J.N.; De Juan, J.A.; Tarjuelo, J.M. Analysis of water application uniformity from a centre pivot irrigator and its effect on sugar beet (Beta vulgaris L.) yield. Biosyst. Eng. 2010, 105, 367–379. [Google Scholar] [CrossRef]
  32. Merriam, J.L.; Keller, J. Farm Irrigation System Evaluation: A Guide for Management; Utah State University: Logan, UT, USA, 1978. [Google Scholar]
  33. Evans, R.O.; Barker, J.C.; Smith, J.T.; Sheffield, R.E. Field Calibration Procedures for Animal Wastewater Application Equipment—Stationary Sprinkler Irrigation Systems; AG-553-1; North Carolina Cooperative Extension Service; North Carolina State University: Raleigh, NC, USA, 1997. [Google Scholar]
  34. ASABE. Test Procedure for Determining the Uniformity of Water Distribution of Center-Pivot and Lateral Move Irrigation Machines Equipped with Spray or Sprinkler Nozzles, ANSI/ASAE Standard S436.1, 56th ed.; ASABE Standards: Joseph, MI, USA, 2009; pp. 1043–1049. [Google Scholar]
Figure 1. A map of the study sites in Saudi Arabia. (1) Riyadh, (2) Qassim, (3) Jouf, and (4) the eastern province.
Agronomy 11 01675 g001
Figure 2. Monthly average climate data for Riyadh, Qassim, Jouf, and the eastern province regions.
Agronomy 11 01675 g002
Figure 3. Two types of center pivot irrigation systems employed in the study regions with standard lateral (a) and modified lateral (b).
Agronomy 11 01675 g003
Figure 4. Schematic of the center pivot irrigation system.
Agronomy 11 01675 g004
Figure 5. Catch cans arrangement for the performance evaluation of the center pivot irrigation systems.
Agronomy 11 01675 g005
Figure 6. Water distribution patterns with the average depths and the average low quarter depths of application measured from the tested center pivot irrigation systems with standard laterals. The symbols (ah) correspond to the tested center pivot systems numbered 1 to 8.
Agronomy 11 01675 g006
Figure 7. Water distribution patterns with the average depths and the average low quarter depths of application measured from the tested center pivot irrigation systems with modified laterals. The symbols (ah) correspond to the tested center pivot systems numbered 1 to 8.
Agronomy 11 01675 g007
Figure 8. A comparison between the coefficient of uniformity (CU) for both the standard- and modified-laterals of the tested center pivot irrigation systems.
Agronomy 11 01675 g008
Figure 9. A comparison between the distribution uniformity (DU) for both the standard- and modified-laterals of the tested center pivot irrigation systems.
Agronomy 11 01675 g009
Figure 10. Measured and predicted water losses of the MLR model using the wind speed (WS) dataset.
Agronomy 11 01675 g010
Figure 11. Measured and predicted water losses of the MLR model using the air temperature (T) dataset.
Agronomy 11 01675 g011
Figure 12. Measured and predicted water losses of the MLR model using the relative humidity (RH) dataset.
Agronomy 11 01675 g012
Table 1. The results of the developed MLR model’s water loss regression analysis.
VariablesCoefficientsValueSEt-Statisticp-ValueCC
Interceptβ0−32.203.25−9.890.00050.98
WSβ12.162.670.810.4629
Tβ21.210.264.650.0096
RHβ30.190.026.800.0024
WS: wind speed, T: air temperature, RH: relative humidity, CC: coefficient of correlation, SE: standard error of regression coefficients, p-value: probability value.
Publisher’s Note: MDPI stays neutral with regard to jurisdictional claims in published maps and institutional affiliations.

