Article

LED Light Pre-Treatment Improves Pre-Basic Seed Potato (Solanum tuberosum L. cv. Golden King) Production in the Aeroponic System

by
Md. Hafizur Rahman
1,†,
Md. Jahirul Islam
1,2,†,
Md. Obyedul Kalam Azad
1,
Md. Soyel Rana
1,
Byeong Ryeol Ryu
1 and
Young-Seok Lim
1,*
1
Department of Bio-Health Convergence, College of Biomedical Science, Kangwon National University, Chuncheon 24341, Korea
2
Physiology and Sugar Chemistry Division, Bangladesh Sugarcrop Research Institute, Ishurdi 6620, Bangladesh
*
Author to whom correspondence should be addressed.
These authors contribute equally.
Agronomy 2021, 11(8), 1627; https://doi.org/10.3390/agronomy11081627
Submission received: 24 June 2021 / Revised: 8 August 2021 / Accepted: 13 August 2021 / Published: 16 August 2021
(This article belongs to the Special Issue In Vitro Multiplication and Seed Production Technology)

Abstract

:
Production of plants under artificial light conditions is an innovative and smart concept to grow food year-round in any location. However, pre-basic seed potato production in the greenhouse from LED pre-treated seedlings under an aeroponic system is a new and creative idea. Therefore, the objective of the study was to optimize the effect of LED pre-treatment and determine the best LED spectral composition on growth performance and tuberization of potato plants. Potato variety ‘Golden King’ was treated under 9 LED light spectra for 30 days—L1 (natural light), L2, (R:B), L3 (R:B:G), L4 (R:B:FR), L5 (R:B:G:FR), L6 (R:B:G:FR:UV), L7 (R:B:FR:UV), L8 (R:B:W:FR), and L9 (R:B:W:FR:UV) under 300 µmol m−2 s−1 photosynthetic photon flux density (PPFD), 23/15 °C (day/night) temperature, and 70% relative humidity. The study revealed that growth characteristics and tuber number for plants were increased most by the light spectrum L4 (R:B:FR). Furthermore, photosynthetic pigments increased in L4, L7, and L8, while TSC and sucrose accumulated more in L1 treatment. In contrast, higher seed tuber fresh weight was recorded in L8, L9, L4, and L7. Overall, it can be concluded that potato seedlings pre-treated with the L4 (R:B:FR) LED spectral composition performed best for growth, establishment, and tuberization.

1. Introduction

Potato (Solanum tuberosum L.) is one of the most valuable crops in the world, yielding 400 million tons per year [1]. Globally, it is the fourth most important food crop after wheat, rice, and maize, and second in South Korea. With a high source of carbohydrates, proteins, vitamins, and minerals, potato is currently cultivated in over 100 countries and feeds more than a billion people [2]. Hence, enhancing the productivity of this root crop may be a key tool in fulfilling the nutritional requirement and the demand for profuse quality seed for breeding purposes.
Currently, in vitro potato plantlets or microtubers from aseptic cultural conditions produce the early generation virus-free pre-basic seed potatoes or potato minitubers. Pre-basic seeds are the nucleus, and breeders seed, or propagating materials, grown in in vitro aseptic culture conditions under strict management in aeroponics or a controlled greenhouse system [3,4]. Potato seed tubers are usually grown in high densities in the greenhouse using various substrates and open fields [2]. Currently, a variety of techniques for producing potato minituber seed have been investigated, including soilless aeroponic, hydroponic [5], and deep-water culture systems [6]. Potato pre-basic seed tuber production in greenhouse conditions is comparatively a new idea where seed tubers can be produced year-round by ignoring seasonal obligations [7]. Following the creation of a plant factory, a controlled condition for plant growth in a simulated environment is developed and used to continue their phenotypic durability and enhanced yield [8].
Light is the primary source of energy that can bring change in several compositions in plants depending on spectral quality, intensity, compositions, duration, and direction. These processes may come from stressful or nonstressful events on plants generated by light irradiation and its interaction with species and cultivars in growth and establishment procedures [9,10]. Plants can change their responses to future stressors when stressed, contributing to the concept of ‘stress memory’ [11,12,13]. As an adaptive mechanism, stress memory can increase resistance to stress factors, but it may also compromise aspects of the overall efficiency of the plant [14].
It has previously been stated that, of the total light obtained by plants from natural sunlight, 90 percent is absorbed as B and R light [15]. It has been stated that controlling light quality and quantity can improve crop yield and quality by regulating the phytochrome photostationary level, changing the ratio of active phytochrome to total phytochrome [16], stimulating photoreceptors [17], and stimulating enzymatic activity [16,17,18]. According to previous research, red and blue light are the most powerful light bands that drive photosynthesis and stimulate plant signaling, respectively, and speed up the accumulation of secondary metabolites. It has also been confirmed that red and blue light enhances stomatal conductance activity more than other spectral regions [19], where blue light is more effective than red light to open stomata [20]. Our previous research also detected that the combination of red, blue, and white light is the best for potato pre-basic seed tuber production in plant factory conditions [7]. In contrast, green light is beneficial for photosynthesis and plant development, meaning that it should be used in the plant cultivation process. For instance, it is more efficient than red light in driving leaf photosynthesis and its photosynthetic quantum yield [15]. Green light stimulates the same physiological and developmental responses in plants as red and blue light, and it interacts with other spectral responses in a complex way [21,22].
Pre-sowing seed treatment affects sprout rates and seedling development, which in turn affects harvest yield, nutrient content, and sunlight absorption ability [23,24,25]. Physical treatment approaches have the benefit of maintaining yield while still being healthy for the climate, which is what drew us initially to this research subject. Plant photosynthesis primarily depends on sunlight, which also has a significant impact on plant growth and development [26]. Previous research has shown that poor lighting or shade can substantially impact plant growth and development, as well as reduce plant production and quality [27]. Plants use red light to accumulate carbohydrates and nutrients, red and blue in the photosynthesis process, synthesis of anthocyanins and polyphenols, blue and UV for accumulating pigments such as carotenoids and biomass [28]. It was also suggested that the R:FR ratio can alter the signaling pathway of the plant by regulating the blue and UV light photoreceptors, which may affect plant growth, development, physio-biochemical process, and root architecture [29].
For this reason, pre-treatment of potato in vitro seedlings under different light spectral bands may be a vital tool for plant growth and produce pre-basic seed potato production in the fall season. Therefore, the objective of the study was to optimize the effect of LED pre-treatment and find the best LED spectral composition for the growth performance of potato plants and to increase the number of tubers.

2. Materials and Methods

2.1. Plantlet Production and Growth Conditions

Professor Young-Seok Lim at Kangwon National University, breeder of this variety, provided ’Golden King‘ (also called as love gold valley and V48) potato (Solanum tuberosum L.) for the experiments. The mother plant was multiplicated through in vitro processes under artificial white LED light (Bisol LED Light Co., Seoul, Korea) with photosynthetic photon flux density (PPFD) of 100 µmol m−2 s−1 in an aseptic condition (MS medium 4.41 g/L; sucrose, 30 g/L; Agar 8 g/L, pH 5.6–5.8) in plastic culture vessel (8 cm × 12 cm; SPL Life Sciences Co. Ltd., Pocheon-si, Korea), where 10 plantlets/vessel were used for 30 days. The photoperiod, relative humidity (RH), and in vitro growth room temperature were 16/8 (day/night), 70%, and 25 °C. The 30-day-old plantlets were directly transplanted to the aeroponic bed under the light chamber, where plant-to-plant distance and row-to-row distance was 12 cm.

2.2. Plant Factory and Light-Emitting Diode (LED) Settings

The virus-free plantlets (tested by ISK 20001/0025, Agdia, Inc., Elkhart, IN, USA; Figure 1) were transplanted (fall season 2020) to the steel-made chamber 80 cm × 60 cm × 80 cm equipped with different LED light (Bisol LED Light Co., Seoul, Korea) combination (Table 1) for thirty days. The photosynthetic photon flux density (PPFD) and temperature of the chamber were 300 µmol m−2 s−1, 16 h (6 a.m. to 10 p.m.), 18 to 27 °C, respectively. After that, the seedlings were moved to the natural light condition under the same aeroponic system and other environmental conditions inside the greenhouse, where they grew to harvesting.

2.3. Aeroponic System

An aluminum frame with extended foam tray panels forming dark root growth chambers was used to create an advanced aeroponic system. Precision control of nutrient solution misting, recovery, and modifications were possible to this advanced irrigation/drainage system. The nutritive solution (Table 2) was continually pumped from the supply reservoir based on the treatment used. Solution A and B was stock in tank A and B, respectively, mixed in a mixing tank and adjusted EC and pH before transfer to supply tank (200 L). Nutrient solutions were mixed and transferred to the supply tank automatically and subject to change and cleaning once a week. Plant roots were misted with microsprinklers (NaanDanJain Irrigation System, Ltd., Tel Aviv, Israel) for 10 s at a time, with 2 min intervals between mists, supplying a nutrient solution that was circulated by various pumps in the tubing network. The residual nutrient solution was returned to the corresponding reservoirs and recirculated. Throughout the experiment, the quality of the nutrient solution (EC and pH) was monitored daily. The pH was controlled by using HCl (1 N) and NaOH (5 M).

2.4. Measurement of Plant Growth Characteristics and Seed Tuber Yield

Plants were randomly selected for morpho-physiological and tuber data collection after 60 and 90 days of growth in the aeroponic system, respectively.

2.5. Analysis of Photosynthetic Pigments of Potato Plants

The photosynthetic pigments of the potato plants, including chlorophyll a (Chl a), chlorophyll b (Chl b), total chlorophyll (Tch), and carotenoid, were studied. For the photosynthetic pigment analysis, three plant samples from each treatment were collected. For further analysis, the harvested leaves were immediately immersed in liquid nitrogen and stored at −80 °C.
Fresh (500 mg) leaves were macerated (10 mL of 80 percent acetone) using mortar and pestle and left at room temperature for 15 min to determine photosynthetic pigments. The extracted material was placed in a tube and centrifuged for 10 min at 5000 rpm. A spectrophotometer was used to measure the absorbance at 647, 663, and 470 nm (UV-1800 240 V, Shimadzu Corporation, Kyoto, Japan). The photosynthetic pigments were calculated using the formula proposed by Lichtenthaler [30] and expressed in milligrams per gram of fresh weight (FW).
Chl a = 12.25 × A663 − 2.79 × A647
Chl b = 21.50 × A647 − 5.10 × A663
Tch = 7.15 × A663 + 18.71 × A647
Car = [(1000 × A470) − (1.82 × Chl a) − (85.02 × Chl b)]/198

2.6. Determination of Total Soluble Carbohydrate (TSC) and Total Soluble Sugar (TSS) Content

TSC and TSS content were extracted and analyzed according to the method mentioned by Islam et al. [31]. The harvested fresh leaf samples (250 mg) were homogenized in 5 mL of ethanol (95 percent), then centrifuged for 10 min at 5000 rpm. The process was then repeated with 70 percent ethanol after extracting the supernatant. Both supernatants were combined and stored at 4 °C.
0.1 mL of the aliquot was diluted with 1 mL anthrone for TSC analysis (200 mg anthrone mixed with 100 mL of 72 percent sulfuric acid). The mixture was heated for 10 min at 100 °C before being cooled. The TSC was calculated using a glucose standard curve, with a 625 nm detection wavelength by spectrophotometer (UV-1800 240 V, Shimadzu Corporation, Kyoto, Japan), and results were expressed in mg/g fresh weight. To analyze the TSS content, 0.2 mL of the supernatant was combined with 0.1 mL of KOH (30%) and heated for 10 min at 100 °C. After allowing the mixture to cool to room temperature, 3 mL of anthrone (150 mg anthrone in 100 mL 70% sulfuric acid) was added. The samples were chilled for ten minutes before being measured at 620 nm wavelength for absorbance in a spectrophotometer (UV-1800 240 V, Shimadzu Corporation, Kyoto, Japan). The TSS concentration was computed using the glucose standard curve, and the results were expressed as µg/g fresh weight.

2.7. Determination of Tuber Yield

Tuber yield data were recorded from each treatment at 90 days of growth of the plants at greenhouse conditions.

2.8. Statistical Analysis

One-way analysis of variance was conducted using Statistics 10 (Tallahassee, FL, USA), and all results were expressed as mean ± SD (standard deviation). The least significant differences (LSD) were calculated to compare the means of different treatments with 5% level of probability. The OriginLab 10.0 software (OriginLab, Northampton, MA, USA) was used to perform principal component analysis (PCA).

3. Results

3.1. Effect of LED Light on Plant Morphological Characteristics

Table 3 and Table 4 give the growth characteristics of the light pre-treated potato plantlets grown under the varied LED light spectrum. The results showed that treatment L4 had an overall positive effect on the most growth characteristics. However, higher stem diameter was recorded from the treatments L2 and L3. Furthermore, leaf width and leaf length were found higher in L3 and L9 treatments.

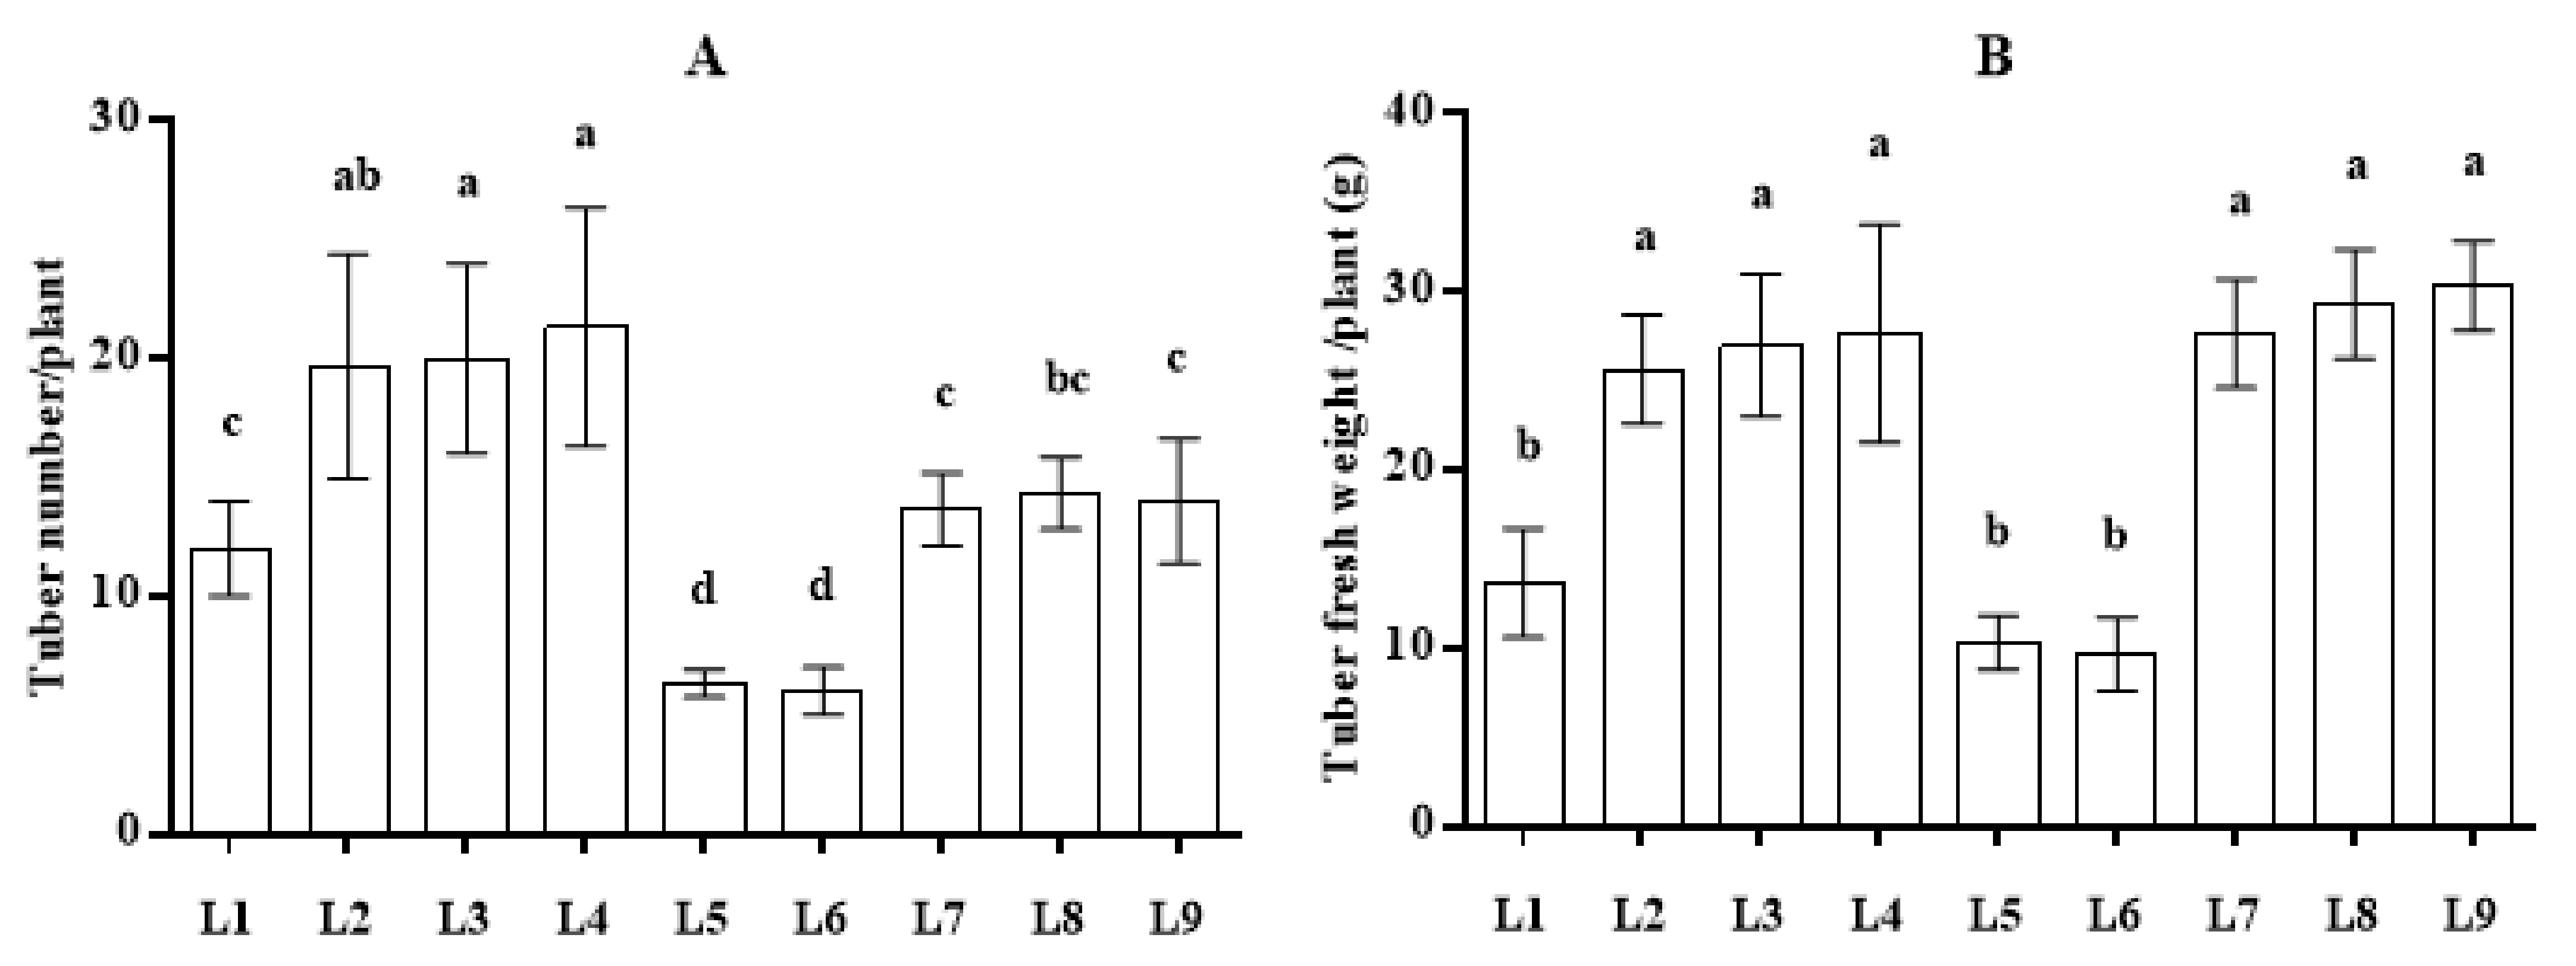
3.2. Effect of LED Light on Tuber Yield and Grading

The variation of tuber number per plant and tuber fresh weight per plant was observed under different treatments (Figure 2). The highest tuber number was recorded from the treatment L4 followed by L2 and L3, while higher tuber fresh weight was recorded in L8, L9, L4, and L7 as well. In addition, L5 and L6 produced both lower numbers and fresh weight of tuber per plant.
In contrast, Figure 3 represents the number of tubers under three categorized gradings: small (<3 g), medium (3–5 g), and larger (>5 g). The highest smaller and medium tuber numbers/plant was recorded in the treatments L2 and L3, respectively. However, the number of larger (>5 g) tuber was found in the L4 treatment.

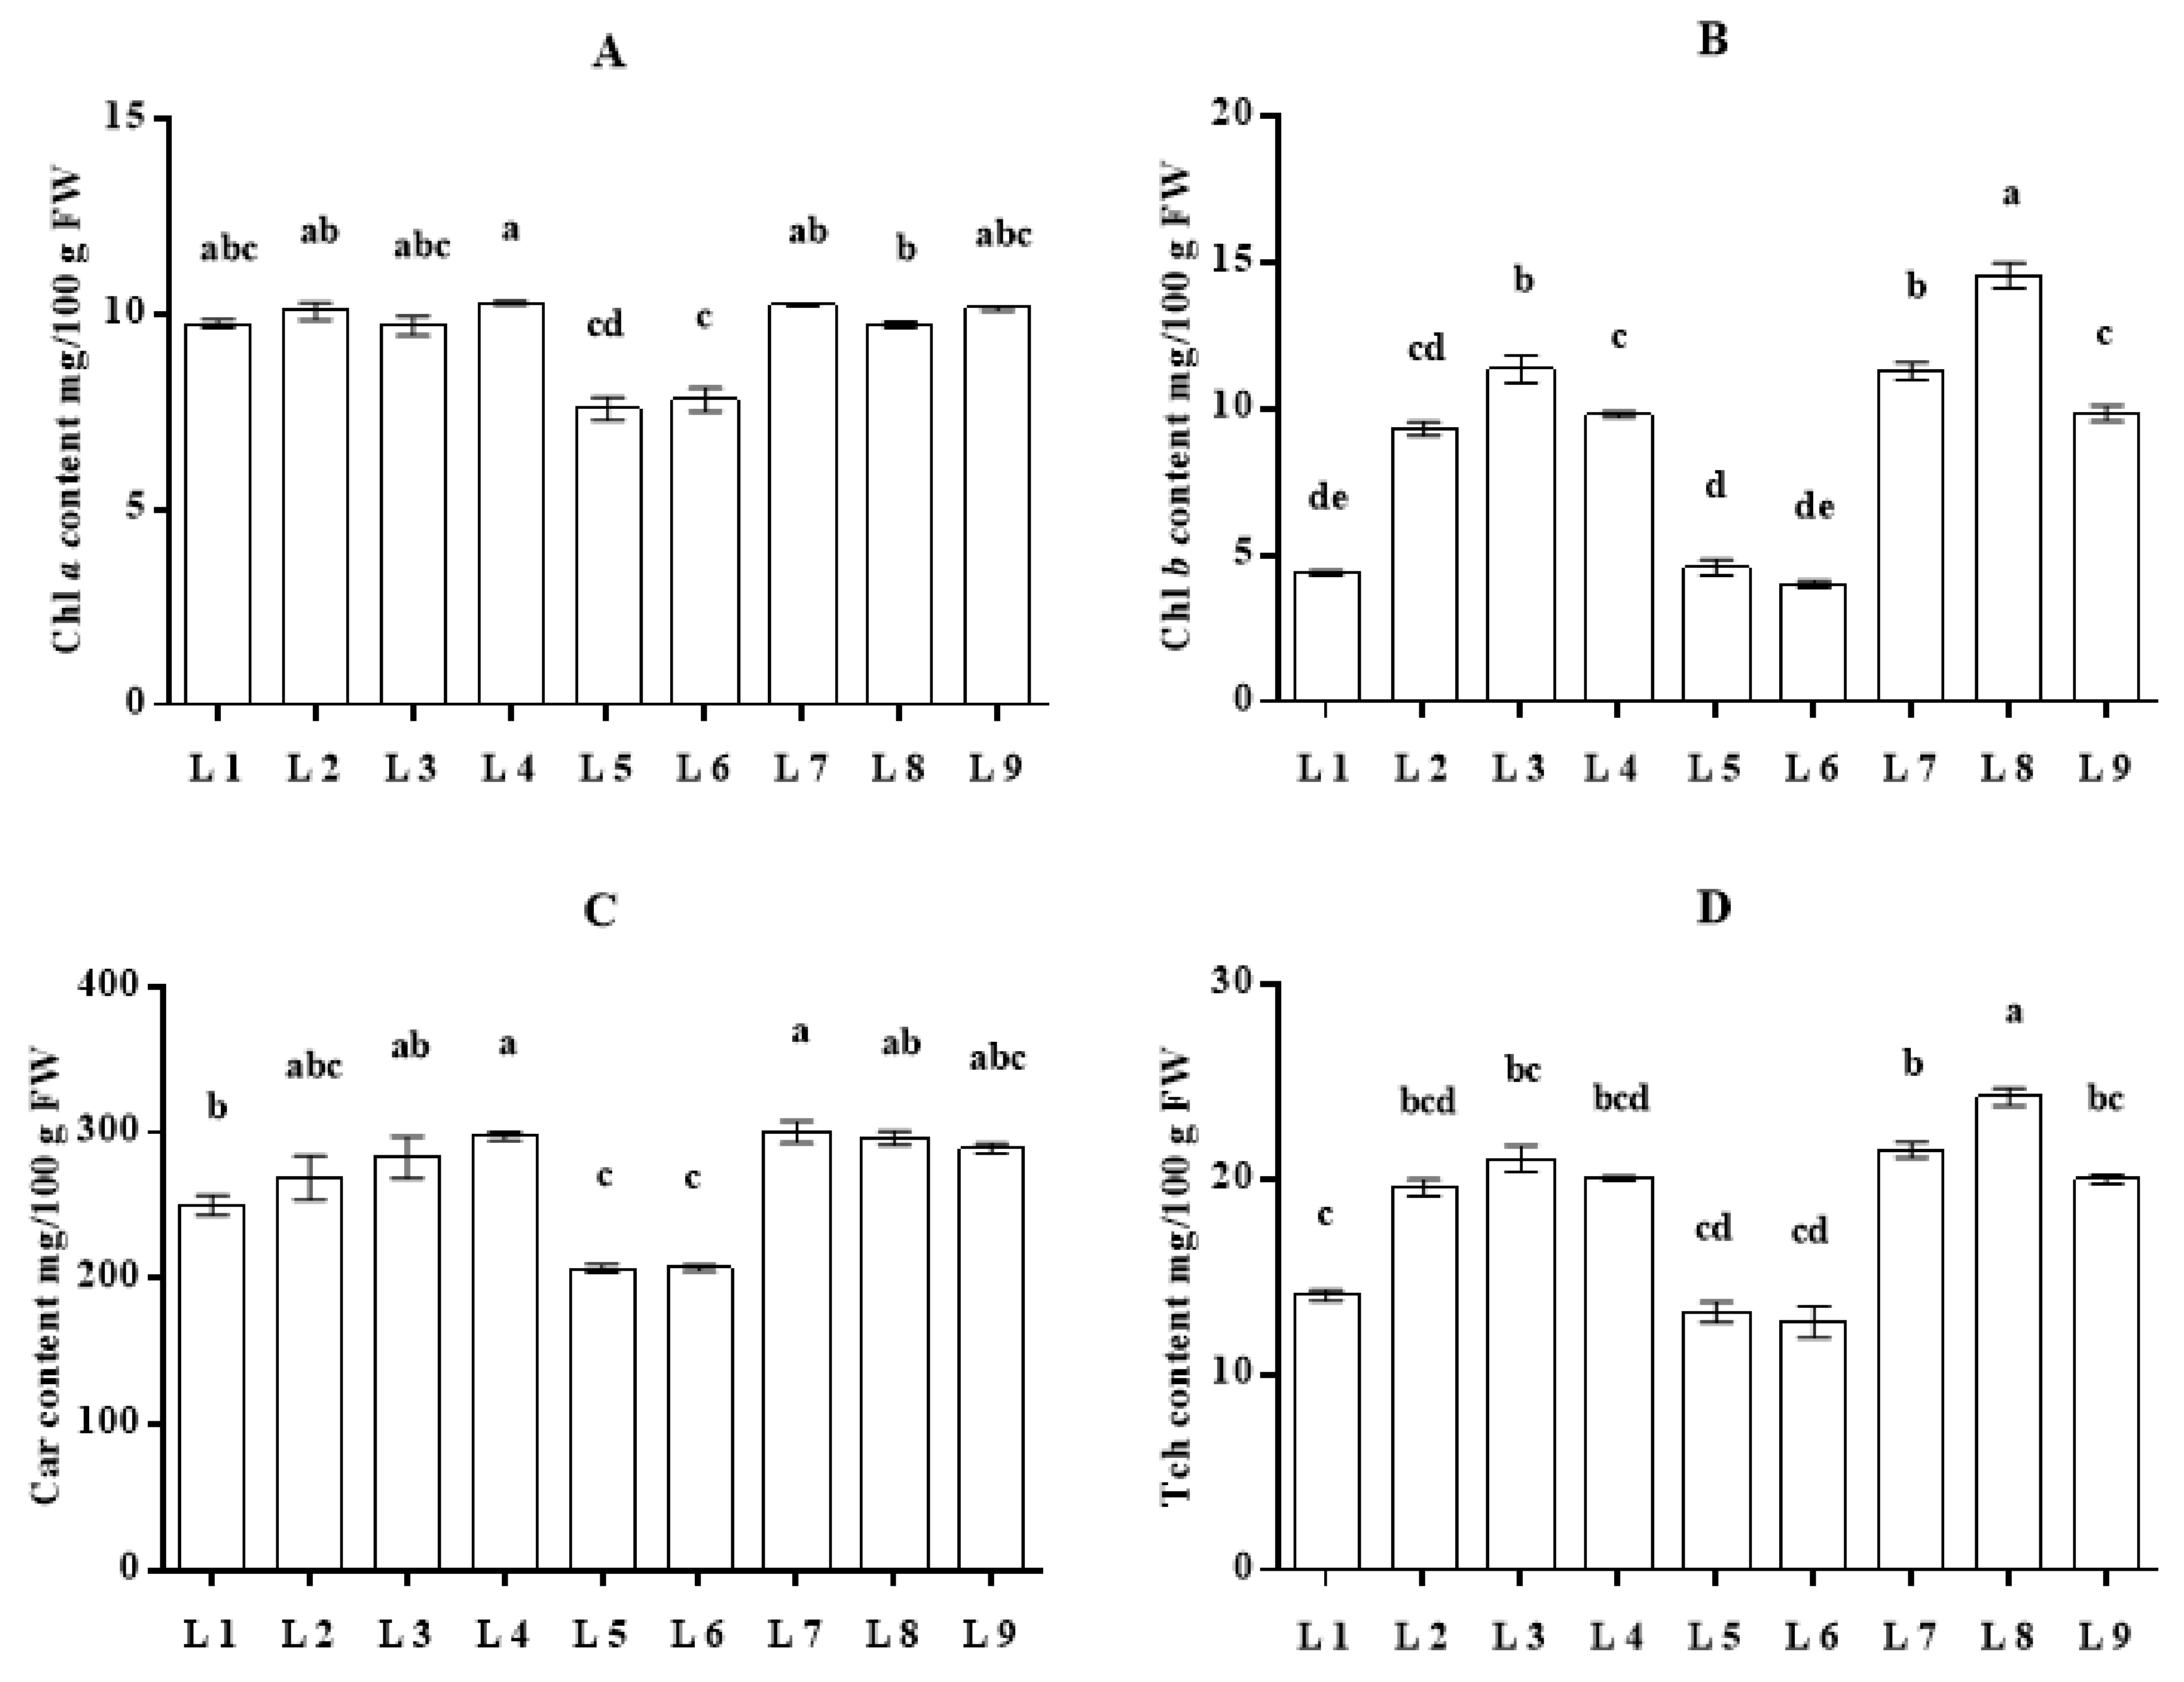
3.3. Effect of LED Light on Photosynthetic Pigments

Figure 4 illustrated the photosynthetic pigments, for instance, Tch, Chl a, Chl b, and carotenoid content of the tuber. Although the level of Chl a did not show any significant difference, higher Chl a and carotenoid were recorded in L4 treatment, whereas Chl b and Tch content increased significantly in L8 treatment. In contrast, L5 and L6 showed minimal results for Chl a, Chl b, carotenoid, and Tch content.

3.4. Effect of LED Light on Total Soluble Carbohydrates (TSC) and Total Soluble Sugar Content (TSS)

The content of TSC and TSS of leaves and tubers is depicted in Figure 5. Each parameter showed a significant decrease in all treatments compared to the control. Among them, the minimum results were recorded in L5 and L6 treatments.

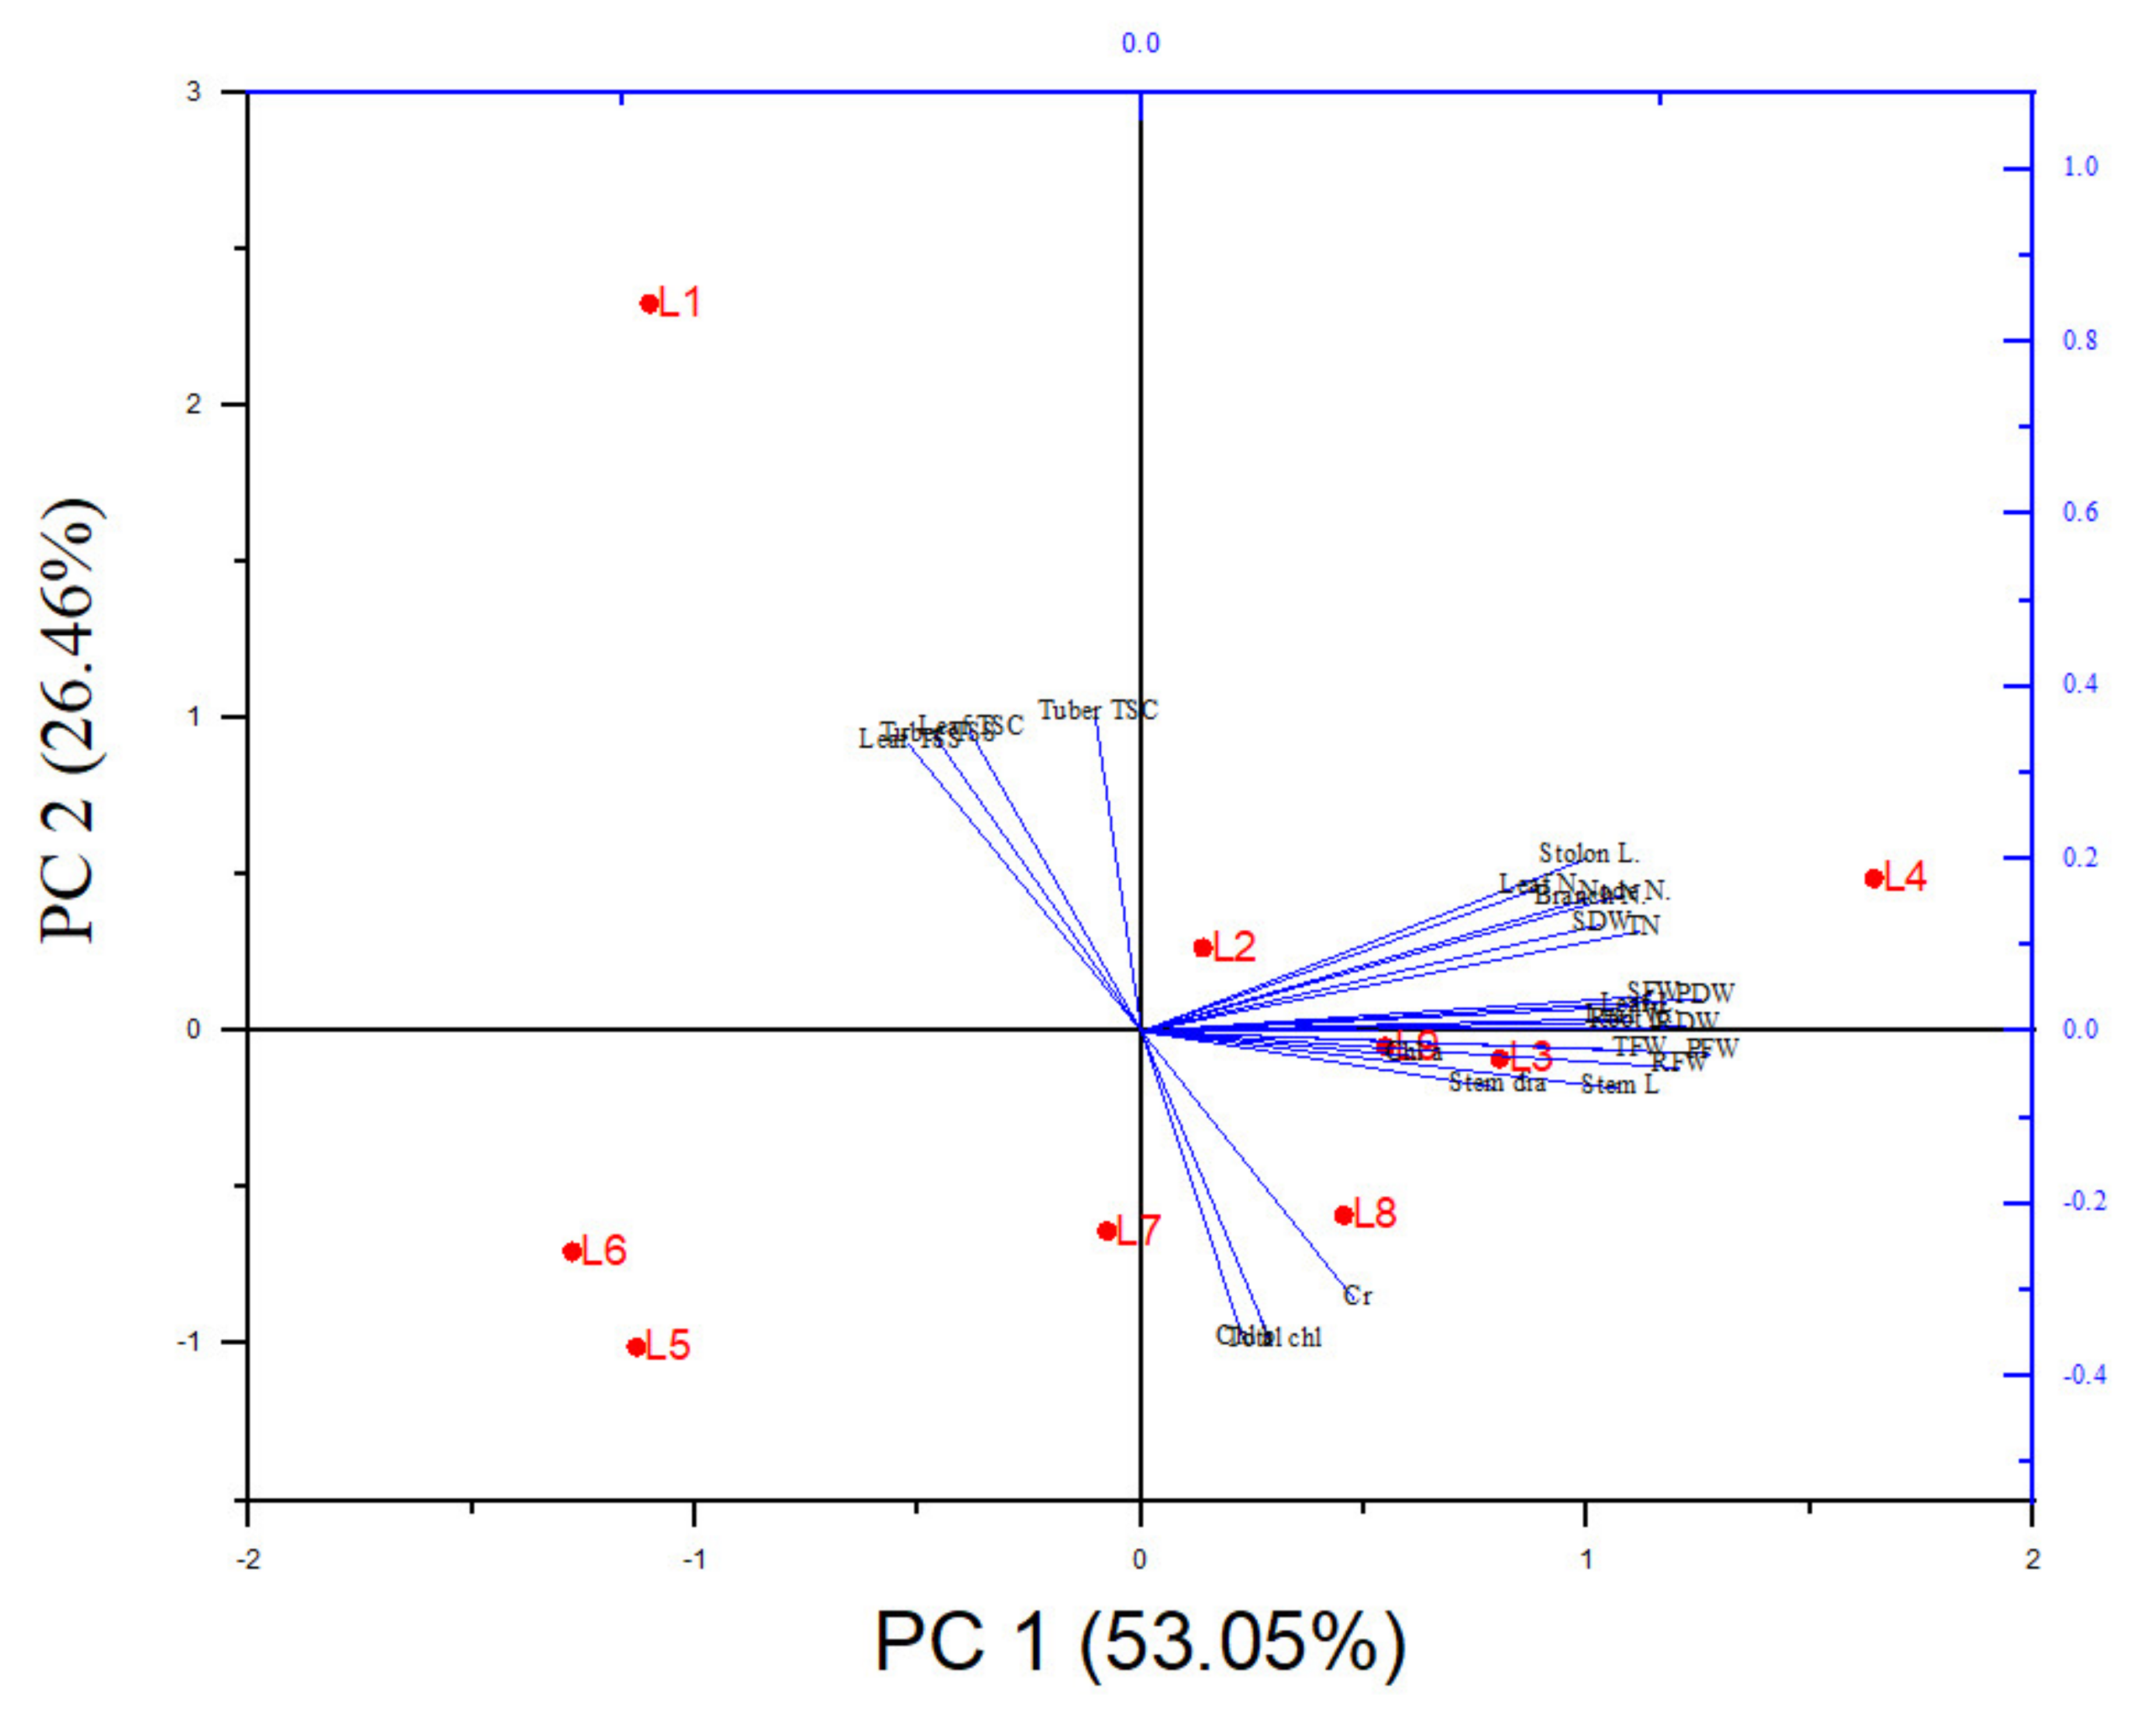
3.5. The PCA Analysis Revealed the Connection between Treatments and Variables

The PCA analysis aimed to determine the relationship between various parameters and treatments (Figure 6). The PCA (PC1 and PC2) elements described 79.51% of data variability. The results showed that the treatments L2, L3 L4, L7, L8, and L9 are associated with most of the variables related to plant growth characteristics, including tuber number and tuber fresh weight; among them, the influence of L4 is the most prominent. In contrast, both L5 and L6 maintained a negative correlation with others. Additionally, the treatment L1 is highly correlated with TSC and sucrose content in both leaf and tuber. Results also showed that the photosynthetic pigments are negatively correlated with TSC and sucrose.

4. Discussion

The various combinations of the artificial LED light spectrum have a major effect on the growth and seed tuber development of potato plants. In our findings, a common pattern was observed, the L4 (red + far-red) light combination has a significant impact on the rapid growth of potato plants (Table 3 and Table 4). The optimal dose of red, blue, and far-red light spectrum for plant growth and development has been the subject of numerous studies. According to previous reports, the optimal red and blue LED light ratio must be specified and varied according to plant species. For instance, the best red–blue LED light combination for cotton, phalaenopsis, banana, and lettuce was observed 50R/50B [32], 80R/20B, 50R/50B [33,34], and 1B/5R, respectively [35]. It was also reported that in vitro potato plantlets grew faster, with larger stem diameter and higher dry weight when exposed to 65 percent red + 35 percent blue light [36]. According to a previous study, potato plantlets grown under monochromatic red light had weak, slender, and small leaves [37]. However, the current study demonstrated potato plants with elongated stems and high biomass when grown under the red +blue+ far-red light spectrum (Table 3 and Table 4).
UV-A impact on biomass can be either positive or negative [38]. According to a comparative analysis, UV-A caused a critical (but not significant) increase in dry weight accumulation in three Arabidopsis thaliana accessions whereas decreases in four others, according to a comparative analysis of eight different accessions [39]. A distinct effect of UV-A on plant biomass was also narrated by a previous study [40]. These findings support our study as UV-included treatments (L6, L7, L8, L9) positively influence biomass production in plants (Table 3 and Table 4). In addition, the leaves become slightly smaller but noticeably thicker under UV-A exposure, emulating the idea of a ’sunleaf‘ [41]. Photosynthetic pigments absorb and convert light energy into chemical energy through complex photosynthetic machinery. This process is stimulated by blue and red light by regulating carotenoid and chlorophyll biosynthesis [7,37]. It was also discovered that red and far-red light regulates photosensors that encourage stem elongation, while blue light has the opposite effect [42,43]. These findings are somewhat close to what we found in our current study.
Furthermore, blue light is responsible for stomatal opening and expands the leaf, whereas the blue and the red light ratio has long been known to trigger stomatal opening [44], whereas blue light is more effective than red [45]. In the pre-treatment of red, blue, and far-red light, plant growth was higher under the L4 treatment in the current study (Table 3 and Table 4).
It appears that neither the red/far-red nor the blue/red ratios, but rather the low blue/far-red ratio, are linked to stomatal movement, [7,43], with a few exceptions—the potato variety V 48 displayed a similar pattern of response to the different light spectrum. In comparison to light treatment, L3 (red, blue, and green) and L9 (red, blue, white, far-red, and UV) treatment played a critical role in broadening potato leaves in our study.
No evidence was found that light affects tuberization [46]; rather, it is controlled by hormonal signals, especially gibberellins (GA) and cytokinins (CK) [47]. A previous study found that red light inhibited the initiation of minitubers, which contradicts the current findings [48]. In the current study, the highest tuber number was obtained in the L4 treatment; however, the total tuber fresh weight was higher in the L9 treatment. This may be due to the smaller tuber size, which increases the number of tubers but reduces their weight. Total fresh weight, on the other hand, was higher in L9 and L8 treatments. In addition, L4 and L7 also had a positive effect on potato fresh weight. Due to the smaller tuber, the total tuber fresh weight was reduced in L6 and L5 (Figure 2). Besides, phytochromes, a red and far-red receptors that exist in two forms (Pr and Pfr) can affect tuberization. Under red light, a conversion of Pr to Pfr occurs, whereas reversion is observed under far-red irradiation [49]. In the present study, lower tuber number and tuber weight in the treatments L5 and L6 might be the effect of red and far-red light that influenced phytochromes, as the involvement of phytochromes in the regulation of potato tuberization was previously hypothesized [50].
The effect of light spectrum on plant growth can be due in part to the regulation of phytohormone levels in plants [51], as light quality affects endogenous hormones in potatoes [52]. It has also been documented that tuber formation is closely linked to gibberellic acid (GA3) and abscisic acid (ABA), where they play the role of inhibition and promotion, respectively [53,54]. GA3 concentrations in grape leaves decreased [55], while ABA concentrations in cucumber hypocotyls increased as a result of red light [56]. In the current research, red light aided tuber development, which could be linked to lower levels of GA3 and higher levels of ABA in the plants.
Overall, the findings showed that the combined spectrum of red, blue, and white had a major impact on stem elongation, which eventually led to tuber formation. Another hormone, indole acetic acid (IAA), is thought to improve plant organ sink ability [57]. Red light has been shown to increase IAA concentration in potatoes, thereby promoting the flow of assimilates into tubers [58]. The rate at which assimilates are assimilated is also an essential factor in tuber size and weight [59]. For plants growing under the combined LED blue and red range, increased assimilation rates are efficiently partitioned into underground tubers. That could explain why the majority of large microtubers were discovered in the red–blue spectrum [16,58,60]. These findings partially support our current study (Figure 2 and Figure 3).
The previous studies reported that photosynthesis pigments such as Tch, Chl a, Chl b, and total carotenoid were significantly increased under the light treatment combined with red, blue, and white when plant pigments receive a specific light spectrum through their light-harvesting antenna, where chlorophyll and carotenoid pigments absorb at wavelengths of 400–500 nm and 630–680 nm, respectively [7,61]. Based on these findings, our study also derived similar results as the light treatment L8 (red+blue+white+far-red) has an increasing trend in Chl b, Tch, and carotenoid content (Figure 4). This is may be due to the characteristics of the photosynthetic antenna of plant pigments that absorb much blue light, which acts as a catalytic agent to accumulate pigments such as Chl and Car in plant leaves [32,62].
The mechanism underlying UV stimulatory effects on plant biomass accumulation was not established in this research. However, several mechanisms have been suggested in the literature, including the enhancement of UV effects on photosynthesis and the activation of photoprotective responses [38]. UV-A (340 nm), for example, can boost photosynthesis rates by up to 10% in Poa annua, Sorghum halepense, and Nerium oleander; similarly stated, UV-A boosts photosynthetic activity by 12% in Pimelea ligustrina [63]. That study relates partly to our findings as Chl a, Chl b, Tch, and Car content showed a positive result in UV-included light treatment (Figure 4). When the red and blue spectrums are mixed, the photosynthetic pigment, such as Car, is substantially increased relative to other spectrum combinations [58].
In the L2 treatment, the overall carbohydrate and sucrose content was significantly higher (Figure 5). Carbohydrates are the plant’s final product of photosynthesis and a significant parameter [61]. The most powerful light source for accumulating soluble carbohydrates was previously stated to be red light [64]. The accumulation of photosynthetic products in plants is promoted by red and blue light; however, combined blue and red light increases these compounds in the plants [65], which supports our study. Blue light irradiation substantially raises the soluble carbohydrate content of Chinese bayberry, including glucose, fructose, and sucrose, a phenomenon that has also been observed in the strawberry fruit [61]. Sucrose synthesis is linked to the aggravating behavior of sucrose-phosphate synthase (SPS) gene expression [66]; according to previous research, blue light plays an important role in increasing soluble carbohydrate and soluble sugar when combined with (red + blue) and (red + blue + far-red).

5. Conclusions

The present study demonstrated that potato plant growth, development, and tuber production are inextricably linked to artificial light pre-treatment when cultivated in the aeroponics culture system. The growth characteristics and tuber number of plants were increased most by the light spectrum L4 (R:B:FR). Furthermore, photosynthetic pigments increased in L4, L7, and L8, while TSC and sucrose accumulated higher in L1 treatment. On the other hand, higher tuber fresh weight was recorded in L8, L9, L4, and L7. Overall, the potato seedlings pre-treated with L4 (R:B:FR) manifested the best results for potato growth, establishment, and seed tuber yield under aeroponic conditions. These findings are preliminary discoveries for producing seed tubers under artificial light, and they serve as a foundation for developing a more artificial LED lighting environment for growing potato seed tuber under artificial light conditions.

Author Contributions

M.H.R. and M.J.I. conceived and designed the experiments, carried out all the experimental works, collected, analyzed the data, and drafted the final manuscript. M.O.K.A., M.S.R. and B.R.R. collected the data, and Y.-S.L. supervised the study. All authors have read and agreed to the published version of the manuscript.

Funding

This research did not receive any specific grant.

Institutional Review Board Statement

Not applicable.

Informed Consent Statement

Not applicable.

Data Availability Statement

Not applicable.

Acknowledgments

This research was supported by the BK21 FOUR funded by the Ministry of Education (MOE, Korea) and the National Research Foundation of Korea (NRF).

Conflicts of Interest

The authors declare no conflict of interest.

References

  1. Halterman, D.; Guenthner, J.; Collinge, S.; Butler, N.; Douches, D. Biotech potatoes in the 21st century: 20 years since the first biotech potato. Am. J. Potato Res. 2016, 93, 1–20. [Google Scholar] [CrossRef] [Green Version]
  2. Islam, J.; Choi, S.P.; Azad, O.K.; Kim, J.W.; Lim, Y.-S. Evaluation of Tuber Yield and Marketable Quality of Newly Developed Thirty-Two Potato Varieties Grown in Three Different Ecological Zones in South Korea. Agriculture 2020, 10, 327. [Google Scholar] [CrossRef]
  3. Rolston, M.P.; Gomez, J.S. Methods for pre-basic seed production of herbage cultivars. N. Z. J. Exp. Agric. 1986, 14, 165–171. [Google Scholar] [CrossRef]
  4. Buckseth, T.; Sharma, A.K.; Pandey, K.K.; Singh, B.P.; Muthuraj, R. Methods of pre-basic seed potato production with special reference to aeroponics—A review. Sci. Hortic. 2016, 204, 79–87. [Google Scholar] [CrossRef]
  5. Navarrete Ortega, J.I. Evaluación de Dos Métodos de Micropropagacion para la Producción de Semilla Categoría Pre Básica de dos Variedades de Papa (Solanum tuberosum) Bajo Condiciones de Invernadero. Ph.D. Thesis, Central University of Ecuador, Quito, Ecuador, 2004. [Google Scholar]
  6. Lommen, W.J.M. The canon of potato science: 27. Hydroponics. Potato Res. 2007, 50, 315. [Google Scholar] [CrossRef] [Green Version]
  7. Rahman, M.H.; Azad, M.O.K.; Islam, M.J.; Rana, M.S.; Li, K.; Lim, Y.S. Production of Potato (Solanum tuberosum L.) Seed Tuber under Artificial LED Light Irradiation in Plant Factory. Plants 2021, 10, 297. [Google Scholar] [CrossRef] [PubMed]
  8. Folta, K.M. Breeding new varieties for controlled environments. Plant Biol. 2019, 21, 6–12. [Google Scholar] [CrossRef]
  9. Islam, M.J.; Hassan, M.K.; Sarker, S.R.; Rahman, A.B.; Fakir, M.S.A. Light and temperature effects on sprout yield and its proximate composition and vitamin C content in lignosus and mung beans. J. Bangladesh Agric. Univ. 2017, 15, 248–254. [Google Scholar] [CrossRef] [Green Version]
  10. Islam, M.J.; Ryu, B.R.; Azad, M.O.; Rahman, M.H.; Cheong, E.J.; Lim, J.-D.; Lim, Y.-S. Cannabinoids Accumulation in Hemp (Cannabis sativa L.) Plants under LED Light Spectra and Their Discrete Role as a Stress Marker. Biology 2021, 10, 710. [Google Scholar] [CrossRef]
  11. Bruce, T.J.A.; Matthes, M.C.; Napier, J.A.; Pickett, J.A. Stressful “memories” of plants: Evidence and possible mechanisms. Plant Sci. 2007, 173, 603–608. [Google Scholar] [CrossRef]
  12. Galis, I.; Gaquerel, E.; Pandey, S.P.; Baldwin, I.T. Molecular mechanisms underlying plant memory in JA-mediated defence responses. Plant Cell Environ. 2009, 32, 617–627. [Google Scholar] [CrossRef]
  13. Ding, Y.; Fromm, M.; Avramova, Z. Multiple exposures to drought’train’transcriptional responses in Arabidopsis. Nat. Commun. 2012, 3, 1–9. [Google Scholar] [CrossRef]
  14. Skirycz, A.; Inzé, D. More from less: Plant growth under limited water. Curr. Opin. Biotechnol. 2010, 21, 197–203. [Google Scholar] [CrossRef]
  15. Terashima, I.; Fujita, T.; Inoue, T.; Chow, W.S.; Oguchi, R. Green light drives leaf photosynthesis more efficiently than red light in strong white light: Revisiting the enigmatic question of why leaves are green. Plant Cell Physiol. 2009, 50, 684–697. [Google Scholar] [CrossRef] [Green Version]
  16. Hanyu, H.; Shoji, K. Acceleration of growth in spinach by short-term exposure to red and blue light at the beginning and at the end of the daily dark period. In Proceedings of the IV International ISHS Symposium on Artificial Lighting, Quebec, QC, Canada, 7–9 November 2000; Volume 580, pp. 145–150. [Google Scholar]
  17. Smith, H. Light quality, photoperception, and plant strategy. Annu. Rev. Plant Physiol. 1982, 33, 481–518. [Google Scholar] [CrossRef]
  18. Kopsell, D.A.; Lefsrud, M.G.; Kopsell, D.E.; Curran-Celentano, J. Irradiance Levels Affect Growth Parameters and Carotenoid Pigments in Kale and Spinach Grown in a Controlled Environment. Physiol. Plant. 2006, 127, 624–631. [Google Scholar]
  19. Azad, M.O.K.; Kjaer, K.H.; Adnan, M.; Naznin, M.T.; Lim, J.D.; Sung, I.J.; Park, C.H.; Lim, Y.S. The Evaluation of Growth Performance, Photosynthetic Capacity, and Primary and Secondary Metabolite Content of Leaf Lettuce Grown under Limited Irradiation of Blue and Red LED Light in an Urban Plant Factory. Agriculture 2020, 10, 28. [Google Scholar] [CrossRef] [Green Version]
  20. Kim, S.-J.; Hahn, E.-J.; Heo, J.-W.; Paek, K.-Y. Effects of LEDs on net photosynthetic rate, growth and leaf stomata of chrysanthemum plantlets in vitro. Sci. Hortic. 2004, 101, 143–151. [Google Scholar] [CrossRef]
  21. Zhang, T.; Maruhnich, S.A.; Folta, K.M. Green light induces shade avoidance symptoms. Plant Physiol. 2011, 157, 1528–1536. [Google Scholar] [CrossRef] [Green Version]
  22. Casal, J.J. Photoreceptor signaling networks in plant responses to shade. Annu. Rev. Plant Biol. 2013, 64, 403–427. [Google Scholar] [CrossRef]
  23. Gao, C.; El-Sawah, A.M.; Ali, D.F.I.; Hamoud, Y.A.; Shaghaleh, H.; Sheteiwy, M.S. The integration of bio and organic fertilizers improve plant growth, grain yield, quality and metabolism of hybrid maize (Zea mays L.). Agronomy 2020, 10, 319. [Google Scholar] [CrossRef] [Green Version]
  24. Siyami, R.; Mirshekari, B.; Farahvash, F.; Rashidi, V.; Tarinejad, A. The effect of physical priming of seed on traits and yield of corn (Zea mays L.) under water deficit conditions in Iran. Appl. Ecol. Environ. Res. 2018, 16, 617–627. [Google Scholar] [CrossRef]
  25. Khan, A.; Khalil, S.K.; Khan, A.Z.; Marwat, K.B.; Afzal, A. The role of seed priming in semi-arid area for mung bean phenology and yield. Pakistan J. Bot. 2008, 40, 2471–2480. [Google Scholar]
  26. Hu, L.; Yu, J.; Liao, W.; Zhang, G.; Xie, J.; Lv, J.; Xiao, X.; Yang, B.; Zhou, R.; Bu, R. Moderate ammonium: Nitrate alleviates low light intensity stress in mini Chinese cabbage seedling by regulating root architecture and photosynthesis. Sci. Hortic. 2015, 186, 143–153. [Google Scholar] [CrossRef]
  27. Gao, J.; Shi, J.; Dong, S.; Liu, P.; Zhao, B.; Zhang, J. Grain yield and root characteristics of summer maize (Zea mays L.) under shade stress conditions. J. Agron. Crop Sci. 2017, 203, 562–573. [Google Scholar] [CrossRef]
  28. Silva, T.D.; Batista, D.S.; Fortini, E.A.; de Castro, K.M.; Felipe, S.H.S.; Fernandes, A.M.; de Jesus Sousa, R.M.; Chagas, K.; da Silva, J.V.S.; de Freitas Correia, L.N. Blue and red light affects morphogenesis and 20-hydroxyecdisone content of in vitro Pfaffia glomerata accessions. J. Photochem. Photobiol. B Biol. 2020, 203, 111761. [Google Scholar] [CrossRef]
  29. Islam, M.J.; Ryu, B.R.; Azad, M.O.K.; Rahman, M.H.; Rana, M.S.; Kang, C.-W.; Lim, J.-D.; Lim, Y.-S. Comparative Growth, Photosynthetic Pigments, and Osmolytes Analysis of Hemp (Cannabis sativa L.) Seedlings under an Aeroponics System with Different LED Light Sources. Horticulturae 2021, 7, 239. [Google Scholar] [CrossRef]
  30. Lichtenthaler, H.K. [34] Chlorophylls and carotenoids: Pigments of photosynthetic biomembranes. Methods Enzymol. 1987, 148, 350–382. [Google Scholar]
  31. Islam, M.J.; Kim, J.W.; Begum, M.K.; Sohel, M.A.T.; Lim, Y.-S. Physiological and Biochemical Changes in Sugar Beet Seedlings to Confer Stress Adaptability under Drought Condition. Plants 2020, 9, 1511. [Google Scholar] [CrossRef] [PubMed]
  32. Li, H.; Xu, Z.; Tang, C. Effect of light-emitting diodes on growth and morphogenesis of upland cotton (Gossypium hirsutum L.) plantlets in vitro. Plant Cell Tissue Organ Cult. 2010, 103, 155–163. [Google Scholar] [CrossRef]
  33. Nhut, D.T.; Don, N.T.; Tanaka, M. Light-emitting diodes as an effective lighting source for in vitro banana culture. In Protocols for Micropropagation of Woody Trees and Fruits; Springer: Berlin, Germany, 2007; pp. 527–541. [Google Scholar]
  34. Li, H.; Tang, C.; Xu, Z. The effects of different light qualities on rapeseed (Brassica napus L.) plantlet growth and morphogenesis in vitro. Sci. Hortic. 2013, 150, 117–124. [Google Scholar] [CrossRef]
  35. Han, T.; Vaganov, V.; Cao, S.; Li, Q.; Ling, L.; Cheng, X.; Peng, L.; Zhang, C.; Yakovlev, A.N.; Zhong, Y. Improving “color rendering” of LED lighting for the growth of lettuce. Sci. Rep. 2017, 7, 45944. [Google Scholar] [CrossRef]
  36. Chen, L.; Zhang, K.; Gong, X.; Wang, H.; Gao, Y.; Wang, X.; Zeng, Z.; Hu, Y. Effects of different LEDs light spectrum on the growth, leaf anatomy, and chloroplast ultrastructure of potato plantlets in vitro and minituber production after transplanting in the greenhouse. J. Integr. Agric. 2020, 19, 108–119. [Google Scholar] [CrossRef]
  37. Fan, X.; Zang, J.; Xu, Z.; Guo, S.; Jiao, X.; Liu, X.; Gao, Y. Effects of different light quality on growth, chlorophyll concentration and chlorophyll biosynthesis precursors of non-heading Chinese cabbage (Brassica campestris L.). Acta Physiol. Plant. 2013, 35, 2721–2726. [Google Scholar] [CrossRef]
  38. Verdaguer, D.; Jansen, M.A.K.; Llorens, L.; Morales, L.O.; Neugart, S. UV-A radiation effects on higher plants: Exploring the known unknown. Plant Sci. 2017, 255, 72–81. [Google Scholar] [CrossRef]
  39. Cooley, N.M.; Higgins, J.T.; Holmes, M.G.; Attridge, T.H. Ecotypic differences in responses of Arabidopsis thaliana L. to elevated polychromatic UV-A and UV-B+ A radiation in the natural environment: A positive correlation between UV-B+ A inhibition and growth rate. J. Photochem. Photobiol. B Biol. 2001, 60, 143–150. [Google Scholar] [CrossRef]
  40. Qian, M.; Rosenqvist, E.; Flygare, A.-M.; Kalbina, I.; Teng, Y.; Jansen, M.A.K.; Strid, Å. UV-A light induces a robust and dwarfed phenotype in cucumber plants (Cucumis sativus L.) without affecting fruit yield. Sci. Hortic. 2020, 263, 109110. [Google Scholar] [CrossRef]
  41. Rodríguez-Calcerrada, J.; Pardos, J.A.; Gil, L.; Reich, P.B.; Aranda, I. Light response in seedlings of a temperate (Quercus petraea) and a sub-Mediterranean species (Quercus pyrenaica): Contrasting ecological strategies as potential keys to regeneration performance in mixed marginal populations. Plant Ecol. 2008, 195, 273–285. [Google Scholar] [CrossRef]
  42. Folta, K.M.; Childers, K.S. Light as a growth regulator: Controlling plant biology with narrow-bandwidth solid-state lighting systems. HortScience 2008, 43, 1957–1964. [Google Scholar] [CrossRef] [Green Version]
  43. Monostori, I.; Heilmann, M.; Kocsy, G.; Rakszegi, M.; Ahres, M.; Altenbach, S.B.; Szalai, G.; Pál, M.; Toldi, D.; Simon-Sarkadi, L. LED lighting–modification of growth, metabolism, yield and flour composition in wheat by spectral quality and intensity. Front. Plant Sci. 2018, 9, 605. [Google Scholar] [CrossRef]
  44. Assmann, S.M. Signal transduction in guard cells. Annu. Rev. Cell Biol. 1993, 9, 345–375. [Google Scholar] [CrossRef] [PubMed]
  45. Kim, H.-H.; Goins, G.D.; Wheeler, R.M.; Sager, J.C. Stomatal conductance of lettuce grown under or exposed to different light qualities. Ann. Bot. 2004, 94, 691–697. [Google Scholar] [CrossRef] [PubMed] [Green Version]
  46. Seabrook, J.E.A. Light effects on the growth and morphogenesis of potato (Solanum tuberosum) in vitro: A review. Am. J. Potato Res. 2005, 82, 353–367. [Google Scholar] [CrossRef]
  47. Eviatar-Ribak, T.; Shalit-Kaneh, A.; Chappell-Maor, L.; Amsellem, Z.; Eshed, Y.; Lifschitz, E. A cytokinin-activating enzyme promotes tuber formation in tomato. Curr. Biol. 2013, 23, 1057–1064. [Google Scholar] [CrossRef] [Green Version]
  48. Aksenova, N.P.; Konstantinova, T.N.; Chailakhian, M.K. Morphogenetic effect of blue and red-light under illumination of the overground and underground potato plant organs in vitro. Dokl. Akad. Nauk SSSR 1989, 305, 508–512. [Google Scholar]
  49. Legris, M.; Ince, Y.Ç.; Fankhauser, C. Molecular mechanisms underlying phytochrome-controlled morphogenesis in plants. Nat. Commun. 2019, 10, 1–15. [Google Scholar] [CrossRef] [Green Version]
  50. Batutis, E.J.; Ewing, E.E. Far-red reversal of red light effect during long-night induction of potato (Solanum tuberosum L.) tuberization. Plant Physiol. 1982, 69, 672–674. [Google Scholar] [CrossRef] [Green Version]
  51. Kaufman, L.S. Transduction of blue-light signals. Plant Physiol. 1993, 102, 333. [Google Scholar] [CrossRef] [PubMed]
  52. Fixen, K.R.; Thomas, S.C.; Tong, C.B.S. Blue light inhibition of tuberization in a day-neutral potato. J. Plant Growth Regul. 2012, 31, 342–350. [Google Scholar] [CrossRef]
  53. Roumeliotis, E.; Visser, R.G.F.; Bachem, C.W.B. A crosstalk of auxin and GA during tuber development. Plant Signal. Behav. 2012, 7, 1360–1363. [Google Scholar] [CrossRef] [Green Version]
  54. Lovell, P.H.; Booth, A. Effects of gibberellic acid on growth, tuber formation and carbohydrate distribution in Solanum tuberosum. New Phytol. 1967, 66, 525–537. [Google Scholar] [CrossRef]
  55. Wang, H.B.; Wang, S.; Wang, X.D.; Shi, X.B.; Wang, B.L.; Zheng, X.C.; Wang, Z.Q.; Liu, F.Z. Effects of light quality on leaf senescence and endogenous hormones content in grapevine under protected cultivation. Chin. J. Appl. Ecol. 2017, 28, 3535. [Google Scholar]
  56. Su, N.; Wu, Q.; Cui, J. Effects of monochromatic LED light quality on endogenous hormone content in leaves and hypocotyl of Cucumis sativus L. Chin. J. Appl. Environ. Biol. 2014, 20, 45–49. [Google Scholar]
  57. Kara, A.N.; Kotov, A.A.; Bukhov, N.G. Specific distribution of gibberellins, cytokinins, indole-3-acetic acid, and abscisic acid in radish plants closely correlates with photomorphogenetic responses to blue or red light. J. Plant Physiol. 1997, 151, 51–59. [Google Scholar] [CrossRef]
  58. Hu, Y. Effects of red and blue LEDs on in vitro growth and microtuberization of potato single-node cuttings. Front. Agr. Sci. Eng. 2018, 5, 197–205. [Google Scholar]
  59. Asghari-Zakaria, R.; Maleki-Zanjani, B.; Sedghi, E. Effect of in vitro chitosan application on growth and minituber yield of Solanum tuberosum L. Plant Soil Env. 2009, 55, 252–256. [Google Scholar] [CrossRef] [Green Version]
  60. Upadhyaya, C.P.; Pundir, R.K.; Pathak, A.; Joshi, N.; Bagri, D.S. Irradiation Studies of LED Light Spectra on the Growth and Development of Potato (Solanum tuberosum L.). Plant Sci. Today 2020, 7, 406–416. [Google Scholar] [CrossRef]
  61. Lin, K.-H.; Huang, M.-Y.; Huang, W.-D.; Hsu, M.-H.; Yang, Z.-W.; Yang, C.-M. The effects of red, blue, and white light-emitting diodes on the growth, development, and edible quality of hydroponically grown lettuce (Lactuca sativa L. var. capitata). Sci. Hortic. 2013, 150, 86–91. [Google Scholar] [CrossRef]
  62. Hogewoning, S.W.; Trouwborst, G.; Maljaars, H.; Poorter, H.; van Ieperen, W.; Harbinson, J. Blue light dose–responses of leaf photosynthesis, morphology, and chemical composition of Cucumis sativus grown under different combinations of red and blue light. J. Exp. Bot. 2010, 61, 3107–3117. [Google Scholar] [CrossRef]
  63. Turnbull, T.L.; Barlow, A.M.; Adams, M.A. Photosynthetic benefits of ultraviolet-A to Pimelea ligustrina, a woody shrub of sub-alpine Australia. Oecologia 2013, 173, 375–385. [Google Scholar] [CrossRef] [PubMed]
  64. Li, H.; Tang, C.; Xu, Z.; Liu, X.; Han, X. Effects of different light sources on the growth of non-heading Chinese cabbage (Brassica campestris L.). J. Agric. Sci. 2012, 4, 262. [Google Scholar] [CrossRef] [Green Version]
  65. Xu, F.; Cao, S.; Shi, L.; Chen, W.; Su, X.; Yang, Z. Blue light irradiation affects anthocyanin content and enzyme activities involved in postharvest strawberry fruit. J. Agric. Food Chem. 2014, 62, 4778–4783. [Google Scholar] [CrossRef] [PubMed]
  66. Do Nascimento, J.R.O.; Cordenunsi, B.R.; Lajolo, F.M.; Alcocer, M.J.C. Banana sucrose-phosphate synthase gene expression during fruit ripening. Planta 1997, 203, 283–288. [Google Scholar] [CrossRef] [PubMed]
Figure 1. Potato virus Y (PVY) testing of the seedlings.
Agronomy 11 01627 g001
Figure 2. Effect of different LED light on tuber number (A) and tuber fresh weight (B) of potato plants grown under aeroponic system. Different letters indicate significant differences (p ≤ 0.05) among the treatments within each parameter. Each value represents the mean ± SD (n = 3). L1 = natural light, L2 = R:B, L3 = R:B:G, L4 = R:B:FR, L5 = R:B:G:FR, L6= R:B:G:FR:UV, L7 = R:B:FR:UV, L8 = R:B:W:FR, L9 = R:B:W:FR:UV.
Agronomy 11 01627 g002
Figure 3. Effect of different LED light pre-treatment on potato tuber grading in the aeroponic system. Different letters indicate significant differences (p ≤ 0.05) among the treatments within each parameter. Each value represents the mean ± SD (n = 3). L1 = natural light, L2 = R:B, L3 = R:B:G, L4 = R:B:FR, L5 = R:B:G:FR, L6= R:B:G:FR:UV, L7 = R:B:FR:UV, L8 = R:B:W:FR, L9 = R:B:W:FR:UV.
Agronomy 11 01627 g003
Figure 4. Effect of different LED light on Chlorophyll a (A), Chl a; Chlorophyll b (B), Chl b; Carotenoid (C), Car, and Total chlorophyll (D), Tch of potato plants grown under aeroponic system. Different letters indicate significant differences (p ≤ 0.05) among the treatments within each parameter. Each value represents the mean ± SD (n = 3). L1 = natural light, L2 = R:B, L3 = R:B:G, L4 = R:B:FR, L5 = R:B:G:FR, L6= R:B:G:FR:UV, L7 = R:B:FR:UV, L8 = R:B:W:FR, L9 = R:B:W:FR:UV.
Agronomy 11 01627 g004
Figure 5. Effect of LED light on TSC of leaf (A), TSC of tuber (B), TSS of leaf (C), and TSS of tuber (D) grown under aeroponic system. Different letters indicate significant differences (p ≤ 0.05) among the treatments within each parameter. Each value represents the mean ± SD (n = 3). L1 = natural light, L2 = R:B, L3 = R:B:G, L4 = R:B:FR, L5 = R:B:G:FR, L6 = R:B:G:FR:UV, L7 = R:B:FR:UV, L8 = R:B:W:FR, L9 = R:B:W:FR:UV.
Agronomy 11 01627 g005
Figure 6. Principal component analysis (PCA) representing patterns and associations between treatments. The lines starting from the central point of the biplots present negative or positive correlations of various light pre-treatment of potato seed tuber seed production in an aeroponic system in PCA, and their proximity determines the degree of correlation with a particular procedure. L1 (natural light), L2 (R:B), L3 (R:B:G), L4 (R:B:FR), L5 (R:B:G:FR), L6 (R:B:G:FR:UV), L7 (R:B:FR:UV), L8 (R:B:W:FR), L9 (R:B:W:FR:UV). Stem L, (stem length); Stem dia, (stem diameter); PFW, (plant fresh weight); Branch N, (branch number); PDW, (plant dry weight); leaf N, (leaf number); Node N, (node number); Leaf L, (leaf length); Leaf W, (leaf width); Root L, (root length); RFW, (root fresh weight); RDW, (root dry weight); Stolon L, (stolon length)., SFW, (stolon fresh weight); SDW, (stolon dry weight); Chl a, (chlorophyll a); Chl b, (chlorophyll b); Tch, (total chlorophyll); Car, (carotenoid); Leaf TSC, (leaf total soluble carbohydrate); Tuber TSC, (tuber total soluble carbohydrate); Leaf TSS, (leaf total soluble sugar); Tuber TSS, (tuber total soluble sugar); Tuber N, (tuber number); TFW, (tuber fresh weight); >3 g, (more than 3 g); <3 g, (less than 3 g); >5 g, (more than 5 g).
Agronomy 11 01627 g006
Table 1. Light spectrum ratios for potato production in the aeroponic system.
Spectrum CombinationsRatio (%)Intensity
(µmol m−2 s−1)
Code Name
Natural Light * L1
R:B80:20 **300L2
R:B:G70:20:10L3
R:B:FR70:20:10L4
R:B:G:FR60:20:10:10L5
R:B:G:FR:UV50:20:10:10:10L6
R:B:FR:UV60:20:10:10 L7
R:B:W:FR:50:20:20:10L8
R:B:W:FR:UV40:20:20:10:10L9
* W, white; R, red (660 nm); B, blue (450 nm); FR; far-red (730 nm); G, green (520 nm); UVA, ultraviolet A (340 nm). ** The PG200N handheld spectral PAR meter (UPRtek, 165 Vogt 21, Aachen 52072, Germany) was used to set the light ratio and intensity.
Table 2. Nutrient solution.
Chemical NameVegetative Growth Period
(Transplantation to 40th Day)
Tuber Bulking Period
(41th Days to Harvesting Day)
A Tank (50 L)B Tank (50 L)A Tank (50 L)B Tank (50 L)
Ca(NO3)2. 4H2O1.5 kg 7.66 kg
KNO33.79 kg3.79 kg3.54 kg3.54 kg
(NH4)2HPO4 1.6 kg 1.52 kg
MgSO4 4.3 kg 3.68 kg
K2SO4 1.3 kg
Fe-EDTA460 g 460 g30.8 g
MnSO4 30.8g
H3BO3 57.2 g 57.2 g
ZnSO4 3.6 g 3.6 g
CuSO4 1.3 g 1.3 g
(NH4)6Mo7O24.4H2O 0.4 g 0.4 g
Solution of Tank A and Tank B were subjected to mixing to maintain an EC range of 1.2–1.7 (dS m−2), pH 6.0.
Table 3. Effect of LED lights on morphological traits of potato plants (aerial part) in the aeroponic system.
TreatmentsStem Length (cm)Stem Diameter
(mm)
PFW (g)PDW (g)Branch NumberNode NumberLeaf NumberLeaf Length (cm)Leaf Width (cm)
L132 ± 3.26 d4.5 ± 0.43 cd13.1 ± 3.08 d1.36 ± 0.37 cde4 ± 0.81 b21 ± 2.44 bc24.61 ± 3.29 b15 ± 1.63 cd10.3 ± 1.12 d
L237.66 ± 4.18 cd6.75 ± 0.95 a38.93 ± 4.5 bc2.8 ± 0.43 b3 ± 0.82 bcd19 ± 2.94 bcd17.21 ± 1.69 de19 ± 1.41 ab12.6 ± 1.2 bc
L346.33 ± 3.09 b7.02 ± 0.43 a51.33 ± 11.08 b3.6 ± 1.08 ab4.33 ± 0.47 b24.33 ± 4.78 b23.3 ± 4.18 bc22 ± 0.81 a15.5 ± 0.4 a
L456.67 ± 7.4 a5.33 ± 0.24 bc67 ± 14.44 a4.4 ± 1.55 a7.33 ± 0.94 a36.33 ± 2.49 a46 ± 3.25 a19 ± 0.8 ab13.16 ± 0.62 bc
L532 ± 4.32 d5.34 ± 0.38 bc16.46 ± 4.92 d0.96 ± 0.33 de2.33 ± 0.47 cd14.32 ± 1.69 e14.66 ± 3.08 e13.3 ± 2.86 d9.66 ± 1.19 de
L640.37 ± 2.49 bc4 ± 0.21 d12.86 ± 1.92 d0.56 ± 0.04 e1.66 ± 0.47 d14.23 ± 1.66 e14.61 ± 2.62 e12.66 ± 0.47 d8 ± 0.81 e
L746.33 ± 3.68 b5.06 ± 0.73 c37.33 ± 4.98 c2.26 ± 0.44 bcd2.33 ± 0.41 cd16 ± 3.26 cde19.32 ± 2.49 cde17 ± 0.82 bc11.6 ± 1.24 cd
L844 ± 2.94 bc6.61 ± 0.35 a46.66 ± 3.39 bc3.1 ± 0.37 ab3.66 ± 0.33 bc21.23 ± 2.49 bc19 ± 0.81 cde19 ± 1.4 ab13.83 ± 0.62 abc
L942 ± 2.44 bc6.21 ± 0.36 ab45.33 ± 6.54 bc2.7 ± 0.32 bc6 ± 0.83 a23.31 ± 3.09 b19.66 ± 1.24 cde19.6 ± 1.22 ab14.33 ± 1.21 ab
LSD(0.05)8.570.9813.231.351.495.965.183.152.24
Different letters indicate significant differences (p ≤ 0.05) among the treatments within each parameter. Each value represents the mean ± SD (n = 3). L1 = natural light, L2 = R:B, L3 = R:B:G, L4 = R:B:FR, L5 = R:B:G:FR, L6= R:B:G:FR:UV, L7 = R:B:FR:UV, L8 = R:B:W:FR, L9 = R:B:W:FR:UV.
Table 4. Effect of LED lights on morphological traits of potato plants (root and stolon) in the aeroponic system.
TreatmentsRoot Length (cm)RFW (g)RDW (g)Stolon Length (cm)SFW (g)SDW (g)
L126.66 ± 2.49 cd3.04 ± 1.16 e0.2 ± 0.04 cd34.66 ± 4.49 bc2.1 ± 0.35 d0.1 ± 0.01 de
L228.33 ± 2.35 bcd5.16 ± 0.89 bcde0.37 ± 0.05 bcd38 ± 4.32 ab2.7 ± 0.5 bcd0.17 ± 0.03 bc
L334 ± 2.16 ab6.8 ± 1.29 abcd0.54 ± 0.14 ab34.32 ± 2.62 bc2.93 ± 0.61 bcd0.21 ± 0.05 ab
L437.21 ± 6.54 a10.1 ± 3.47 a0.62 ± 0.29 a43.61 ± 7.58 a4.7 ± 0.86 a0.24 ± 0.04 a
L523.61 ± 3.39 d3.5 ± 1.44 cde0.13 ± 0.06 d24 ± 5.09 d2.2 ± 0.68 cd0.05 ± 0.01 ef
L630 ± 1.63 bcd3.3 ± 1.52 de0.12 ± 0.08 cd27 ± 3.55 cd1.03 ± 0.49 e0.02 ± 0.01 f
L729 ± 2.16 bcd7.1 ± 1.75 abc0.29 ± 0.11 cd29.3 ± 4.18 bcd3.2 ± 0.48 bc0.05 ± 0.02 ef
L832 ± 1.63 abc7 ± 1.43 abc0.54 ± 0.05 ab35.66 ± 3.29 abc2.76 ± 0.4 bcd0.13 ± 0.02 cd
L935 ± 4.08 ab8.33 ± 1.58 ab0.42 ± 0.06 abc33.12 ± 1.24 bc3.33 ± 0.75 b0.07 ± 0.01 def
LSD(0.05)7.023.60.248.971.030.06
Different letters indicate significant differences (p ≤ 0.05) among the treatments within each parameter. Each value represents the mean ± SD (n = 3). L1 = natural light, L2 = R:B, L3 = R:B:G, L4 = R:B:FR, L5 = R:B:G:FR, L6= R:B:G:FR:UV, L7 = R:B:FR:UV, L8 = R:B:W:FR, L9 = R:B:W:FR:UV.
Publisher’s Note: MDPI stays neutral with regard to jurisdictional claims in published maps and institutional affiliations.

