Article

Prediction of Olive Tree Water Requirements under Limited Soil Water Availability, Based on Sap Flow Estimations

Department of Business Administration of Food and Agricultural Enterprises, University of Patras, 30100 Agrinio, Greece
*
Author to whom correspondence should be addressed.
Agronomy 2021, 11(7), 1318; https://doi.org/10.3390/agronomy11071318
Submission received: 3 June 2021 / Revised: 21 June 2021 / Accepted: 26 June 2021 / Published: 28 June 2021
(This article belongs to the Special Issue Water Stress in Mediterranean and Subtropical Fruit Trees)

Abstract

:
The forecast of irrigation requirements in commercial olive orchards in the era of climate change is at the forefront of scientific research. Simplified models that are based on monitoring soil and plant water status, along with microclimatic variables are well established. In the present study, an attempt was made to correlate the olive tree sap fluxes and the theoretical grass water losses, as expressed by reference evapotranspiration (ETo) in mild to moderate water-stress conditions. The water flow in the soil–plant–air continuum was monitored using soil water and thermal dissipation probes (TDP), which have a comparatively low cost and satisfactory reliability, while microclimatic variability was monitored by a meteorological station placed within the experimental orchard. The assessment of water stress was conducted via a stress coefficient (Ks), which was determined according to soil water availability, and validated with measurements of pre-dawn water potential and stomatal conductance. The results suggest the existence of an exponential correlation (R2 = 0.869) between daily plant transpirational losses and reference evapotranspiration, while the methodology’s applicability is verified by the validation process (R2 = 0.804 and RMSE = 0.579 L per day).

1. Introduction

More than 90% of the olive (Olea europaea L.) cultivation area worldwide is located in the Mediterranean basin [1], a region where water scarcity due to climatic conditions is common, especially during the summer [2]. On the other hand, drought comprises the main limiting factor in agriculture [3,4] with a serious impact on yield and quality [5], due to the anticipated reduction in transpirational and photosynthetic rates [6] at plant level. Thus, the use of methodologies that easily adapt to various field conditions and result in optimization of irrigation management is considered very important.
Research already conducted in the field of irrigation management of annual and perennial crops mainly focused on the determination of threshold values of ecophysiological parameters. In particular, parameters such as stomatal conductance (gs) and leaf water potential (Ψ) have been broadly used as indicators of a plant’s water status, providing essential information for irrigation scheduling [4,7,8,9,10]. However, certain disadvantages arise when measuring these parameters, as they are considered to be destructive [11], laborious and “instantaneous” [12]. In order to overcome the abovementioned disadvantages, several methods have been developed. Among them, sap flow is considered one of the most accurate methods for the continuous determination of plant water losses [13]. In olive trees, sap flow methods have been used, both on the roots, in order to study hydraulic behavior [14], and on trunks, to estimate the tree’s water consumption [15]. A plethora of advantages of the sap-flow method have been assessed, among which are the low acquisition cost [16], and the ability to make long-term measurements of plant transpiration [17]. On the other hand, these measurements require specific skills and experience during installation [11], as well as while processing data [18].
An alternative way to measure sap flow without using specific sensors is to estimate the daily sap flow via reference evapotranspiration (ETo) computations. In this regard, several efforts have been made and have been successfully applied to various crops, such as grapefruit [19], olives [20,21,22,23], citrus, vines, kiwi, olives, apples, walnut, and apricot [21].
The working hypothesis of the aforementioned cases is to examine the potential correlation between crop water losses (expressed as sap flow per leaf area) and reference evapotranspiration (ETo), which by definition expresses the water losses of a hypothetical reference crop that resembles an extensive surface of green, well-watered grass of uniform height, actively growing and completely shading the ground (so ETo can be described as grass water loss per grass-leaf area) [24]. The latter (ETo) can be continuously monitored by meteorological stations, while the crop’s water losses per leaf area need to be measured by devices such as sap flow probes, after measuring the leaf area with proper devices, bearing in mind all aforementioned disadvantages. Thus, if a significant correlation among them can be achieved, one can automate the measurement of sap flow per leaf area, without the need to purchase and operate sophisticated equipment. As already mentioned, this methodology was performed in numerous crops, but only under well-water conditions, therefore its performance under limited soil water conditions remained more or less obscure [19,23]. Thus, the aim of our research is to evaluate and validate the above-mentioned hypothesis in a commercial olive orchard, where mild-to-moderate water-stress conditions usually prevail.

2. Materials and Methods

2.1. Study Site and Orchard Characteristics

The experiment was conducted in a typical olive orchard, planted with ‘Kalamon’ plants (Olea europaea cv. “Kalamon”)—a widely cultivated table variety. The soil could be characterized as a heavy-textured one (sandy clayey (SC)), while irrigation was performed using a sprinkler irrigation system. Microclimatic parameters were continuously recorded by a meteorological station placed within the experimental site. Details regarding the experimental orchard can be found at Kokkotos et al., 2020 [25].

2.2. Measurements of Soil and Plant Water Status

During DOY (Day of Year) 210 to DOY 260, predawn leaf water potential (ΨPD) was measured three to four times per week using a Scholander pressure chamber bomb (SKPM 1400/80, Skye Instruments Ltd., Powys, UK) on ten mature leaves. Concomitant measurements of stomatal conductance (gs) were performed using an open gas analyzer system (LCPro+, ADC, Bioscientific Ltd., Hoddesdon, UK). Measurements of gs were conducted from 09:30 AM to 11:00 AM under light-saturated conditions, on ten healthy, fully expanded, well-exposed leaves of the same canopy height. Soil water status was continuously monitored using an appropriate number of probes, properly installed in order to accurately measure changes in soil water availability [25].
Sap flow was measured in the trunks of two olive trees [14,26,27]. In order to cover azimuthal variability, which is known to significantly affect the accuracy of sap flow measurements [26,28], four sets of thermal dissipation probes were used (model TDP 50, Dynamax Inc., Houston, TX, USA). The probes were installed 55 cm above the ground surface, all at the same height, on an azimuthal angle of 90°, as suggested by the manufacturer (Dynamax Inc., Houston, TX, USA). The sensors consisted of two 50 mm-long and 1.65 mm-diameter needles and were implanted in a vertical line 40 mm apart [29]. After installing the probes, the needles were covered with insulating ointment to avoid pathogen growth, and the trunk was wrapped in reflective material. The probes were then connected to a DL2e datalogger (Delta-T Devices Ltd., Cambridge, UK) and a constant electric voltage of 5 V was supplied to the upper needle. The difference in temperature between the two needles was monitored every 10 min, and the 60-min averages were recorded.
The sap flow index (K) was calculated as follows [30]:
Κ = (ΔΤmax − ΔΤ)/ΔΤ
where ΔΤ is the temperature difference between probes, which is maximized at zero fluxes. The average sap flow velocity was calculated using the following equation:
V = 0.0119 × K1.231
Sap flow rate was derived from velocity as:
SF = AS × V × 3600
where SF is the sap flow rate, AS is the active sapwood area measured as described below, and V is sap flow velocity.
The active xylem of the sapwood area (AS) was identified by boring the trunks of both trees and extracting a sapwood core sample with a tree-coring tool. Thereafter, an indicator dye (methyl orange) was applied to the extracted sample with a micropipette, in order to distinguish the sapwood from the heartwood. After separating the active conducting xylem, its depth was measured with calipers.

2.3. Measurement of Leaf Area (AL)

Measurements of leaf area index (LAI) were conducted with a LAI-2000 Plant Canopy Analyzer (LI-COR Biosciences, Lincoln, NE, USA) using the methodology described by Villalobos et al. [31]. LAI measurements were performed on the same days that water potential and stomatal conductance were also measured. The maximum LAI (LAImax) was measured at 50 cm to 80 cm from the trunk and the minimum (LAImin) at the center of the canopy, since an open-shape canopy scheme was maintained in all plants through pruning. Weighted average ensued from the integration of plant ground cover (GC), as suggested by Díaz-Espejo et al. [32], by using the following equation:
LAIavg = LAImax × GC + LAImin × (1 − GC)
Finally, the mean leaf area (AL) was estimated as:
AL = (LAIavg × GC)/number of trees

2.4. Sap Flow Prediction Model

Using the data of both LAI and ETo, an estimation of sap flow (SFestimated) and thus of plant water losses was performed using the methodology proposed by Pereira et al., 2006 [21], for trees under well-water conditions where the working hypothesis is to correlate plant water losses per leaf area to those of a hypothetical grass-crop (as expressed by ETo) per grass leaf area index, which is equal to 2.88 m2/m2 [24]. However, in the present study, soil water availability was a limiting factor since the commercial olive orchard was not constantly maintained under well-water conditions. Therefore, the quantification of the limited water availability was assessed by using a stress coefficient (Ks) as suggested by Kokkotos et al. [25]. In short, Ks is calculated as the reduction rate of soil water content under a threshold value below which water stress initiates, until a minimum soil water content value that corresponds to the permanent wilting point [24]. Critical values, such as field capacity, minimum soil water content and intermediate values, are measured continuously by multi-depth capacitance probes that cover the active root zone of the olive trees.
Consequently, after the integration of Ks, the examined correlation hypothesis is as follows:
SF/AL = (KS × ETo)/LAIgrass
or
SF = (KS × ETo × AL)/LAIgrass
where SF is the sap flow rate, Ks is the stress coefficient [25], ETo is reference evapotranspiration, AL is the leaf area of the olive tree as described above, and LAIgrass is the leaf area index of the theoretical crop (grass, equal to 2.88) according to Allen et al. [24].
A regression analysis was used to identify a possible correlation between the measured sap flow (SFmeasured) per leaf area of the olive trees and the estimated one (SFestimated), over a period of 51 days. The obtained relationship between the estimated and the measured sap flow was then used in a later period, between DOY 289 to DOY 335, in order to validate the methodology, while the root mean square error (RMSE) was used to evaluate its adaptability.

2.5. Statistical Analysis

Statistical analysis was performed using the Python programming language, version 3.8, along with the libraries PWLF [33] and Curveball [34].

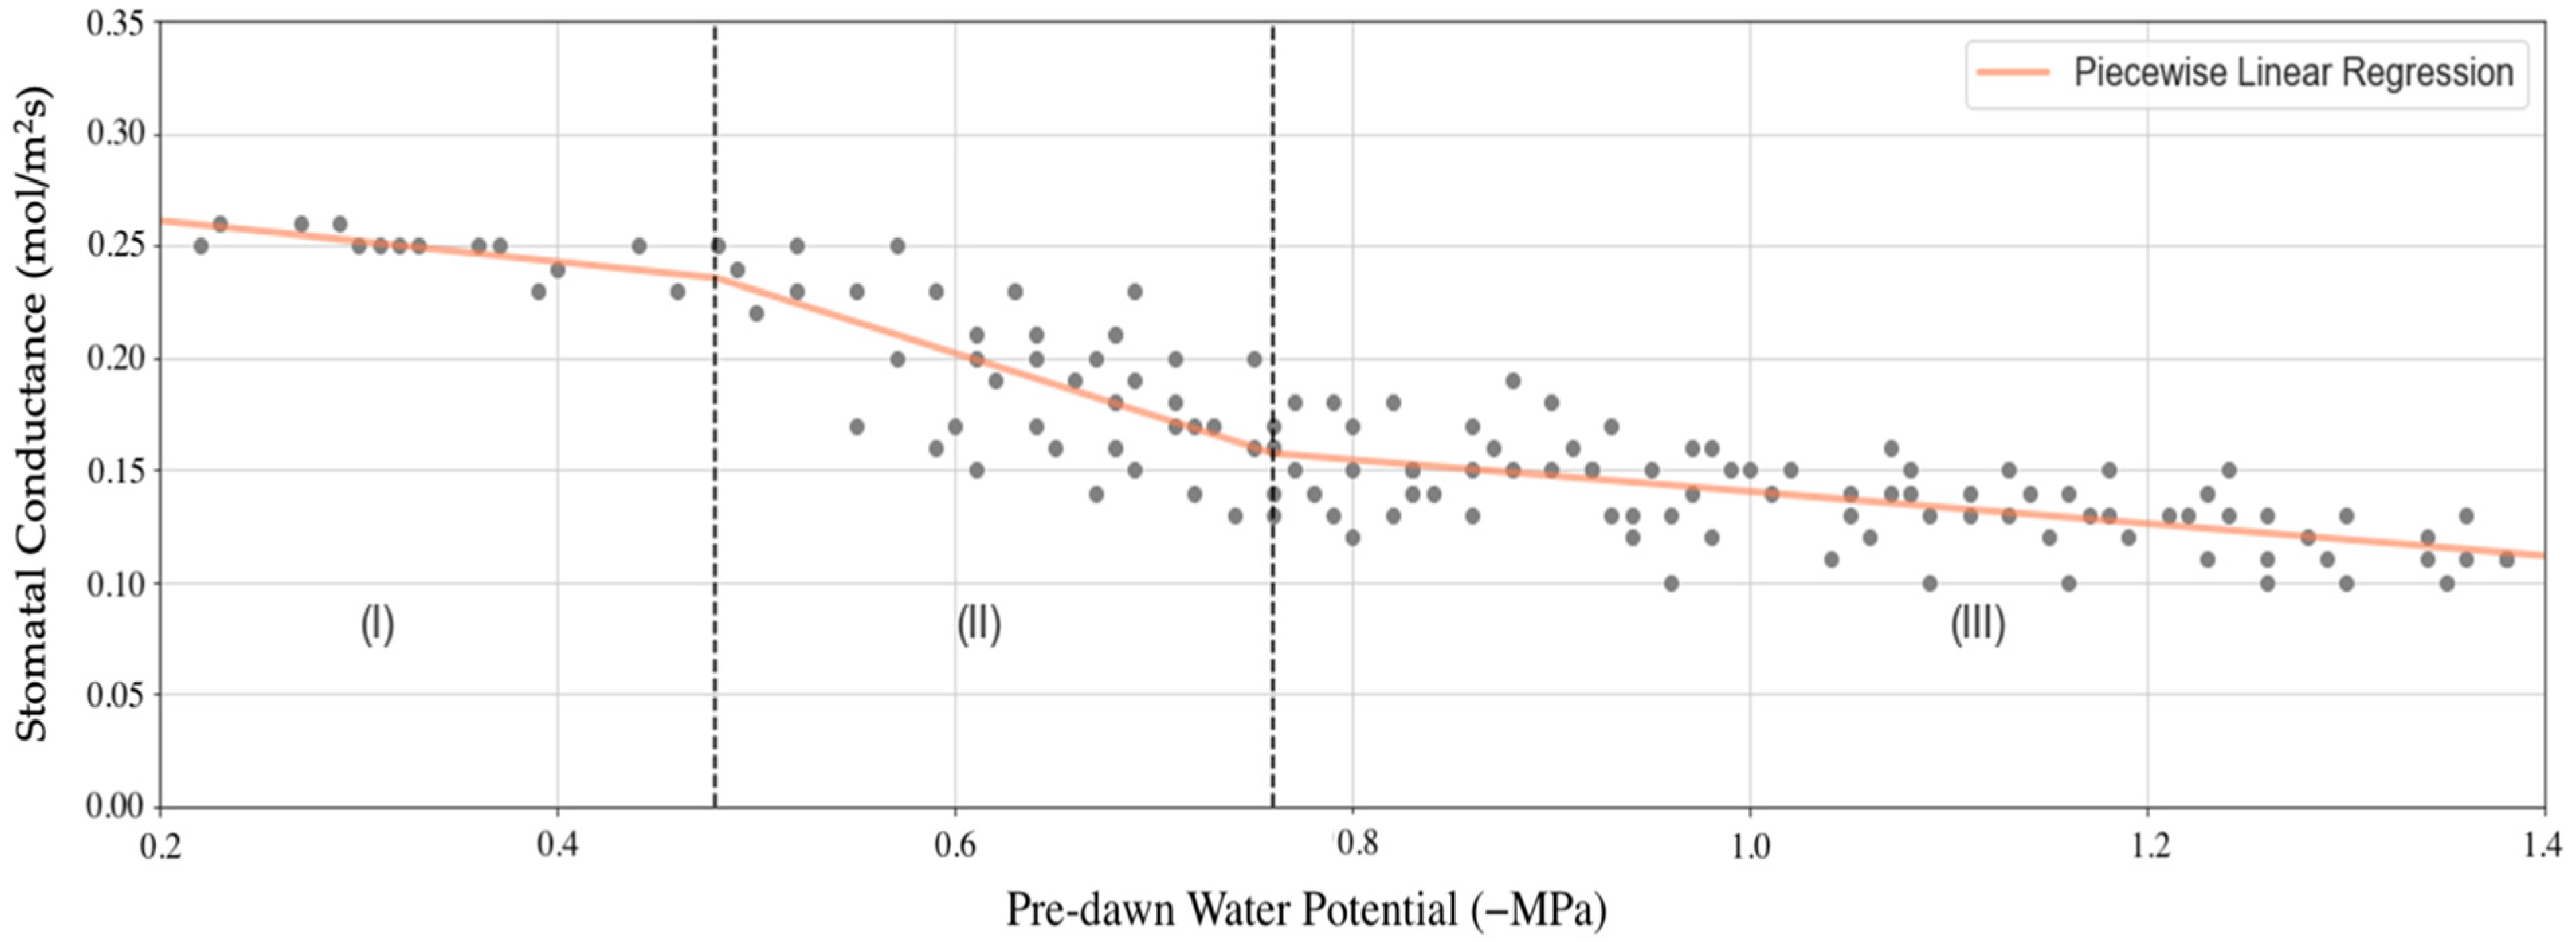
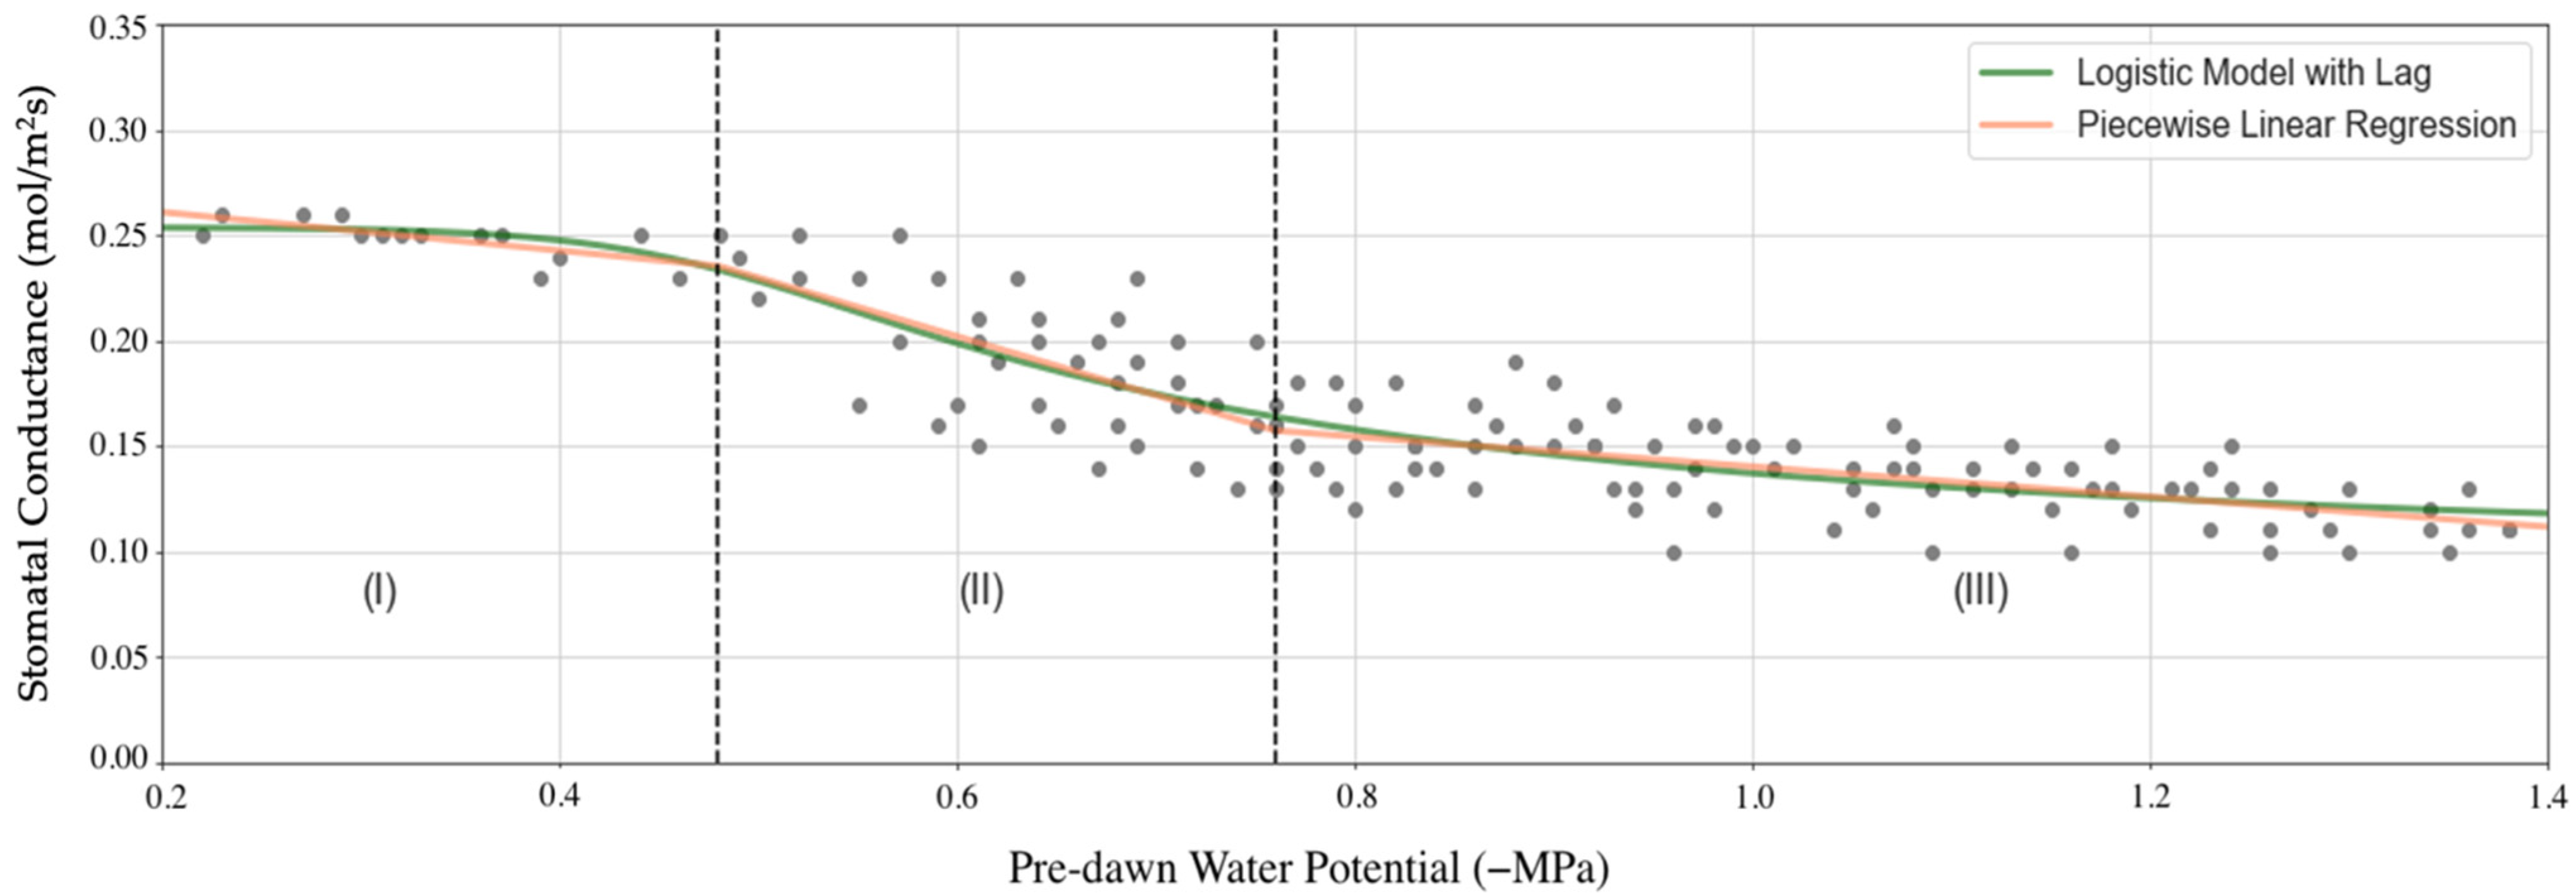
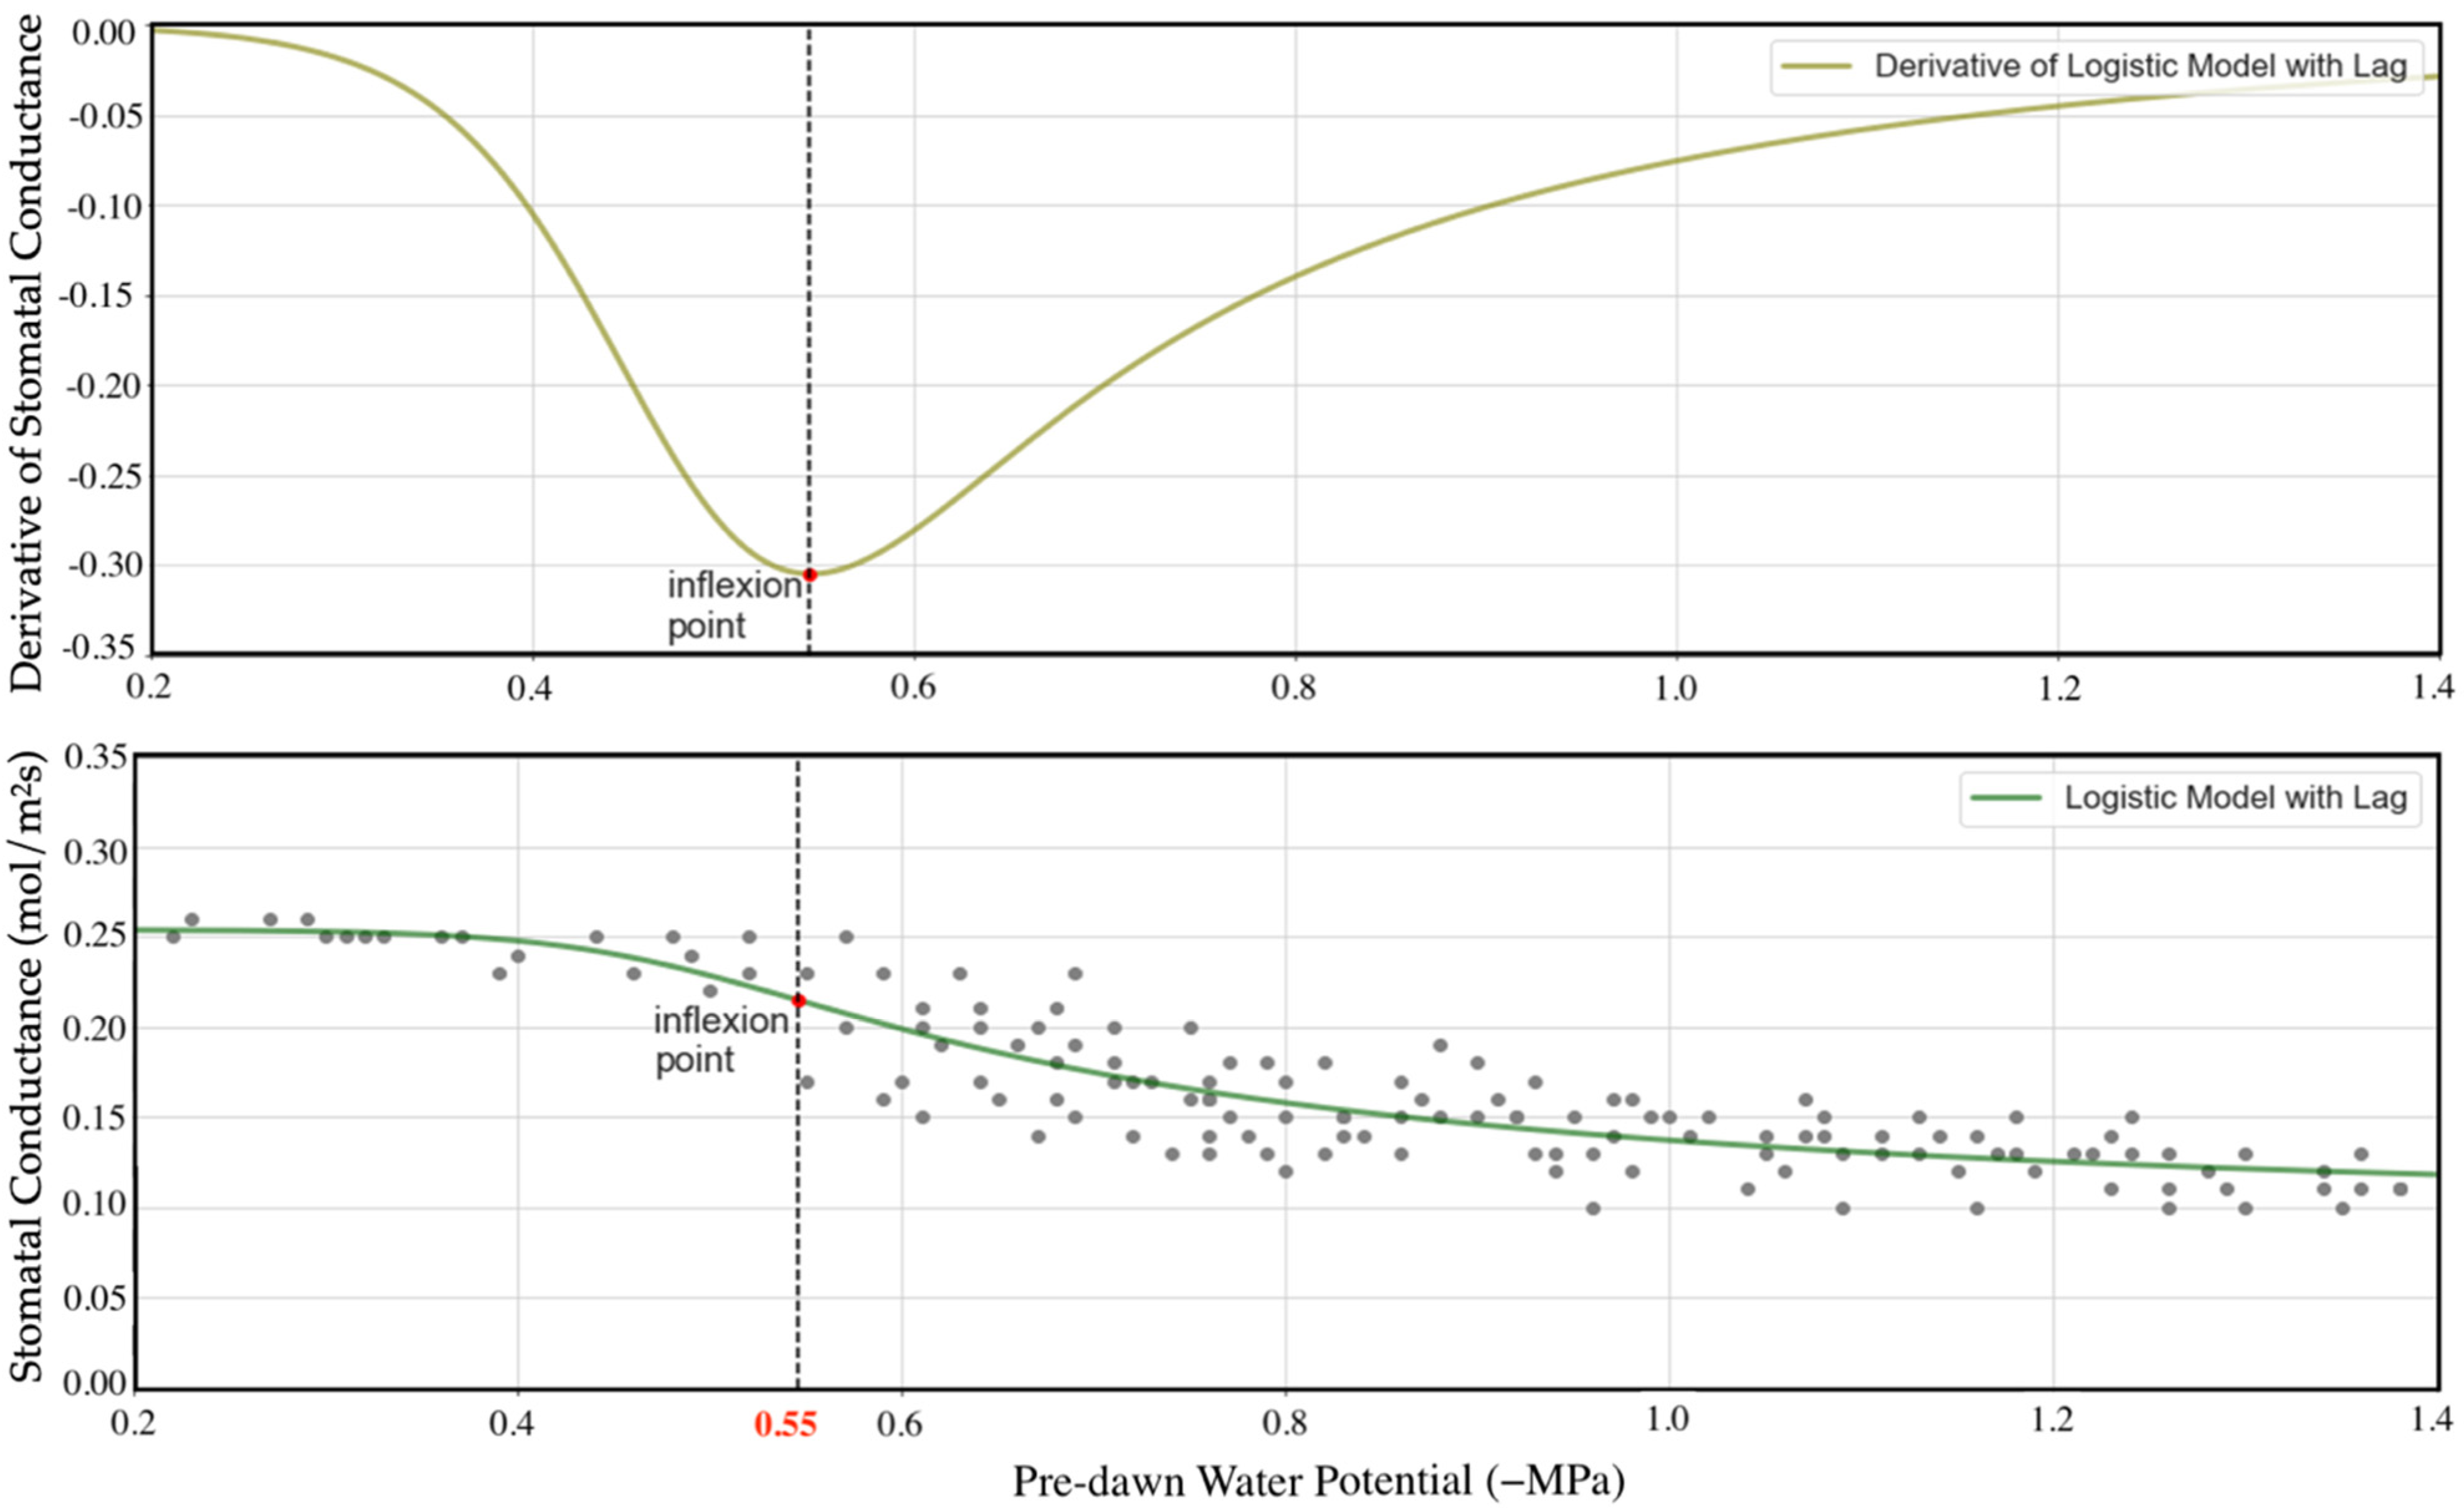
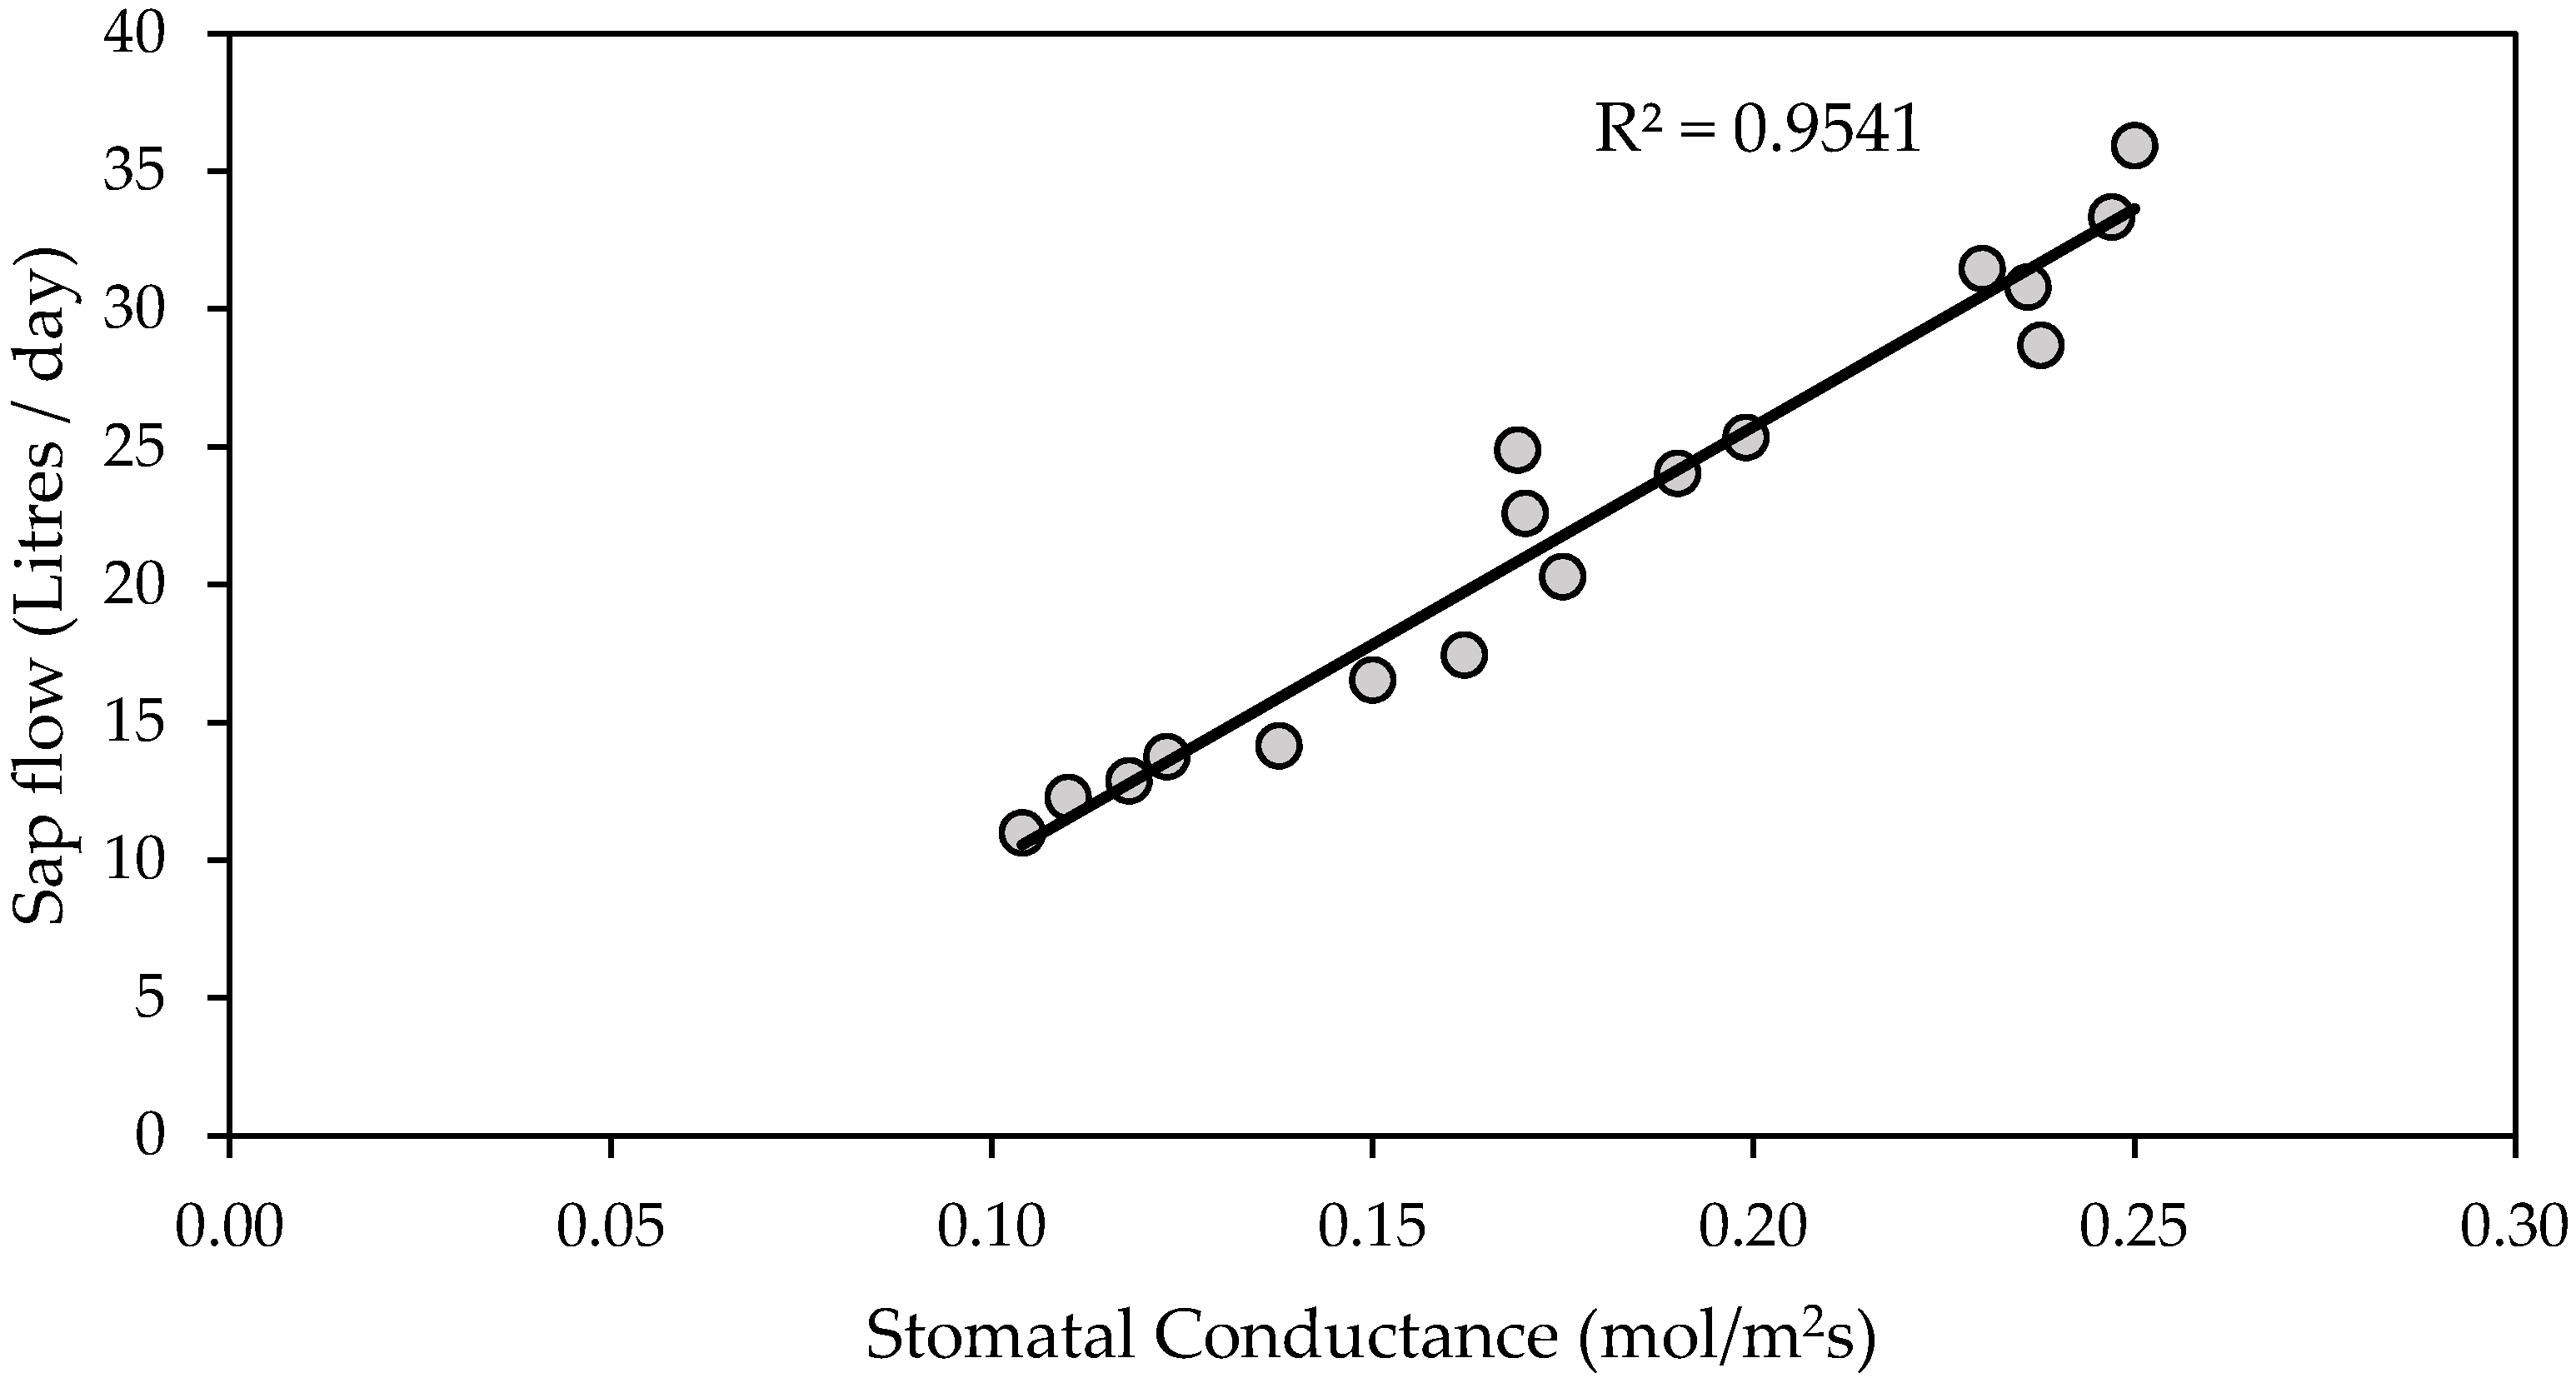
3. Results and Discussion

3.1. Orchard Water Status

During the experiment, data sets of sap flow, ΨPD, gs and soil water content (%) were collected over a period of 51 days in a commercial olive orchard (DOY 210 to DOY 260). During the whole period, meteorological conditions were typically Mediterranean, resulting in high reference evapotranspiration (ETo) that remained more or less stable, until a minor decline was observed after DOY 245 (Figure 1).
During DOY 210 to DOY 260, two irrigations of 33 mm each, and one rainfall of 36.3 mm, took place. Based on the irrigation and rainfall events, the period of 51 days was segmented into three distinct sub-periods (henceforth called drought cycles) that are indicated in Figure 2. Volumetric soil water content ranged between 18 and 29% during the experimental period. In particular, after each irrigation, soil moisture content reached the highest limit of 29%, and thereafter decreased progressively (Figure 2).
Based on Ks calculations, a value of soil moisture content of 22% was considered as the threshold point for water-stress onset. Ιn all three drought cycles, Ks ranged from 1 (well-water condition) to a minimum value of c. 0.6 (DOY 259), indicating that plants experienced mild to moderate water-stress conditions. The latter is confirmed by the measurements of pre-dawn water potential (ΨPD). As observed in Figure 3, ΨPD was greater than c. −0.55 MPa when Ks was equal to one, gradually decreasing to the minimum values of −1.68 ± 0.09 MPa. These results suggest that a ΨPD value of −0.55 MPa could be considered as the critical value capable of indicating the onset of drought stress in olive plants. This value of ΨPD is in accordance with previous findings reported in the literature [4,35] for different cultivars.
However, the fact that ΨPD critical values that correspond to the onset of drought stress can vary with genotype, as well as the rate and intensity of drought stress imposition [36], indicate that the relationship between water potential and stomatal conductance should be further assessed in order to extract a robust threshold value. To achieve this, the measured values of stomatal conductance and pre-dawn water potential were scattered as shown in Figure 4.
Previous studies that assessed the relationship of these two ecophysiological parameters [7,37] suggested a three-phase decrease: an initial, steady phase of high stomatal conductance values, a transient one that corresponded to a rapid decrease in gs in relation to the water potential decrease, and finally a third phase characterized by a lower rate of stomatal conductance reduction.
A first attempt to accurately estimate the boundaries of those phases was performed using a piecewise linear regression approach methodology [33,38], as shown in Figure 5.
Due to the fact that piecewise modeling offers limited information about the exact switch point of the transilient period, a growth modeling approach was also used. The model selection was performed on information-based criteria among members of the generalized logistic function [34,39].
The results indicated that, despite their visual resemblance (Figure 6), the two models are fundamentally different. In particular, the computed growth model incorporates the lag effect, and additionally, because it is continuous and differentiable, the inflection point can be computed (i.e., the location where a curve changes from concave upward to concave downward, or vice versa). The inflection point plays the role of the switch point (threshold value of pre-dawn water potential) that needs to be robustly determined in order to identify the onset of water stress. Figure 7 plots the first derivative and the corresponding switch point.
These results suggest that the ΨPD value of −0.55 MPa is a reliable threshold value that indicates the reduction in stomatal conductance, and therefore of sap flow and photosynthetic rate [40], which is also in accordance with previous findings reported in the literature [4,35].
A close relationship between sap flow and stomatal conductance was also evident (Figure 8). It is obvious that stomatal closure, as a mechanism of the response of water stress for olive trees, affects the rate of sap flow, with the highest values appearing when no water stress occurs. High values of stomatal conductance indicate high transpirational water losses, which in turn require high sap flow rates in order to maintain favorable water status in plants. Indeed, maximum values of sap flow were evident after each irrigation, while minimum values of c. 12 L/day were measured at the end of each drought cycle, as a result of the reduction in both soil water availability and transpiration rates (Figure 9). The sap flow reduction pattern was almost the same during all three drought cycles, i.e., it was maintained at a high rate for the first three or four days after irrigation, and thereafter gradually decreased. In particular, during the second drought cycle, the high sap flow rate lasted for a shorter period of time. A possible explanation could be based on the fact that the rain pattern, in terms of amount and intensity, was not adequate to fully refill the soil reservoir with water. In fact, the rain intensity was such that it exceeded soil conductivity and caused surface runoff (data not shown). This is consistent with the measurements of the soil moisture content sensors, which indicated significantly lower values in the plants’ effective root zone after the rainfall, compared with those after the irrigation.

3.2. Estimation and Validation of Water Use from Micrometeorological Data

Except for stomatal conductance, it is well known that sap flow measurements are closely related to the total canopy leaf area [41] under similar ETo and soil water conditions. Thus, the values of the olive tree’s leaf area and LAIgrass were used to eliminate the effect of the canopy size in sap-flow estimations. The estimated sap flow was calculated using Equation (7), and the statistical relationship between the measured and the estimated sap flow rate is shown in Figure 10. The regression analysis indicated an exponential correlation (R2 = 0.858); this finding is in contrast with the linearity that has been reported under well-watered conditions of various tree species [19,21,23]. However, the exponential trend observed in this correlation seems fairly realistic, since the plants’ physiological response to water status is reported to be non-linear [42].
Validation of estimated sap flow values was performed during two subsequent drought cycles, from DOY 289 to DOY 335. During this period, atmospheric evaporative demand, as expressed by ETo, was constantly under 3.00 mm per day. The estimated sap flow values that resulted from the above exponential equation (Figure 10) were compared with the measured values of sap flow, and a linear correlation was observed (Figure 11). The regression analysis confirms the fairly good correlation between the estimated and measured data (R2 = 0.804). The root mean square error (RMSE) between estimated and measured sap flow values was 0.579 L/day, providing evidence for good adaptability of the model for the estimation of sap flow rate under mild water-stress conditions.

3.3. Advantages and Disadvantages of the Methodology

The comparative advantage of this method is essentially the monitoring of water flow at the soil–plant–air continuum. Moreover, it can quantify the water losses after estimating sap flow under the expected mild to moderate stress conditions that usually take place in commercial orchards. This is aligned with the urgent need for applying precision irrigation methods. Lastly, as opposed to the research that has been done so far which focuses only on well-irrigated trees [21,23], the proposed methodology has been tested in commercial olive orchards under mild stress conditions.
Despite the fact that calculation of the critical parameters (such as LAI, soil water content and ETo) is a relatively easy procedure, in order to establish the above relationship between measured and estimated sap flow, several probes are required to estimate soil water content variability. This could potentially make the suggested methodology difficult to apply in a commercial orchard, mainly due to the increased cost of these sensors. Moreover, the method is locally tested in a traditionally shaped olive orchard, and further testing is required for an extrapolation of the results in different olive orchards.
Another limitation of this study is the usage of TDP probes, which, despite their low cost [16], are known to lack the capability for low flow detection, compared to more up-to-date sap flow methods, such as the heat pulse method [43]. However, the measurements of the sap flow rate that were taken using the TDP method, especially at the beginning of the drought cycles under well-watered conditions, were consistent with the results reported by using mainly the heat pulse method under similar soil water conditions [14,20,21,44]. This indicates that the correct installation of the TDP probes, after precise identification of the sapwood area, could lead to reliable results. On the other hand, the literature data of sap flow values under mild or moderate water-stress conditions are sparse, becoming a limiting factor for the further evaluation of the sap flow method when the soil water supply is limited.

4. Conclusions

The ability to continuously monitor an olive tree’s water requirements in a commercial orchard, without using expensive and specific equipment, is crucial when planning irrigation. In the present study, a simple yet reliable approach was validated in mild to moderate soil water limitations, based on the combination of measured sap flow, ETo, and soil water dynamics in a commercial olive orchard. The established relationship—after evaluation—between the plant’s water consumption and reference evapotranspiration confirmed the applicability of the methodology. The verification of the proposed methodology showed sufficient capability to estimate the daily tree water losses under mild to moderate water-stress conditions. However, this methodology has some weak points since it has been verified in the same olive orchard. Therefore, it is suggested that further research should be conducted, not only in similarly shaped (traditional) olive orchards but also on high- or super-high-density plots and different tree species.

Author Contributions

Conceptualization, E.K., A.Z. and A.P.; methodology, E.K. and A.Z.; writing—original draft preparation, E.K. and A.Z.; writing—review and editing, E.K., A.Z. and A.P.; data curation, G.T.; statistical analysis, G.T.; supervision, A.P. All authors have read and agreed to the published version of the manuscript.

Funding

This research was funded by the European Union and Greek national funds through the Regional Operational Program “Western Greece 2014–2020” under the Call “Enhancing development and innovation research projects in the field of priority RIS3, AGRODIATROPHY”, project number (MIS): 5040466, entitled “Intelligent Agriculture Services using new technologies to support olive cultivation”.

Data Availability Statement

The data presented in this study are available on request from the corresponding author. The data are not publicly available due to privacy restrictions.

Conflicts of Interest

The authors declare no conflict of interest.

References

  1. FAOSTAT. Available online: http://www.fao.org/faostat/en/#data/QC (accessed on 20 May 2021).
  2. Ben Abdallah, M.; Trupiano, D.; Polzella, A.; De Zio, E.; Sassi, M.; Scaloni, A.; Zarrouk, M.; Ben Youssef, N.; Scippa, G.S. Unraveling Physiological, Biochemical and Molecular Mechanisms Involved in Olive (Olea europaea L. Cv. Chétoui) Tolerance to Drought and Salt Stresses. J. Plant Physiol. 2018, 220, 83–95. [Google Scholar] [CrossRef]
  3. Hsiao, T.C.; Steduto, P.; Fereres, E. A Systematic and Quantitative Approach to Improve Water Use Efficiency in Agriculture. Irrig. Sci. 2007, 25, 209–231. [Google Scholar] [CrossRef]
  4. Steduto, P.; Hsiao, T.C.; Fereres, E.; Raes, D. Crop Yield Response to Water; Food and Agriculture Organization of the United Nations: Rome, Italy, 2012. [Google Scholar]
  5. Brito, C.; Dinis, L.T.; Moutinho-Pereira, J.; Correia, C.M. Drought Stress Effects and Olive Tree Acclimation under a Changing Climate. Plants 2019, 8, 232. [Google Scholar] [CrossRef] [PubMed] [Green Version]
  6. Bhusal, N.; Lee, M.; Lee, H.; Adhikari, A.; Han, A.R.; Han, A.; Kim, H.S. Evaluation of Morphological, Physiological, and Biochemical Traits for Assessing Drought Resistance in Eleven Tree Species. Sci. Total Environ. 2021, 779, 146466. [Google Scholar] [CrossRef] [PubMed]
  7. Ahumada-Orellana, L.; Ortega-Farías, S.; Poblete-Echeverría, C.; Searles, P.S. Estimation of Stomatal Conductance and Stem Water Potential Threshold Values for Water Stress in Olive Trees (Cv. Arbequina). Irrig. Sci. 2019, 37, 461–467. [Google Scholar] [CrossRef]
  8. Marino, G.; Caruso, T.; Ferguson, L.; Marra, F.P. Gas Exchanges and Stem Water Potential Define Stress Thresholds for Efficient Irrigation Management in Olive (Olea Europea L.). Water 2018, 10, 342. [Google Scholar] [CrossRef] [Green Version]
  9. Moriana, A.; Villalobos, F.J.; Fereres, E. Stomatal and Photosynthetic Responses of Olive (Olea europaea L.) Leaves to Water Deficits. Plant Cell Environ. 2002, 25, 395–405. [Google Scholar] [CrossRef]
  10. Moriana, A.; Pérez-López, D.; Prieto, M.H.; Ramírez-Santa-Pau, M.; Pérez-Rodriguez, J.M. Midday Stem Water Potential as a Useful Tool for Estimating Irrigation Requirements in Olive Trees. Agric. Water Manag. 2012, 112, 43–54. [Google Scholar] [CrossRef]
  11. Fernández, J.E. Understanding Olive Adaptation to Abiotic Stresses as a Tool to Increase Crop Performance. Environ. Exp. Bot. 2014, 103, 158–179. [Google Scholar] [CrossRef] [Green Version]
  12. Fernández, J.E.; Diaz-espejo, A.; Romero, R.; Hernandez-santana, V.; García, J.M.; Padilla-díaz, C.M.; Cuevas, M.V. Precision Irrigation in Olive (Olea europaea L.) Tree Orchards. In Water Scaricity and Sustainable Agriculture in Semiarid Environment; Garcia Tejero, I.F., Duran Zuazo, V.H., Eds.; Academic Press: Cambridge, MA, USA, 2018. [Google Scholar]
  13. Fernández, J.E.; Green, S.R.; Caspari, H.W.; Diaz-Espejo, A.; Cuevas, M.V. The Use of Sap Flow Measurements for Scheduling Irrigation in Olive, Apple and Asian Pear Trees and in Grapevines. Plant Soil. 2008, 305, 91–104. [Google Scholar] [CrossRef]
  14. Moreno, F.; Fernández, J.E.; Clothier, B.E.; Green, S.R. Transpiration and Root Water Uptake by Olive Trees. Plant Soil 1996, 184, 85–96. [Google Scholar] [CrossRef] [Green Version]
  15. Fernandez, J.E.; Moreno, F.; Giron, I.F.; Blazquez, O.M. Stomatal Control of Water Use in Olive Tree Leaves. Plant Soil 1997, 190. [Google Scholar] [CrossRef] [Green Version]
  16. Davis, T.W.; Kuo, C.M.; Liang, X.; Yu, P.S. Sap Flow Sensors: Construction, Quality Control and Comparison. Sensors 2012, 12, 954–971. [Google Scholar] [CrossRef] [PubMed] [Green Version]
  17. Conceição, N.; Tezza, L.; Häusler, M.; Lourenço, S.; Pacheco, C.A.; Ferreira, M.I. Three Years of Monitoring Evapotranspiration Components and Crop and Stress Coefficients in a Deficit Irrigated Intensive Olive Orchard. Agric. Water Manag. 2017, 191, 138–152. [Google Scholar] [CrossRef]
  18. Fernández, J.E. Plant-Based Methods for Irrigation Scheduling of Woody Crops. Horticulturae 2017, 3, 35. [Google Scholar] [CrossRef] [Green Version]
  19. Cohen, Y. Determination of Orchard Water Requirement by a Combined Trunk Sap Flow and Meteorological Approach. Irrig. Sci. 1991, 12, 93–98. [Google Scholar] [CrossRef]
  20. Fernandez, J.E.; Palomo, M.J.; Diaz-Espejo, A.; Clothier, B.E.; Green, S.R.; Giron, I.F.; Moreno, F. Heat-Pulse Measurements of Sap Flow in Olives for Automating Irrigation: Tests, Root Ow and Diagnostics of Water Stress. Agric. Water Manag. 2001, 51, 99–123. [Google Scholar] [CrossRef] [Green Version]
  21. Pereira, A.R.; Green, S.; Villa Nova, N.A. Penman-Monteith Reference Evapotranspiration Adapted to Estimate Irrigated Tree Transpiration. Agric. Water Manag. 2006, 83, 153–161. [Google Scholar] [CrossRef]
  22. Rousseaux, M.C.; Figuerola, P.I.; Correa-Tedesco, G.; Searles, P.S. Seasonal Variations in Sap Flow and Soil Evaporation in an Olive (Olea europaea L.) Grove under Two Irrigation Regimes in an Arid Region of Argentina. Agric. Water Manag. 2009, 96, 1037–1044. [Google Scholar] [CrossRef]
  23. Ayyoub, A.; Er-Raki, S.; Khabba, S.; Merlin, O.; Ezzahar, J.; Rodriguez, J.C.; Bahlaoui, A.; Chehbouni, A. A Simple and Alternative Approach Based on Reference Evapotranspiration and Leaf Area Index for Estimating Tree Transpiration in Semi-Arid Regions. Agric. Water Manag. 2017, 188, 61–68. [Google Scholar] [CrossRef]
  24. Allen, R.G.; Pereira, L.S.; Raes, D.; Smith, M. FAO Irrigation and Drainage Paper No. 56-Crop Evapotranspiration; Food and Agriculture Organization of the United Nations: Rome, Italy, 1998. [Google Scholar]
  25. Kokkotos, E.; Zotos, A.; Patakas, A. Evaluation of Water Stress Coefficient Ks in Different Olive Orchards. Agronomy 2020, 10, 1594. [Google Scholar] [CrossRef]
  26. López-Bernal, Á.; García-Tejera, O.; Vega, V.A.; Hidalgo, J.C.; Testi, L.; Orgaz, F.; Villalobos, F.J. Using Sap Flow Measurements to Estimate Net Assimilation in Olive Trees under Different Irrigation Regimes. Irrig. Sci. 2015, 33, 357–366. [Google Scholar] [CrossRef] [Green Version]
  27. Hernandez-Santana, V.; Fernández, J.E.; Rodriguez-Dominguez, C.M.; Romero, R.; Diaz-Espejo, A. The Dynamics of Radial Sap Flux Density Reflects Changes in Stomatal Conductance in Response to Soil and Air Water Deficit. Agric. For. Meteorol. 2016, 218–219, 92–101. [Google Scholar] [CrossRef] [Green Version]
  28. Nadezhdina, N.; Nadezhdin, V.; Ferreira, M.I.; Pitacco, A. Variability with Xylem Depth in Sap Flow in Trunks and Branches of Mature Olive Trees. Tree Physiol. 2007, 27, 105–113. [Google Scholar] [CrossRef] [PubMed] [Green Version]
  29. Granier, A. Evaluation of Transpiration in a Douglas-Fir Stand by Means of Sap Flow Measurements. Tree Physiol. 1987, 3, 309–320. [Google Scholar] [CrossRef] [PubMed]
  30. Granier, A. Une Nouvelle Methode Pour La Mesure Du Flux Se Seve Brute Dans Le Tronc Des Arbres. Ann. Sci. For. 1985, 42. [Google Scholar] [CrossRef]
  31. Villalobos, F.J.; Orgaz, F.; Mateos, L. Non-Destructive Measurement of Leaf Area in Olive (Olea europaea L.) Trees Using a Gap Inversion Method. Agric. For. Meteorol. 1995, 73, 29–42. [Google Scholar] [CrossRef]
  32. Diaz-Espejo, A.; Buckley, T.N.; Sperry, J.S.; Cuevas, M.V.; de Cires, A.; Elsayed-Farag, S.; Martin-Palomo, M.J.; Muriel, J.L.; Perez-Martin, A.; Rodriguez-Dominguez, C.M.; et al. Steps toward an Improvement in Process-Based Models of Water Use by Fruit Trees: A Case Study in Olive. Agric. Water Manag. 2012, 114, 37–49. [Google Scholar] [CrossRef]
  33. Jekel, C.; Venter, G. Pwlf: A Python Library for Fitting 1D Continuous Piecewise Linear Functions. 2019. Available online: https://github.com/cjekel/piecewise_linear_fit_py (accessed on 28 May 2021).
  34. Ram, Y.; Dellus-gur, E.; Bibi, M.; Karkare, K.; Obolski, U.; Feldman, M.W.; Cooper, T.; Berman, J.; Hadany, L. Predicting Microbial Growth in a Mixed Culture from Growth Curve Data. Proc. Natl. Acad. Sci. USA 2020, 117, 14698–14707. [Google Scholar] [CrossRef] [Green Version]
  35. Dichio, B.; Xiloyannis, C.; Angelopoulos, K.; Nuzzo, V.; Bufo, S.A.; Celano, G. Drought-Induced Variations of Water Relations Parameters in Olea europaea. Plant Soil 2003, 257, 381–389. [Google Scholar] [CrossRef]
  36. Chartzoulakis, K.; Patakas, A.; Bosabalidis, A.M. Changes in Water Relations, Photosynthesis and Leaf Anatomy Induced by Intermittent Drought in Two Olive Cultivars. Environ. Exp. Bot. 1999, 42, 113–120. [Google Scholar] [CrossRef]
  37. Knipfer, T.; Bambach, N.; Isabel Hernandez, M.; Bartlett, M.K.; Sinclair, G.; Duong, F.; Kluepfel, D.A.; McElrone, A.J. Predicting Stomatal Closure and Turgor Loss in Woody Plants Using Predawn and Midday Water Potential. Plant Physiol. 2020, 184, 881–894. [Google Scholar] [CrossRef] [PubMed]
  38. Muggeo, V.M.R. Estimating Regression Models with Unknown Break-Points. Stat. Med. 2003, 22, 3055–3071. [Google Scholar] [CrossRef] [PubMed]
  39. Fekedulegn, D.; Mac Siurtain, M.P.; Colbert, J.J. Parameter Estimation of Nonlinear Growth Models in Forestry. Silva Fenn. 1999, 33, 327–336. [Google Scholar] [CrossRef] [Green Version]
  40. Bhusal, N.; Han, S.G.; Yoon, T.M. Impact of Drought Stress on Photosynthetic Response, Leaf Water Potential, and Stem Sap Flow in Two Cultivars of Bi-Leader Apple Trees (Malus × Domestica Borkh.). Sci. Hortic. 2019, 246, 535–543. [Google Scholar] [CrossRef]
  41. Hatton, T.; Reece, P.; Taylor, P.; McEwan, K. Does Leaf Water Efficiency Vary among Eucalypts in Water-Limited Environments? Tree Physiol. 1998, 18, 529–536. [Google Scholar] [CrossRef] [Green Version]
  42. Jones, H.G. Plants and Microclimate, 2nd ed.; Cambridge University Press: Cambridge, UK, 1992. [Google Scholar]
  43. Steppe, K.; De Pauw, D.J.W.; Doody, T.M.; Teskey, R.O. A Comparison of Sap Flux Density Using Thermal Dissipation, Heat Pulse Velocity and Heat Field Deformation Methods. Agric. For. Meteorol. 2010, 150, 1046–1056. [Google Scholar] [CrossRef]
  44. Charfi Masmoudi, C.; Masmoudi, M.; Abid-Karray, J.; Mechlia, N.B. Sap Flow Measurements in Young Olive Trees (Olea europaea L.) Cv. Chétoui under Tunisian Conditions. Sci. Hortic. 2011, 129, 520–527. [Google Scholar] [CrossRef]
Figure 1. Reference evapotranspiration (ETo) during the experimental period.
Agronomy 11 01318 g001
Figure 2. Soil moisture content (%) fluctuation, with irrigation amounts and rainfall during the experimental period.
Agronomy 11 01318 g002
Figure 3. Stress coefficients (Ks) during the experimental period. The statistical standard error is shown in bars.
Agronomy 11 01318 g003
Figure 4. Covariance of pre-dawn water potential and stomatal conductance.
Agronomy 11 01318 g004
Figure 5. Relationship of stomatal conductance (gs) and pre-dawn water potential. Three phases were segmented (with dashed lines) after applying piecewise linear regression methodology. The Roman numerals indicate the appearance order of the phases.
Agronomy 11 01318 g005
Figure 6. Application of piecewise linear regression and the growth modeling approach on the set of data presented in Figure 4 and Figure 5. The order of appearance of phases is the same as in Figure 5.
Agronomy 11 01318 g006
Figure 7. Identification of inflection point (“switch point”) of pre-dawn water potential (upper curve) and its correspondence to the set of data shown in previous Figures.
Agronomy 11 01318 g007
Figure 8. Measured sap flow per plant versus stomatal conductance.
Agronomy 11 01318 g008
Figure 9. Measured sap flow during the experimental period. Each value shown is the average of eight sets of probes (four sets of probes per tree). The statistical standard error is shown in bars.
Agronomy 11 01318 g009
Figure 10. Relationship between measured and estimated sap flow.
Agronomy 11 01318 g010
Figure 11. Measured vs. estimated sap flow during the validation process.
Agronomy 11 01318 g011
Publisher’s Note: MDPI stays neutral with regard to jurisdictional claims in published maps and institutional affiliations.

