Article

One-Time Acidification of Slurry: What Is the Most Effective Acid and Treatment Strategy?

1
Institute of Agricultural Engineering, University of Bonn, 53115 Bonn, Germany
2
SF-Soepenberg GmbH, 46569 Hünxe, Germany
*
Author to whom correspondence should be addressed.
Agronomy 2021, 11(7), 1319; https://doi.org/10.3390/agronomy11071319
Submission received: 10 May 2021 / Revised: 23 June 2021 / Accepted: 26 June 2021 / Published: 28 June 2021

Abstract

:
Acidification of slurry is a common practice to reduce ammonia and methane emissions. Sulfuric acid is usually used for this process. However, this has been criticized due to the high sulfur input into soils. Therefore, the objective of this study is to show the effectiveness of a one-time acidification with alternative acids also in combination with other treatment strategies. The amount of acid as well as the change of pH value during storage were investigated. For most variants, a strong pH increase occurred within the first ten days after acidification. Mineral acids (sulfuric or hydrochloric acid) resulted in a lower pH increase compared to organic acids (lactic, acetic, and citric acid). Under anaerobic storage conditions, the pH remained significantly lower. The addition of glucose before acidification resulted in lower pH values during the first week, but in the long term, the conversion of glucose to carbonate led to higher pH values. A previous separation process was able to reduce the amount of acid. Although the pH increase was not that strong in the first days after acidification, it was much faster and stronger afterwards due to the lower buffer capacity in the separated slurry. A long-term pH reduction was achieved by acidification to pH 3.0, but this was associated with an increased amount of acid. On the basis of the results, a combination of organic acids with anaerobic storage can be recommended as an alternative to sulfuric acid.

1. Introduction

The agricultural sector contributes to gaseous emissions [1,2,3]. Methane (CH4) is a harmful gas that substantially affects climate change and has a global warming potential 25 times higher than carbon dioxide [4]. The storage of slurry leads to methane emissions from livestock production [5,6]. These can be reduced by acidification, solid–liquid separation, or dilution of the slurry, whereas covering may even increase methane emissions [5]. Ammonia (NH3) is a major problem in slurry management due to its impact on the environment such as eutrophication, soil acidification, and the release of fine particulate aerosols or nitrous oxide emissions [7,8,9]. Ammonia emissions may occur in barns, when stored, or during the land application of slurry [10]. There are various techniques for reducing ammonia emissions such as covering or acidification [2,5].
The equilibrium between NH4+ ⇌ NH3 + H+ is strongly pH-sensitive. As the pH is lowered by the addition of an acid, the equilibrium changes from the volatile non-ionized form NH3 to the non-volatile ionized form NH4+ [11,12]. At a pH value of 6.0, the total ammonia nitrogen is present as ammonium [10], and therefore no more ammonia can be released. The pH value of slurry is reduced to 5.5 during in-house acidification in Denmark [13,14]. Acidified slurry (pH 5.5) leads to a reduction in NH3 and CH4 emissions by 75 and 61%, respectively [15]. It can be assumed that the longer the pH value of the slurry is kept at a low pH value, the greater the effect on the emissions reduction [16]. Lowering the pH value of slurry below 6.0 and 5.5 is sufficient to reduce NH3 emissions after soil application by at least 80% from pig or rather dairy cow slurry [17]. Nyord et al. [18] observed a reduction in NH3 emissions by about 70 and 65%, respectively, in the land application of barn acidified (pH 5.9–6.3) and field acidified (pH 6.1–6.7) slurry. By acidifying swine slurry to a pH value of 5.3, ammonia emissions were reduced by 80% on a laboratory scale over 96 h [19]. Methane emissions are also effectively reduced at a pH value below 6.0 [20,21]. The acidification of slurry can be carried out in-house, in storage, or during land application. Foaming may occur during acidification [10]. The widespread establishment of acidification techniques can only be guaranteed if they are economically viable for farmers [22], therefore an optimized addition of acid to the slurry is of great importance. The use of high amounts of acid and large quantities of acidified slurry during land application can lead to a reduction of the pH value in the soil [23,24]. Furthermore, the application of acidified slurry can influence pH-sensitive biological soil processes [25]. Therefore, a pH reduction in the soil should be compensated by liming [23,24].
There are different acids that can be used for acidification of slurry [26,27,28]. Sulfuric acid is usually used for the acidification of slurry [10]. The acidification costs for sulfuric acid are lower as compared with other acids [10,29]. However, the use of sulfuric acid can lead to over fertilization with sulfur during subsequent land applications [30]. Additionally, hydrogen sulfide and unpleasant odors can be produced [28,30,31]. The use of strong acids such as sulfuric acid requires specific safety requirements [26,30,32]. Furthermore, gypsum may be formed in some types of concrete at high sulfate concentrations in acidified slurry [33]. This can be a problem especially for concrete slurry storage tanks. Due to these limitations, other acids should be considered which have equal effectiveness as sulfuric acid. Additional slurry or storage treatments to reduce the amount of sulfuric acid would also be possible.
Organic acids are often weak, and therefore large quantities are needed to reach the target pH value [30]. In addition, organic acids are expected to be degraded faster, which can lead to foam formation and the release of carbon dioxide [30]. However, they may offer an opportunity, in particular for organic farming, for example, as they may be permitted for acidification of slurry more easily than sulfuric acid [28].
Instead of adding acids to the slurry, the addition of easily degradable organic compounds such as sucrose, glucose, sugar beet residues, or brewing sugar can also be used, as the fermentation of these products contributes to the formation of organic acids, which in turn lead to a reduction in the pH value [34,35].
Due to the buffer capacity in the slurry, the pH value may return to its initial pH value after acidification [28]. Possible reasons for an increase in pH value can be the degradation of volatile fatty acids (VFA), mineralization of organic nitrogen, or dissolution of carbonates [36,37,38]. Studies on acidification have shown that, depending on the type of slurry, around three to six weeks after slurry is acidified to a pH of 5.5 the pH increase is stable [13,26,27].
Currently, we are not aware of any study that has investigated a wide range of different acids and treatments which may affect the pH development after acidification of slurry. In addition, the chemical transformation processes which explain the pH value development after acidification in the different treatments are often incomplete. These could be demonstrated by a one-time acidification process. With these results, however, it would be possible to acidify the slurry in a way that saves resources and protects the environment.
The aim of this study is to investigate the long-term stability of the pH value in slurry after a one-time acidification with different organic and mineral acids. Furthermore, the influence of anaerobic storage, the addition of glucose, or a previous separation process on the pH value of acidified slurry is described. In addition, changes in the pH value during the storage of slurry are observed starting from different target pH values. On the basis of these results, it can be estimated which treatment strategy is most effective for reducing and keeping the pH value of slurry at a low level with a one-time acidification process. Thus, an effective pH value reduction could be achieved and maintained even during long storage periods. This would have the advantage that a strong reduction in NH3 and CH4 emissions could be achieved during storage and land application. Furthermore, by comparing the different treatments during and after the acidification process, it would be possible to establish more efficient farm individual management strategies, especially to reduce the use of sulfuric acid.

2. Materials and Methods

2.1. Sampling and Storage of Slurry

In our investigation, we used dairy cow, fattening pig, and sow slurry. The choice of the three slurry types from different animal species, and thus also different feeding managements, considerably increased the variability of the ingredients such as dry residue, ammonium nitrogen, or acetic acid equivalent in the slurry samples. Since the slurry of the different animal species was not compared but the treatment strategies were compared, one sample per animal species was sufficient.
Approximately 10 L of slurry was taken from the respective animal housing at least one week before acidification. All variants were acidified on the same day. For each variant, 50 g of the slurry was diluted with 50 g deionized water. We had to dilute the slurry with deionized water because stirring undiluted slurry, especially with a high dry residue content, was not possible on a laboratory scale. By diluting the slurry, a homogenous distribution of the acid and an exact determination of the pH value and the amount of acid used could be guaranteed. The buffer effect of the deionized water was not considered because of its low ion content. The conversion processes and principles of action can also be detected in diluted slurry, as shown in previous studies [38]. The pH value and temperature of the slurry were both measured with the pH sensor ’InLab Expert Pro’ (Mettler Toledo, OH, USA). The pH sensor was calibrated in accordance with the manufacturer’s instructions. Samples were stirred before pH value measurement.
After acidification, the samples were stored in 250 mL sample bottles (height 119 mm and inner diameter 63 mm, low density polyethylene) at 22.0 ± 0.4 °C under aerobic conditions (except anaerobic variants, see Section 2.2) as the lids were laid on the sample bottles rather than screwed on tightly. This enabled potential gas exchange without strong evaporation losses. The pH value was measured every three to four days during the first three weeks. Thereafter, the pH value was recorded weekly. The acidified samples were stored for seven weeks, which was sufficient time to adequately assess the pH development of the different treatment strategies. The analysis of the three types of slurry were carried out by an external laboratory (AGROLAB Agrar und Umwelt GmbH, Sarstedt, Germany). The following parameters were analyzed: dry residue, total nitrogen (N), ammonium nitrogen (NH4-N), phosphate (as P2O5), potassium (as K2O), and the main volatile fatty acids (acetic acid, butyric acid, iso-butyric acid, valeric acid, iso-valeric acid, n-caproic acid). The acetic acid equivalent was determined from the volatile fatty acids. Each variant included three repetitions.

2.2. Different Variants of Acidification

The variants differed in terms of the type of acid, slurry, and different (previous) treatments (Table 1). Due to scientific background and own preliminary tests, the samples were acidified to the target pH value 5.5 (+/−0.03 pH units). While stirring, acid was titrated to the slurry with micropipettes (0.5 to 5 mL). Additional acid was titrated when the pH value was stable.
The dairy cow slurry was acidified with the following organic acids: lactic acid (C3H6O3), acetic acid (CH3COOH) and citric acid (C6H8O7). As mineral acids sulfuric acid (H2SO4) and hydrochloric acid (HCl) were used. Acidification of the fattening pig and sow slurry was only carried out with lactic and sulfuric acid.
In addition to aerobic storage, two variants (acidification of dairy cow slurry with sulfuric and lactic acid) were additionally stored under anaerobic conditions. Acidified samples were stored anaerobically in completely closed 500 mL sample bottles (height 152 mm and inner diameter 78 mm, low density polyethylene). Such bottles may cope with small changes in pressure without leakages. We expected only small volume changes in the bottles because of temperature and ambient pressure changes. Gas formation due to anaerobic activities was supposed to be negligible because of the low pH value in the slurry. Directly after acidification as well as after each pH value measurement, the headspaces of the sample bottles were flushed with nitrogen (N2) for 30 sec (flow rate approximately 5.5 L min−1). Due to the opening of the sample bottles for pH measurement during storage, room air could enter the sample bottles. This air was expelled from the headspace of the sample bottle by flushing with nitrogen. In this way, an oxygen content <0.1% could be realized in the sample bottles.
We investigated the influence of an easily degradable organic substance in combination with acid on the development of the pH value. Therefore, 2 g glucose (C6H12O6) was dissolved in 10 mL deionized water and 0.5 mL of the solution was added to 50 g slurry (0.01 mol glucose kg−1 slurry). Then, the slurry was acidified with sulfuric acid. By adding glucose to the slurry, we also wanted to show the conversion process of easily fermentable carbohydrates in slurry during storage.
The influence of separation of the slurry on the pH value stability was tested. Therefore, dairy cow and fattening pig slurry were centrifuged 10 min at 4650 G using an ‘AvantiTM J-20 Centrifuge’ (Beckman Coulter GmbH, Krefeld, Germany). The supernatant was passed through a sieve (0.9 mm pore size) to separate floating components and then centrifuged again under the same settings. For this investigation, only the liquid phase was used. Hereafter the liquid phase is called ‘separated slurry’.
In addition to the acidification of dairy cow slurry to a pH value of 5.5, other samples were acidified to pH values of 4.5 or 3.0 with sulfuric acid.
For every variant, the amount of acid was recorded to reach the target pH value. The alkalinity of the different types of slurry can be described by the amount of sulfuric acid used in the titration to pH 5.5.
Because of capacity constraints, not every treatment strategy could be applied to every type of slurry. Therefore, the different treatment strategies were performed using the dairy cow slurry as an example, so that at least the tendency to weigh up the different acids and treatments for long-term pH reduction could be transferred to other types of slurry.

2.3. Statistical Analysis

Statistical analyses were done with IBM® SPSS® Statistics, Version 25. The values represent mean values with standard deviation (means ± SD). One-way analysis of variance (ANOVA) was performed at a significance level of 0.05 to describe the differences in the amount of acid used for acidification. Hereafter, the Tukey’s Honestly Significance Difference (HSD) was used.
If not mentioned separately, a mixed ANOVA was chosen to compare the pH values of the variants during storage after acidification. Then, the Tukey’s honestly significance difference (HSD) was also applied. In the absence of variance homogeneity, the Games-Howell test was used. All tests were conducted at a significance level of 0.05.

3. Results

3.1. Amount of Acid

The pH value of the dairy cow, fattening pig, and sow slurry before acidification was 7.10 ± 0.05, 7.04 ± 0.07, and 8.20 ± 0.02, respectively. Additional analyses of the slurries are given in Table 2.
Depending on the type of acid and slurry, different amounts of acid were required to achieve the target pH value of 5.5 (Table 3). While approximately the same amount of lactic or sulfuric acid was required for acidification for the dairy cow and fattening pig slurry, more than three times this amount had to be used for the sow slurry to achieve the target pH value. This shows that the alkalinity was also highest in the sow slurry. For the acidification of the dairy cow slurry, significantly fewer moles of H+ kg−1 slurry were used with lactic acid as compared with acetic, hydrochloric, and sulfuric acid. A previous separation process also resulted in a significantly lower amount of sulfuric acid which was needed to reduce the pH value to 5.5.

3.2. Organic and Mineral Acids

Over a period of 48 days, the pH value of the dairy cow (DC, ●), fattening pig (FP, ▲) and sow (S, ■) slurry was measured every three to four days during the first three weeks of storage. Subsequently, the pH value was measured weekly. The slurries acidified by different acids (target pH value 5.5) are color coded in Figures 1–6. In addition, the treatments in the figures are distinguished by different line structures. Furthermore, the development of the pH value of the unacidified slurry during storage was determined. The related data are given in Supplementary Material Table S1–S6.

3.2.1. Zero Treatments

The pH values of the three slurries without acidification increased during storage (Figure 1 and Table S1). This increase was stronger for the dairy cow and fattening pig slurry as compared with the sow slurry, which already had a high initial pH value. The pH value increased more strongly within the first few days of the experiment (until day 16).

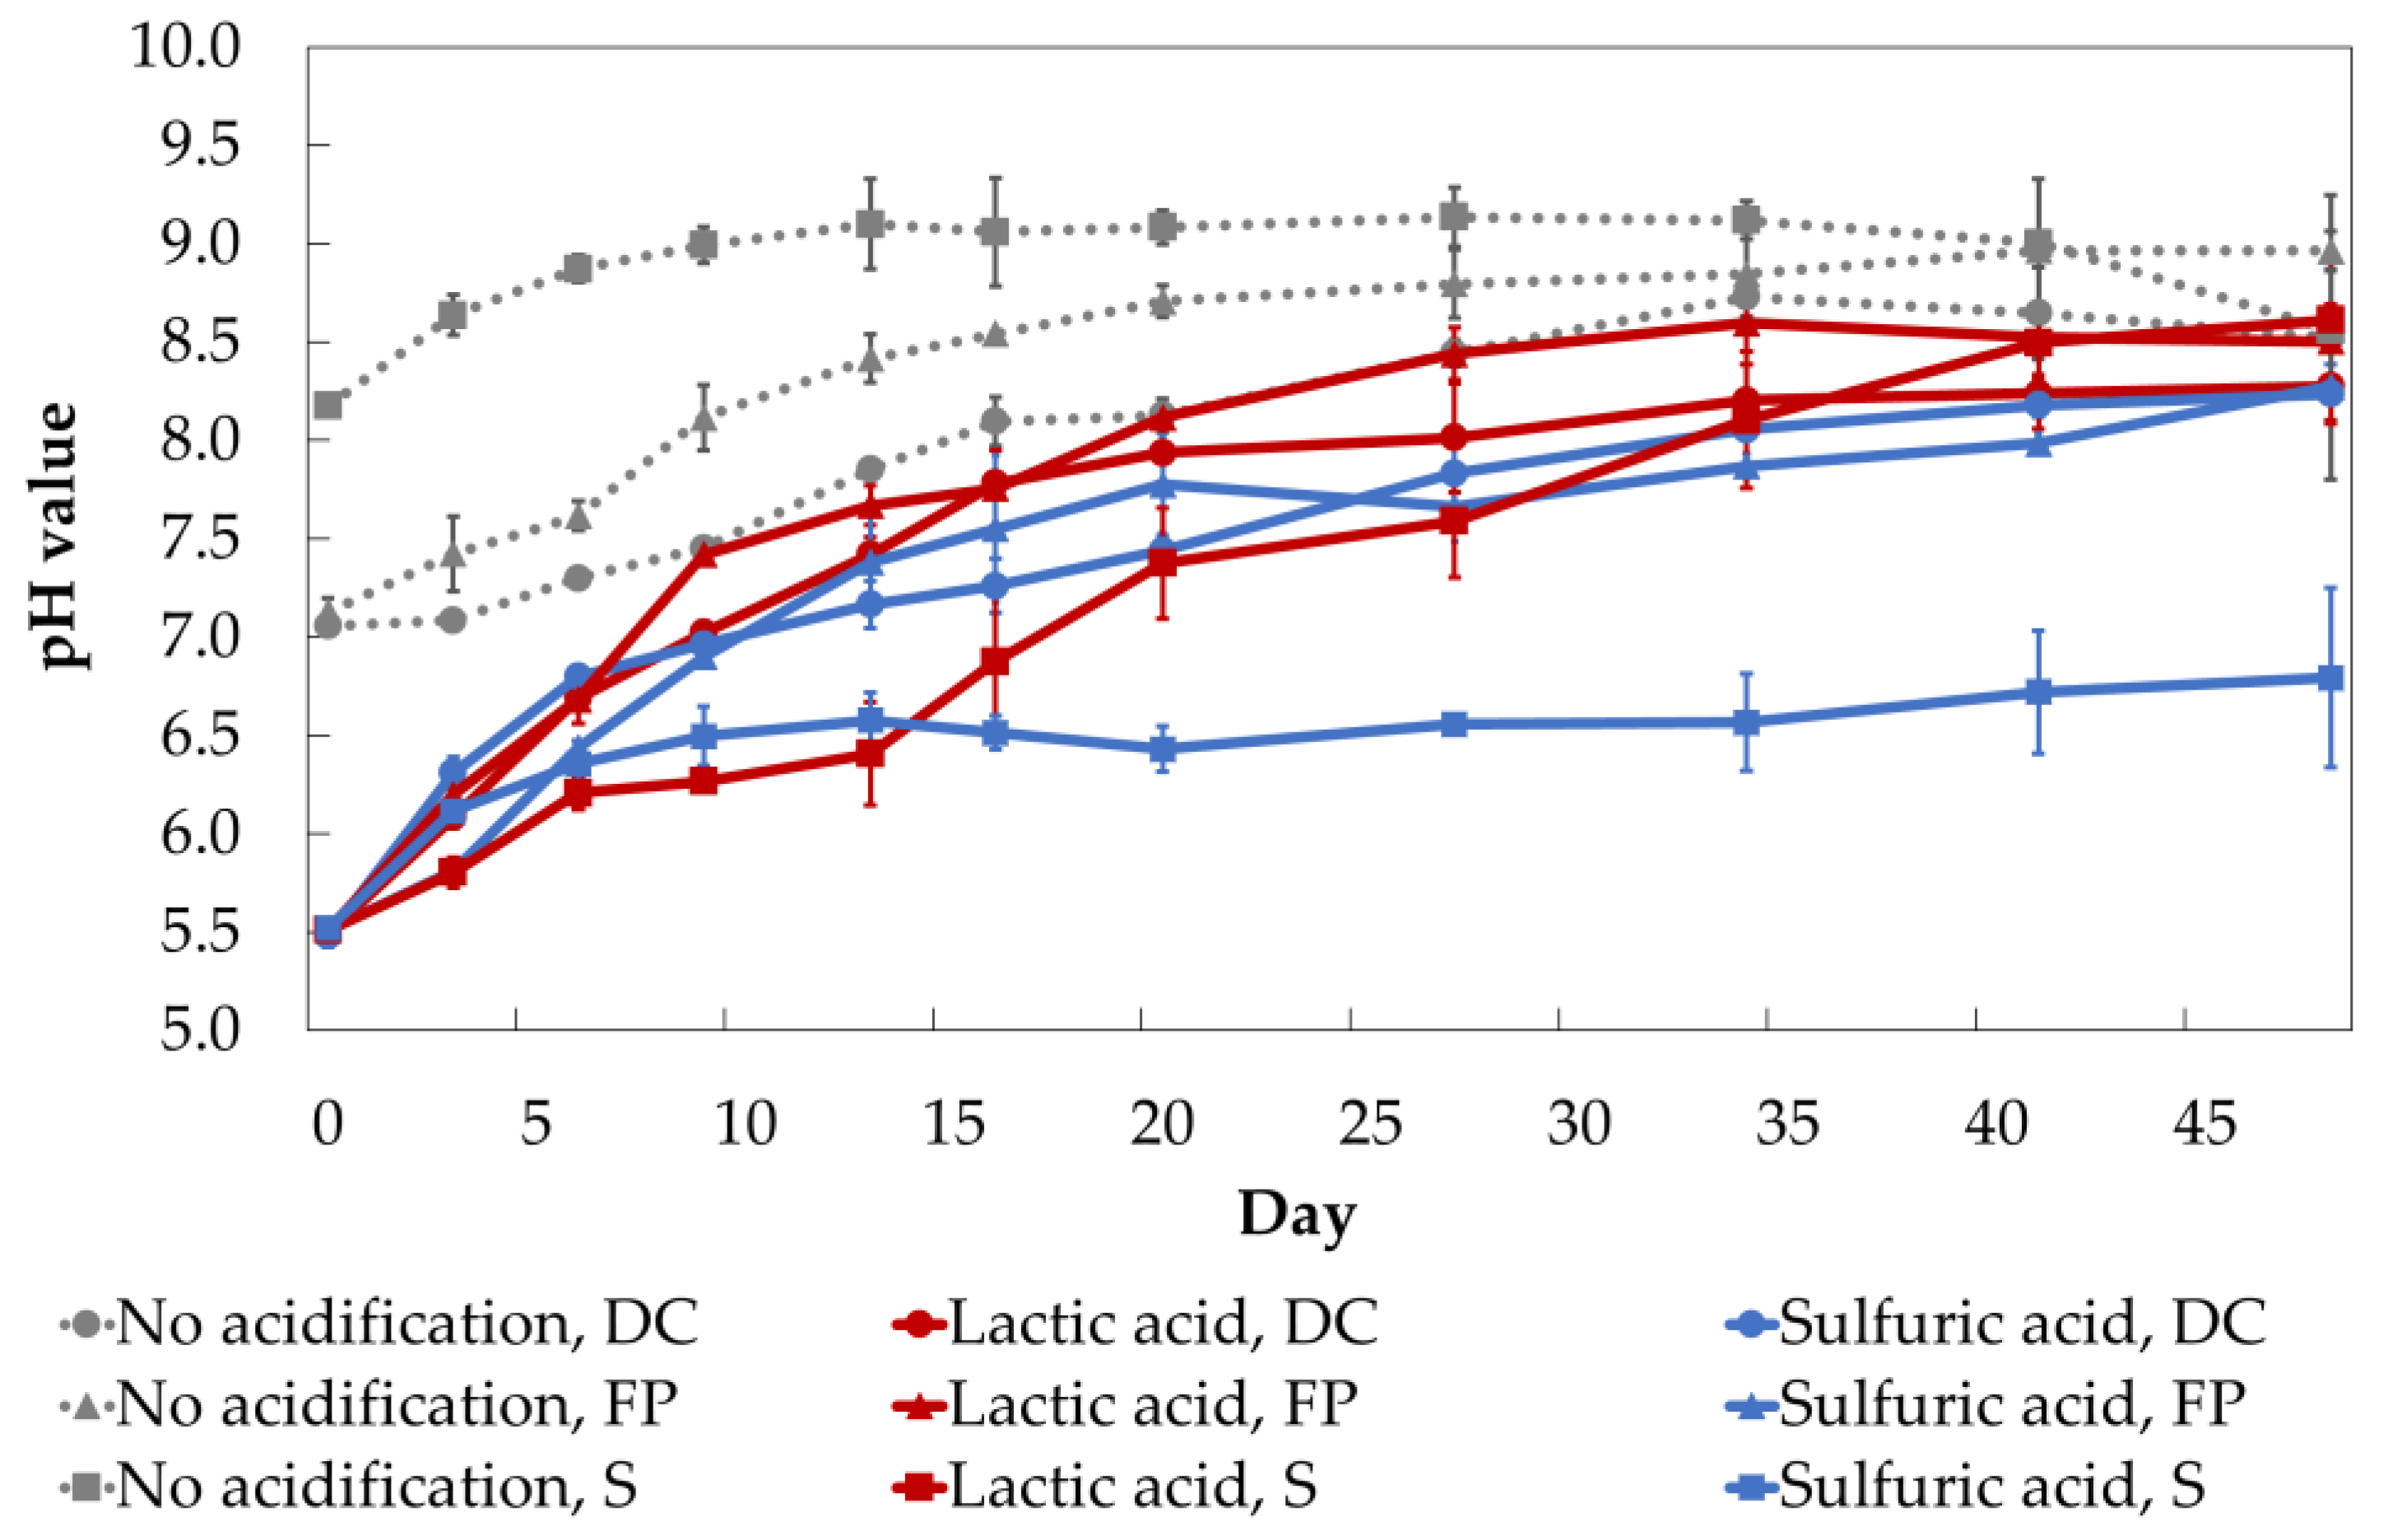
3.2.2. Acidification of All Slurries with Sulfuric and Lactic Acid

After acidification, the pH value rose again in acidified slurry for both lactic and sulfuric acid (Figure 1 and Table S1). In the long term, only sow slurry acidified by sulfuric acid could achieve a significant pH value reduction (pH 6.79 on day 48). In the first days after acidification, the pH increase was slower in the dairy cow (until day 6) and sow slurry (until day 13) which have been acidified by lactic acid as compared with the use of sulfuric acid. Long-term acidification was more effective by using sulfuric acid in all types of slurry.

3.2.3. Acidification of Dairy Cow Slurry with Various Organic and Mineral Acids

The pH value increased to 8.25 after 48 days, regardless of the type of acid (p > 0.05) (Figure 2 and Table S2). In the first six days after acidification to a pH value of 5.5, the pH increase was about 0.17 pH units d−1.
The organic acids led to a strong pH increase in the first half of the storage period (acetic acid > citric acid > lactic acid). Then, the pH value tended to stagnate in the second half (from day 20). Acidification with mineral acids resulted in an equally fast pH increase as with organic acids at the beginning of storage. However, from the second week, the pH increase was much slower. With sulfuric acid, the pH value rose slightly faster than with hydrochloric acid.

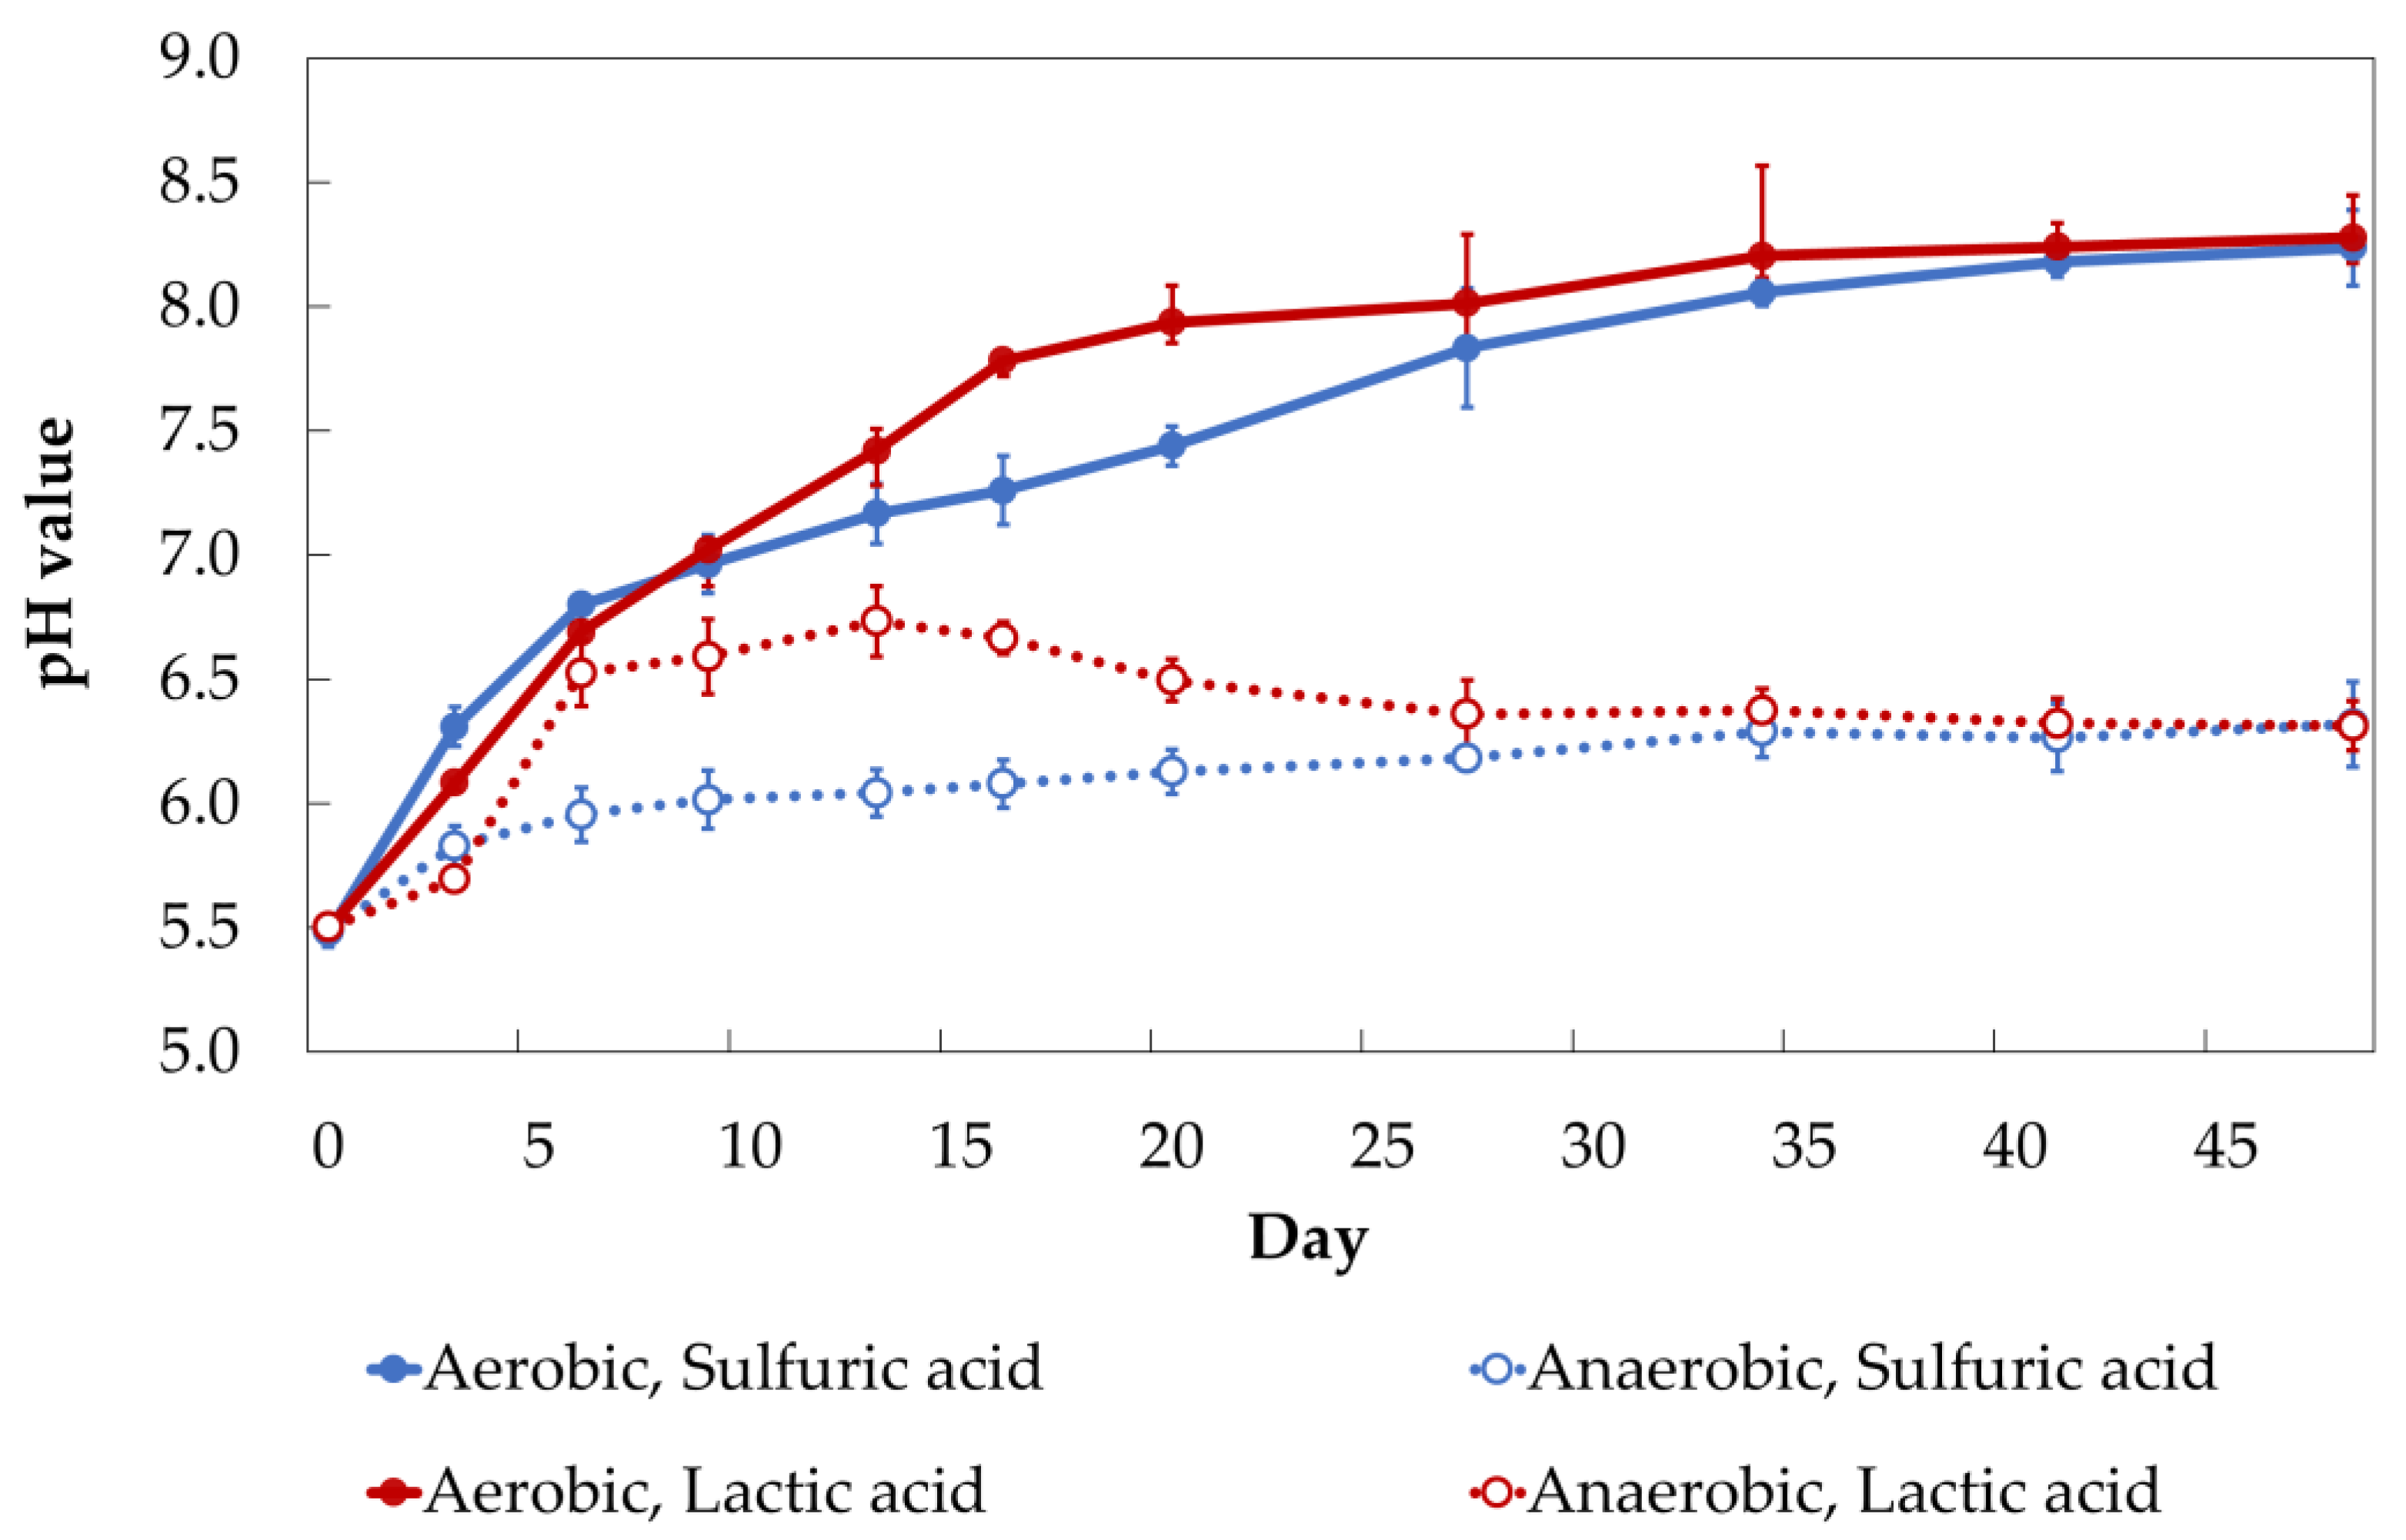
3.3. Storage under Anaerobic Conditions

The storing conditions (aerobic or anaerobic) of the acidified dairy cow slurry had a significant effect on the pH value during the storage period (Figure 3 and Table S3). The pH value was 1.9 pH units lower as compared with aerobic storing conditions at the end of the storage period. This effect was observed for both lactic and sulfuric acid. In addition, the pH value increased slower under anaerobic storing conditions.

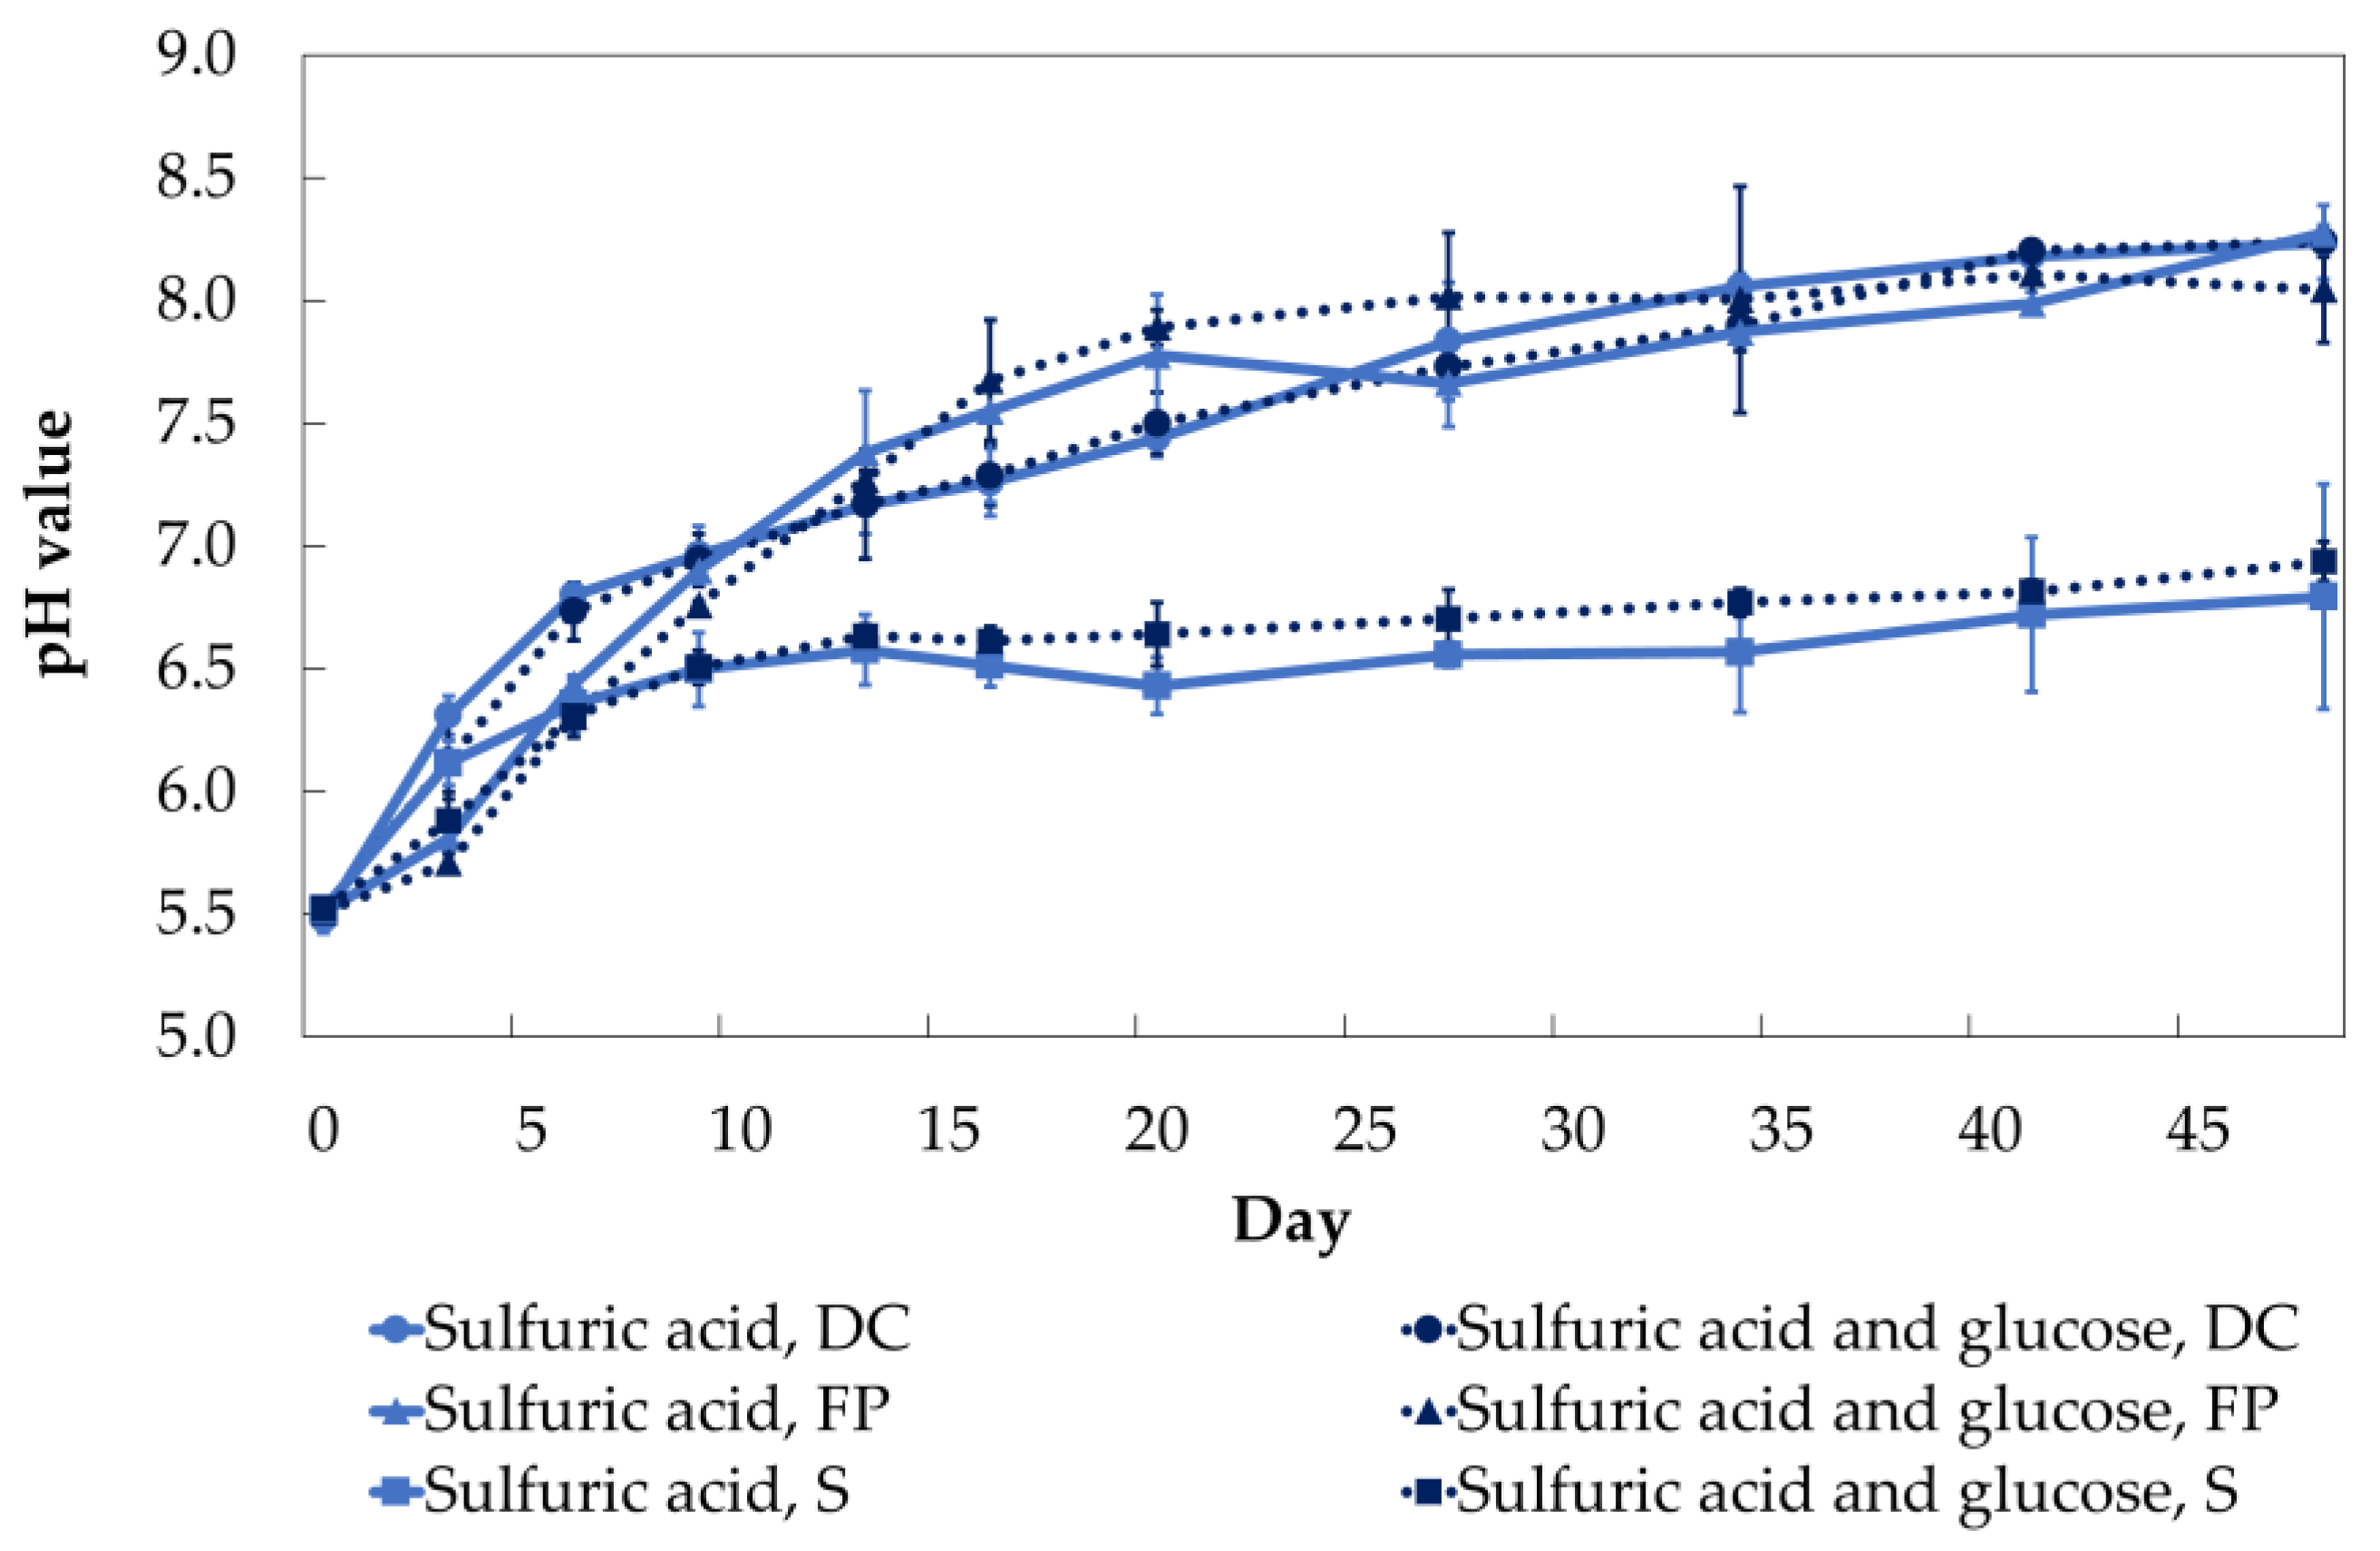
3.4. Combination of Acid and Glucose

Initially, the pH value was lower when glucose (0.01 mol glucose kg−1 slurry) in combination with sulfuric acid was added as compared with the acidification by using only sulfuric acid (days 3 and 6) (Figure 4 and Table S4). Therefore, the addition of glucose had a significant effect on the pH value during the first two measurement days after acidification (two-way ANOVA, p < 0.05). However, the addition of glucose resulted in higher pH values for sow slurry from day 9 and fattening pig slurry from day 16 as compared with the slurry in which exclusively sulfuric acid was added. All in all, the addition of glucose at this dosage in combination with sulfuric acid to the slurry had no significant effect on a better long-term stability of the pH value of 5.5 as compared with the addition of sulfuric acid alone.

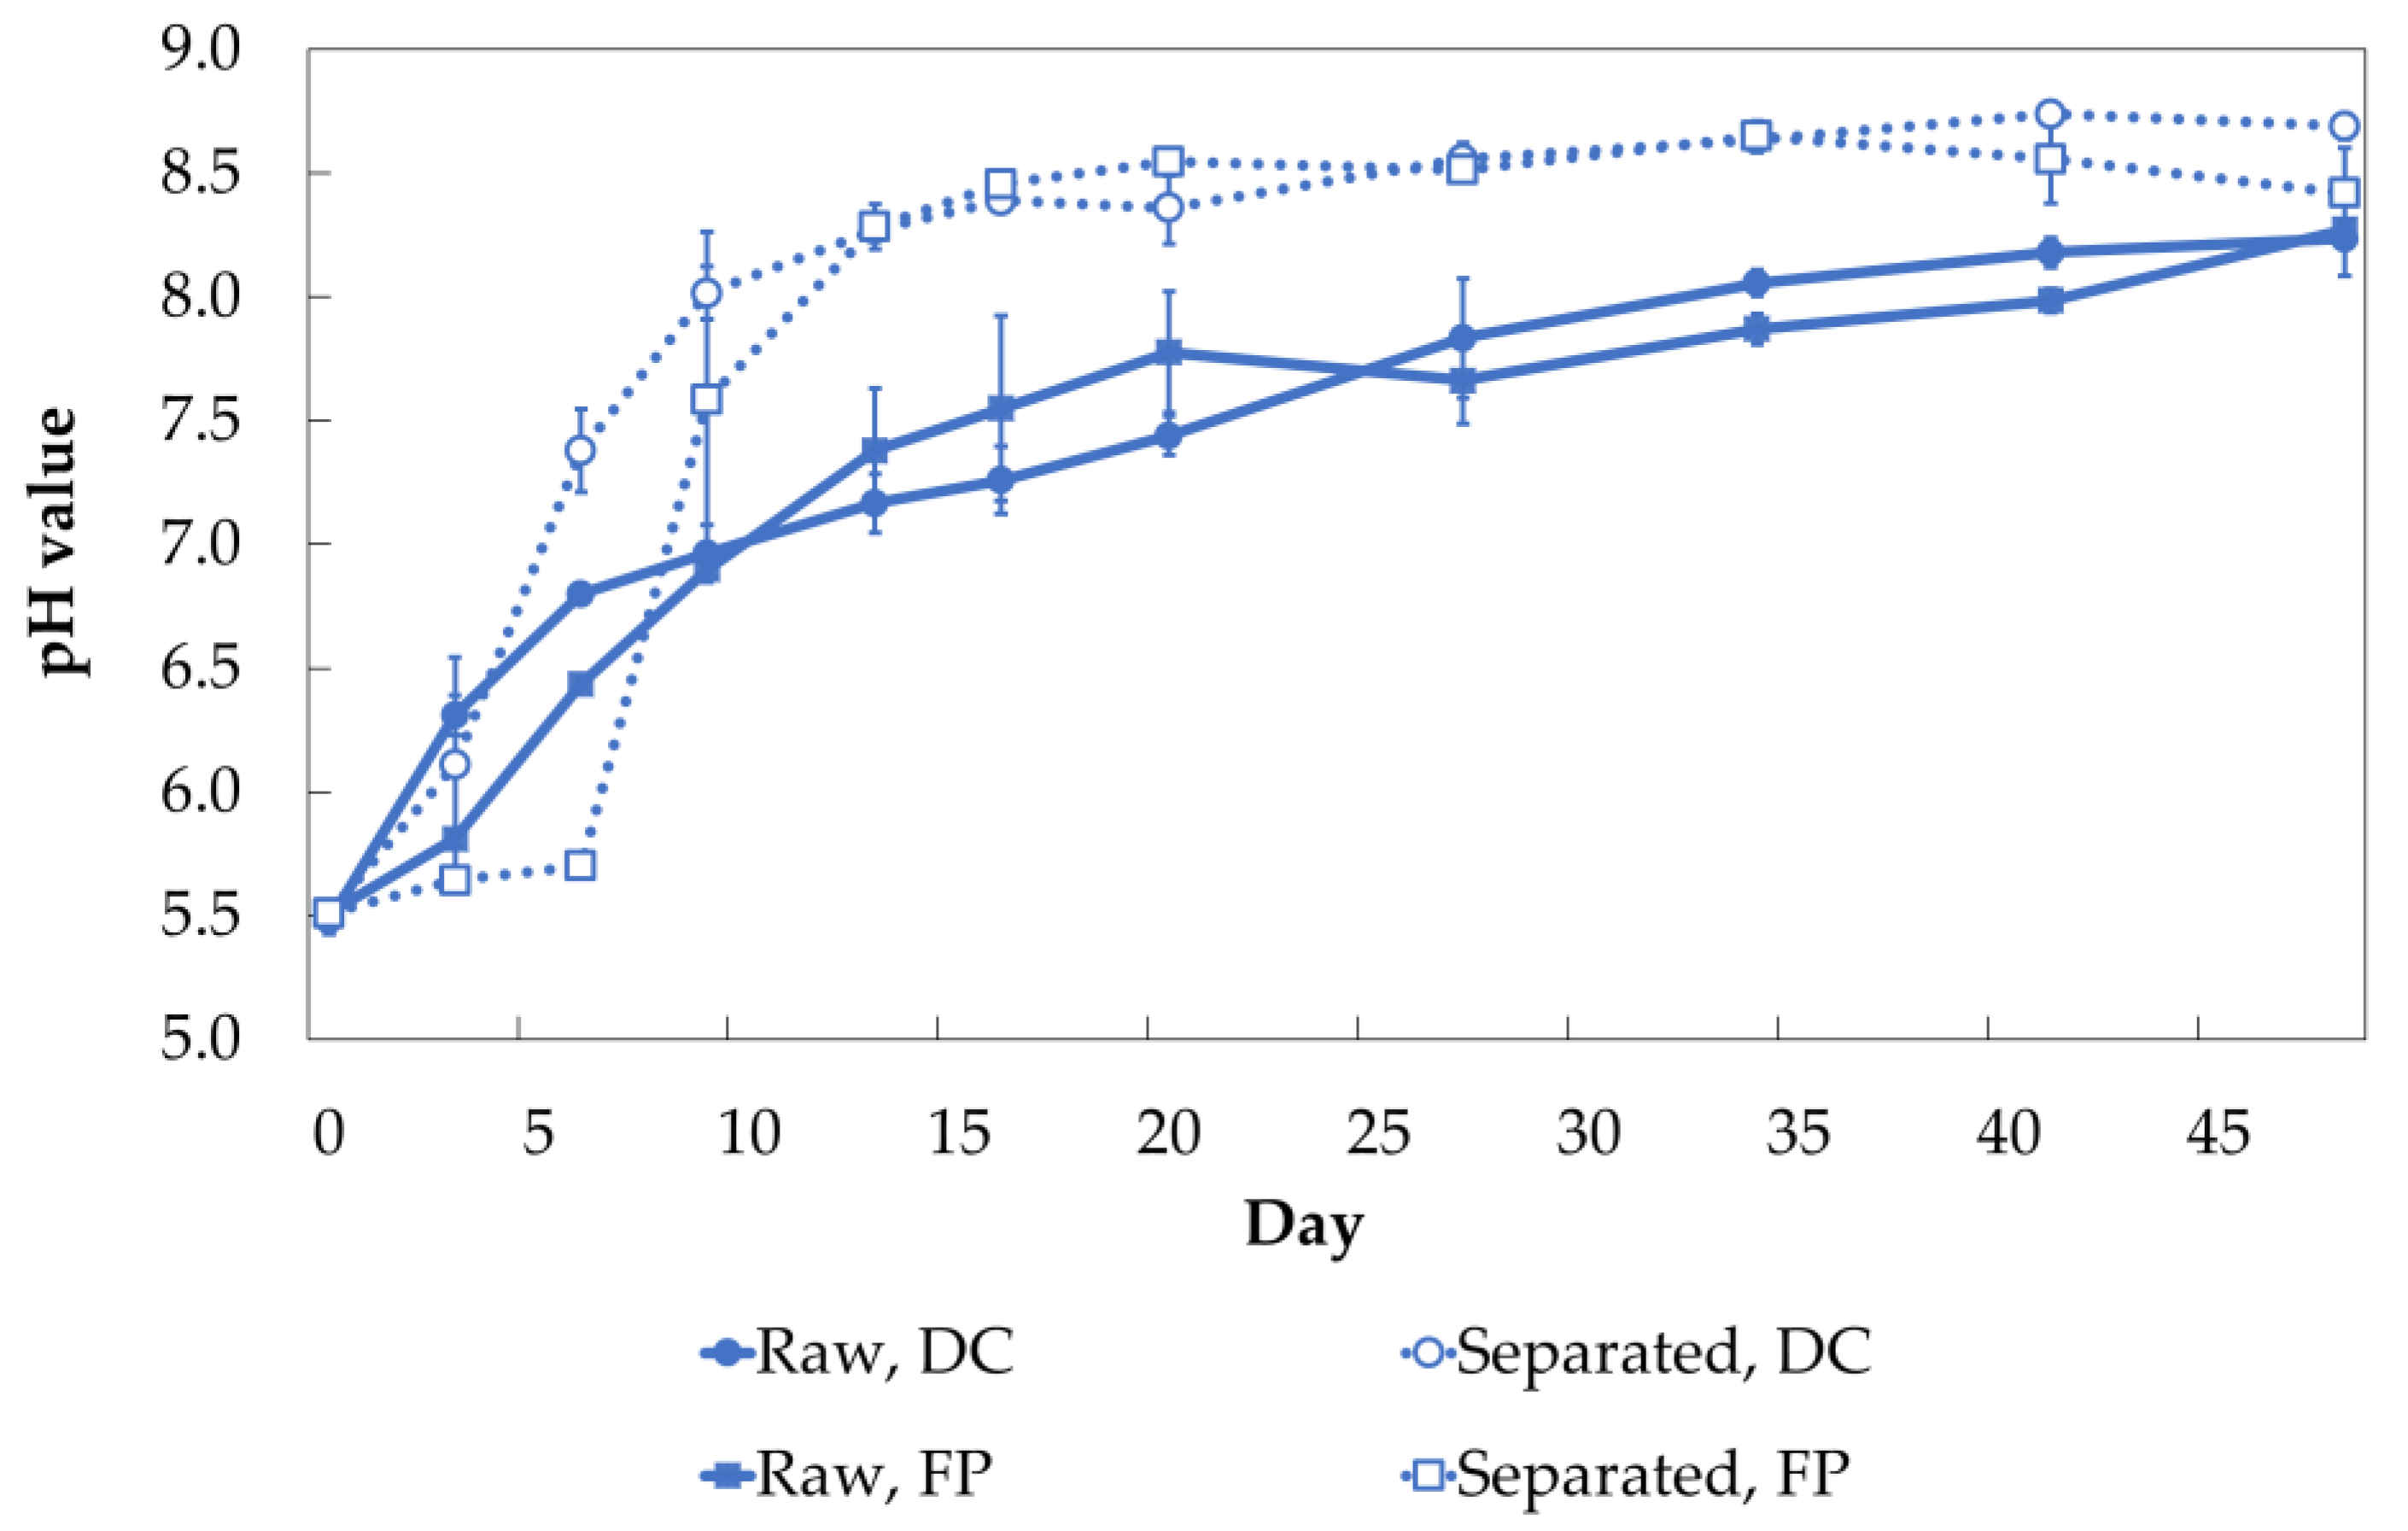
3.5. Separation before Acidification

The separation process reduced the dry matter content (fattening pig 8.3% to 1.3%; dairy cow 9.5% to 3.2%). In the first days after acidification, the pH value of the separated slurry hardly rose (fattening pig) or rose less (dairy cow) as compared with the raw slurry (Figure 5 and Table S5). In the second phase of storage (from day 9 or day 6), the pH value increased strongly and rapidly, but then remained relatively constant at around 8.6 until the end of storage. The raw slurries had a significantly slower pH increase. At the end of the storage period (day 48), the pH values of the acidified raw slurries were lower (8.27 and 8.24) than those of the acidified separated slurries (8.42 and 8.69).

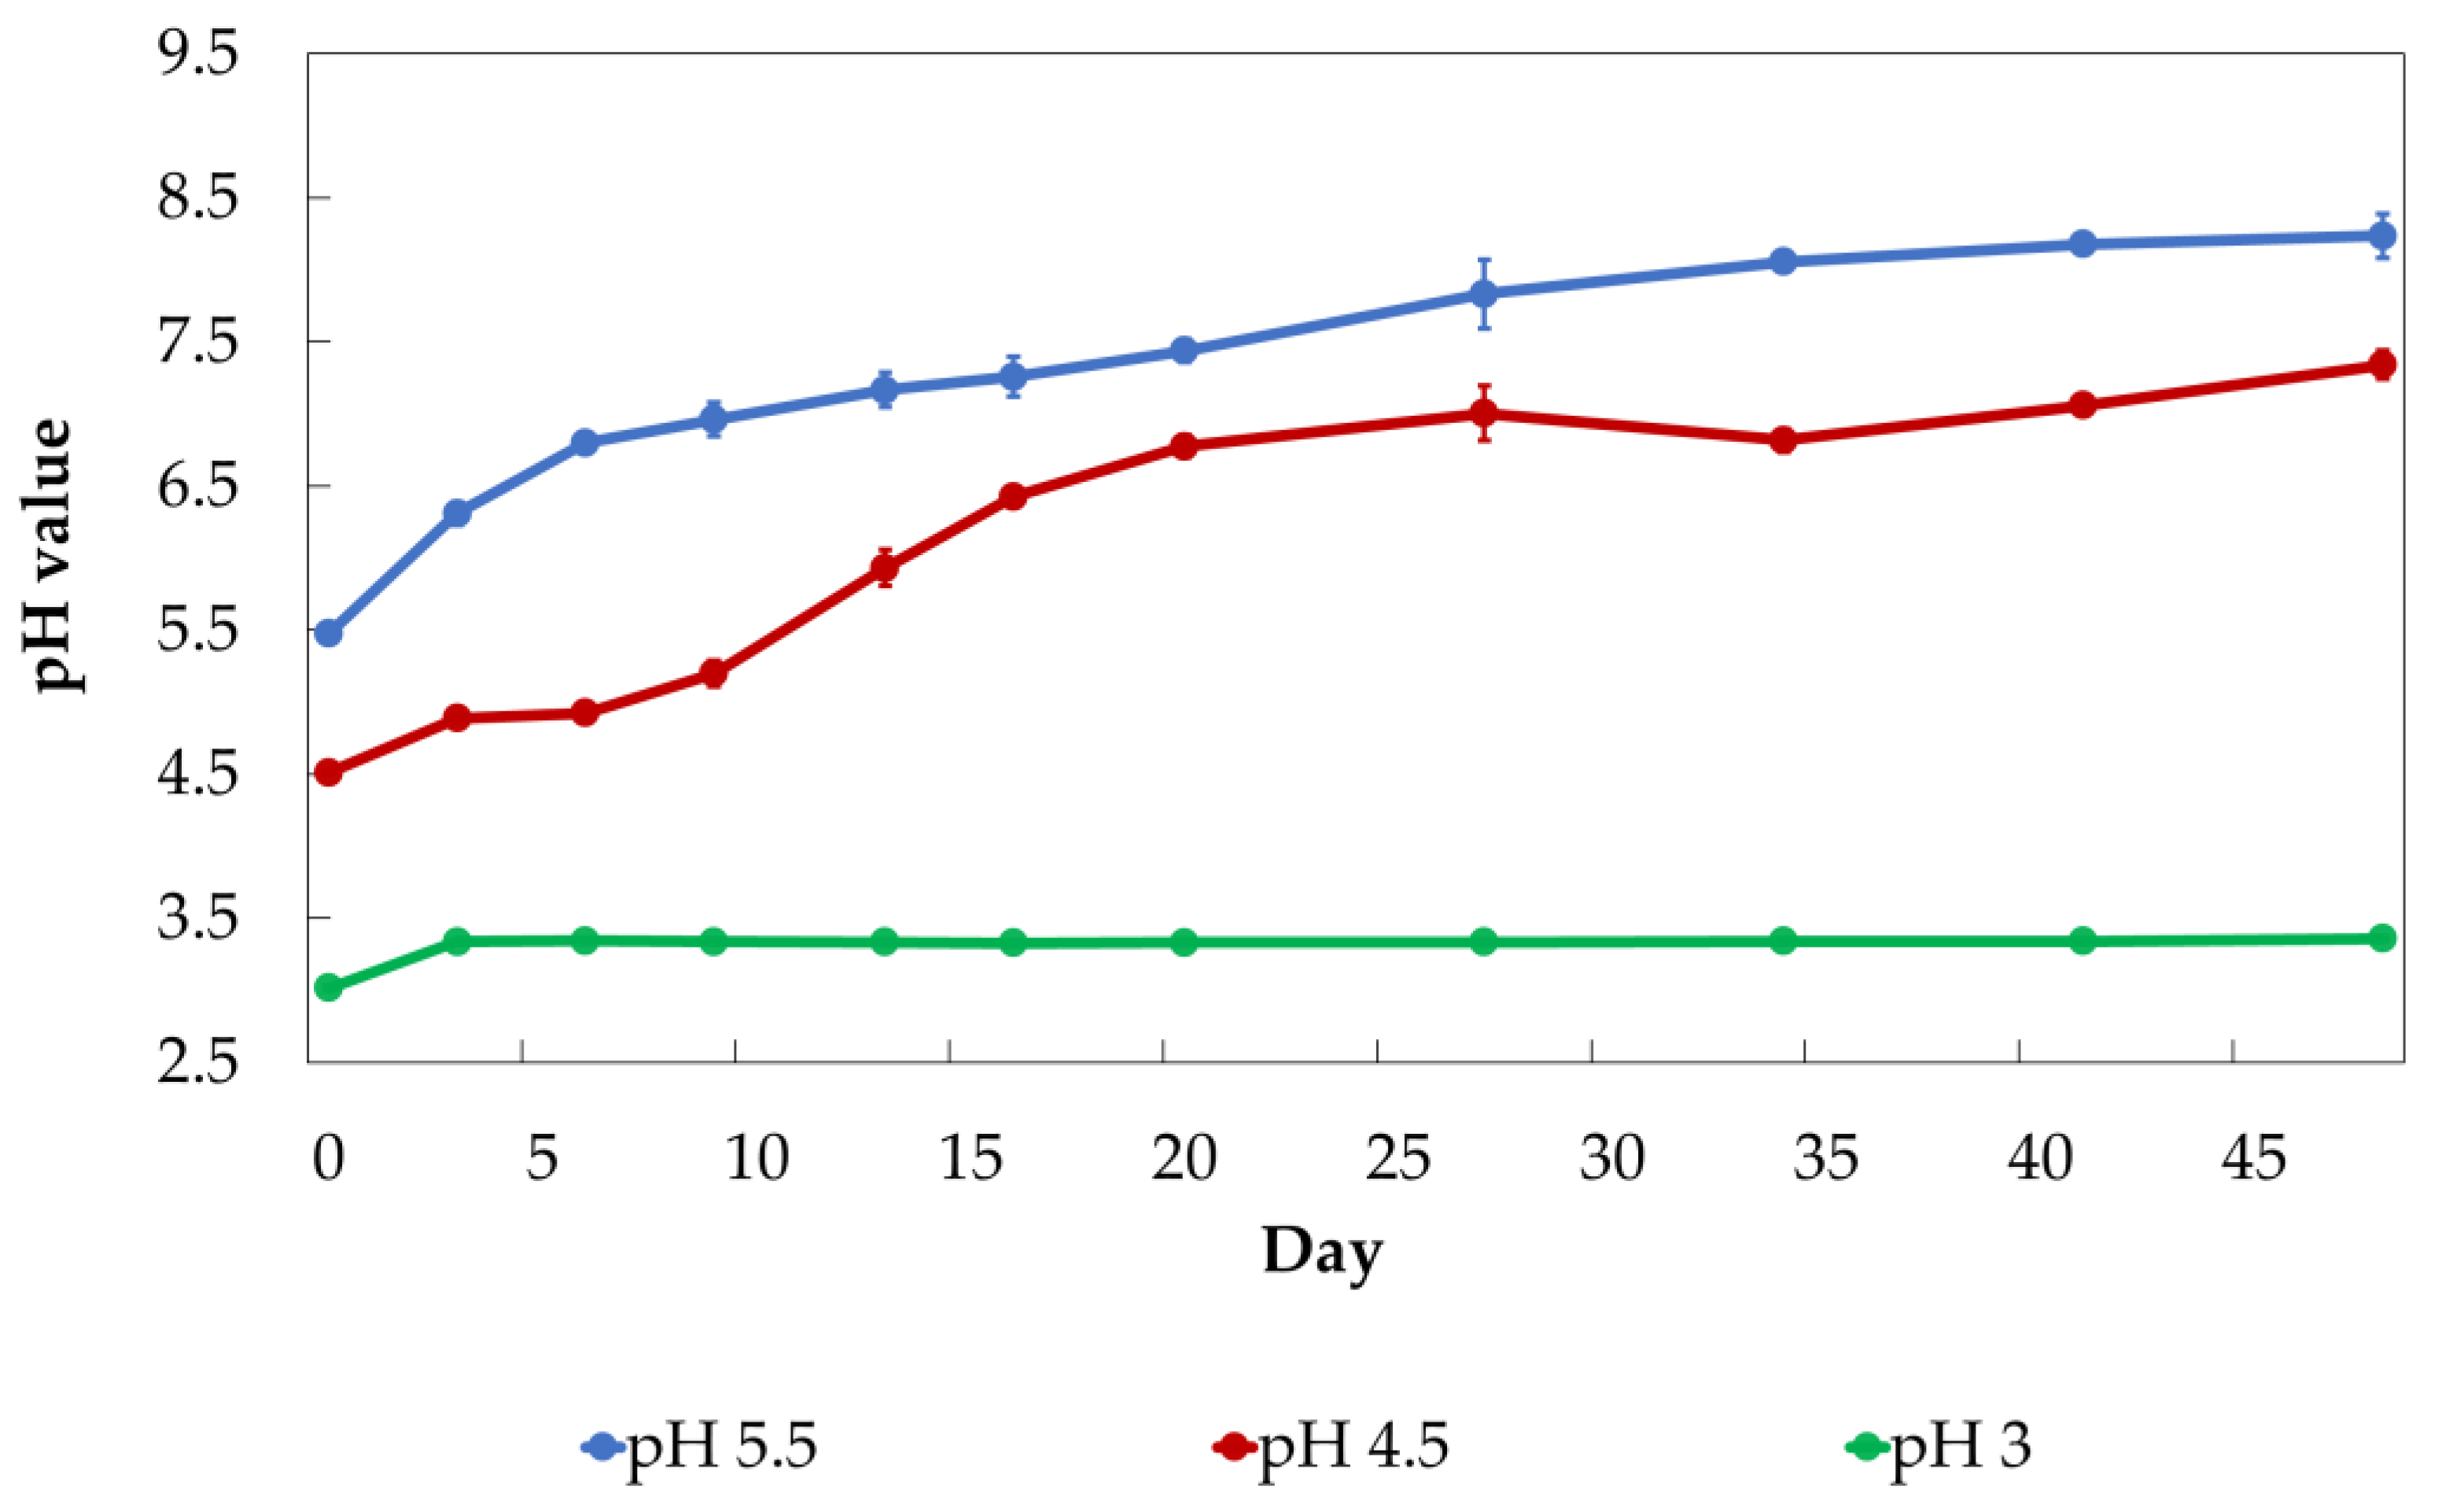
3.6. Different Target pH Values

Lowering the pH value to 4.5 resulted in a half as strong pH increase as compared with the acidified slurry to pH 5.5 by day 9 (+0.7 and +1.5 pH units, respectively). After 48 days, the difference between these two variants was 0.9 pH units, which approximately equals the initial difference in acidification (Figure 6 and Table S6). Acidification of the dairy cow slurry to pH 3.0 resulted in a permanently low pH value during the entire storage period. Nevertheless, the pH value also increased from a pH value from 3.0 to 3.3 in the first three days.

4. Discussion

4.1. Amount of Acid

The amount of acid required to reach the target pH value is strongly dependent on the different buffer capacities of the slurries. These can be described as a dynamic system because they are able to interact with each other [38,39]. The buffer capacities and their interaction are generally influenced, for example, by the ingredients of the slurry as well as by the temperature and time of storage [38].
In our investigation, the buffer capacity was approximately the same between the dairy cow and fattening pig slurry, because the same amount of acid was used. However, more than three times the amount of acid was required for sow slurry. This could be explained by several factors such as a high initial pH value or a low VFA content. Furthermore, carbonate is released during the decomposition of urea to ammonia [40]. Therefore, the high NH4-N content of the sow slurry (Table 2) also indicates a high carbonate content as compared with the other slurries. Since the carbonate buffer accounts for the largest share of the total buffering capacity of the slurry as compared with the VFA- and NH3-buffer [41], the high carbonate content in the sow slurry could also explain the large amount of acid needed to reach the pH value of 5.5.
Joubin [28] required for the acidification of fattening pig slurry to a pH value of 6.0 the same amount of acid equivalents of lactic, sulfuric and acetic acid, while the cattle slurry needed more lactic acid than sulfuric and acetic acid. In our investigation, however, the acid equivalents in the acidification of cattle slurry differed significantly (Table 3). Regueiro et al. [26] used more sulfuric and lactic acid as compared with acetic acid for acidification to a pH value of 5.5. We could not completely confirm this. In our investigation, the least H+ equivalents were used for acidification with lactic acid. The lactic acid has the lowest acid dissociation constant (pKa 3.13) of the organic acids, which influences the acidification process to a pH value of 5.5. Therefore, a lower amount of acid was required to achieve the target pH value because of the higher degree of acidity. The amount of acid depended on the buffer capacity of the slurry and also on the acid characteristic, as was also reported in [26].
The organic matter of slurry can be considered to be a cation exchanger [42]. Cations such as calcium (Ca2+) or magnesium (Mg2+) can be exchanged by protons. As a consequence, more acid is required to lower the pH value. This is why we were able to show in our study that the amount of acid can be reduced by a prior separation process, which was in agreement with the study of Fangueiro et al. [43]. This is also in line with Sommer and Husted [44] who reported from a residual alkalinity that is defined as a solid material from organic and inorganic origin. These solids can be removed by the separation process, resulting in a reduction of the buffer capacity in the liquid phase of the slurry. However, Joubin [28] observed that in dairy cow and fattening pig slurry more acid for the first acidification to pH 5.5 was needed in filtrated as compared with raw slurry. Furthermore, it was mentioned that the total amount of acid including re-acidifications used during a storage period of two months was higher in the filtrated slurry. Other factors than only the dry residue may have been affected by the filtration. These may have influenced the buffer capacity [28].
When considering the amount of acid in our study (Table 3), it is important to note that dilute acids were used in order to improve the accuracy of the measurement parameters during the titration. In practice, much higher concentrated acids are usually used [14,15], which has the advantage of reducing storage capacity.

4.2. pH Value during Storage

Long-term pH reduction could only be observed if slurry is acidified to pH 3.0 (Figure 6). Apart from that, the pH value of all treatments in our investigation increased again during the storage period of 48 days. The pH increase in acidified and non-acidified slurry may be attributed to the mineralization of organic nitrogen and the degradation of organic acids which caused an increased bicarbonate concentration [26,36,37,38,45,46]. However, acidification affects the buffer capacity of the slurry leading, for example, to a reduction in the carbonate buffer of the acidified slurry due to the release of gaseous carbon dioxide [10].
Regueiro et al. [26] observed a strong increase in pH value after acidification within the first 20 days. In our investigation, the pH increase was also highest during this period (Figure 1, Figure 2, Figure 3, Figure 4 and Figure 5). Other authors have also observed a continuous pH increase of acidified pig slurry (with sulfuric acid), independent of storage temperature [25]. Joubin [28] reported a pH increase within the first 10 days after acidification from a pH of 6.0 to a pH of 7.0 and 6.7 for cattle and pig slurry, respectively. In this mentioned study, sulfuric acid had a slightly better effectiveness as compared with lactic and acetic acid [28]. The organic acids also resulted in a faster pH increase in our investigation (Figure 2), which also agrees with [26]. The decomposition of the organic acids used for acidification increased the formation of the carbonate buffer, resulting in a faster pH increase than could be observed during acidification with mineral acids.
In the group of the investigated organic acids, the amount of acid required to acidify the slurry was lowest in the lactic acid, which had the advantage that less (alkaline) carbonate was formed as compared with all other organic acids. This had a positive effect on the long-term stability of the pH value, as a strong increase in the pH value was avoided (Figure 2). In addition, the part of lactic acid which was not yet degraded had a stronger effect than the other organic acids due to its lower pKa value (Table 1).
The temperature during storage influences the progress of biodegradation processes, and thus also the pH value increase. The authors of [15] and [38] observed a faster pH increase during warm storage than during cold storage. This effect could not be considered in our investigation due to capacity constraints, therefore the storage was only carried out at laboratory temperature (approximately 22 °C).
In the study by Eriksen et al. [27] laboratory acidification of both fresh (pH 4.5) and aged cattle slurry (pH 4.9) with hydrochloric acid resulted in a pH increase to about 6.4 after 90 days. An increase of 0.9 pH units during storage was also observed for freshly acidified slurry on farms (pH 5.6) [27]. In our investigation, the slurry was at least one week old. Possibly, the pH increase caused by the degradation of volatile fatty acids and the formation of the carbonate buffer in the first weeks after excretion [38] led to an even stronger pH increase after the acidification had been conducted. Other authors have also suggested that the degradation of dissociated organic acids was responsible for the pH increase after acidification [26,45,46]. The more organic matter the slurry contains, which can also be seen in the dry residue content (Table 2), the more VFA can be formed [38,42]. These, in turn, increase the pH value again through the transformation to carbonate, and therefore the acid effect is overcome. The carbonate degasses as carbon dioxide [42,47], which reduces the buffer capacity [38]. In our investigated sow slurry, there was hardly any organic matter and VFA, therefore, there was a low carbonate formation. This could be the reason why the pH value of the slurry acidified with sulfuric acid remained relatively and constantly low, since, on the one hand, the acid effect of the sulfuric acid was not overcome by the buffers formed during storage (Figure 1). The lactic acid, on the other hand, was degraded, which could thus lead to an increase in the pH value of sow slurry.
In the anaerobic storage of acidified slurry, a relatively strong pH increase was observed only in the first days after acidification. This could be due to the degradation of VFA, which has also occurred in anaerobic conditions. Thereafter, a constantly low pH value was observed during anaerobic storage. This coincided with the authors of [39], who observed a slightly higher pH increase in aerated acidified slurry for both pig and cattle slurry as compared with non-aerated acidified slurry. In a study by Berg [16], the acidification of pig slurry with lactic acid and additional covering with perlite reduced NH3 and partly also CH4 emissions during storage more than in the case if only acidification was carried out without covering. Kupper et al. [5] reported that covering non-acidified slurry with permeable synthetic or natural floating covers could lead to an increase in methane emissions. However, since acidification prevents the formation of methane in the slurry, acidified slurry can be stored anaerobically without problems. Thus, in addition to ammonia emissions, methane emissions can also be reduced by a combination of acidification and covering of the slurry. Berg et al. [21] showed that there was a reduction of the pH value to below 5.5 in the first two weeks when the perlites were mixed with lactic acid. A mixture of straw and lactic acid was not as effective [21]. Contact with oxygen on the surface of the slurry can accelerate the conversion processes. This leads to the degradation of organic matter so that more carbonate is available to form the carbonic acid-bicarbonate buffer, which in turn leads to an increase in the pH value [38]. In our investigation, a similar effect was observed in aerobically stored slurry as compared with anaerobically stored slurry, as the pH value increased faster in aerobically storage conditions (Figure 3).
The sample bottles we used in our investigation were relatively small, therefore, the atmospheric oxygen when stored aerobically was able to diffuse through the entire slurry. In this case, our investigation shows the pH value and conversion processes at the surface level of the slurry in commercial storage tanks. Ammonia emissions also occur in this layer [48]. Sample bottles that were stored anaerobically provide information about these processes at deeper levels or if the surface is covered. Furthermore, it is noticeable that the pH value of the samples acidified with lactic and sulfuric acid was the same after 48 days of storage under anaerobic conditions (pH value 6.3). This indicates that organic and mineral acids have the same effect on the pH value during long-term anaerobic storage of slurry. In the case of anaerobic storage, organic acids could therefore also lead to a good low pH stability after a one-time acidification process.
Misselbrook et al. [15] reported that the pH value, which was measured 10 cm below the surface, was between 0 and 0.1 pH units lower than at the surface of cattle slurry. Berg et al. [1] found only slight differences between the pH value at the surface and in the sediment, especially in acidified slurry. We stirred the samples before each measurement, and therefore we could not consider the pH value in different layers. However, Hörnig et al. [49] also observed an increase in pH value because of complete homogenization of the samples in the case of acidified slurry at pH values of 4.3 and 4.8, whereas they found no effect for the samples acidified to pH 3.8 [49]. Possibly, the pH value is then already so low that no more biological conversion processes can take place, and therefore these processes cannot be affected by the atmospheric oxygen (Figure 6).
The authors of [20] and [21] observed that the coverage of the slurry with straw or perlite and addition of saccharose resulted in a significantly lower pH value than the coverage of slurry alone (without additives) after several months of storage. Studies have also shown that the addition of lactic acid instead of saccharose led to an even better pH value reduction [20,21]. Clemens et al. [34] were also able to achieve a reduction of the pH value below 5.5 by adding 0.1 mol glucose L−1 slurry. In our investigation, the addition of glucose (besides sulfuric acid) to the slurry resulted in a lower pH value in the first week as compared with acidification alone. The glucose was probably degraded to VFA (first week after acidification), which resulted, similar to the addition of organic acids, in a decrease in the pH value, which compensated for the general pH increase. Immediately after degradation of the VFA and the resulting strengthening of the carbonate buffer, the pH value consequently increased more than it had been observed for the acid-only variant (second week after acidification). This effect was especially noticeable for acidified sow slurry. In another study, however, a permanent pH reduction to pH 4.0 due to the addition of sugar (0.5 mol glucose L−1 slurry) in co-fermented mixed slurry was found even after 40 days of storage. This might be caused by the lower buffer capacity [50] and the higher glucose addition as compared with our investigation. In addition, in our investigated sow slurry, only a small buffer capacity could be provided by the decomposition of the organic matter.
Fangueiro et al. [51] did not observe an increase in pH value during the storage period of 22 days, neither in high-fiber nor in separated cattle slurry. In their study parts of the slurry were acidified to 5.5 with sulfuric acid. Again, there was no change in pH value at the end of the storage period [51]. Hörnig et al. [49] also found no effect on the pH value during storage due to a difference of 2.6% in dry residue content in acidified dairy cow slurry. The separated slurry contained hardly any organic substances that could be degraded quickly. Therefore, in our investigation, the pH increase was lower than in the raw slurry in the first week after acidification. As the separated slurry had a much lower buffer capacity (lower amount of acid to adjust the pH value 5.5, see Section 3.1), even a small degradation of the organic matter led to a strong pH increase from the first week. In addition, a smaller amount of acid was required for the acidification of separated slurry than in raw slurry. Therefore, the acid could be neutralized faster in separated slurry. Although separation allows better nutrient export, the solid phase must also be considered to be an emission source [52]. These emissions could be reduced by composting, anaerobic digestion or acidification [53,54,55].
Hörnig et al. [49] reported a constant pH value when acidifying dairy cow slurry with lactic or nitric acid to around a pH value of 4.0 as compared with target pH values of 4.5 and 5.0. Another study showed that even when acidifying dairy cow and pig slurry with different acids to pH value 3.5, the pH value could not remain constantly low. The greatest pH increase was between 15 and 20 days after acidification [26]. Whereas in our investigation, the greatest pH increase in this period was in the slurry acidified to a pH value of 4.5. Berg et al. [1] acidified cattle slurry with lactic acid to different pH values (3.8, 4.3, and 4.8); only acidification to a pH value of 3.8 resulted in a steady low pH value over 150 days, whereas the other two variants had to be post-acidified at irregular intervals (first post-acidification after 63 days) [1]. In addition, this study showed that a strong initial acidification of the slurry (pH 3.8) as it was shown in our investigation (pH 3.0), leads to a steady low pH value. Nevertheless, in our investigation, a relatively strong pH increase was observed (+0.3 and +0.4 pH units, respectively) in both pH 3.0 and 4.5 acidified slurry during the first three days after acidification. It suggests that the pH increase is not biological but partly caused by chemical reactions. This might be explained by carbonates in the slurry, which dissolve slowly after the acidification and partially neutralize the acidifying effect of sulfuric acid.
However, acidification to a pH value of 3.0 does not seem practical because a low pH value leads to a decrease in the growth or loss of yields [56,57]. Furthermore, a large amount of acid is necessary to reduce the pH value. This would increase the cost of acid and the need for lime to maintain soil pH value.
The fact that after acidification to a pH value of 5.5 a constantly low pH value could not be observed, allows the conclusion to be drawn that although NH3 emissions are reduced, the microbiological conversion processes are not yet inhibited at this pH value.

5. Conclusions

Microbial degradation of organic matter in the slurry results in the formation of carbonate and ammonium and thus to an increase in pH value. Acidification of the slurry to a pH value of 5.5 prevents the release of ammonia and the formation of methane, but does not completely prevent the decomposition of organic matter. This is only possible at pH values below 4. Thus, even with acidified slurry, the pH inevitably rises again over time. Under aerobic conditions, the decomposition of organic matter, and thus the pH increase occurs very quickly. Under anaerobic conditions, it is considerably delayed. Separated slurry contains less organic matter. Therefore, separated slurry requires a smaller amount of acid for acidification than raw slurry. Since, in separated slurry, less organic matter could be degraded, the pH increase is delayed as compared with raw slurry. However, a degradation of the still slightly available organic matter and the reduced buffer capacity leads to a stronger pH increase. Therefore, prolonged storage of the separated acidified slurry is not recommended.
In principle, any acid is suitable for acidifying slurry to a pH value of 5.5. Even the organic acids, which are formed by the decomposition of easily degradable organic compounds, are able to do this. However, the organic acids themselves are degraded during storage. This is the reason why the pH value increases faster than in the case of slurry acidified with mineral acids. After only three days, the pH value may have risen again to such an extent that efficient mitigation of methane formation and ammonia release is no longer possible.
Low temperatures or anaerobic conditions during storage can considerably delay the degradation of the organic matter. This can improve the efficiency of acidification especially with organic acids.
Although it has been shown that there are appropriate alternative acids to sulfuric acid, it still seems to be the best in regard to the required amount and costs of acid. However, to avoid sulfur over fertilization to soils, the combination of organic acids and anaerobic storage represents a useful alternative for acidification of slurry.
One-time acidification of slurry is suitable to lower the pH value of slurry just before field application, and therefore ammonia emissions are reduced during application. It is not suitable for permanently reducing methane formation and ammonia emissions in the barn or in storage tanks due to the increase in pH value. This would need repeated or continuous acidification.

Supplementary Materials

The following are available online at https://www.mdpi.com/article/10.3390/agronomy11071319/s1, Table S1: The pH value of dairy cow, fattening pig, and sow slurry, and pH value after acidification with lactic or sulfuric acid during storage period of 48 days (means ± SD, n = 3), Table S2: The pH value of dairy cow slurry after acidification with different organic or mineral acids during storage period of 48 days (means ± SD, n = 3), Table S3: The pH value of dairy cow slurry after acidification with sulfuric or lactic acid under aerobic or anaerobic storing conditions during storage period of 48 days (means ± SD, n = 3), Table S4: The pH value of dairy cow, fattening pig, and sow slurry after acidification with sulfuric acid or in combination with glucose addition (0.01 mol glucose kg−1 slurry) during storage period of 48 days (means ± SD, n = 3), Table S5: The pH value of dairy cow and fattening slurry (raw and separated slurry) after acidification with sulfuric acid during storage period of 48 days (means ± SD, n = 3), Table S6: The pH value of dairy cow slurry after acidification with sulfuric acid to pH values of 5.5, 4.5, and 3 during a storage period of 48 days (means ± SD, n = 3).

Author Contributions

Conceptualization, V.O., A.K., J.C., W.B. and M.T.; methodology, V.O., A.K. and M.T.; software, V.O. and A.K.; validation, V.O., A.K. and M.T.; formal analysis, V.O., A.K. and M.T.; investigation, V.O. and A.K.; resources, W.B. and M.T.; data curation, V.O., A.K., J.C. and M.T.; writing—original draft preparation, V.O. and A.K.; writing—review and editing, J.C., W.B. and M.T.; visualization, V.O. and A.K.; supervision, M.T.; project administration, J.C. and W.B.; funding acquisition, J.C., W.B. and M.T. All authors have read and agreed to the submitted version of the manuscript.

Funding

This research is supported by the Federal Ministry of Food and Agriculture (BMEL) based on a decision of the Parliament of the Federal Republic of Germany via the Federal Office for Agriculture and Food (BLE) under the innovation support program, grant number 281B102316. This work was supported by the Open Access Publication Fund of the University of Bonn.

Data Availability Statement

The data presented in this study are available in Supplementary Material Table S1–S6.

Acknowledgments

The authors thank the three farmers for their support.

Conflicts of Interest

The authors declare no conflict of interest. The funders had no role in the design of the study; in the collection, analyses, or interpretation of data; in the writing of the manuscript, or in the decision to publish the results.

References

  1. Berg, W.; Türk, M.; Hellebrankd, H.J. Effects of acidifying liquid cattle manure with nitric or lactic acid on gaseous emissions. In Proceedings of the Workshop on Agricultural Air Quality, Potomac, MD, USA, 5–8 June 2006; pp. 492–498. [Google Scholar]
  2. Ti, C.; Xia, L.; Chang, S.X.; Yan, X. Potential for mitigating global agricultural ammonia emission: A meta-analysis. Environ. Pollut. 2019, 245, 141–148. [Google Scholar] [CrossRef]
  3. IPCC. Climate Change and Land: An IPCC Special Report on Climate Change, Desertification, Land Degradation, Sustainable Land Management, Food Security, and Greenhouse Gas Fluxes in Terrestrial Ecosystems. 2019. Available online: https://www.ipcc.ch/site/assets/uploads/2019/08/4.-SPM_Approved_Microsite_FINAL.pdf (accessed on 23 June 2021).
  4. IPCC. Global Warming of 1.5 °C. An IPCC Special Report on the Impacts of Global Warming of 1.5 °C above Pre-Industrial Levels and Related Global Greenhouse Gas Emission Pathways, in the Context of Strengthening the Global Response to the Threat of Climate Change, Sustainable Development, and Efforts to Eradicate Poverty. 2018. Available online: https://www.ipcc.ch/site/assets/uploads/sites/2/2019/06/SR15_Full_Report_High_Res.pdf (accessed on 23 June 2021).
  5. Kupper, T.; Häni, C.; Neftel, A.; Kincaid, C.; Bühler, M.; Amon, B.; Vanderzaag, A. Ammonia and greenhouse gas emissions from slurry storage—A review. Agric. Ecosyst. Envrion. 2020, 300, 106963. [Google Scholar] [CrossRef]
  6. Amon, B.; Kryvoruchko, V.; Amon, T.; Zechmeister-Boltenstern, S. Methane, nitrous oxide and ammonia emissions during storage and after application of dairy cattle slurry and influence of slurry treatment. Agric. Ecosyst. Envrion. 2006, 112, 153–162. [Google Scholar] [CrossRef]
  7. Erisman, J.W.; Bleeker, A.; Hensen, A.; Vermeulen, A. Agricultural air quality in Europe and the future perspectives. Atmos. Environ. 2008, 42, 3209–3217. [Google Scholar] [CrossRef] [Green Version]
  8. Krupa, S. Effects of atmospheric ammonia (NH3) on terrestrial vegetation: A review. Environ. Pollut. 2003, 124, 179–221. [Google Scholar] [CrossRef]
  9. Arogo, J.; Westerman, P.W.; Heber, A.J.; Robarge, W.P.; Classen, J.J. Ammonia emissions from animal feeding operations. In Animal Agriculture and the Environment, National Center for Manure & Animal Waste Management White Papers; Rice, J.M., Caldwell, D.F., Humenik, F.J., Eds.; ASABE: St. Joseph, MI, USA, 2006; pp. 41–48. [Google Scholar]
  10. Fangueiro, D.; Hjorth, M.; Gioelli, F. Acidification of animal slurry—A review. J. Environ. Manag. 2015, 149, 46–56. [Google Scholar] [CrossRef]
  11. Conn, K.L.; Topp, E.; Lazarovits, G. Factors influencing the concentration of volatile fatty acids, ammonia, and other nutrients in stored liquid pig manure. J. Environ. Qual. 2007, 36, 440–447. [Google Scholar] [CrossRef] [Green Version]
  12. Arogo, J.; Westerman, P.W.; Liang, Z.S. Comparing Ammonium Ion Dissociation Constant in Swine Anaerobic Lagoon Liquid and Deionized Water. Trans. ASAE 2003, 46, 1415–1419. [Google Scholar] [CrossRef]
  13. Wang, K.; Huang, D.; Ying, H.; Luo, H. Effects of acidification during storage on emissions of methane, ammonia, and hydrogen sulfide from digested pig slurry. Biosyst. Eng. 2014, 122, 23–30. [Google Scholar] [CrossRef]
  14. Hjorth, M.; Cocolo, G.; Jonassen, K.; Abildgaard, L.; Sommer, S.G. Continuous in-house acidification affecting animal slurry composition. Biosyst. Eng. 2015, 132, 56–60. [Google Scholar] [CrossRef]
  15. Misselbrook, T.; Hunt, J.; Perazzolo, F.; Provolo, G. Greenhouse gas and ammonia emissions from slurry storage: Impacts of temperature and potential mitigation through covering (pig slurry) or acidification (cattle slurry). J. Environ. Qual. 2016, 45, 1520–1530. [Google Scholar] [CrossRef]
  16. Berg, W. Emission Abatement through pH value reducing slurry covers. Agric. Eng. 2002, 57, 274–275. [Google Scholar] [CrossRef]
  17. Stevens, R.J.; Laughlin, R.J.; Frost, J.P. Effect of acidification with sulphuric acid on the volatilization of ammonia from cow and pig slurries. J. Agric. Sci. 1989, 113, 389–395. [Google Scholar] [CrossRef]
  18. Nyord, T.; Liu, D.; Eriksen, J.; Adamsen, A. Effect of acidification and soil injection of animal slurry on ammonia and odour emissions. In Proceedings of the 15th RAMIRAN Conference, Versailles, France, 3–5 June 2013. [Google Scholar]
  19. Panetta, D.M.; Powers, W.J.; Lorimor, J.C. Management strategy impacts on ammonia volatilization from swine manure. J. Environ. Qual. 2005, 34, 1119–1130. [Google Scholar] [CrossRef]
  20. Berg, W.; Pazsiczki, I. Mitigation of methane emissions during manure storage. Int. Congr. Ser. 2006, 1293, 213–216. [Google Scholar] [CrossRef]
  21. Berg, W.; Brunsch, R.; Pazsiczki, I. Greenhouse gas emissions from covered slurry compared with uncovered during storage. Agric. Ecosyst. Envrion. 2006, 112, 129–134. [Google Scholar] [CrossRef]
  22. ten Hoeve, M.; Nyord, T.; Peters, G.M.; Hutchings, N.J.; Jensen, L.S.; Bruun, S. A life cycle perspective of slurry acidification strategies under different nitrogen regulations. J. Clean. Prod. 2016, 127, 591–599. [Google Scholar] [CrossRef]
  23. Loide, V.; Saue, T.; Võsa, T.; Tamm, K. The effect of acidified slurry on crop uptake and leaching of nutrients from a loamy topsoil. Acta Agric. Scand. Sect. B Soil Plant Sci. 2020, 70, 31–38. [Google Scholar] [CrossRef]
  24. Vestergaard, A.V. Status, Economy and Consideration by Acidification of Slurry. 2017. Available online: http://balticslurry.eu/wp-content/uploads/2017/03/SEGES-review-Slurry-acidification.pdf (accessed on 23 June 2021).
  25. Eriksen, J.; Sørensen, P.; Elsgaard, L. The fate of sulfate in acidified pig slurry during storage and following application to cropped soil. J. Environ. Qual. 2008, 37, 280–286. [Google Scholar] [CrossRef] [Green Version]
  26. Regueiro, I.; Coutinho, J.; Fangueiro, D. Alternatives to sulfuric acid for slurry acidification: Impact on slurry composition and ammonia emissions during storage. J. Clean. Prod. 2016, 131, 296–307. [Google Scholar] [CrossRef]
  27. Eriksen, J.; Andersen, A.J.; Poulsen, H.V.; Adamsen, A.P.S.; Petersen, S.O. Sulfur turnover and emissions during storage of cattle slurry: Effects of acidification and sulfur addition. J. Environ. Qual. 2012, 41, 1633–1641. [Google Scholar] [CrossRef] [PubMed] [Green Version]
  28. Joubin, M. Animal Slurry Acidification: Effects of Slurry Characteristics, Use of Different Acids, Slurry pH Buffering; RISE Rapport 2018:15; RISE Research Institutes of Sweden: Uppsala, Sweden, 2018; Available online: http://balticslurry.eu/wp-content/uploads/2018/03/RISE-Rapport-15-2018_web.pdf (accessed on 23 June 2021).
  29. Regueiro, I.; Coutinho, J.; Fangueiro, D. Comparison of different approaches for ammonia emissions minimization by acidification of dairy and pig slurries. In Proceedings of the RAMIRAN 2013: 15th International Conference, Versailles, France, 2013; Bacheley, H., Cambier, P., Cheviron, N., Formisano, S., Houot, S., Lepeuple, A.-S., Revallier, A., Vallez, G., Eds.; Verlag nicht Ermittelbar: Versailles, France, 2013; ISBN 9782738013378. [Google Scholar]
  30. Bittman, S.; Dedina, M.; Howard, C.M.; Oenema, O.; Sutton, M.A. Options for Ammonia Mitigation: Guidance from the UNECE Task Force on Reactive Nitrogen; Centre for Ecology & Hydrology, on behalf of Task Force on Reactive Nitrogen, of the UNECE Convention on Long Range transboundary Air Pollution: Edinburgh, UK, 2014; ISBN 978-1-906698-46-1. [Google Scholar]
  31. Dai, X.R.; Blanes-Vidal, V. Emissions of ammonia, carbon dioxide, and hydrogen sulfide from swine wastewater during and after acidification treatment: Effect of pH, mixing and aeration. J. Environ. Manag. 2013, 115, 147–154. [Google Scholar] [CrossRef] [PubMed]
  32. Sindhöj, E.; Rodhe, L. Examples of Implementing Manure Processing Technology at Farm Level: Knowledge Report; JTI-Swedish Institute of Agricultural and Environmental Engineering: Uppsala, Sweden, 2013; Available online: https://www.ecsab.com/BM_ManureProcessingReport.pdf (accessed on 23 June 2021).
  33. Locher, F.W. Chemischer Angriff auf Beton. In Technisch-Wissenschaftliche Zementtagung; Verein Deutscher Zementwerke: München, Germany, 1966. [Google Scholar]
  34. Clemens, J.; Bergmann, S.; Vandré, R. Reduced ammonia emissions from slurry after self-acidification with organic supplements. Environ. Technol. 2002, 23, 429–435. [Google Scholar] [CrossRef] [PubMed]
  35. Bastami, M.; Jones, D.; Chadwick, D. Mitigating greenhouse gas and ammonia emissions from stored slurry through the addition of brewing sugar and a biological additive. BJECC 2016, 6, 236–249. [Google Scholar] [CrossRef]
  36. Husted, S.; Jensen, L.S.; Jørgensen, S.S. Reducing ammonia loss from cattle slurry by the use of acidifying additives: The role of the buffer system. J. Sci. Food Agric. 1991, 57, 335–349. [Google Scholar] [CrossRef]
  37. Sommer, S.G.; Husted, S. A simple model of pH in slurry. J. Agric. Sci. 1995, 124, 447–453. [Google Scholar] [CrossRef]
  38. Overmeyer, V.; Holtkamp, F.; Clemens, J.; Büscher, W.; Trimborn, M. Dynamics of different buffer systems in slurries based on time and temperature of storage and their visualization by a new mathematical tool. Animals 2020, 10, 724. [Google Scholar] [CrossRef] [Green Version]
  39. Sørensen, P.; Eriksen, J. Effects of slurry acidification with sulphuric acid combined with aeration on the turnover and plant availability of nitrogen. Agric. Ecosyst. Envrion. 2009, 131, 240–246. [Google Scholar] [CrossRef]
  40. Sigurdarson, J.J.; Svane, S.; Karring, H. The molecular processes of urea hydrolysis in relation to ammonia emissions from agriculture. Rev. Environ. Sci. Biotechnol. 2018, 17, 241–258. [Google Scholar] [CrossRef] [Green Version]
  41. Georgacakis, D.; Sievers, D.M.; Iannotti, E.L. Buffer stability in manure digesters. Agric. Wastes 1982, 4, 427–441. [Google Scholar] [CrossRef]
  42. Christensen, M.L.; Sommer, S.G. Manure characterisation and inorganic chemistry. In Animal Manure: Recycling, Treatment, and Management; Jensen, L.S., Christensen, M.L., Sommer, S.G., Schmidt, T., Eds.; John Wiley & Sons Inc.: Chichester, UK, 2013; pp. 41–65. ISBN 9781118676677. [Google Scholar]
  43. Fangueiro, D.; Pereira, J.L.; Macedo, S.; Trindade, H.; Vasconcelos, E.; Coutinho, J. Surface application of acidified cattle slurry compared to slurry injection: Impact on NH3, N2O, CO2 and CH4 emissions and crop uptake. Geoderma 2017, 306, 160–166. [Google Scholar] [CrossRef]
  44. Sommer, S.G.; Husted, S. The chemical buffer system in raw and digested animal slurry. J. Agric. Sci. 1995, 124, 45–53. [Google Scholar] [CrossRef]
  45. Kai, P.; Pedersen, P.; Jensen, J.E.; Hansen, M.N.; Sommer, S.G. A whole-farm assessment of the efficacy of slurry acidification in reducing ammonia emissions. Eur. J. Agron. 2008, 28, 148–154. [Google Scholar] [CrossRef]
  46. Petersen, S.O.; Andersen, A.J.; Eriksen, J. Effects of cattle slurry acidification on ammonia and methane evolution during storage. J. Environ. Qual. 2012, 41, 88–94. [Google Scholar] [CrossRef]
  47. Møller, H.B.; Sommer, S.G.; Ahring, B.K. Separation efficiency and particle size distribution in relation to manure type and storage conditions. Bioresou. Technol. 2002, 85, 189–196. [Google Scholar] [CrossRef]
  48. Ni, J. Mechanistic Models of Ammonia Release from Liquid Manure: A Review. J. Agric. Eng. Res. 1999, 72, 1–17. [Google Scholar] [CrossRef]
  49. Hörnig, G.; Berg, W.; Türk, M. Emissionsminderung durch Ansäuern von Gülle. Agric. Eng. 1998, 53, 146–147. [Google Scholar] [CrossRef]
  50. Clemens, J.; Wulf, S. Reduktion der Ammoniakausgasung aus Kofermentationssubstraten und Gülle während der Lagerung und Ausbringung durch interne Versaurung mit in NRW anfallenden organischen Kohlenstofffraktionen, Forschungsbericht Nr. 121; Lehr-und Forschungsschwerpunkt “Umweltverträgliche und Standortgerechte Landwirtschaft”, Landwirtschaftliche Fakultät der Rheinischen Friedrich Wilhelms-Universität Bonn, Eds.; Lehr-und Forschungsschwerpunkt: Bonn, Germany, 2005. Available online: https://bonndoc.ulb.uni-bonn.de/xmlui/bitstream/handle/20.500.11811/1215/USL_Forschungsbericht_121.pdf?sequence=1&isAllowed=y (accessed on 23 June 2021).
  51. Fangueiro, D.; Surgy, S.; Coutinho, J.; Vasconcelos, E. Impact of cattle slurry acidification on carbon and nitrogen dynamics during storage and after soil incorporation. J. Plant Nutr. Soil Sci. 2013, 176, 540–550. [Google Scholar] [CrossRef]
  52. Dinuccio, E.; Berg, W.; Balsari, P. Gaseous emissions from the storage of untreated slurries and the fractions obtained after mechanical separation. Atmos. Environ. 2008, 42, 2448–2459. [Google Scholar] [CrossRef] [Green Version]
  53. Sommer, S.G.; Hjorth, M.; Leahy, J.J.; Zhu, K.; Christel, W.; Sørensen, C.G.; Sutaryo, S. Pig slurry characteristics, nutrient balance and biogas production as affected by separation and acidification. J. Agric. Sci. 2015, 153, 177–191. [Google Scholar] [CrossRef] [Green Version]
  54. Cuhls, C.; Mähl, B.; Clemens, J. Gewitra Ingenieurgesellschaft für Wissenstransfer mbH. In Ermittlung der Emissionssituation bei der Verwertung von Bioabfällen; Umweltbundesamt: Dessau-Roßlau, Germany, 2015; Available online: https://www.umweltbundesamt.de/sites/default/files/medien/378/publikationen/texte_39_2015_ermittlung_der_emissionssituation_bei_der_verwertung_von_bioabfaellen.pdf (accessed on 23 June 2021).
  55. Clemens, J.; Trimborn, M.; Weiland, P.; Amon, B. Mitigation of greenhouse gas emissions by anaerobic digestion of cattle slurry. Agric. Ecosyst. Envrion. 2006, 112, 171–177. [Google Scholar] [CrossRef]
  56. Evans, L.S.; Lewin, K.F.; Santucci, K.A.; Owen, E.M. Yields of field-grown soybeans exposed to simulated acidic deposition. Environ. Pollut. 1989, 61, 47–57. [Google Scholar] [CrossRef]
  57. Choi, E.; Moon, J.; Lee, W.; Son, S.; Lee, S.; Cho, I. The response of antioxidant enzyme activity, growth and yield of pepper and watermelon plants to a single application of simulated acid rain. J. Food Agric. Environ. 2010, 8, 1265–1271. [Google Scholar] [CrossRef]
Figure 1. The pH value of dairy cow (DC, ●), fattening pig (FP, ▲), and sow (S, ■) slurry and after acidification with lactic or sulfuric acid to a pH value of 5.5 during the storage period of 48 days (means ± SD, n = 3).
Agronomy 11 01319 g001
Figure 2. The pH value of dairy cow slurry after acidification with different organic (lactic, acetic, and citric acid) and mineral acids (sulfuric and hydrochloric acid) to a pH value of 5.5 during the storage period of 48 days (means ± SD, n = 3).
Agronomy 11 01319 g002
Figure 3. The pH value of dairy cow slurry after acidification with sulfuric or lactic acid to pH 5.5 under aerobic or anaerobic storing conditions during the storage period of 48 days (means ± SD, n = 3).
Agronomy 11 01319 g003
Figure 4. The pH value of dairy cow (DC, ●), fattening pig (FP, ▲), and sow (S, ■) slurry after acidification with sulfuric acid or in combination with glucose addition (0.01 mol glucose kg−1 slurry) to a pH value of 5.5 during the storage period of 48 days (means ± SD, n = 3).
Agronomy 11 01319 g004
Figure 5. The pH value of dairy cow (DC, ●) and fattening slurry (FP, ▲) (raw and separated slurry) after acidification with sulfuric acid to a pH value of 5.5 during the storage period of 48 days (means ± SD, n = 3).
Agronomy 11 01319 g005
Figure 6. The pH value of dairy cow slurry after acidification with sulfuric acid to pH values of 5.5, 4.5, and 3.0 during the storage period of 48 days (means ± SD, n = 3).
Agronomy 11 01319 g006
Table 1. Overview of the variants depending on the type of acid, slurry, and (previous) treatment.
Type of Slurry
TreatmentAcidConcentrationpKa 1Dairy CowFattening PigSow
mol L−1
No Acidification XXX
Organic acidLactic acid0.53.86XXX
Acetic acid0.54.76X
Citric acid0.253.13
4.76
6.4
X
Mineral acidSulfuric acid0.25−3.00
−6.62
XXX
Hydrochloric acid0.5−7.00X
Storage under anaerobic conditionsSulfuric acid0.5−3.00
−6.62
X
Lactic acid0.253.86X
Addition of glucoseSulfuric acid0.25−3.00
−6.62
XXX
SeparationSulfuric acid0.25−3.00
−6.62
XX
pH value 4.5Sulfuric acid0.25−3.00
−6.62
X
pH value 3.0Sulfuric acid0.25−3.00
−6.62
X
1 Acid dissociation constant; X shows to which slurry the acid and (previous) treatment was applied.
Table 2. Characteristics of dairy cow, fattening pig and sow slurry (fresh material) before acidification process.
IngredientsDairy CowFattening PigSow
Dry residue %9.58.33.5
Nkg m−34.126.247.76
NH4-Nkg m−32.054.086.83
P2O5kg m−31.483.832.16
K2Okg m−35.043.014.27
Acetic acidg kg−16.39.20.09
Propionic acidg kg−11.52.5<0.05
Acetic acid equivalent 1g kg−18.114<0.10
pH value 2 7.17.048.2
1 Acetic acid equivalents were calculated from the acetic, propionic, butyric, iso-butyric, valeric, iso-valeric, and n-caproic acids; 2 Own investigation.
Table 3. Amount of acid required to decrease the pH to 5.5 if not indicated otherwise (means ± SD, n = 3).
Type of Slurry
TreatmentAcidDairy CowFattening PigSow
mL kg−1 Slurrymol H+ kg−1 SlurrymL kg−1 Slurrymol H+ kg−1 SlurrymL kg−1 Slurrymol H+ kg−1 Slurry
No Acidification ------
Organic acidLactic acid360 ± 200.09 ± 0.005 a,*380 ± 00.10 ± 0.000 *1470 ± 170.37 ± 0.004
Acetic acid300 ± 00.15 ± 0.000 b
Citric acid227 ± 60.11 ± 0.003 ab
Mineral acidSulfuric acid 1413 ± 900.21 ± 0.045 c,#321 ± 80.16 ± 0.004 #1217 ± 600.61 ± 0.030
Hydrochloric acid280 ± 100.14 ± 0.005 b
Storage under anaerobic conditionsLactic acid353 ± 120.09 ± 0.003 a
Sulfuric acid290 ± 100.15 ± 0.005 b
Addition of glucoseSulfuric acid307 ± 160.15 ± 0.008 b,311 ± 20.16 ± 0.001 1169 ± 120.58 ± 0.006
SeparationSulfuric acid233 ± 120.12 ± 0.006 ab170 ± 00.09 ± 0.000
pH value 4.5Sulfuric acid527 ± 120.26 ± 0.006 d
pH value 3.0Sulfuric acid767 ± 60.38 ± 0.003 e
1 Amount of sulfuric acid up to a pH value of 5.5 corresponds to the alkalinity of slurry; a,b,c,d,e different letters indicate significant differences among the variants within the dairy cow slurry; * stars indicate significant differences between the type of slurry within the acidification with lactic acid; # hash keys indicate significant differences between the type of slurry within the acidification with sulfuric acid; double daggers indicate significant differences between the type of slurry within the addition of glucose; daggers indicate significant differences between the type of slurry within the previous separation.
Publisher’s Note: MDPI stays neutral with regard to jurisdictional claims in published maps and institutional affiliations.

