Article

Tillage Intensity Influences Insect-Pest and Predator Dynamics of Wheat Crop Grown under Different Conservation Agriculture Practices in Rice-Wheat Cropping System of Indo-Gangetic Plain

1
ICAR-Indian Institute of Wheat and Barley Research, Karnal 132001, Haryana, India
2
ICAR-Central Soil Salinity Research Institute, Karnal 132001, Haryana, India
3
Central Potato Research Station, ICAR-Central Potato Research Institute, Gwalior 474020, Madhya Pradesh, India
4
Department of Entomology, CCS Haryana Agricultural University, Hisar 125004, Haryana, India
*
Authors to whom correspondence should be addressed.
Agronomy 2021, 11(6), 1087; https://doi.org/10.3390/agronomy11061087
Submission received: 23 April 2021 / Revised: 20 May 2021 / Accepted: 23 May 2021 / Published: 27 May 2021
(This article belongs to the Special Issue Conservation Tillage in Sustainable Agro-Ecosystems)

Abstract

:
Tillage can alter the soil habitats wherein many insect pests and their natural enemies reside during at least part of their life cycle. To enhance crop productivity and reduce climate change effects, conservation agriculture (CA) with reduced-tillage or no-tillage practices have been advocated to farmers. However, information relating to the effect of CA on insect pests and their natural enemies is very scarce, at least in the Indo-Gangetic region. In this study, the effect of tillage on the abundance of, and damage by, major insect pests (foliar aphids, root aphids, termites, and pink stem borer) and their natural enemies in wheat managed under three tillage practices, i.e., zero-till (ZT), reduced tillage (RT), and conventional tillage (CT) with (protected) and without (unprotected) insecticide protection scenarios, was investigated. Foliar aphid and termite numbers were lowest in the ZT-protected system, and highest in the CT-unprotected system. Pink stem borer damage was significantly higher in the ZT-unprotected system, whereas the root aphid number was maximum in the RT-unprotected system. The natural enemies of these four major insect pests of wheat showed variable trends under the studied tillage systems. The abundance and damage of these major insect pests showed a positive correlation with the normalized difference vegetative index (NDVI) and canopy temperature. The dynamics of the insect pests and their predators were driven by soil habitat-related changes (direct) as well as crop growth-related effects (indirect). A fine-tuning of insect-pest management tactics based on these relations would enhance the success of CA systems.

1. Introduction

Soil health is considered as one of the main contributing factors to crop productivity, and thus its improvement is considered as an important step towards achieving food security [1,2]. Conventional methods of soil preparation and cultivation involve intensive and frequent tillage, which leads to soil degradation through erosion, compaction, decreased water-holding capacity, and loss of soil carbon, besides disturbing habitats of surface and sub-surface dwelling organisms and their niches [3,4]. On the contrary, conservation agriculture (CA) practices advocate for residue retention on the soil surface, which enhances not only soil quality but also provides a favourable habitat for soil-dwelling organisms and reduces environmental footprints under intensively managed systems [2,5].
Conservation tillage and residue management have been widely adopted practices in the Indo-Gangetic Plain (IGP), which occupies nearly 13.5 million hectares in India. In India, the area planted in wheat during 2020–2021 totaled 31.58 million hectares, and the IGP’s share was 42.74%. Conservation agriculture practices can be broadly divided into three categories based on the intensity of soil tillage: conventional tillage with high intensity of soil disturbance by ploughing, zero tillage with the least soil disturbance, and reduced tillage, which is in between both these categories and requires little soil disturbance [6]. Despite several advantages of CA systems, such as reduction in energy use and cost of cultivation, enhanced water and nutrient use efficiency, and reduced global warming impacts, there are still many aspects and crop-specific challenges, with region-specific context, that need to be addressed for their large scale adoption and success [7,8]. One of the challenging issues is the influence of changed management on insect-pest abundance and damage. There are reports from farmers’ fields in the Indo-Gangetic Plain (IGP) that indicate altered insect-pest dynamics and disease incidences under CA, but such interactions are not yet reported in scientific literature. Soil being an important habitat for insect pests, alterations in tillage and residue regimes can have some obvious effects on their population dynamics.
Globally, yield losses due to insect pests are estimated to have increased from 5.1 to 9.3% from the pre-green to post-green revolution era [9]. The continuous cropping of rice and wheat in the IGP has already resulted in increased insect-pest pressure on crops. For example, increased incidences of foliar aphid complex under irrigated conditions, root aphids in loose soils, pink stem borer in fields that contain rice stubble, cutworms in crop residues, termites in raised beds, and brown mites in rainfed conditions have been reported [10,11]. Grasshoppers have also been noted to cause serious damage to wheat seedlings of November-sown crop in many rice-wheat growing areas of eastern IGP [12]. Pink stem borer, which was earlier found in the drier western part of India, has emerged as a serious pest of wheat in north-western IGP [13,14].
The major insect pests that are currently reported to attack wheat crops in north-western IGP include foliar aphids (Rhopalosiphum maidis (Fitch), Rhopalosiphum padi L., and Sitobion avenae (Fabricius)), termites (Microterme sobesi Holmgren and Odontoterme sobesus Rambur), pink stem borer (Sesamia inferens Walker), and root aphids (Rhopalosiphum rufiabdominalis Sasaki) (Figure 1). Amongst these, foliar aphids, R. maidis, and termites are regular and major pests of wheat in the north-western IGP region; however, pink stem borer and root aphids are emerging pests and have shifted from rice (Oryza sativa) to wheat [9,15,16]. The different insect pests, depending on their feeding behaviour and favourable edaphic conditions, appear at different stages of crop growth. The insect-pest damage is more evident in crop fields during the late-December to mid-February period (4 to 10 weeks after sowing) [11].
Changes in soil tillage and crop residue management would invite changes in not only soil organic matter, soil moisture, and nutrient regimes, but also the biological life that dwells in soil. Changes in the microclimate under crop canopy due to these changes in soil favour some and disfavour other forms of biological life, in general. Shifting from conventional systems to conservation tillage systems may alter the whole insect-pest scenario due to changes in ecological conditions [17]. Conservation tillage and residue management practices were introduced to conserve resources and sequester carbon in soil, with a fair amount of success. The changes that bring in these benefits are bound to have effects on microclimate with influences on insect-pest populations and associated natural enemies that co-exist in an agroecosystem [18]. The direction of pest-predator interactions is highly sensitive to the micro-environment and determines the strength of pest control. The findings of the studies conducted so far on the impact of different tillage systems on the population dynamics of insect pests of wheat are conflicting [19]. Most of the studies fail to link these changes to the causal mechanism or changes in microclimate conditions.
The current study was therefore undertaken to understand the impact of three tillage practices i.e., zero-till, reduced tillage, and conventional tillage, under insecticide protected and unprotected scenarios, on the relative abundance of major insect pests of wheat and their natural enemies in the IGP. Their relation to plant growth and canopy temperature was also explored to seek linkages to changes in crop microclimate.

2. Materials and Methods

2.1. Site Description and Tillage Operations

These studies were conducted at the research farm of the Indian Institute of Wheat and Barley Research, Karnal, India (GPS Coordinates: 29.7045°N, 76.9906°E) during 2016–2017 and 2017–2018 (Figure 2). The experimental soil was non-saline, slightly alkaline (pH 8.7) (digital multimeter for pH and EC, Eutech Instruments, Singapore; Model PC510), and deep alluvial silty-loam with low organic carbon content (3.9 g kg−1). The soils were reclaimed Typic Natrustalfs (USDA Soil Taxonomy), and contained 630 g kg−1 of sand, 333 g kg−1 of silt, and 37 g kg−1 of clay in the top 0–15 cm of the soil profile (hydrometer method). The soil had a steady-state infiltration rate of 3.0 mm h−1 (double-ring infiltrometer), Olsen’s extractable P-value of 18.9 kg ha−1 (using spectrophotometer, Analytic Jena, Jena, Germany), and ammonium acetate extractable K value of 157.8 kg ha−1 (using flame photometer, Systronic, Ahmedabad, India) in the top 0–0.15 m soil layer.
The experiment was laid out in a randomized complete block, split-plot experiment design with tillage type as main plot treatment and protection with insecticide as subplot treatment. The cropping system followed was rice (July–October) followed by wheat (November–April). No insecticide was applied during the rice crop that preceded wheat. There were 3 replicates of each treatment; the plot size for tillage operation was 20 m2 and was further divided into sub-plots of size 10 m2 to maintain 2 experimental conditions of insecticide protection, i.e., unprotected and protected. The protected subplot was sprayed with quinalphos 25% EC (trade name: Ekalux) at the rate of 2 L ha−1. A spacing of 1 m was kept as a buffer between the plots. The sowing of wheat variety HD 2967 was performed under 3 tillage systems, viz. conventional tillage (CT), reduced (rotary) tillage (RT), and zero tillage (ZT) during the 2nd week of November each year, using 100 kg ha−1 seeding rate for all 3 systems. Before sowing, the rice crop was harvested manually, leaving stubble of 3–6 inches (7.62–15.24 cm). For CT, field preparation included 10 rounds of tractor operations with various implements (4 with harrow and 4 with cultivator followed by 2 plankings). Direct seeding of wheat by a single tractor operation with rotary till fertilizer-seed drill was performed to sow the seed in the RT system. For ZT, direct seed sowing without field preparation using a zero-till fertilizer-seed drill with inverted T-type furrow openers was performed with the least soil disturbance.

2.2. Weather Conditions

The weather parameters were obtained from the meteorological observatory located at the research farm of the Indian Institute of Wheat and Barley Research, Karnal, India. The location, Karnal, Haryana, has summers with hot and humid weather while winters are cool and dry. The weather parameters recorded during the studied periods of 2016–2017 and 2017–2018 are presented in Table 1. The average temperature during 2016–2017 ranged from 9.8 °C to 22.0 °C, with the lowest during 2nd (8–14 January 2017)) Standard Meteorological Week and highest during 12th (19–25 March 2017) Standard Meteorological Week. During 2017–2018, the average temperature fluctuated between 9.6 °C and 21.6 °C, with the lowest during 2nd (8–14 January, 2018) Standard Meteorological Week and highest during 12th (19–25 March 2018) Standard Meteorological Week. The average relative humidity was recorded between 59.5–84.1% during 2016–2017 and 57.8–89.8% during 2017–2018. The total seasonal rainfall was 93.6 mm during 2016–2017 and 68.4 mm during 2017–2018. The rainfall was comparatively more evenly distributed during 2016–2017 than 2017–2018.

2.3. Insect Sampling

Insect abundance and damage were recorded in each tillage system under 2 conditions, insecticide protected and unprotected, during both seasons (2016–2017 and 2017–2018). As the insect numbers did not vary significantly between the 2 seasons, the data were pooled for the presentation of results. The abundance of foliar aphids was recorded by visually counting aphids on 5 randomly selected shoots from each experimental plot. However, the root aphid number counts were made on 5 tillers uprooted from each plot during the field season starting November-end till March-end of each crop season at the fortnightly interval. Alate (winged) counts of foliar and root aphids were not made. The damage from termites and pink stem borer was recorded by counting the damaged wheat tillers in a 1-m row length from each experimental plot during the crop season. On each observation date, the counted damaged tillers were removed to avoid repeated counting of the same tillers during the next sampling date. To confirm the stem borer species, dead hearts from non-experimental fields were collected and excised to ascertain the presence of the larvae of pink stem borer. The borer species was S. inferens, and no other borer species was noticed. Similarly, insect samples of foliar aphids, termites, and root aphids were also collected and examined to ascertain their species. Laboratory identification revealed the foliar aphids to be R. maidis and root aphids as R. rufiabdominalis. The termite species were identified as O. obesus and M. obesi.
The sampling of natural enemies was performed in a 1 m2 quadrat randomly selected in each plot during the crop season. Larvae of natural enemies on the wheat tillers were directly counted. Adult natural enemies were caught in a sweep net swung 5–7 times during the season. All larvae and adults that could not be identified directly were collected and preserved in 75% ethyl alcohol and were taken to the laboratory for identification.

2.4. Normalized Difference Vegetative Index (NDVI)

Normalized difference vegetative index (NDVI) values measuring red and infrared light reflectance were recorded with a hand-held Green Seeker VR (Trimble Inc., Sunnyvale, CA, USA; 2012 model) crop sensor. Ten NDVI measurements were taken from the upper leaves of 10 plants per plot, and the values were averaged for each plot. Readings were taken in 2 rows of each plot between 12:00–14:00 h on the same day when insect abundance/damage data were recorded.

2.5. Canopy Temperature

Canopy temperatures were measured using a handheld infra-red thermometer (InfraPro 5, Oakton Instruments, Oakton, IL, USA, 2010 model) with a field view of 2.5 degrees. Measurements were started when the thermometer could view close to 100% of the crop canopy when held at the angle of 20–30 degrees to the horizontal and at a height to give a canopy viewing area of approximately 10 cm by 25 cm. Plots were oriented east-west, and two readings were taken from each end (but sighting at an angle to the row direction); readings were then averaged. The canopy temperature observations were taken on the same day between 12:00–14:00 h when insect abundance/damage data were recorded.

2.6. Statistical Analysis

An analysis of variance (ANOVA) for a split-plot design was used for the analysis of data. The data for 2016–2017 and 2017–2018 were pooled for statistical analysis as there was no significant difference (p = 0.05) in pest abundance and damage during both seasons. The data on insect density (foliar and root aphid) and per cent damage (pink stem borer and termites) were square root and arcsine transformed, respectively, for minimizing error and normalization of the data. Analysis was performed by keeping tillage conditions as main, insecticide protection as sub-plot, and time of observations as sub-sub-plot treatment. The sub-sub-plot treatment in this design was used as a repeated measures analysis. The data were analyzed using SAS software.

3. Results

3.1. Foliar Aphid, R. maidis

The population of foliar aphid varied significantly in three tillage systems (conventional, reduced, and zero) under both protected and unprotected conditions (Figure 3). Mean aphid number was significantly higher in the CT system (6.17 aphids/tiller) under unprotected conditions, followed by unprotected RT (5.58 aphids/tiller) and ZT conditions (4.49 aphids/tiller) (Figure 3). The aphid population trends were also similar in the three tillage systems during the different observation weeks from 10 to 18 weeks after sowing (WAS). The population range was recorded to be highest (4.02 to 9.91 aphids/tiller) under unprotected CT conditions during 10 to 18 WAS. A significantly lower number of aphids was recorded in insecticide-protected conditions as compared to unprotected conditions under the different tillage systems. Zero tillage (ZT) under protected conditions had a minimum population, with 3.36 to 5.19 aphids/tiller.
The peak aphid population was observed during the 14th week after sowing and was recorded to be 9.91, 8.98, and 6.19 aphids/tiller under unprotected CT, RT, and ZT conditions, respectively, as compared to 6.91, 5.98, and 5.19 aphids/tiller under protected CT, RT and ZT conditions, respectively. Overall, the foliar aphid population observed at different weeks after sowing was significantly higher under unprotected conditions as compared to protected conditions (Figure 3).
Studied interaction effects indicated that type of tillage (F = 3.85; df = 2; p = 0.04), insecticide protection (F = 5.13; df = 1; p = 0.03), time of observation (F = 13.36; df = 4; p = 0.0001), and their interactions (F = 0.12; df = 8; p = 0.027) had significant effects on the population of aphids (Table 2).

3.2. Root Aphid, R. rufiabdominalis

The data revealed significant effects from tillage on the root aphid (R. rufiabdominalis) population under both unprotected and protected conditions (Figure 4). Reduced tillage (RT) under unprotected conditions harboured the maximum mean number of root aphids (3.04 aphids/tiller), followed by CT (2.97 aphids/tiller) and ZT (2.12 aphids/tiller) under unprotected conditions. Under protected conditions, similar root aphid population trends were observed, with the mean number of aphids/tiller as 1.94, 1.87, and 1.69 in RT, CT, and ZT, respectively. The population of root aphids was observed only during the 3rd to 5th weeks after sowing, and later the population gradually declined and disappeared. The higher root aphid population numbers were observed during the 3rd week after sowing and were recorded to be 3.46, 3.38, and 2.91 aphids/tiller under unprotected CT, RT, and ZT conditions, respectively, compared to 2.36, 2.28, and 1.82 aphids/tiller under protected CT, RT, and ZT conditions, respectively. The population of root aphid was significantly higher in each tillage system under unprotected conditions compared to protected conditions during the sampled weeks (Figure 4).
Type of tillage (F = 3.28; df = 2; p = 0.04), insecticide protection (F = 18.77; df = 1; p = 0.001), and their interactions (F = 1.21; df = 2; p = 0.03) had significant effects on the population of root aphids (Table 2).

3.3. Termites, O. obesus and M. obesi

The mean termite damage was significantly higher under the unprotected scenario compared to the protected scenario (Figure 5). It was highest under the unprotected CT (9.49%), followed by the unprotected RT (9.07%) and ZT systems (6.56%). However, under protected conditions, the lowest mean damage was observed in the ZT (6.17%) followed by the RT (7.38%) and CT systems (7.80%). Peak termite incidence was observed during week 5 after sowing and was recorded to be 10.23, 9.58, and 7.21% under unprotected CT, RT, and ZT conditions, respectively compared to 9.04, 7.38, and 6.32% under protected CT, RT, and ZT conditions, respectively (Figure 5). The pest disappeared after 7 weeks after sowing and again appeared during the earhead stage, with highest damage recorded under unprotected CT conditions (10.10%) and lowest under unprotected ZT conditions (4.96%).
Studied interaction effects indicated that type of tillage (F = 9.09; df = 2; p = 0.04), insecticide protection (F = 7.24; df = 1; p = 0.014), and time of observation (F = 1.32; df = 3; p = 0.032) individually had significant effects on termite damage, and none of their interactions had any significant effect (Table 2).

3.4. Pink Stem Borer, S. inferens

Significant differences in pink stem borer (S. inferens) damage were also observed in different tillage conditions. Mean pink stem borer damage was significantly lower in insecticide-protected conditions compared to unprotected conditions (Figure 6). The mean termite damage was highest in unprotected ZT conditions (8.66%), followed by unprotected RT (6.92%) and protected ZT conditions (6.46%). The lowest mean damage was recorded in the conventional protected tillage system with 4.42% damage. The data on time of observation indicated that pink stem borer damage first appeared during the 3rd week after sowing, and peak infestation was seen during the 11th week after sowing. The peak damage was 7.28%, 5.19%, and 5.01% under protected ZT, RT and CT systems, respectively, compared to 9.48%, 6.89%, and 6.09% under unprotected ZT, RT, and CT systems, respectively.
Type of tillage (F = 20.11; df = 2; p = 0.0002), insecticide protection (F = 40.36; df = 1; p = 0.0001), and their interactions (F = 0.28; df = 2; p = 0.04) had significant effects on the per cent damage caused by pink stem borer (Table 2).

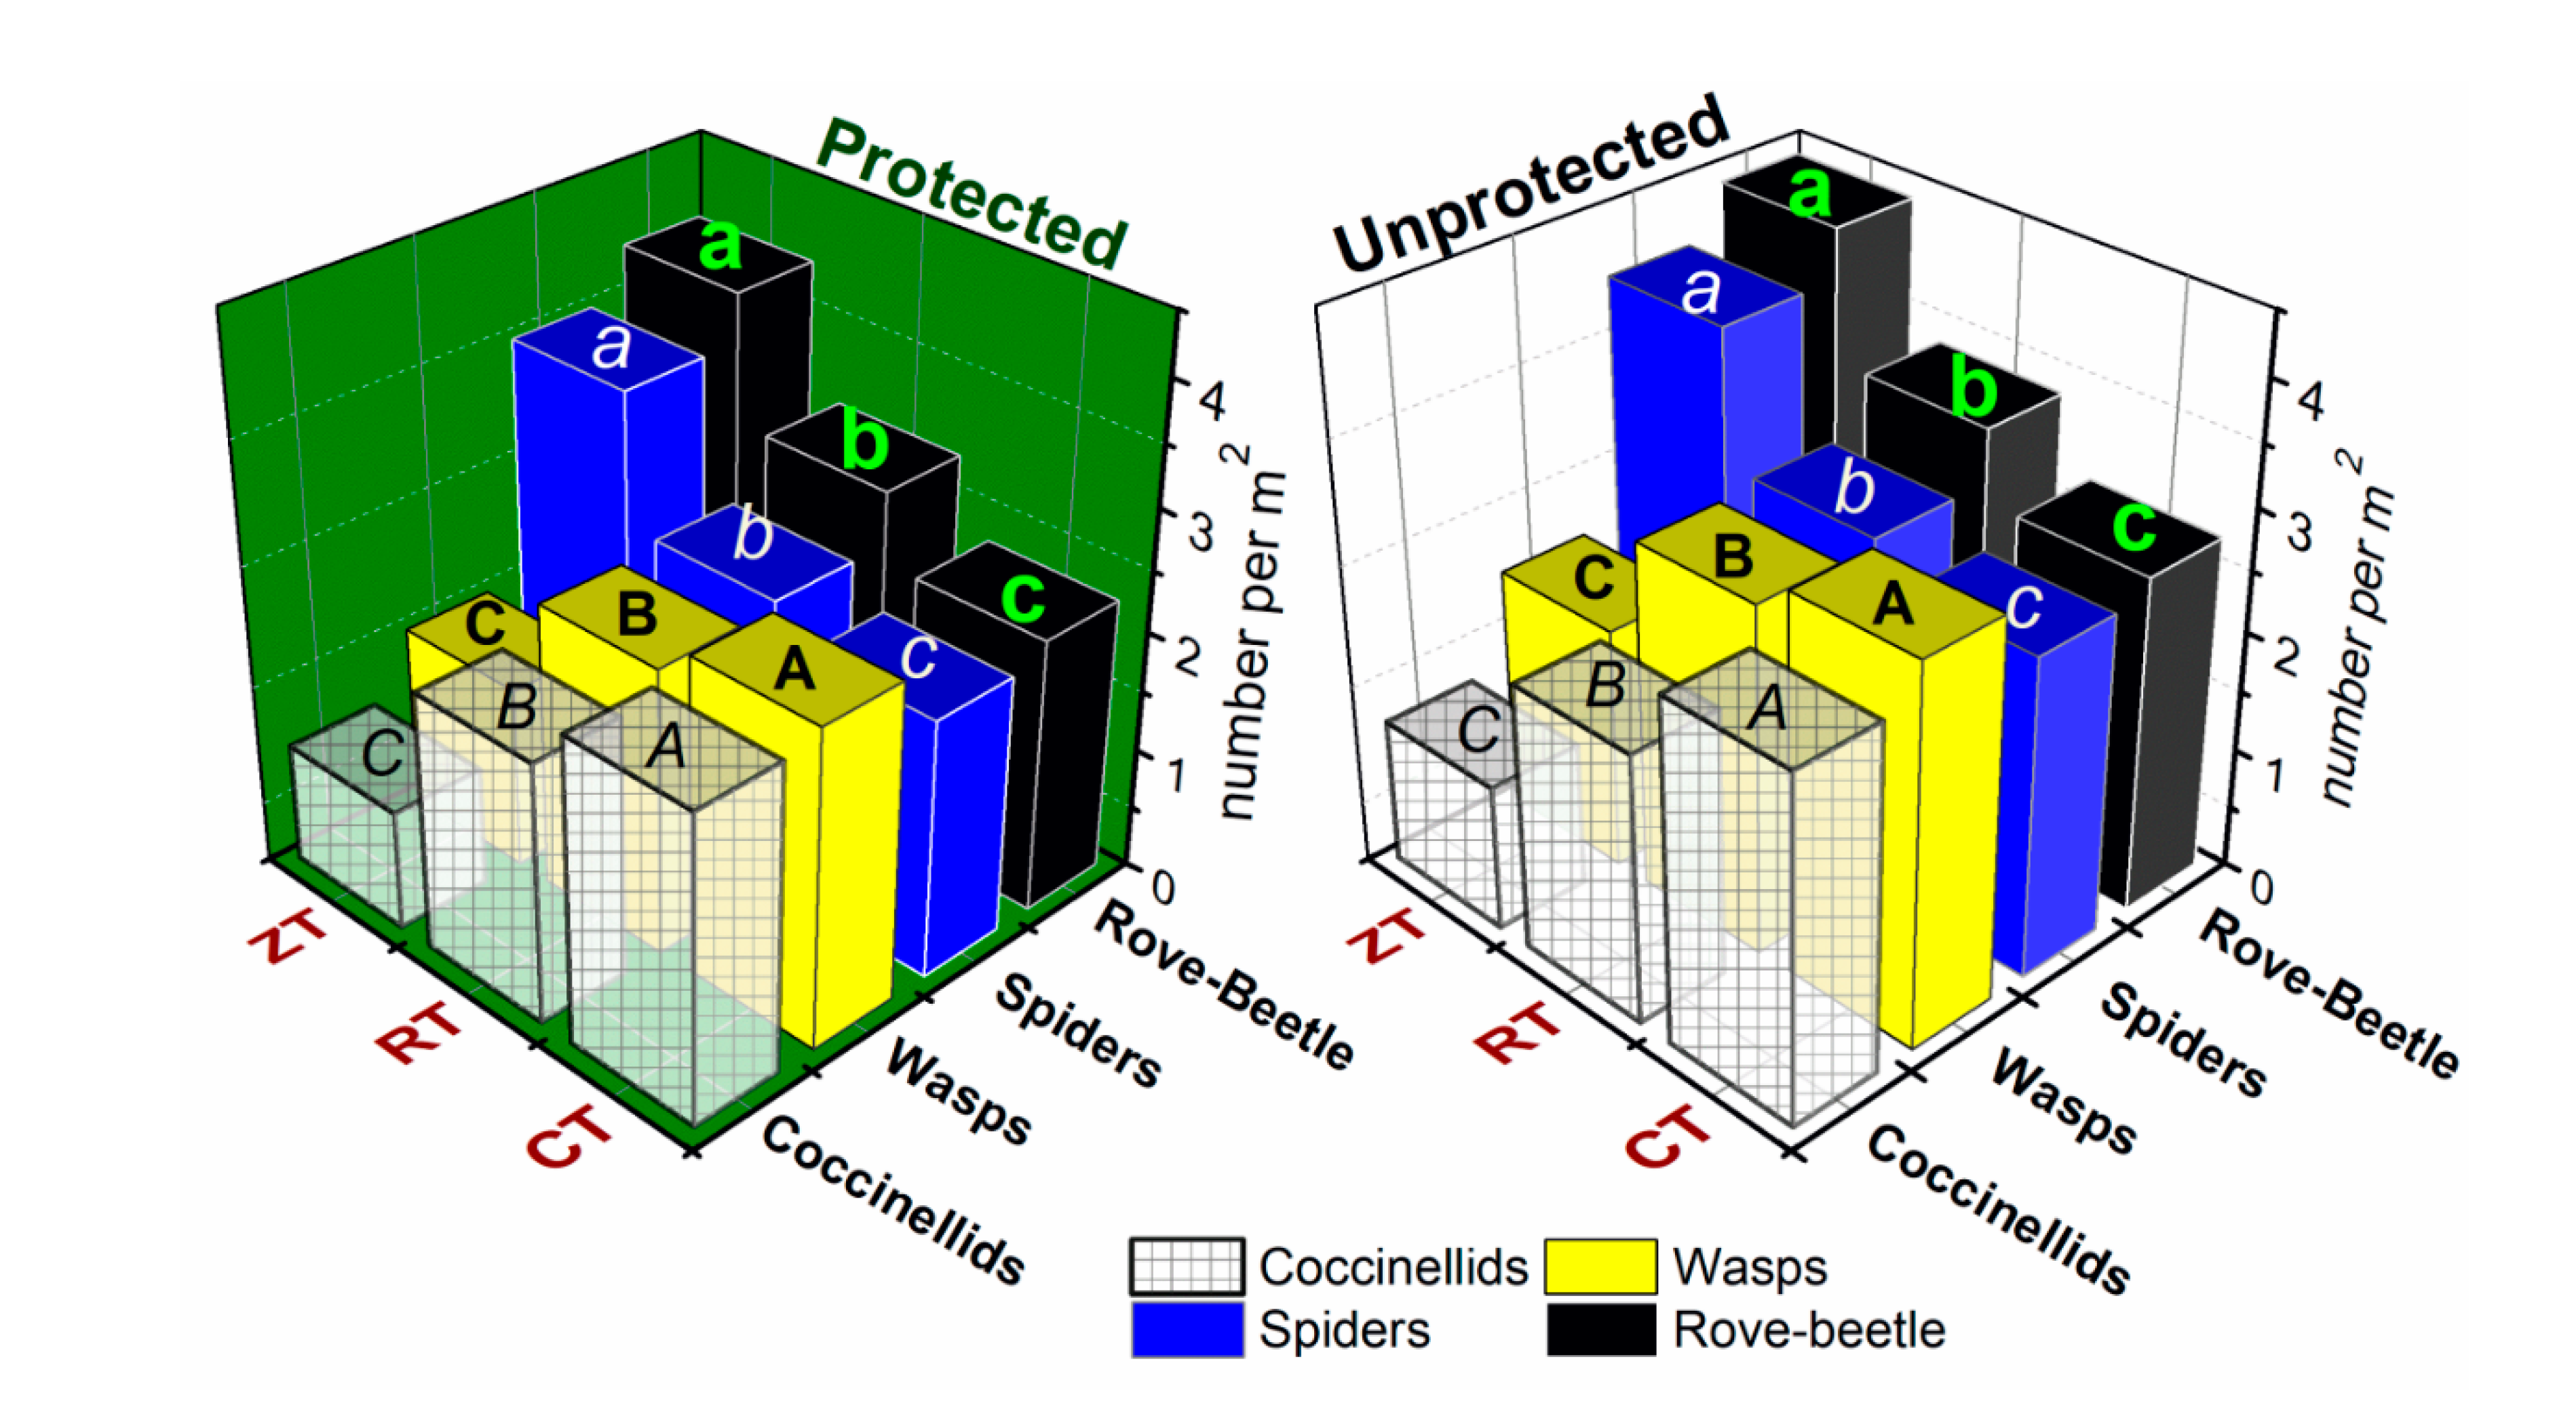
3.5. Natural Enemies

The major natural enemies observed during the study were ladybird beetle (coccinellids); Coccinella septempunctata, wasps (Ropalidia spp.), rove beetle; Paederus fuscipes, and spiders; Oxypes spp. and Lycosa pseudoannulata. The populations of coccinellids and wasps were higher in CT compared to ZT under both protected and unprotected conditions. Under protected conditions, the population of coccinellids was 2.50 per m2 in CT, followed by 2.13 per m2 in reduced tillage and 0.99 per m2 in ZT. The wasp population was highest in conventional tillage and was 2.6 and 3.1 per m2 under unprotected and protected conditions, respectively (Figure 7).
The populations of rove beetles and spiders were higher in ZT compared to other tested tillage systems. The population of rove beetles was 4.4 and 3.9 per m2 under unprotected and protected conditions in ZT, respectively. Similarly, the population of spiders was 4.00 and 3.5 per m2 under unprotected and protected conditions in ZT, respectively. It was noted that the overall population of each natural enemy group was higher in unprotected conditions compared to protected conditions. With increases in tillage, populations of coccinellids and wasps increased while populations of rove beetles and spiders decreased (Figure 7).

3.6. Relationship between Normalized Difference Vegetative Index (NDVI) and Insect-Pest Abundance and Damage

The aphid population recorded during the 10 to 18 weeks after sowing showed a positive correlation with observed NDVI in each protected tillage system, but that correlation was significant only under protected ZT and CT systems. The protected ZT system had a stronger correlation (R2 = 0.53, p = 0.0001) compared to the protected CT system (R2 = 0.33, p = 0.02). The root aphid population also had a significant positive correlation with NDVI under protected CT (R2 = −0.90, p = 0.001) and RT systems (R2 = −0.56, p = 0.02). Termite and pink stem borer damage had no significant correlations with NDVI except under protected RT, which had a significant positive correlation with pink stem borer damage (R2 = 0.40, p = 0.01) (Figure 8).

3.7. Relationship between Canopy Temperature and Insect-Pest Abundance and Damage

The canopy temperature had a significant positive correlation with aphid population under the protected ZT system (R2 = 0.40, p = 0.01) and with root aphid abundance under the protected CT system (R2 = 0.59, p = 0.02). Termite infestation also showed a positive correlation with canopy temperature under the protected CT (R2 = 0.86, p > 0.0001) and RT systems (R2 = 0.80, p > 0.0001). Only under the CT system, pink stem borer had a positive correlation with canopy temperature (R2 = 0.51, p > 0.0001) (Figure 9).

4. Discussion

Overall, the study revealed that insect-pest population dynamics and damage were modified with the changes in tillage intensity. At the same time, the abundance of natural enemies was also affected. These changes perhaps were driven by several changes in microclimate, plant growth, and soil characteristics (surface and underneath). Two of these changes, plant growth (as assessed via NDVI) and canopy temperature, were tested and were significantly related to these effects. Overall the effects on insect pests and their natural enemies were more or less controlled by the characteristics of the insect and its feeding habits and habitat. Although there was a general effect from insecticide protection in decreasing populations of insect pests (as well as their natural enemies), the effects of tillage were more pronounced.
The present investigation indicated that higher tillage intensity (CT > RT > ZT) favoured population build-up of foliar aphid. The foliar aphid population was highest in the conventional tillage system and decreased with a reduction in tillage. Conversely, reduction in tillage favoured better control of foliar aphid. The CT management system supports more luxurious green crop, which might attract more foliar aphids than RT and ZT, which had sparser growth. Moreover, the surface residues in zero tillage may serve as reflective mulch, which repels settling aphids. In a similar study, such effects were observed for Schizaphis graminum (Rondani) populations, which were substantially reduced in management where surface residues were moderate to high, compared to conventionally tilled plots where residues were low [20]. An increase in infestation of R. padi was reported in spring small grains with conservation tillage, as surface residue provided a favourable microhabitat for aphids [21]. A few other studies also reported no or limited effect of tillage on cereal aphid populations in wheat [22,23].
Interestingly, similar trends were observed with root aphids. Although, the tillage-related effects were less pronounced in the case of root aphid, the trends were the same. Reducing tillage provided better control for root aphids as well. The tillage operations broke up and loosened aggregated soil, which facilitated the easy movement of aphids and hence, their damage [10]. Similar trends were revealed for termites as well, with lower damage in ZT, followed by RT and CT. Termite damage decreased with a decrease in tillage intensity, with ZT recording the least damage (Figure 4). Higher soil compaction and less porosity might lead to poor aeration, disfavouring termites. Termite survival and movement are lowered in compacted and poorly aerated soils [10,14]. Higher termite activity has also been reported in well-drained soils [24]. At the same time, it is also possible that the increased cellulosic material/residues with a reduction in tillage would provide more feedstock to termites, resulting in less damage to standing crop parts.
The trends were opposite for pink stem borer, with maximum damage in ZT followed by RT and CT. The controls were also highly effective for each type of tillage management (Figure 5). Unlike the other three insects, the activity of the pink stem borer increased with a reduction in tillage. Reduced soil disturbance in the presence of rice stubble provides an excellent ground for the proliferation of immature stages of the pink stem borer. A greater percentage of pink stem borer larvae have been reported to live below 4–5 inches (10.2–12.7 cm) depth of soil when the tillage in RT operations does not exceed 3 inches (7.62 cm). Therefore, insect larvae under RT can escape the brunt of rotary tillage operations [14,15].
The interaction effects indicated that type of tillage individually had a significant effect on the population of foliar aphid, root aphid, termites, and pink stem borer. Insecticide protection also had a highly significant effect on all insect pests. The interaction of tillage and insecticide protection had significant effects only for foliar aphid and pink stem borer. Interaction of all three factors was significant only for foliar aphid (Table 2). In general, the insecticide application lowered the insect-pest population or damage from all four insects (as well as their natural enemies), but the trends with tillage intensity remained the same. Insecticide application is effective in reducing the population of wheat aphid [25], termites [26], and pink stem borer [1].
There were significant effects from tillage on the populations of major natural enemies of insect pests in wheat crop [27]. In the case of natural enemies, the populations of coccinellids and wasps decreased with reductions in tillage, while those of generalist arthropod predators such as spiders and rove beetles increased with reductions in tillage [28,29]. Under insecticide-protected conditions, the natural enemy population also decreased. Arthropod predators dwell better in less disturbed habitats [30,31]. Mechanical operations cause mortality as well as emigration of generalist arthropod predators. The roles of organic matter (e.g., crop residues) and structural elements are supportive of their persistence. Concerning these predators, earlier studies have confirmed that residues/organic matter retention plays a more dominant role than mechanical disruption [32,33]. The populations of wasps and coccinellids, which take refuge in areas outside the crop fields, are more likely to be affected by crop vigour than tillage. Conventionally tilled crop plants are more vigorous and greener than conservatively tilled (RT and ZT) crops, and thus would attract more of these types of predators [34].
The relationship between the normalized vegetative index (NDVI) and insect population indicated that the aphid population was affected by crop vigour, but the population of termites and pink stem borer mostly remained unaffected. The foliar aphid population increased with an increase in NDVI, whereas the root aphid population decreased with increased NDVI under all tillage systems. The canopy temperature had very pronounced effects on all four insect pests, especially in CT (Figure 8). Although there was a decrease in the foliar aphid population with canopy temperature, the effects were significant in ZT only. On the other hand, there were significant increases in the root aphid, termite, and pink stem borer populations, but the effects were significant only in CT management. Besides changes in habitat via a change in soil condition, organic matter/residue on the soil surface, and other structural elements, the role of two key crop-related parameters, i.e., crop growth/vigour (as indicated by NDVI) and canopy temperature also seem to have controlled overpopulation dynamics of pests under different tillage regimes. An increase in NDVI favoured foliar aphid and disfavoured the root aphid population. These insects are the sap-sucker type and are therefore directly affected by crop vigour. The activity of root aphids lasts for a short period and subsides as crop growth intensifies, and perhaps therefore it is perhaps negatively related. Termites and pink stem borers have most of their activity near the soil surface and thus seem to be less affected by crop vigour (NDVI). Canopy temperature, on the other hand, had a pronounced effect. Increased canopy temperature decreased the activity and damage of insect pests that feed on crop foliage, i.e., foliar aphids, and increased the activity of those insect pests that operate in the root zone or on the soil surface. Increases in temperature appeared to favour the populations and damage of root aphids, termites, and pink stem borers that have their operating zones close to the soil surface and in surface residue, but more so in CT than ZT. It is well known that insects are sensitive to temperature, but the response can be multifaceted and ecologically complex depending on many other factors, including management [35]. These results point towards complexity of multiple interactions between the host (wheat crop) and the pests, and the microclimatic conditions that are experienced by the insects, unlike earlier studies that indicated a linear relationship of insect-pest development to air temperature [36].

5. Conclusions

Insect-pest management strategies would need to be revised for reduced/no-tillage practices to deliver the full benefits of conservation agriculture (CA). The reduction in tillage seems to have some advantages in terms of reduced populations of sap-sucking insect pests such as aphids, but the insect pest with dominant activity at the soil surface or underneath may benefit, and therefore, their control has to go beneath the soil surface (e.g., insecticide drenching). The usual insecticide control strategies such as canopy sprays may not be very effective, and therefore better control strategies may be needed before large-scale adoption of such cropping systems. Reducing tillage also affected the abundance of natural enemies of insect pests, which is an important ecological aspect. Cropland-resident types of natural enemies, i.e., rove beetles and spiders, benefitted from a reduction in tillage and increased surface crop residue, while non-resident types of natural enemies that reside outside crop fields, i.e., wasps and coccinellids, are disfavoured due to a decrease in crop vigour. The success of biological control pest management strategies would depend on these changes in ecological niches.

Author Contributions

P.J. and S.K. (Subhash Katare) generated the idea, designed the study, carried out the experimental works and prepared the manuscript. A.K.B., J.Y. and P.L.K. assisted in the analysis of the data and helped in manuscript writing. S.K. (Sudheer Kumar) and G.P.S. participated in designing the study, coordinated field experiments, and reviewed the manuscript. All authors have read and agreed to the published version of the manuscript.

Funding

The financial support for this work was provided by ICAR-IIWBR Project No. IXX13153.

Institutional Review Board Statement

Not applicable.

Informed Consent Statement

Not applicable.

Data Availability Statement

The data supporting the findings in the manuscript are freely available from the corresponding author on reasonable request.

Acknowledgments

We acknowledge the help of laboratory technical staff of the Crop Protection Section in data collection and layout of field experiments.

Conflicts of Interest

The authors declare no conflict of interest.

References

  1. Lal, R. Soils and world food security. Soil Tillage Res. 2009, 102, 1–4. [Google Scholar] [CrossRef]
  2. Bhardwaj, A.K.; Jasrotia, P.; Hamilton, S.K.; Robertson, G.P. Ecological management of intensively cropped agro-ecosystems improves soil quality with sustained productivity. Agric. Ecosyst. Environ. 2011, 140, 419–429. [Google Scholar] [CrossRef]
  3. Henneron, L.; Bernard, L.; Hedde, M.; Pelosi, C.; Villenave, C.; Chenu, C.; Bertrand, M.; Girardin, C.; Blanchart, E. Fourteen years of evidence for positive effects of conservation agriculture and organic farming on soil life. Agron. Sustain. Dev. 2015, 35, 169–181. [Google Scholar] [CrossRef] [Green Version]
  4. Bhardwaj, A.K.; Rajwar, D.; Mandal, U.K.; Ahamad, S.; Kaphaliya, B.; Minhas, P.S.; Prabhakar, M.; Banyal, R.; Singh, R.; Chaudhari, S.K.; et al. Impact of carbon inputs on soil carbon fractionation, sequestration and biological responses under major nutrient management practices for rice-wheat cropping systems. Sci. Rep. 2019, 9, 1–10. [Google Scholar] [CrossRef] [PubMed]
  5. Erenstein, O.; Sayre, K.D.; Wall, P.; Hellin, J.; Dixon, J. Conservation agriculture in maize- and wheat-based systems in the (sub) tropics: Lessons from adaptation initiatives in South Asia, Mexico, and Southern Africa. J. Sustain. Agric. 2012, 36, 180–206. [Google Scholar] [CrossRef]
  6. Busari, M.A.; Kukal, S.S.; Kaur, A.; Bhatt, R.; Dulazi, A.A. Conservation tillage impacts on soil, crop and the environment. Int. Soil Water Conserv. Res. 2015, 3, 119–129. [Google Scholar] [CrossRef] [Green Version]
  7. Six, J.; Ogle, S.M.; Jay Breidt, F.; Conant, R.T.; Mosier, A.R.; Paustian, K. The potential to mitigate global warming with no-tillage management is only realized when practised in the long term. Glob.Chang. Biol. 2004, 10, 155–160. [Google Scholar] [CrossRef] [Green Version]
  8. Ruan, L.; Philip Robertson, G. Initial nitrous oxide, carbon dioxide, and methane costs of converting conservation reserve program grassland to row crops under no-till vs. Conventional tillage. Glob. Chang. Biol. 2013, 19, 2478–2489. [Google Scholar] [CrossRef] [Green Version]
  9. Dhaliwal, G.S.; Jindal, V.; Dhawan, A.K. Insect pest problems and crop losses: Changing trends. Indian J. Ecol. 2010, 37, 1–7. [Google Scholar]
  10. Singh, B.; Kular, J.S.; Ram, H.; Mahal, M.S. Relative abundance and damage of some insect pests of wheat under different tillage practices in rice–wheat cropping in India. Crop Prot. 2014, 61, 16–22. [Google Scholar] [CrossRef]
  11. Katare, S.; Jasrotia, P.; Patil, S.D.; Reza, M.W.; Saharan, M.S. Influence of sowing time and weather factors on seasonal dynamics of aphids in three wheat growing zones of India. J. Agrometeorol. 2018, 20, 134–138. [Google Scholar]
  12. Joshi, A.K.; Chand, R.; Arun, B. Wheat improvement in eastern and warmer regions of ndia: Conventional and non-conventional approaches. In A Compendium of Training Program (26–30 December, 2003); NATP, Indian Council of Agricultural Research—Banaras Hindu University: Varanasi, India, 2004. [Google Scholar]
  13. Ram, H.; Singh, B.; Sharma, I.; Bimbraw, A.S.; Mavi, G.S. Potentials of Resource Conservation Technology and Incidence of Pink Stem Borer (Sesamia inferens) in Various Varieties of Wheat (Triticum aestivum L.). In Proceedings of the 3rd International Group Meeting on “Wheat Productivity Enhancement under Changing Climate”; University of Agricultural Sciences: Dharwad, India, 2011; p. 149. [Google Scholar]
  14. Singh, B. Incidence of the pink noctuid stem borer, Sesamia inferens (Walker), on wheat under two tillage conditions and three sowing dates in north-western plains of India. J. Entomol. 2012, 9, 368–374. [Google Scholar] [CrossRef] [Green Version]
  15. Jaipal, S.; Malik, R.K.; Yadav, A.; Gupta, R. IPM issues in zero-tillage system in rice-wheat cropping sequence. Tech. Bull. 2005, 8, 32. [Google Scholar]
  16. Jasrotia, P.; Katare, S. Compatibility of insecticides with propiconazole against foliar aphid Rhopalosiphum maidis (Fitch) and yellow rust in wheat. Indian J. Entomol. 2018, 80, 1304–1309. [Google Scholar] [CrossRef]
  17. Macfadyen, S.; Kriticos, D.J. Modelling the geographical range of a species with variable life-history. PLoS ONE 2012, 7, e40313. [Google Scholar] [CrossRef] [Green Version]
  18. Gebhardt, M.R.; Daniel, T.C.; Schweizer, E.E.; Allmaras, R.R. Conservation tillage. Science 1985, 230, 625–630. [Google Scholar] [CrossRef] [Green Version]
  19. Kladivko, E.J. Tillage systems and soil biology. Soil Tillage Res. 2001, 61, 61–76. [Google Scholar] [CrossRef]
  20. Burton, R.L.; Krenzer Jr, E.G. Reduction of greenbug (Homoptera: Aphididae) populations by surface residues in wheat tillage studies. J. Econ. Entomol. 1985, 78, 390–394. [Google Scholar] [CrossRef]
  21. Hesler, L.S.; Berg, R.K. Tillage impact cereal-aphid (Homoptera: Aphididae) infestation in spring small grains. J. Econ. Entomol. 2003, 96, 1792–1797. [Google Scholar] [CrossRef]
  22. Clement, S.; Elberson, L.; Youssef, N.; Young, F.; Evens, M. Cereal aphid and natural enemies populations in cereal production systems in Eastern Washington. J. Kans. Entomol. Soc. 2004, 77, 165–173. [Google Scholar] [CrossRef]
  23. Dong, Z.; Hou, R.; Ouyang, Z.; Zhang, R. Tritrophic interaction influenced by warming and tillage: A field study on winter wheat, aphids and parasitoids. Agric. Ecosyst. Environ. 2013, 181, 144–148. [Google Scholar] [CrossRef]
  24. Kooyman, C.H.R.; Onck, R.F.M. The Interactions between Termite Activity, Agricultural Practices and Soil Characteristics in Kisii District, Kenya (No. 87-3); Agricultural University: Wageningen, The Netherlands, 1987. [Google Scholar]
  25. Rathore, L.; Sharma, P.K. Field efficacy of insecticides and biopesticides against aphid complex in wheat. J. Entomol. Res. 2016, 40, 77–80. [Google Scholar] [CrossRef]
  26. Gadhiya, V.C.; Borad, P.K. Effect of insecticidal seed treatment on reduction of termite damage and increase in wheat yield. Pestic. Res. J. 2013, 25, 87–89. [Google Scholar]
  27. Rivers, A.; Barbercheck, M.; Govaerts, B.; Verhulst, N. Conservation agriculture affects arthropod community composition in a rainfed maize–wheat system in central Mexico. Appl. Soil Ecol. 2016, 100, 81–90. [Google Scholar] [CrossRef]
  28. Shearin, A.F.; Reberg-Horton, S.C.; Gallandt, E.R. Direct effects of tillage on the activity density of ground beetle (Coleoptera: Carabidae) weed seed predators. Environ. Entomol. 2014, 36, 1140–1146. [Google Scholar] [CrossRef]
  29. Rivers, A.; Mullen, C.; Wallace, J.; Barbercheck, M. Cover crop-based reduced tillage system influences Carabidae (Coleoptera) activity, diversity and trophic group during transition to organic production. Renew. Agric. Food Syst. 2017, 32, 538. [Google Scholar] [CrossRef]
  30. Thorbek, P.; Bilde, T. Reduced numbers of generalist arthropod predators after crop management. J. Appl. Ecol. 2004, 41, 526–538. [Google Scholar] [CrossRef]
  31. Tamburini, G.; De Simone, S.; Sigura, M.; Boscutti, F.; Marini, L. Conservation tillage mitigates the negative effect of landscape simplification on biological control. J. Appl. Ecol. 2016, 53, 233–241. [Google Scholar] [CrossRef] [Green Version]
  32. Rice, M.E.; Wilde, G.E. Aphid predators associated with conventional-and conservation-tillage winter wheat. J. Kans. Entomol. Soc. 1991, 64, 245–250. [Google Scholar]
  33. Wilson-Rummenie, A.C.; Radford, B.J.; Robertson, L.N.; Simpson, G.B.; Bell, K.L. Reduced tillage increases population density of soil macrofauna in a semiarid environment in central Queensland. Environ. Entomol. 1999, 28, 163–172. [Google Scholar] [CrossRef]
  34. Andersen, A. Long-term experiments with reduced tillage in spring cereals. II. Effects on pests and beneficial insects. Crop Prot. 2003, 22, 147–152. [Google Scholar] [CrossRef]
  35. Lehmann, P.; Ammunét, T.; Barton, M.; Battisti, A.; Eigenbrode, S.D.; Jepsen, J.U.; Okland, B. Complex responses of global insect pests to climate warming. Front. Ecol. Environ. 2020, 18, 141–150. [Google Scholar] [CrossRef] [Green Version]
  36. Saudreau, M.; Pincebourde, S.; Dassot, M.; Adam, B.; Loxdale, H.D.; Biron, D.G. On the canopy structure manipulation to buffer climate change effects on insect herbivore development. Trees 2013, 27, 239–248. [Google Scholar] [CrossRef]
Figure 1. Major insect pests of wheat in the Indo-Gangetic Plain of India.
Agronomy 11 01087 g001
Figure 2. Location of the experimental site.
Agronomy 11 01087 g002
Figure 3. Foliar aphid, Rhopalosiphum maidis (Fitch) (aphids/tiller) in wheat grown under 3 tillage practices during 2016–2017 and 2017–2018 (pooled). Bars with same letters are not significantly different at p < 0.05. Error bars denote ±1 SE.
Agronomy 11 01087 g003
Figure 4. Root aphid, Rhopalosiphum rufiabdominalis (Sasaki) abundance (aphids/tiller) in wheat grown under 3 tillage practices during 2016–2017 and 2017–2018 (pooled). Bars with same letters are not significantly different at p < 0.05. Error bars denote ±1 SE.
Agronomy 11 01087 g004
Figure 5. Damage from termites, Odontotermes obesus (Rambur) and Microtermes obesi (Holmgren), in wheat grown under 3 tillage practices during 2016–2017 and 2017–2018 (pooled). Bars with same letters are not significantly different at p < 0.05. Error bars denote ±1 SE.
Agronomy 11 01087 g005
Figure 6. Per cent damage from pink stem borer, Sesamia inferens (Walker), in wheat grown under 3 tillage practices during 2016–2017 and 2017–2018 (pooled). Bars with same letters are not significantly different at p < 0.05. Error bars denote ±1 SE.
Agronomy 11 01087 g006
Figure 7. Populations of major natural enemies (number per m2) in wheat grown under 3 tillage practices during 2016–2017 and 2017–2018 (pooled). For each predator type, bars with the same letters are not significantly different at p < 0.05. Error bars denote ± 1 SE.
Agronomy 11 01087 g007
Figure 8. Correlation between standardized NDVI (day−1) and aphid abundance (aphids/tiller) or damage (%) in wheat grown under 3 tillage practices during 2016–2017 and 2017–2018 (pooled). (‘*’—p < 0.05; ‘**’—p < 0.01).
Agronomy 11 01087 g008
Figure 9. Correlation between canopy temperature (°C) and aphid abundance (aphids/tiller) or damage (%) in wheat grown under 3 tillage practices during 2016–2017 and 2017–2018 (pooled). (‘*’— p < 0.05; ‘**’— p < 0.01).
Agronomy 11 01087 g009
Table 1. Weather parameters recorded at the experimental site during 2016–2017 and 2017–2018. (Nov = November, Dec = December, Jan = January, Feb = February, Mar = March).
Weeks after Sowing
(WAS)
DatesStandard Meteorological Weeks2016–20172017–2018
Average Temperature (°C)Average Relative Humidity (%)Total Rainfall (mm/day)Average Temperature (°C)Average Relative Humidity (%)Total Rainfall mm/day
119 Nov–25 Nov4719.159.50.016.057.80.0
226 Nov–02 Dec4819.662.90.015.961.40.0
303 Dec–09 Dec4915.480.90.015.960.90.0
410 Dec–16 Dec5015.681.40.014.282.45.2
517 Dec–23 Dec5114.472.40.014.474.60.0
624 Dec–31 Dec5214.177.10.013.580.70.0
701 Jan–07 Jan115.380.98.09.689.80.0
808 Jan–14 Jan29.880.419.012.170.50.0
915 Jan–21 Jan311.281.03.613.374.40.0
1022 Jan–28 Jan 30415.184.155.212.286.134.2
1129 Jan–04 Feb514.280.40.014.972.00.0
1205 Feb–11 Feb614.075.20.013.267.00.0
1312 Feb–18 Feb716.172.90.015.075.929.0
1419 Feb–25 Feb817.567.40.017.675.40.0
1526 Feb–04 Mar917.862.30.319.972.40.0
1605 Mar–11 Mar1017.563.97.519.366.90.0
1712 Mar–18 Mar1115.564.60.021.262.40.0
1819 Mar–25 Mar1222.060.90.021.662.90.0
Table 2. Split-plot ANOVA for foliar aphids (per tiller), root aphid (per tiller), termite damage (%), and pink stem borer damage with tillage, insecticide protection, and time of observation as factors during 2016–2017 and 2017–2018 (pooled) (significance: p ≤ 0.05 are bolded).
SourceFoliar AphidRoot AphidTermitesPink Stem Borer
dfFpdfFpdfFpdfFp
Tillage23.850.0423.280.0429.090.04220.110.0002
Insecticide protection15.130.03118.770.00117.240.014140.360.0001
Time of observation413.360.00021.250.32931.320.03241.650.211
Tillage × insecticide protection20.090.90221.210.0321.270.30220.280.04
Tillage × time of observation80.330.94040.050.99360.090.51080.160.999
Tillage × insecticide protection
× Time of observation
80.120.02740.130.96860.130.98980.100.825
Publisher’s Note: MDPI stays neutral with regard to jurisdictional claims in published maps and institutional affiliations.

