Article

Effect of Long-Term Soil Management Practices on Tree Growth, Yield and Soil Biodiversity in a High-Density Olive Agro-Ecosystem

1
CREA-DC, Council for Agricultural Research and Economics, Research Centre for Plant Protection and Certification, 50125 Firenze, Italy
2
Department of Agriculture, Food and Environment, University of Pisa, 56124 Pisa, Italy
3
CREA-AA, Council for Agricultural Research and Economics, Research Centre Agriculture and Environment, 50125 Firenze, Italy
*
Author to whom correspondence should be addressed.
Agronomy 2021, 11(6), 1036; https://doi.org/10.3390/agronomy11061036
Submission received: 12 March 2021 / Revised: 14 May 2021 / Accepted: 17 May 2021 / Published: 22 May 2021
(This article belongs to the Special Issue Conservation Tillage in Sustainable Agro-Ecosystems)

Abstract

:
Edaphic arthropod communities provide valuable information about the prevailing status of soil quality to improve the functionality and long-term sustainability of soil management. The study aimed at evaluating the effect of plant and grass cover on the functional biodiversity and soil characteristics in a mature olive orchard (Olea europaea L.) managed for ten years by two conservation soil managements: natural grass cover (NC) and conservation tillage (CT). The trees under CT grew and yielded more than those under NC during the period of increasing yields (years 4–7) but not when they reached full production. Soil management did not affect the tree root density. Collecting samples underneath the canopy (UC) and in the inter-row space (IR), the edaphic environment was characterized by soil structure, hydrological properties, the concentration and storage of soil organic carbon pools and the distribution of microarthropod communities. The soil organic carbon pools (total and humified) were negatively affected by minimum tillage in IR, but not UC, without a loss in fruit and oil yield. The assemblages of microarthropods benefited, firstly, from the grass cover, secondly, from the canopy effect, and thirdly, from a soil structure ensuring a high air capacity and water storage. Feeding functional groups—hemiedaphic macrosaprophages, polyphages and predators—resulted in selecting the ecotonal microenvironment between the surface and edaphic habitat.

Graphical Abstract

1. Introduction

Crop diversification and the optimal use of resources contribute to the long-term sustainability of agroecosystems and climate change mitigations [1]. In Mediterranean areas, growers often use intensive tillage and the removal of cover crops to avoid tree water [2,3]. However, in the absence of any ground cover and under intensive cultivation, water scarcity and soil erosion lead to the depletion of soil organic matter (SOM) [4,5]. In order to single out options ensuring sustainable soil use and biodiversity conservation [6], the adoption of site-specific and finely tuned soil management practices is required to account for the high variability of soils in the Mediterranean basin [7].
Among the strategies used to contrast soil degradation, grass cover of the orchard floor or the adoption of reduced tillage appear to exert positive effects on the soil physical properties and fertility [8,9]. On the other hand, olive growers are often challenged by potential yield reductions due to the competition for water and nutrients, especially in rainfed orchards. Previous works have reported no significant reduction in fruit yield induced by natural green covers [10,11], but more studies are needed to assess the possible long-term effects on the yield components and vegetative growth in high-density, irrigated olive orchards. It has been shown that different practices can modify root growth and distribution [12,13,14]. Root systems play multiple roles on belowground processes; for instance, root exudation affects the soil structure by stimulating microbial activity and contributing to soil aggregation [15] and aggregate stability, improved by the enmeshing effect of fine roots [16]. Most roots, nutrients and organic matter are usually concentrated in 0.05–0.20 m of the topsoil, whereas the subsoils show less oxygen and organic matter availability [17].
The evaluation of soil management effectiveness and sustainability requires the monitoring of suitable indicators of soil quality. Soil organic matter and its fractions, soil aggregate stability, soil porosity and soil biological activity and diversity are widely recognized as soil quality indicators, because they are related to soil ecosystem functions [18]. Environmental drivers (temperature, moisture, soil texture and structure, aggregate stability, porosity, salinity, pH and soil organic matter) and land management are closely related to assemblages of microarthropods communities [19]. They contribute to soil and plant health through their intersecting roles in decomposition and nutrient cycling and the direct and indirect suppression of plant pests [20]. Several approaches and multivariate methods have been recently developed to detect the changes in the microarthropod community structure and to exploit its actual bioindication power [21]. Soil biodiversity loss, i.e., the reduction of living forms (in terms of both quantity and variety) and their related roles, cause a deterioration of the soil functions or ecosystems [22,23,24,25]. The soil status can be assessed by the functional biodiversity; by this, microarthropods can be characterized based on diverse feeding strategies and different adaptation degrees allowing them to inhabit soil microhabitats [26]. Colonizers, comminutors and soil ecosystem engineers within soils contribute, together with their interactions with microorganisms, to soil functioning and processes [27]; predatory and omnivorous myriapods, arachnids and insects, are involved in regulating services towards pest species [28]. In terms of their abundance and soil-forming roles, the ecosystem engineers (ants, termites and beetles) are able to increase soil fertility by modulating the availability of resources to other edaphic species [29]. Functional biodiversity has only recently been considered for its potentially high ecological significance: a stressful agent may lead to the disappearance of some species and make new ecological niches and/or resources available for other organisms [17,28]. A permanent grass cover may preserve the organic matter content [30] and, at the same time, affect the soil structure dynamics and composition of microarthropod groups [31]. Generally, edaphic species, mainly the nonburrowers, tend to colonize air-filled pore spaces and to build different community structures [32]. Soil-dwelling microarthropods have high taxonomic and functional diversity. In soil ecosystems, the Acari are usually more abundant and diverse than any other arthropod group [33,34]. Oribatid mites are predominant in most undisturbed soil habitats [35] and have been used as indicators of soil quality [36]; their assemblages can be significantly affected by several kinds of disturbances, while their density may decrease in species sharing biological traits that are affected by disturbances [37]. Similarly, Collembola affect ecosystem functioning by regulating the soil microbial activity by directly feeding on microorganisms [38], as well as by changing the soil structure through litter comminution, casting and other mechanisms [39,40]. Moore et al. [40] reported that soil communities are less resistant to stress if their diversity is low. Studies exploring how soil disturbances alter microarthropod community structures have seldom investigated the ecosystem functions [41]. Thus, the structural and functional features of microarthropod biodiversity remain largely unexplored [42]. We comprehensively investigated the long-term effects of conservation tillage (CT) versus that of natural green cover (NC) on tree growth; root distribution; yield and chemical, physical and biological properties of soil in a high-density mature olive orchard. Since NC soil management is currently being adopted more and more frequently in the Mediterranean area, the objective was to test the compatibility of this practice with the high productivity of olive trees and improvements in the soil quality. Particular emphasis was paid to the composition of the microarthropod community and the role played by the different taxonomical groups.

2. Materials and Methods

2.1. Study Site and Experimental Design

The experiment was carried out in an olive (Olea europaea L. cv. Frantoio) orchard planted at a density of 513 trees ha−1 in April 2003 at the Venturina experimental farm of the University of Pisa, Italy (43°10′ N; 10°36′ E). The climate at the study site was subhumid Mediterranean [43]. The soil was a Typic Haploxeralf [44], with sandy loam texture. Conservative agronomic practices were used since planting to keep labor and chemical inputs to a minimum (see [9,43] for details).
The trees were fully irrigated since planting until the 2006 growing season, when a deficit irrigation was imposed using subsurface drip lines [43]. Trees received about half the volume needed to fully satisfy their requirements. However, in the 2011–2013 period, the irrigation regimes were different. In 2011, the trees received only complementary irrigation, whereas in 2012 and 2013, the trees were not irrigated between days 41–71 and 60–85 after full bloom (DAFB) and were fully irrigated for the rest of the irrigation period [45,46]. The soil was periodically tilled at a depth of 0.1 m until October 2004, when two management treatments were started: CT, shallow tillage by a power take-off-driven harrow with vertical blades (Breviglieri, Nogara, Italy); NC, permanent grass cover periodically mown using a mulcher. Afterward, the treatments were maintained by either tilling or mowing the green cover three or four times a year [9,16].
The experiment consisted of six plots (three plots per soil management) with three replicates. Each included 3 rows of 4 trees each, for a total of 12 trees per plot. To avoid the border effect, all measurements and samples were taken on the trees of the central row of each plot. Soil samples for chemical, physical and biological analyses were collected at different positions in May 2014: (i) underneath canopy area (UC, 0.5 m from the trunk) and (ii) inter-row space, located in the midpoint between two adjacent tree rows (IR, 2.5 m from the trunk) (Figure 1). To investigate the effects of sol management on tree root development, soon after the collection of samples for soil analyses, two L-shaped trenches (1 m deep and 0.8 m wide) were dug at 2.1 m away from tree row (Figure 1 and Figure 2). Soil cores for olive root density determination were taken along six trenches (three in the CT plots and three in the NC ones). In each trench, the samples were collected 0.2, 0.4, 0.6 and 0.8 m deep using a custom-built cylindrical auger (25 cm3) at 22 sampling positions (11 positions/side) and immediately frozen.

2.2. Fruit Yield, Trunk Growth and Root Distribution

Nine trees for each soil management system (three trees for each plot) were harvested by hand every year (between October 16 and November 6, except for 2006, when the trees were harvested on November 20).
Every year, at the end of the growing season, the trunk cross sectional area (TCSA) at a 0.4-m height was measured on each tree. The weight of the pruned material was measured immediately after pruning every spring [43]. Yield efficiency was calculated as the fruit yield divided by pruning weight to account for the differences in tree size and vegetative growth.
All soil samples collected for root density determination were thawed, immersed in a Na2CO3 solution (2 g L−1) to facilitate deflocculation, shaken for 2 h and then washed under running water on a 1-mm mesh sieve. Olive roots were carefully recovered by tweezers, divided into cohorts of different diameters (<1 mm; 1–2 mm; 2–5 mm) using graph paper and the dry weight of each fraction was determined by oven-drying at 60 °C until a constant weight. Root density was calculated as root dry weight per soil volume. Only the fine roots (<2 mm) were considered in this study.

2.3. Soil Physical and Chemical Properties

The soil bulk density (BD) of the 0.0–0.1-m depth layer was determined by the core method [47] of removing the contribution of gravel and roots, whose density was assumed to be 2.62 and 0.55 g cm−3, respectively. Dry and wet sieving [48] were employed for evaluating the aggregate size distribution and water stability, respectively; finally, the aggregate mean weight diameter (MWD) was calculated as described by reference [16].
For soil structure characterization, the micro-morphometric method [49], based on the image analysis of soil thin sections, was adopted; to this aim, the vertically oriented thin sections (55 × 85 mm) obtained from undisturbed soil samples collected at 0.05–0.10-m depth at each sampling point, were analyzed. Total macroporosity (pores larger than 50 μm) and pore distribution according to their different shapes [50] and sizes were measured [16]. Based on their functions, pores of 50–200 and 200–500 μm were described as transmission pores and those >500 μm as fissures [51].
To determine the water retention capacity, 24 additional undisturbed soil samples were collected from the 0–0.10-m layer. The water content at saturation (S, 0 kPa) was measured using the sand box apparatus [52], whereas retention measurements at the matric potentials of −10 and −1500 kPa, corresponding to the field capacity (FC) and wilting point (WP), respectively, were carried out by the pressure plate extractors [53]. The moisture content at each matric potential was then expressed as the percentage by weight of the oven dry soil (θg). Bulk density values were then used to convert the gravimetric water content data on a volumetric basis (θv) by applying the Gardner equation [54]. The air capacity (AC = S-FC) and the available water capacity (AWC = FC–WP) were also calculated.
The soil organic matter was investigated based on the soil total organic C content (TOC) and organic C fractionation. Soil TOC was determined by wet–hot oxidation with potassium dichromate and sulphuric acid, according to Yeomans and Bremner [55]. Organic C fractionation was performed chemically on the total-extractable C fraction (TEC) recovered by a 0.1-M NaOH + 0.1-M Na4P2O7 solution [56]. TEC was separated into humic acids (HA) and fulvic acids (FA) by H2SO4 acidification; then, fulvic acids were purified from non-humic substances with the polyvinylpyrrolidone column method. The FA and HA fractions were mixed to calculate the humified carbon (HC). The amount of C in each extract was assessed by hot oxidation [55]. The percent ratio of HC to TEC was used as a measure of the degree of organic C humification (DH).

2.4. Edaphic Arthropod Community and Functional Biodiversity

Two soil cubes (10 × 10 × 10 cm)/olive plant were collected at the different distances from the plant (UC and IR). The extraction of arthropods from soil samples was performed using the Berlese-Tullgren funnel for 7 days under light bulbs. The specimens collected were maintained in preservative liquid (ethanol 75°, glycerin 5% and acetic acid) until observed under a stereomicroscope.
For an appropriate interpretation of the soil conservation strategy, after arthropod extractions, the soil quality was evaluated by the multitaxon biological index. All specimens were classified, at least, up to Order level or/and life stage [57] and evaluated to assess the biodiversity (taxa richness and β-diversity). An integrative measure of the system response to management was calculated by the ratios Acari/Collembola [58] and Oribatida/Other Acari [59], which provide information about the equilibrium state of communities, as it tends to decrease under stress conditions. The Oribatid assemblages were also analyzed in six major phylogenetic groups (Palaeosomata, Enarthronota, Parhyposomata, Mixonomata, Brachypylina Desmonomata and Brachypylina Poronota) [60].
The soil biological functionality was evaluated by microarthropod distribution in the soil and according to their ecomorphological adaptation to soil life, as indicated by Parisi et al. [57]: soil-dwelling, euedaphic; litter-dwelling, hemiedaphic and surface-dwelling, epedaphic. Acari, the most abundant microarthropod group, was split into two superorders: Parasitiformes (Mesostigmata) and Acariformes (Trombidiformes Prostigmata and Sarcoptiformes-suborders Oribatida, Endeostigmata and Astigmata) [61]. Parasitiformes generally occur at the humus–soil interface, rarely penetrating more than 3 cm deep; Acariformes are usually found at more than 10 cm deep in most soil ecosystems [62,63]. The distribution pattern of these groups was analyzed within the soil parameters as pore volumes, available water capacity, bulk density, TOC and HC to evaluate the microenvironment selection. Furthermore, to characterize the complexity of trophic niches, the community structure has also been evaluated by abundances of their main six Functional Feeding Groups (FFGs): macro- and microsaprophages, mycophagous, polyphagous, predators/parasitoids and herbivores/fluid feeders [16].

2.5. Statistical Analysis

Each treatment was assigned to 36 trees, divided into three plots of 12 trees arranged in three rows (Figure 1). To avoid the border effects, all measurements and samples were taken on the trees of the central row of each plot. An ANOVA test was applied to the separate means of six: three replicates for the trench position (south trenches versus north trenches) and soil layer (0.2–0.4 m versus 0.6–0.8 m), respectively. Treatment means (fruit yield, TCSA and pruning weight) were separated by least significant differences (LSD test) after the analysis of variance (ANOVA) for nine replicate trees using the Costat software package (CoHort Software, Monterey, CA, USA). Each soil sampling point within the trenches was replicated three times for each soil management system.
Soil physical and chemical data were statistically analyzed by a two-way (Management and Position) ANOVA, using the StatSoft Statistica 10.0 software package (StatSoft, Tulsa, OK, USA). Post-hoc mean separation was performed by Duncan’s multiple range test.
For functional diversity on microarthropods, a multivariate approach (GLM analysis) was adopted to assess the effect of management on the soil microhabitat properties (pore volumes, AWC, BD, TOC and HC) and the abundance of the ecomorphotypes of the microarthropods. All the variables were normalized by adopting the log transformation (y = ln(x + 0.5)) [64]. Nonmetric multidimensional scaling (NMDS), based on the Euclidean dissimilarity index, was adopted to characterize the ordination of the arthropod groups and how they were affected by management. Permutational multivariate analysis of variance (PERMANOVA) was used to test for differences in assemblages among the different patterns visualized with NMDS. For each treatment, after a significant PERMANOVA test, an analysis of similarity percentages (SIMPER) was used to test what arthropod groups were driving the differences in assemblages within and between managements.
Regarding taxa richness, rarefaction curves were extrapolated to evaluate assemblage differences of edaphic arthropods by the management and position (95% confidence interval of expected taxa richness based on the bootstrapping method).
Correlation of oribatid assemblages, in the four combinations of soil management and position, was assessed by the principal component analysis (PCA).
The Canonical Correspondence Analysis was performed to explore the distribution of microarthropods in relation to the measured microhabitat environmental drivers. The effect of thirteen edaphic factors on the variation in the five ecomorphotypes was assessed. The analysis implementation was carried out by using PAST software [65] following the eigen analysis algorithm given in Legendre and Legendre [66]. The criteria followed in determining that the ecological groups of microarthropods were the same adopted in a multivariate analysis.

3. Results

3.1. Fruit Yield, Trunk Growth and Root Distribution

Olive trees started yielding fruits early during the training phase. The pruning during training was limited to the selection of future primary branches and did not require the removal of shoots. During the training phase (year 0–3), trees managed by soil harrowing grew vigorously and more than those that underwent the competition by grasses (Table 1). The trees under CT grew and yielded more than those under NC during the onset of production and the period of increasing yields (years 4–7). By this time, the trees reached full canopy expansion and full production, and there were no more differences in the yields and yield efficiency between the two soil management treatments. Over the entire 14-year period, tillage produced 35% more fruits than NC (Table 1).
The root distribution for each soil management system and trench side is shown in Figure 2. Soil management did not affect the tree root density, which was similar in NC (3.59 ± 1.07 kg m−3 of soil) and CT (3.48 ± 0.74 kg m−3) (values are the means ± standard deviation of three replicate trenches).
Higher values of root density were measured in the south trenches (4.01 ± 0.90 kg m−3) than in the north trenches (3.06 ± 0.78 kg m−3), regardless of the soil management. A higher, but not significant, root density was measured in the upper (0.2–0.4 m) layer (+31%) compared to in the lower (0.6–0.8 m) one. The closer proximity of the A3 and A4 sampling points to the tree row induced only slight increments (+15%) in the root density compared to the A1, A2, A5 and A6 positions.

3.2. Soil Physical and Chemical Properties

Soil management significantly affected the total macroporosity. In the CT plots, the soil porosity was much higher than in the NC; the difference was mainly due to a higher frequency of elongated pores and, in general, of larger macropores (Figure 3).
Regular pores were affected by soil management, with higher values for NC than CT (Figure 3). As for the pore size, the highest frequency of fissures was observed in the inter-row space of CT, while the highest percentage of transmission pores in the range 200–500 µm was detected underneath the canopy in CT (Figure 3).
The bulk density was not significantly affected by management and position (Table 2). Tillage significantly reduced the MWDdry compared to NC, whereas the MWDdry was not affected by the distance from the plant. Very high values of MWDwet, significantly different from CT, were measured at both NC positions. In particular, the MWDwet was lower in the inter-row space of the CT. The AC and AWC were significantly affected by management; NC increased the AWC compared to CT. The latter, instead, induced an increase of AC (Table 2).
The soil organic C pools showed different treatment-related patterns, without significant changes related to the distance from the tree under NC, but a significant decrease in TOC and HC values in the inter-row space (IR) compared to the canopy area (UC) under CT (−25% and −85%, respectively).
When comparing NC to CT plots, the former had higher TOC and HC contents, averaging +20% and +41% underneath the canopy and +40% and +107% in the inter-row spaces, respectively. The degree of humification (DH) did not differ significantly, not in relation to the treatment or in relation to the distance from the tree.

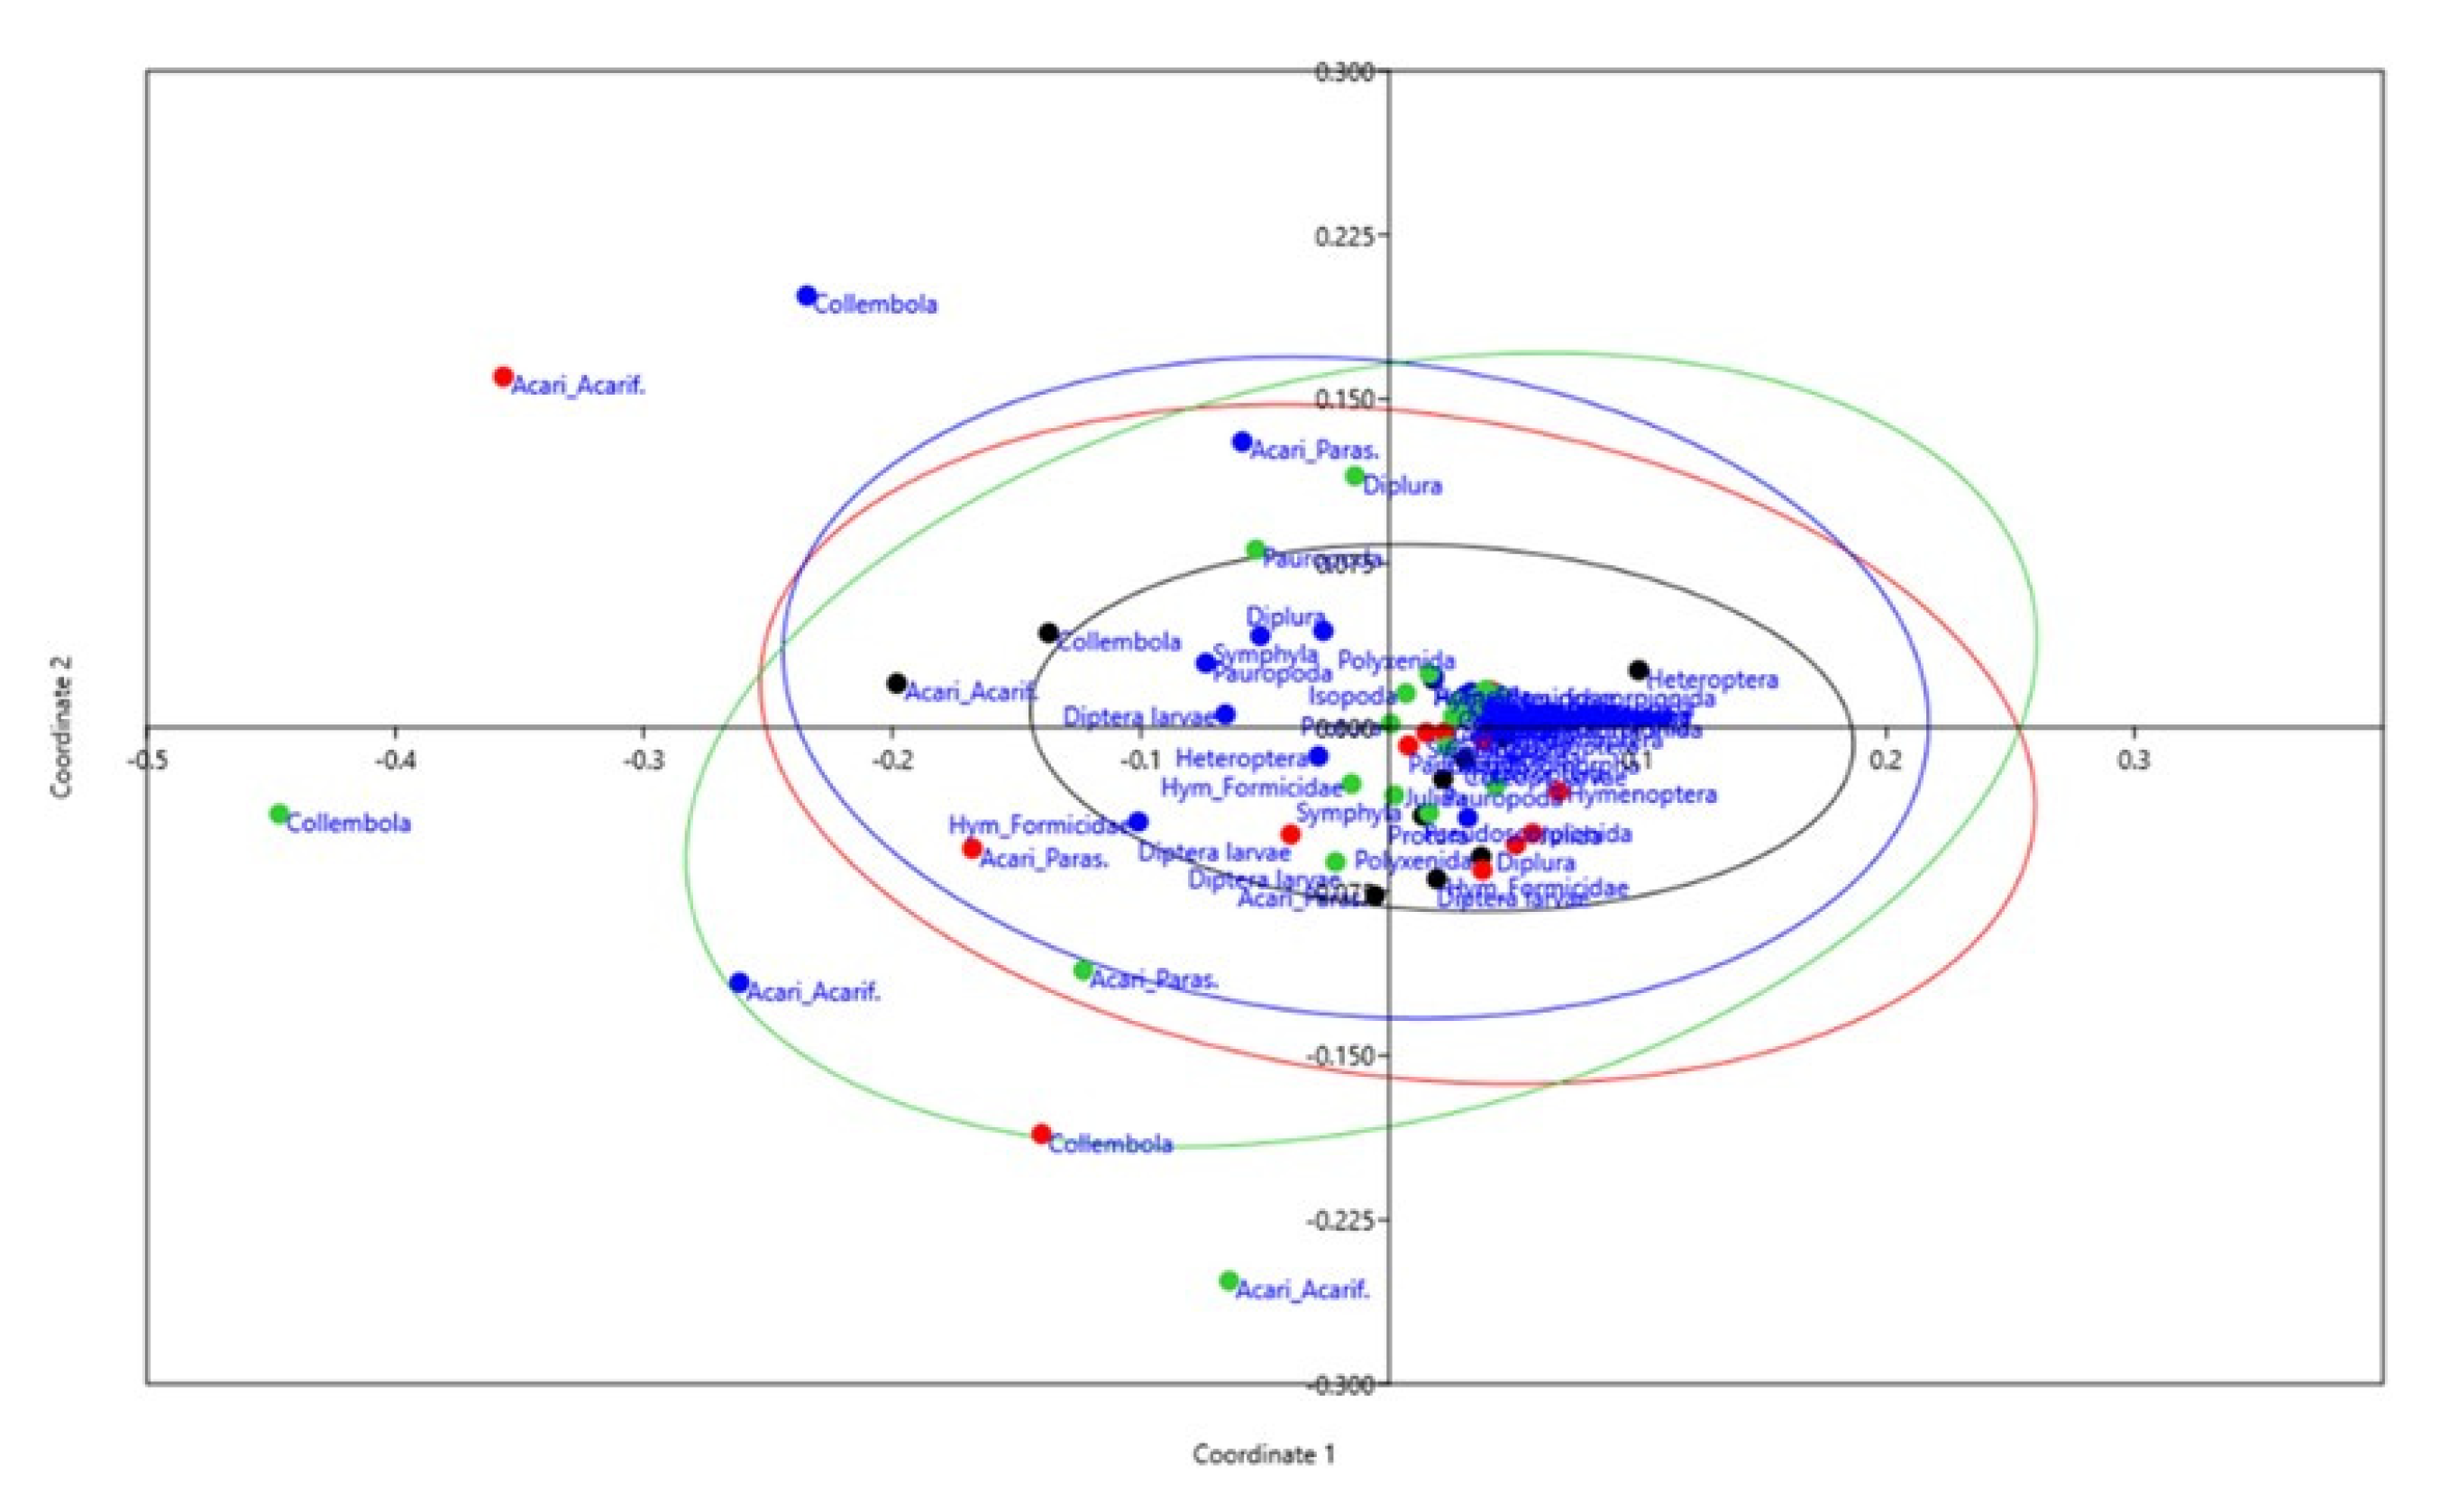
3.3. Characterization of Edaphic Arthropod Community and Soil Biodiversity

More than 13,500 arthropods were collected, and the most abundant groups were Acari (54%) and Collembola (36%), following by Hymenoptera Formicidae (2%), Diptera larvae (2%), Pauropoda (2%), Diplura (2%), Julida (1%) and Symphyla (1%), accounting for approximately 99% of the organisms collected. Coleoptera adults and larvae, Embioptera, Geophylomorpha, Lithobiomorpha, Polyxenida, Isopoda, parasitoid Hymenoptera, Heteroptera, Psocoptera, Lepidoptera larvae, Thysanoptera, Araneae, Pauropoda and Protura represented, overall, about 1%.
In NC-UC, each taxa group was more than 50%, excluding Acari, Collembola and Araneida (Figure 4).
Overall, in soil with a grass cover (NCs), hemi-edaphic groups such as Formicidae, Isopoda, Coleoptera and eu-edaphic formed, as Geophylomorpha, Diplura, Protura, Pauropoda and Symphyla showed high frequency (Figure 4).
In the litter stratus under the tree canopy (UC), Pseudoscorpionida and, to a lesser extent, Diplopoda, Embioptera and Heteroptera were present. The tilled soil favored insect larvae and Thysanoptera, but several arthropod groups were not recovered from CT-IR soils (Figure 4).
The nMDS ordination showed the clustering of eco-morphotype assemblages: for each treatment, the Acariformes and Collembola groups were distinct from all other arthropods (Figure A1). Among the groups, Acari and Collembola were ubiquitous, but their abundances varied greatly depending on the soil management and crops. For each treatment, they were correlated with community assemblages, as confirmed by PERMANOVA (p ≤ 0.001), so the SIMPER analyses were performed separately for each treatment. From the SIMPER analysis was observed an assemblage dissimilarity higher than 50% only in the comparison between CT-IR and CT-UC, where Acariformes (contribution 56.9%), Collembola and Parasitiformes accounted for a cumulative dissimilarity of more than 90%; these three groups accounted for a cumulative dissimilarity <80% in the NC-IR versus NC-UC comparison, while, for all other comparisons, this percentage ranged from 81% to 86%.
Soil management affected the changes in the community assemblages: maximum abundance (N) (Table A1 in Appendix A) and biodiversity (Figure 5) were measured at NC-UC positions where both canopy tree and grass cover were present. A less diverse system was identified in CT-IR; the rarefaction curve of the biological forms was dominated less by few species and shorter than others (Figure 5).
The Acari/Collembola ratio was high in the tilled plots (A/CCT-UC = 3.18; A/CCT-IR = 1.8) where tillage affected negatively the Collembola, mainly Entomobryomorpha, and eu-edaphic forms more than Acari. Oribatid mites were also susceptible to the absence of grass cover; however, under the canopy, the Oribatids/Other Acari ratio was about 1. Both ratios were very similar in NC.
According to their high biodiversity and trophic niche, 35 species of Oribatids (N = 435) were identified, excluding immature stages, in each different management: the highest species richness was in CT-UC (S = 22). Cosmopolitan species, such as Tectocephaeus velatus, Scheloribates laevigatus and Oppiella excavata, showed no relationship with other oribatids; they reached high densities in plowed soils where the soil structure was altered and the decomposition of organic was fast.
Figure 6 shows the correlation between oribatid species and combinations of the management system (NC and CT) and position (UC and IR); it is highlighted that the mite assemblage matches up to the other oribatid species (PC1, variance = 73%) and to the soil management (PC2, variance = 19%). Some species distribution depends on the natural vegetation cover (NC), especially those of macrosaprophagous, such as Oribatula sp., Eupelops sp. and Papillacarus aciculatus. On the other hand, tillage (CT) influences the microsaprophagous species typical of crop soils, such as Scheloribates laevigatus or Punctoribates punctum. Minunthozes sp. Tectocephaeus tectorum, Microppia minus and Oribatula laubieri were not correlated in the main principal components.

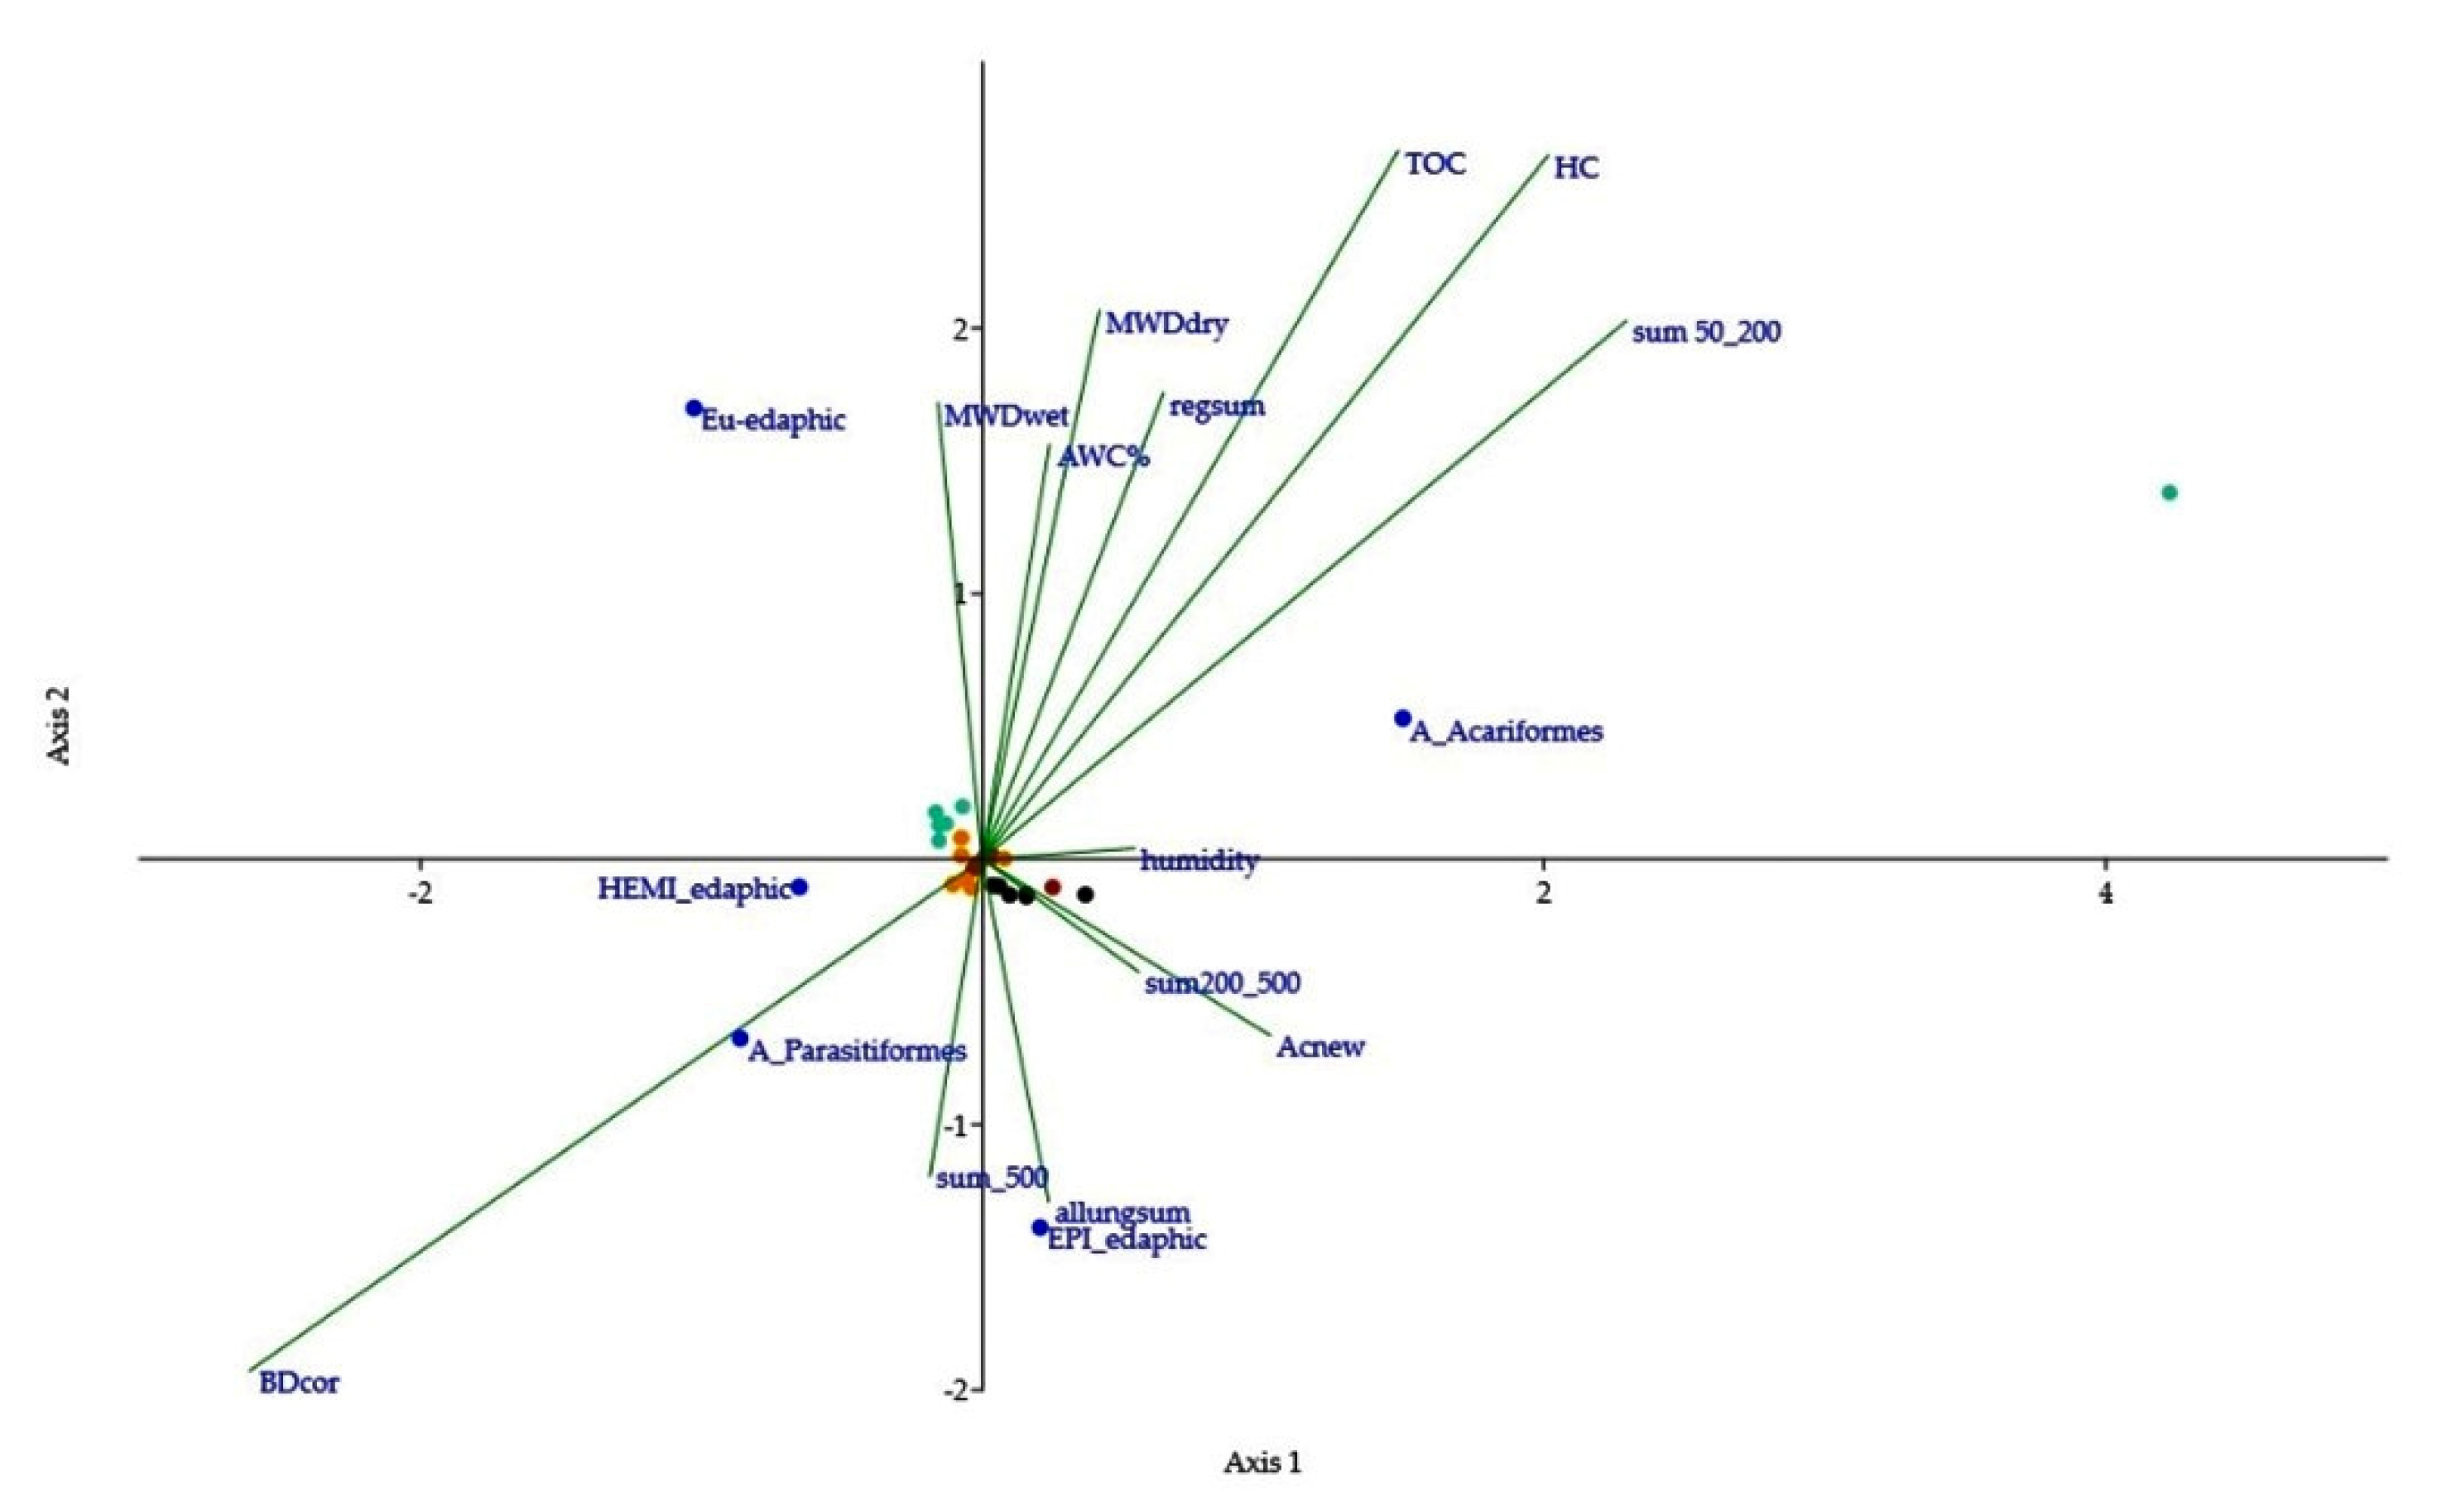
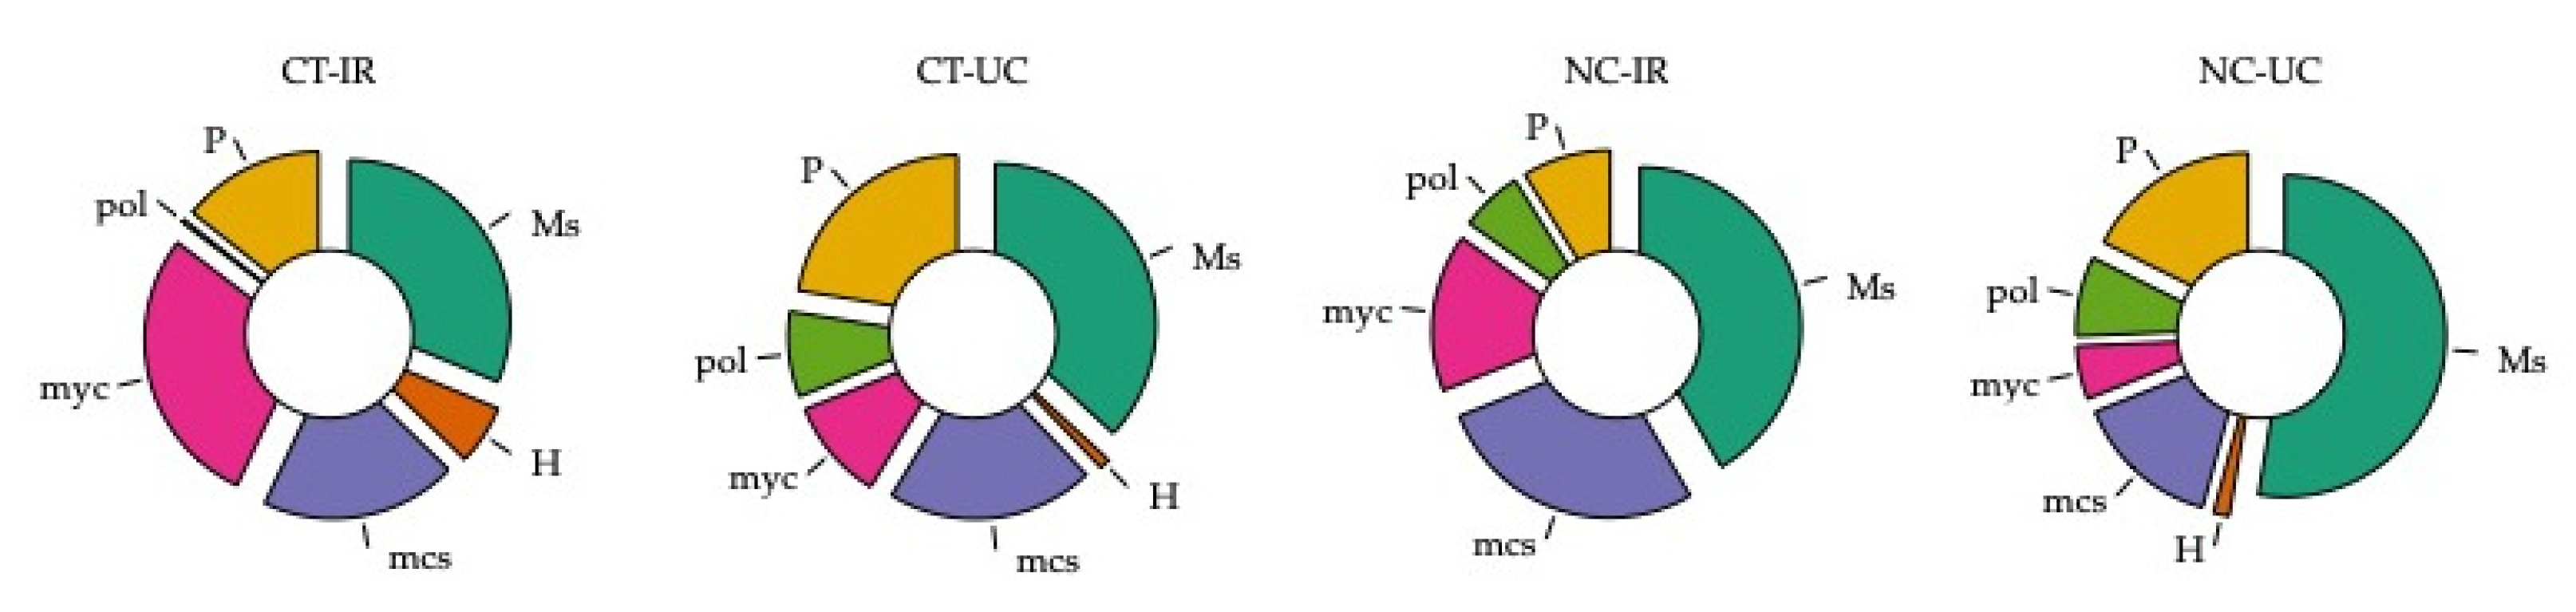
3.4. Functional Biodiversity of Edaphic Arthropods

The arthropods in the different functional groups can be further divided into ecological subgroups based on their adaptations to edaphic life. Among the arthropod groups, the main effect on the densities of Acari Acariformes was determined by the distance from the tree (F3,20 = 3.39; p < 0.05; CT-UC > NC-IR; NC-UC > CT-IR) (Figure 7).
The other eu-edaphic arthropods resulted in being more susceptible to soil management tillage and to the absence of plant cover (F3,20 = 3.13; p < 0.05; CT-IR < CT-UC; NC-IR; NC-UC). Conservation tillage did not alter the distribution of Acari Parasitiformes and hemi-edaphic groups (p > 0.05). The microhabitat in CT-IR was characterized by the lowest values of TOC (F3,20 = 7.12; p < 0.01), MWDwet (F3,20 = 198; p < 0.001), AWC (F3,20 = 13.7; p < 0.001) and regular pores (F3,20 = 9.46; p < 0.001).
The Canonical Correspondence Analysis results are displayed by an ordination diagram, where the edaphic environmental factors are identified by arrows and microarthropod groups by points (Figure 8). The ordinations axes are presented in s sequence of variance explained by linear combinations of the environmental variables. The total CCA analysis demonstrated that all the investigated factors accounted for 62.1% of the variation (adjusted explained variation 12.8%) in the species dataset (λ-trace = 2.63, F-ratio = 1.42, p-value = 0.01).
The CT management favored epigeic and, to a lesser extent, hemiedaphic forms related to the larger (>500 μm) and the elongated pores. Although the management did not affect the BD, the latter was strongly related to Parasitiformes, especially in NC-IR.
The microhabitat selected by Acariformes was characterized by the occurrence of regular and 50–200-µm pores within the TOC and HC contents; the distribution of other eu-edaphic forms was affected by MWDwet that abruptly decreased in CT-IR.
To provide an overview of the soil functional biodiversity, the relative frequencies of the feeding habits of microarthropods showed different compositions between the managements; macrosaprophages, mainly represented by Oribatids, epigeic forms of Collembola Enthomobryomorpha and Sminthuridae, Diplopoda Julidae and Coleoptera larvae, were abundant in NC-UC (Figure 9).
The assemblages of the feeding functional groups, by management and position, are shown in Figure 9.
The absence of vegetation cover and low soil moisture led to the dominance of some arthropod groups usually able to quickly thrive in stressed environments and to a high percentage of herbivores/fluid feeders (6%); polyphagous groups were not registered. Focusing on the feeding habits of Acari, mycophagous and microsaprophages were abundant in the inter-rows (CT-IR and NC-IR), while predators contributed to arthropod assemblage in the context of UC.

4. Discussion

Olive trees grown on NC plots showed a lower cumulative fruit yield than CT trees. This was particularly evident during the onset of fruit production before full canopy expansion. This result could be attributed to the early (a year and a half after planting) establishment of grass permanent cover [9]. Once olive canopies were fully developed, there were no difference in yield between NC and CT, in agreement with results from a 15-year experiment carried out in Spain where tillage was compared against no tillage [10]. Root density was unaffected by soil management and root spatial distribution was quite uniform across the soil profile. The proximity to the drippers of the South-profiles induced a higher (+31%), but not significant, root density compared to the North ones. Tognetti et al. [14] reported that fine roots were positively influenced by the proximity of drippers, whereas coarse roots were less affected. The lack of significant differences in root density between soil management systems, as well as between sampling points, was probably due to the close planting distance and the good soil depth and fertility conditions, which promoted an almost complete soil volume exploration both laterally and in depth.
Overall, permanent grass cover was more effective than tillage-based management in maintaining or improving soil properties and related functions, which is generally expected from management strategies involving higher organic C inputs and less soil disturbance. Grass cover increased both TOC (UC and IR locations) and HC (IR location), by supplying additional organic residues to the orchard inter-row, and possibly allowing better physical protection of soil organic matter from mineralization. As a result, the grass-covered plots also exhibited a higher organic C spatial uniformity, in contrast with the decreasing trend of soil organic C pools from the tree row to the inter-row space under tillage.
Different soil disturbance and organic C inputs determined functionally distinct physical environments. Soil structure conditions under NC improved the water holding capacity, whereas the macroporosity and AC increase of the CT treatment appear to ease the movement of water and gas, even if limited to the soil surface layer only [16]. However, this improvement is transient because the low aggregate stability, measured especially in CT-IR treatment, makes the soil susceptible to structure degradation and crust formation even after low-intensity rainfall events [10].
The potential nutritional antagonism between growth of grass and young olive plants can be easily overcome by postponing the establishment of the green cover to the end of the training phase. We also found that competition between trees and weeds had no qualitative or quantitative impact on olive production once the orchard had reached full development [10].
In the current study we assessed the effect of conservation tillage by combining classic bioindicators of soil complexity with a functional biodiversity approach. Tillage affected the presence, abundance and composition of microarthropod populations in agreement with studies in olive orchards [67,68], vineyards [69,70] and annual crops [71]. Biodiversity indices (richness and β-diversity) allowed to identify that well-structured communities spread across a gradient from olive and grass cover to bare soil inter-row, contributing to establish a balanced microenvironment. The coexistence of trees and grasses contributes to release great amount and variety of residues to the soil [72] and favors the reproduction of invertebrates, with availability of food and shelter [73]. Such a complexity was not found in CT-IR, characterized by a very simplified community with dominance of a single group (Acari), indicating soil disturbance and poor availability of trophic niches. Moreover, this was emphasized by the interpretation of relationships between organisms and key-groups ratios as Acari/Collembola and Oribatida/other Acari: their changes in abundance are useful to access to soil quality assessment. Particularly, oribatid communities resulted respondent to quantitative changes of environmental factors and grass cover by modeling the ratio with all other mites, as expressed by lower ratio registered in CTs. Similarly, Palla et al. [74] reported significant differences in arbuscular mycorrhizal fungi composition of olive tree root samples collected from permanent grass cover versus tillage treatment, indicating greater microbial biodiversity.
In semi-natural grasslands, extensive root systems and generally limited amounts of leaf litter favor a high diversity and microarthropod biomass, especially fungal-feeding group [75]. Plant roots can be considered as soil ecosystem engineering, providing nutrient-rich resources for mycelium growth [68]: here, in CT-IR, the low organic matter inputs (leaf litter) and no olive tree cover favored opportunistic microsaprophagous (i.e., Acari Astigmata and Endeostigmata).
Soil pore volume, moisture and aeration provide a suitable biotope to edaphic mesofauna while a sudden change in soil microhabitat, due to tillage, can generate different response/effects in mesofauna [74]. Epi-edaphic arthropods can tolerate desiccation better than hemi- and eu-edaphic forms [75] and can survive microhabitat modification by wandering horizontally towards optimal conditions due to their high ability in dispersal and colonization [76]. The eu-edaphic arthropods, such as Protura and Symphyla, inhabit the deeper soil layers, reached by moving through the soil pore system present in the micro-environment of undisturbed soils (NC), by assuming a role of key-group for evaluating the effect of soil management [25]. Predators, as mite predators, pseudoscorpions and Geophylomorpha, were mainly registered near the olive trunk (UC), where they inhabit moist crevices and soil cover, in particular leaf litter [25]. Their functional role can impact on the assemblages of organisms at a lower level of the food web (saprophages, mycophages and fluid feeders) and contribute to suppress some potential pests. According to Vanhée and Devigne [77], both substratus management and vegetation cover strongly impact the collembola assemblages, especially the abundance of epedaphic groups, such as Enthomobryomorpha.
The environmental conditions, after tillage, favored the abundance of insects’ larvae and thrips (Thysanoptera) as new micro-habitat colonizers. On the contrary, Formicidae’ distribution was sensibly reduced, probably due to the disruption of soil nests, implying loss of ecological functions of ant community, i.e., seed dispersion, soil physical and chemical structuring, predation, nutrient cycling [78]. One of the most studied services that soil mites contribute concerns the decomposition of organic matter in soil resulting from roots and other living or dead organic sources [79]. De Groot et al. [80] registered an increase of biodiversity after conversion from arable land to grassland and found that it was mainly ascribable to the immigration of decomposers and predators. Here, the long-term conservative soil management allowed increase in ecological niches, abundance and rich taxonomic composition, as evidenced by β-diversity and by higher presence of ‘Lower Oribatida’ (Paleosomata, Holosomata and Mixonomata). ‘Lower Oribatida’ are phylogenetically derived from ancient lineages of oribatids very sensitive to perturbation [60]. On the contrary, as evidenced in this study in CT-UC, even if with low dispersal ability, Brachypylina, phylogenetically more recent, showed some faster colonization (i.e., Microppia or Oribatula spp.) than others genus [81]. The composition and distribution of the edaphic acarofauna varies according to soil depth, body size, location and season in the year [81].
Overall, the distribution of microarthropods’ functional groups benefited, firstly, from the grass cover, secondly from the canopy effect, and thirdly from a soil structure that ensures soil macroaggregates and water storage. The CCA highlighted the buffer effect exerted by tree to bare soil and well-living conservation with moisture, AC and epi-edaphic arthropods were close to the canopy factor (UC). Acariformes dominance, especially oribatid mites [82], is generally associated with the amount of organic matter, microporosity and retention of sufficient water: all these factors contribute to maintain the mites’ pabulum and protection by predators [34]. In addition, the water content facilitates the distribution of euedaphic groups, the most sensitive to stress/dryness in soil. A greater number of Parasitiformes was registered in well-structured clay loam soil where these mites can easily move through medium–high pore dimensions. Epedaphic arthropods have no metabolic activity strictly dependent on soil parameters even if their survival strategies are related to vegetation cover. Hemiedaphic forms, including more heterogeneous functional groups-i.e., macrosaprophages, polyphages, predators, seem to select a microenvironment characterized by ecotone peculiarity between the surface and edaphic level.

5. Conclusions

Maintaining the orchard floor covered with grass has beneficial effects that cannot be obtained by periodic tillage, such as the increase in the total and humified organic C content, improvement of the soil structure and its water storage capacity and a more favorable pore distribution pattern in terms of the water and gas flows. All these factors, in turn, favor soil microarthropod communities, increasing their biomass and biodiversity. The patchiness of distribution of the edaphic arthropods is related to the soil texture, plant growth and abundance of food sources. The effects of soil management appeared to result from a complex interaction between space- and time-variable factors: the spatial gradient of tree and grass vegetation across the orchard, through root activity and residues, the pool and turnover of soil organic matter and nutrients, the interference of physical–mechanical stresses associated with soil management and seasonal variability of the weather.
The inter-row space appeared the most vulnerable orchard area. As also observed in vineyards, the absence of a grass cover in the inter-row can drastically lower the orchard sustainability by increasing the soil erosion and concomitantly decreasing the C input in the soil [6]. The absence of vegetation in the bare soils impacted the lower levels of the soil food web, depleting the bacterial and fungal-mediated decomposition channels, as noted by Sánchez-Moreno et al. [83] for nematode biodiversity. Integrating the evaluations of a functional biodiversity and soil properties can represent a useful tool to assess the sustainability of the crop management adopted to maintain the essential functions and ecosystem services of soil.
After this long-term monitoring, the negative reflections on the tree yield performance by the grass covering can be easily overcome by postponing the cover crop establishment for the free development of the young orchard and, in the following years, safeguarding the integrity of the natural resources and, in particular, the soil ecosystem services. An increased awareness of how tillage affects the soil community may aid in the development of sustainable agricultural practices to benefit olive producers.

Author Contributions

Conceptualization, R.G., N.V. and S.S.; methodology, E.G., S.S. and G.C.; software, G.C., G.P. and S.S.; validation, E.G., S.P., N.V. and G.P.; formal analysis, E.G. and S.S.; investigation, D.G., G.C., S.P. and N.V.; data curation, S.S. and G.P.; writing—original draft preparation, E.G., G.C. and G.V.; writing—review and editing, S.S., S.P., R.G. and N.V. and supervision, R.G. and S.S. All authors have read and agreed to the published version of the manuscript.

Funding

This research received no external funding.

Institutional Review Board Statement

Not applicable.

Informed Consent Statement

Not applicable.

Data Availability Statement

The data presented in this study are available on request from the corresponding author.

Conflicts of Interest

The authors declare no conflict of interest.

Appendix A

Table A1. Summary table of the distribution and abundance (N) of the soil arthropods for each soil sample (6 replicates: I–VI) at different management and olive positions.
CT-IRCT-UCNC-IRNC-UC
Class Animal GroupIIIIIIIVVVITotIIIIIIIVVVITotIIIIIIIVVVITotIIIIIIIVVVITot
AracnidaAcari11547188127219667627131959595650849029398736142342013233517581603044963663061981830
Araneida 1 12155 3 811211 6
Pseudoscorpionida 11 2 2 2
EntognathaCollembola1871577011654422122109223921815492593325403278 2711370593589207218152144
Protura 111 14 149 62084334123
Diplura 2918163613327 3462727465811160
CrustaceaIsopoda 21 3722 213
MyriapodaSymphyla 1 1 4 3121034181 4572610710237
Geophylomorpha 1 12 1122312212
Lithobiomorpha 1 1 2 1 1
Pauropoda11424 12 6211212849924 1010011952463 112
Polyxenida 2 2 5 3 8
Julida 1312106322 2 456 411228
InsectaThysanoptera 1 12 4 1 1 1 1 2 2
Diptera larvae7 1111102766 116436116814371118 804111434 366
Embioptera 1 1
Heteroptera 1 12 272 29 11 5 7
Hymenoptera 2 2 1 89 1 1
Formicidae51 2 81 22 16 3923712126 71841983113145
Lepidoptera larvae 1 1 1 1 1 1
Coleoptera 4 1117 123 6
Coleoptera larvae1 113 6 1 1 1321 1 152112 6
Psocoptera 121 4
Figure A1. Euclidean-based nonmetric multidimensional scaling (NMDS) plot on the ecomorphotypes composition of the soil plots (stress value by Shepard plot: 0.16). Ellipsoids represent a 95% confidence interval for each treatment (NC-UC: green; NC-IR: blue; CT-UC: red; CT-IR: black).
Agronomy 11 01036 g0a1

References

  1. FAO. The State of Food and Agriculture Trends and Challenges. 2017. Available online: http://www.fao.org/3/a-i6583e.pdf (accessed on 3 March 2021).
  2. Morugán-Coronado, A.; Linares, C.; Gómez-López, M.D.; Faz, Á.; Zornoza, R. The impact of intercropping, tillage and fertilizer type on soil and crop yield in fruit orchards under Mediterranean conditions: A meta-analysis of field studies. Agric. Syst. 2019, 178, 102736. [Google Scholar] [CrossRef]
  3. Ramos, M.E.; Benítez, E.; García, P.A.; Robles, A.B. Cover crops under different managements vs. frequent tillage in almond orchards in semiarid conditions: Effects on soil quality. Agric. Ecosyst. Environ. Appl. Soil Ecol. 2010, 44, 6–14. [Google Scholar] [CrossRef]
  4. Garcia, C.; Roldan, A.; Hernandez, T. Ability of different plant species to promote microbiological processes in semiarid soil. Geoderma 2005, 124, 193–202. [Google Scholar] [CrossRef]
  5. Terribile, F.; Basile, A.; Bonfante, A.; Carbone, A.; Colombo, C.; Langella, G.; Iamarino, M.; Manna, P.; Minieri, L.; Vingiani, S. Future Soil Issues. In The Soils of Italy; Costantini, E., Dazzi, C., Eds.; Springer: Dordrecht, The Netherlands, 2013; pp. 303–348. [Google Scholar] [CrossRef]
  6. Bordoni, M.; Vercesi, A.; Maerker, M.; Ganimede, C.; Reguzzi, M.C.; Capelli, E.; Wei, X.; Mazzoni, E.; Simoni, S.; Gagnarli, E.; et al. Effects of vineyard soil management on the characteristics of soils and roots in the lower Oltrepò Apennines (Lombardy, Italy). Sci. Total Environ. 2019, 693, 133390. [Google Scholar] [CrossRef] [PubMed]
  7. Corti, G.; Cocco, S.; Brecciaroli, G.; Agnelli, A.; Seddaiu, G. Italian Soil Management from Antiquity to Nowadays. In The Soils of Italy; Costantini, E., Dazzi, C., Eds.; Springer: Dordrecht, The Netherlands, 2013; pp. 247–294. [Google Scholar] [CrossRef]
  8. Gómez, J.A.; Romero, P.; Giraldez, J.V.; Fereres, E. Experimental assessment of runoff and soil erosion in an olive grove on a Vertic soil in southern Spain as affected by soil management. Soil. Use Manag. 2004, 20, 426–431. [Google Scholar] [CrossRef]
  9. Gucci, R.; Caruso, G.; Bertolla, C.; Urbani, S.; Taticchi, A.; Esposto, S.; Servili, M.; Sifola, M.I.; Pellegrini, S.; Pagliai, M.; et al. Changes of soil properties and tree performance induced by soil management in a high-density olive orchard. Eur. J. Agron. 2012, 41, 18–27. [Google Scholar] [CrossRef]
  10. Gómez, J.A.; Giraldez, J.V.; Pastor, M.; Fereres, E. Effects of tillage method on soil physical properties, infiltration and yield in an olive orchard. Soil Till. Res. 1999, 52, 167–175. [Google Scholar] [CrossRef]
  11. Hernández, A.J.; Lacasta, C.; Pastor, J. Effects of different management practices on soil conservation and soil water in a rainfed olive orchard. Agric. Water Manag. 2005, 77, 232–248. [Google Scholar] [CrossRef]
  12. Atucha, A.; Merwin, I.A.; Brown, M.G. Long-term effects of four groundcover management systems in an apple orchard. Hort. Sci. 2011, 46, 1176–1183. [Google Scholar] [CrossRef] [Green Version]
  13. Dichio, B.; Romano, M.; Nuzzo, V.; Xiloyannis, C. Soil water availability and relationship between canopy and roots in young olive trees (cv coratina). Acta Hortic. 2002, 586, 251–254. [Google Scholar] [CrossRef]
  14. Tognetti, R.; Morales-Sillero, A.; D’Andria, R.; Fernández, J.E.; Lavini, A.; Sebastiani, L.; Troncoso, A. Deficit irrigation and fertigation practices in olive growing: Convergences and divergences in two case studies. Plant Biosyst. 2008, 142, 138–148. [Google Scholar] [CrossRef]
  15. Gould, I.J.; Quinton, J.N.; Weigelt, A.; De Deyn, G.B.; Bardgett, R.D. Plant diversity and root traits benefit physical properties key to soil function in grasslands. Ecol. Lett. 2016, 19, 1140–1149. [Google Scholar] [CrossRef]
  16. Vignozzi, N.; Agnelli, A.E.; Brandi, G.; Gagnarli, E.; Lagomarsino, A.; Pellegrini, S.; Simoncini, S.; Simoni, S.; Valboa, G.; Gucci, R. Soil ecosystem functions in a high-density olive orchard managed by different soil conservation practices. Appl. Soil Ecol. 2019, 134, 64–76. [Google Scholar] [CrossRef]
  17. Van der Putten, W.H.; Mudgal, S.; Turbé, A.; de Toni, A.; Lavelle, P.; Benito, P.; Ruiz, N. Soil Biodiversity: Functions, Threats and Tools for Policy Makers; Bio Intelligence Service, IRD, and NIOO Report for European Commission; 2010; p. 249. Available online: http://ec.europa.eu/environment/archives/soil/pdf/biodiversity_report.pdf (accessed on 3 March 2021).
  18. Bünemann, E.K.; Bongiorno, G.; Bai, Z.; Creamer, R.E.; De Deyn, G.; de Goede, R.; Fleskens, L.; Geissen, V.; Kuyper, T.W.; Mäder, P.; et al. Soil quality—A critical review. Soil Biol. Biochem. 2018, 120, 105–125. [Google Scholar] [CrossRef]
  19. Tsiafouli, M.A.; Thébault, E.; Sgardelis, S.P.; de Ruiter, P.C.; van der Putten, W.H.; Birkhofer, K.; Hemerik, L.; de Vries, F.T.; Bardgett, R.D.; Brady, M.V.; et al. Intensive agriculture reduces soil biodiversity across Europe. Glob. Change Biol. 2015, 21, 973–985. [Google Scholar] [CrossRef]
  20. Neher, D.A.; Barbercheck, M.E. Soil Microarthropods and Soil Health: Intersection of Decomposition and Pest Suppression in Agroecosystems. Insects 2019, 10, 414. [Google Scholar] [CrossRef] [Green Version]
  21. Nielsen, U.-N. Approaches to Studying Soil Fauna and Its Functional Roles. In Soil Fauna Assemblages: Global to Local Scales (Ecology, Biodiversity and Conservation); Cambridge University Press: Cambridge, UK, 2019; pp. 86–120. [Google Scholar] [CrossRef]
  22. Bispo, A.; Cluzeau, D.; Creamer, R.; Dombos, M.; Graefe, U.; Krogh, P.; Sousa, J.; Peres, G.; Rutgers, M.; Winding, A.; et al. Indicators for monitoring soil biodiversity. Integr. Environ. Assess. Manag. 2009, 5, 717–719. [Google Scholar] [CrossRef] [Green Version]
  23. Culliney, T.W. Role of arthropods in maintaining soil fertility. Agriculture 2013, 3, 629–659. [Google Scholar] [CrossRef] [Green Version]
  24. Menta, C.; Conti, F.D.; Fondón, C.L.; Staffilani, F.; Remelli, S. Soil arthropod responses in agroecosystem: Implications of different management and cropping systems. Agronomy 2020, 10, 982. [Google Scholar] [CrossRef]
  25. Lamarre, G.P.A.; Hérault, B.; Fine, P.V.A.; Vedel, V.; Lupoli, R.; Mesones, I.; Baraloto, C. Taxonomic and functional composition of arthropod assemblages across contrasting Amazonian forests. J. Anim. Ecol. 2016, 85, 227–239. [Google Scholar] [CrossRef] [PubMed]
  26. Sofo, A.; Mininni, A.N.; Ricciuti, P. Soil Macrofauna: A key Factor for Increasing Soil Fertility and Promoting Sustainable Soil Use in Fruit Orchard Agrosystems. Agronomy 2020, 10, 456. [Google Scholar] [CrossRef] [Green Version]
  27. Menta, C.; Remelli, S. Soil Health and Arthropods: From Complex System to Worthwhile Investigation. Insects 2020, 11, 54. [Google Scholar] [CrossRef] [Green Version]
  28. Lavelle, P.; Decaëns, T.; Aubert, M.; Barot, S.; Blouin, M.; Bureau, F.; Margerie, P.; Mora, P.; Rossi, J.-P. Soil invertebrates and ecosystem services. Eur. J. Soil Biol. 2006, 42 (Suppl. 1), S3–S15. [Google Scholar] [CrossRef]
  29. Garcia-Torres, L.; Martinez-Vilela, A.; Serrano De Norena, F. Conservation agriculture in Europe: Current status and perspectives. In Conservation Agriculture; García-Torres, L., Benites, J., Martínez-Vilela, A., Holgado-Cabrera, A., Eds.; Springer: Dordrecht, The Netherlands, 2003; pp. 87–91. [Google Scholar] [CrossRef]
  30. Beaufoy, G. The Environmental Impact of Olive Oil Production in the European Union: Practical Options for Improving the Environmental Impact. Eur. Com. 2000, 1–73. [Google Scholar]
  31. Menta, C. Soil Fauna Diversity-Function, Soil Degradation, Biological Indices, Soil Restoration. In Biodiversity Conservation and Utilization in a Diverse World; Gbolagade, A.L., Ed.; IntechOpen: London, UK, 2012. [Google Scholar] [CrossRef] [Green Version]
  32. Seastedt, T.R. The role of microarthropods in decomposition and mineralization processes. Annu. Rev. Entomol. 1984, 29, 25–46. [Google Scholar] [CrossRef]
  33. Brussaard, L. Soil fauna, guilds, functional groups and ecosystem processes. Appl. Soil Ecol. 1998, 9, 123–135. [Google Scholar] [CrossRef]
  34. Coleman, D.C.; Crossley, J.A.; Hendrix, P.F. Fundamentals of Soil Ecology, 2nd ed.; Elsevier Academic Press: Burlington, MA, USA, 2004; p. 408. [Google Scholar]
  35. Bedano, J.C.; Domínguez, A.; Arolfo, R. Assessment of soil biological degradation using mesofauna. Soil Tillage Res. 2011, 117, 55–60. [Google Scholar] [CrossRef]
  36. Caruso, T.; Pigino, G.; Bernini, F.; Bargagli, R.; Migliorini, M. The Berger-Parker index as an effective tool for monitoring the biodiversity of disturbed soils: A case study on Mediterranean oribatid (Acari: Oribatida) assemblages. Biodivers. Conserv. 2007, 16, 3277–3285. [Google Scholar] [CrossRef]
  37. Behan-Pelletier, V.M. Acari and collembola biodiversity in Canadian agricultural soils. Can. J. Soil Sci. 2003, 83, 279–288. [Google Scholar] [CrossRef]
  38. Maaß, S.; Caruso, T.; Rillig, M.C. Functional role of microarthropods in soil aggregation. Pedobiologia 2015, 58, 59–63. [Google Scholar] [CrossRef] [Green Version]
  39. Castaño-Meneses, G.; Palacios-Vargas, J.G.; Cutz-Pool, L.Q. Feeding habits of Collembola and their ecological niche. An. Inst. Biol. Univ. Nac. Autónoma México Ser. Zool. 2004, 75, 135–142. [Google Scholar]
  40. Moore, J.C.; Berlow, E.L.; Coleman, D.C.; de Ruiter, P.C.; Dong, Q.; Hastings, A.; Collins Johnson, N.; McCann, K.S.; Melville, K.; Morin, P.J.; et al. Detritus, trophic dynamics and biodiversity. Ecol. Lett. 2004, 7, 584–600. [Google Scholar] [CrossRef]
  41. Brose, U.; Hillebrand, H. Biodiversity and ecosystem functioning in soil. Phil. Trans. R. Soc. B 2016, 371, 267. [Google Scholar] [CrossRef] [Green Version]
  42. Geisen, S.; Briones, M.J.I.; Gan, H.; Behan-Pelletier, V.M.; Friman, V.-P.; de Groot, G.A.; Hannula, S.E.; Lindo, Z.; Philippot, L.; Tiunov, A.V.; et al. A methodological framework to embrace soil biodiversity. Soil Biol. Bioch. 2019, 136, 107536. [Google Scholar] [CrossRef]
  43. Caruso, G.; Rapoport, H.F.; Gucci, R. Long-term evaluation of yield components of young olive trees during the onset of fruit production under different irrigation regimes. Irrig. Sci. 2013, 31, 37–47. [Google Scholar] [CrossRef] [Green Version]
  44. Soil Survey Staff. Soil Survey Laboratory Information Manual; Soil Survey Investigations Report No. 45, Version 2.0; Burt, R., Ed.; U.S. Department of Agriculture, Natural Resources Conservation Service: Lincoln, NE, USA, 2011; p. 506. [Google Scholar]
  45. Cirilli, M.; Caruso, G.; Gennai, C.; Esposto, S.; Urbani, S.; Servili, M. The Role of Polyphenoloxidase, Peroxidase, and β-Glucosidase in Phenolics Accumulation in Olea europaea L. Fruits under Different Water Regimes. Front. Plant Sci. 2017, 8, 717. [Google Scholar] [CrossRef] [PubMed] [Green Version]
  46. Gucci, R.; Caruso, G.; Gennai, C.; Esposto, S.; Urbani, S.; Servili, M. Fruit growth, yield and oil quality changes induced by deficit irrigation at different stages of olive fruit development. Agric. Water Manag. 2018, 212, 88–98. [Google Scholar] [CrossRef]
  47. Blake, G.R.; Hartge, K.H. Bulk density. In Methods of Soil Analysis, Part 1, Physical and Mineralogical Methods, 2nd ed.; Agronomy Monographs 9; Klute, A., Ed.; ASA and SSSA: Madison, WI, USA, 1986; pp. 363–375. [Google Scholar]
  48. Kemper, W.D.; Rosenau, R.C. Aggregate stability and size distribution. In Methods of Soil Analysis, Part 1, Physical and Mineralogical Methods, 2nd ed.; Agronomy Monographs 9; Klute, A., Ed.; ASA and SSSA: Madison, WI, USA, 1986; pp. 425–442. [Google Scholar]
  49. Pagliai, M. Soil porosity aspects. Int. Agrophys. 1988, 4, 215–232. [Google Scholar]
  50. Bouma, J.; Jongerius, A.; Boersma, O.H.; Jager, A.; Schoonderbeek, D. Function of different types of macropores during saturated flow through four swelling soil horizons. Sci. Soc. Am. J. 1977, 41, 945–950. [Google Scholar] [CrossRef]
  51. Greenland, D.J. Soil damage by intensive arable cultivation: Temporary or permanent? Philos. Tran. R. Soc. Lon. 1977, 281, 193–208. [Google Scholar] [CrossRef]
  52. Clement, C.R. A simple and reliable tension table. J. Soil Sci. 1966, 17, 133–135. [Google Scholar] [CrossRef]
  53. Klute, A.; Dirksen, C. Hydraulic conductivity and diffusivity: Laboratory methods. In Methods of Soil Analysis, Part 1, Physical and Mineralogical Methods, 2nd ed.; Agronomy Monographs 9; Klute, A., Ed.; ASA and SSSA: Madison, WI, USA, 1986; pp. 687–734. [Google Scholar]
  54. Gardner, G.H.F.; Gardner, L.W.; Gregory, A.R. Formation velocity and density—the diagnostic basics for stratigraphic traps. Geophysics 1974, 39, 770–780. [Google Scholar] [CrossRef] [Green Version]
  55. Yeomans, J.C.; Bremner, M. A rapid and precise method for routine determination of organic carbon in soil. Commun. Soil Sci. Plant Anal. 1988, 19, 1467–1476. [Google Scholar] [CrossRef]
  56. Sequi, P.; De Nobili, M. Frazionamento del carbonio organico. In Metodi di Analisi Chimica del Suolo; Violante, P., Ed.; Franco Angeli: Rome, Italy, 2000; pp. 1–13. [Google Scholar]
  57. Parisi, V.; Menta, C.; Gardi, C.; Jacomini, C.; Mozzanica, E. Microarthropod communities as a tool to assess soil quality and biodiversity: A new approach in Italy. Agric. Ecosyst. Environ. 2005, 105, 323–333. [Google Scholar] [CrossRef]
  58. Bachelier, G. La Vie Animale Dans le Sol; O.R.S.T.O.M.: Paris, France, 1978; p. 285. [Google Scholar]
  59. Aoki, J. Difference in sensitivities of oribatid families to environmental change by human impacts. Rev. d’Ecologie Biol. Sol. 1979, 16, 415–422. [Google Scholar]
  60. Subías, L.S. Listado sistemático, sinonímico y biogeográfico de los ácaros oribátidos (Acariformes: Oribatida) del mundo (1748–2002). Graellsia 2004, 60, 3–305. [Google Scholar] [CrossRef] [Green Version]
  61. Krantz, G.W.; Walter, D.E. A Manual of Acarology, 3rd ed.; Texas Tech University Press: Lubbock, TX, USA, 2009; p. 816. [Google Scholar]
  62. Dindal, D.L. Soil Biology Guide; Wiley Interscience: New York, NY, USA, 1990; p. 1376. [Google Scholar]
  63. Maraun, M.; Heethoff, M.; Schneider, K.; Scheu, S.; Weigmann, G.; Cianciolo, J.; Thomas, R.H.; Norton, R.A. Molecular phylogeny of oribatid mites (Oribatida, Acari): Evidence for multiple radiations of parthenogenetic lineages. Exp. Appl. Acarol. 2004, 33, 183–201. [Google Scholar] [CrossRef] [PubMed]
  64. Yamamura, K. Transformation using (x + 0.5) to stabilize the variance of populations. Res. Popul. Ecol. 1999, 41, 229–234. [Google Scholar] [CrossRef]
  65. Hammer, Ø.; Harper, D.A.T.; Ryan, P.D. PAST: Paleontological Statistics Software Package for Education and Data Analysis. Palaeontol. Electron. 2001, 4, 1–9. [Google Scholar]
  66. Legendre, P.; Legendre, L. Numerical Ecology, 2nd ed.; Elsevier: Amsterdam, The Netherlands, 1998; p. 852. [Google Scholar]
  67. Gonsalves, M.F.; Pereira, J.A. Abundance and diversity of soil arthropods in the olive grove ecosystem. J. Insect Sci. 2012, 12, 20. [Google Scholar] [CrossRef]
  68. Gkisakis, V.D.; Kollaros, D.; Bàrberi, P.; Livieratos, I.C.; Kabourakis, E.M. Soil Arthropod Diversity in Organic, Integrated, and Conventional Olive Orchards and Different Agroecological Zones in Crete, Greece. Agroecol. Sustain. Food Syst. 2015, 39, 276–294. [Google Scholar] [CrossRef]
  69. Buchholz, J.; Querner, P.; Paredes, D.; Bauer, T.; Strauss, P.; Guernion, M.; Scimia, J.; Cluzeau, D.; Burel, F.; Kratschmer, S.; et al. Soil biota in vineyards are more influenced by plants and soil quality than by tillage intensity or the surrounding landscape. Sci. Rep. 2017, 7, 1–12. [Google Scholar] [CrossRef] [PubMed] [Green Version]
  70. Fiera, C.; Ulrich, W.; Popescu, D.; Bunea, C.-I.; Manu, M.; Nae, I.; Stan, M.; Markó, B.; Urák, I.; Giurginca, A.; et al. Effects of vineyard inter-row management on the diversity and abundance of plants and surface-dwelling invertebrates in Central Romania. J. Insect Conserv. 2020, 24, 175–185. [Google Scholar] [CrossRef] [PubMed] [Green Version]
  71. Dubie, T.R. Effects of Tillage as a Disturbance on Soil Microarthropods and Entomopathogenic Nematodes in Oklahoma. Master’s Thesis, Oklahoma State University, Stillwater, OK, USA, 2010. [Google Scholar]
  72. Hoffmann, W.A.; Jackson, R.B. Vegetation–climate feedbacks in the conversion of tropical savanna to grassland. J. Clim. 2000, 13, 1593–1602. [Google Scholar] [CrossRef]
  73. Da Silva, R.F.; de Aquino, A.M.; Mercante, M.F.; Guimarães, M.d.F. Macrofauna invertebrada do solo sob diferentes sistemas de produção em Latossolo da Região do Cerrado. Pesqui. Agropecuária Bras. 2006, 41, 697–704. [Google Scholar] [CrossRef] [Green Version]
  74. Palla, M.; Turrini, A.; Cristani, C.; Caruso, G.; Avio, L.; Giovannetti, M.; Agnolucci, M. Native mycorrhizal communities of olive tree roots as affected by protective green cover and soil tillage. Appl. Soil Ecol. 2020, 149, 103520. [Google Scholar] [CrossRef]
  75. Tugel, A.J.; Lewandowski, A.M.; Happe-vonArb, D. Soil Biology Primer; Soil and Water Conservation Society: Ankeny, IA, USA, 2000. [Google Scholar]
  76. Lavelle, P.; Spain, A.; Blouin, M.; Brown, G.; Decaëns, T.; Grimaldi, M.; Jiménez, J.J.; McKey, D.; Mathieu, J.; Velasquez, E.; et al. Ecosystem engineers in a self-organized soil: A review of concepts and future research questions. Soil Sci. 2016, 181, 91–109. [Google Scholar] [CrossRef] [Green Version]
  77. Vanhée, B.; Devigne, C. Differences in collembola species assemblages (Arthropoda) between spoil tips and surrounding environments are dependent on vegetation development. Sci. Rep. 2018, 8, 1–17. [Google Scholar] [CrossRef] [Green Version]
  78. Eisenbeis, G.; Wichard, W. Atlas of the Biology of Soil Arthropods; Springer: Berlin/Heidelberg, Germany, 1987; p. 473. [Google Scholar] [CrossRef]
  79. Bolico, C.F.; Oliveira, E.A.; Gantes, M.L.; Dumont, L.F.C.; Carrasco, D.S.; D’Incao, F. Mirmecofauna (Hymenoptera, Formicidae) de Duas Marismas do Estuário da Lagoa dos Patos, RS: Diversidade, Flutuação de Abundância e Similaridade como Indicadores de Conservação. EntomoBrasilis 2012, 5, 11–20. [Google Scholar] [CrossRef] [Green Version]
  80. De Groot, G.A.; Jagers op Akkerhuis, G.A.J.M.; Dimmers, W.J.; Charrier, X.; Faber, J.H. Biomass and diversity of soil mite functional groups respond to extensification of land management, potentially affecting soil ecosystem services. Front. Environ. Sci. 2016, 4, 15. [Google Scholar] [CrossRef] [Green Version]
  81. Helgason, T.; Daniell, T.J.; Husband, R.; Fitter, A.H.; Young, J.P. Ploughing up the wood-wide-web? Nature 1998, 394, 431. [Google Scholar] [CrossRef] [PubMed]
  82. Migliorini, M.; Pigino, G.; Caruso, T.; Fanciulli, P.P.; Leonzio, C.; Bernini, F. Soil communities (Acari Oribatida; Hexapoda Collembola) in a clay pigeon shooting range. Pedobiologia 2005, 49, 1–13. [Google Scholar] [CrossRef]
  83. Sánchez-Moreno, S.; Castro, J.; Alonso-Prados, E.; Alonso-Prados, J.-L.; García-Baudín, J.-M.; Talavera, M.; Durán-Zuazo, V.-H. Tillage and herbicide decrease soil biodiversity in olive orchards. Agron. Sustain. Dev. 2015, 35, 691–700. [Google Scholar] [CrossRef]
Figure 1. Experimental plots managed by natural grass cover (NC) or conservation tillage (CT). Soil cores were sampled under the canopy (UC) and in the inter-rows (IR).
Agronomy 11 01036 g001
Figure 2. Root distribution of olive trees subjected to two different soil management systems (Natural grass cover, NC; Conservative tillage, CT). Different codes identify the characteristic positions with respect to the tree and tree row. A1 and A6, inter-row and inter-tree positions in the south and north trenches, respectively; A2 and A5, inter-row and frontal tree positions in the south and north trenches, respectively; A3 and A4, close to the tree row (1 m) and inter-tree positions in the south and north trenches, respectively. The range of root density in each square represents the average of three replicate trenches for each treatment.
Agronomy 11 01036 g002
Figure 3. Soil porosity compared in four experimental plots managed by natural grass cover (NC) or conservation tillage (CT) under the canopy (UC) or between the rows (IR). Histograms are means of 6 replicates. Letters on top of bars denote significant differences within the positions and treatments (Duncan’s test; p < 0.05).
Agronomy 11 01036 g003
Figure 4. Relative frequency histogram showing the proportion of each soil arthropod group occupying the 24 sampling sites managed by natural grass cover (NC) or conservation tillage (CT) under the canopy (UC) or between the rows (IR).
Agronomy 11 01036 g004
Figure 5. Assemblage differences of edaphic arthropods communities in 0–10 cm of the soil layers in both environment conditions: management (conservative tillage or natural cover) and position (under olive canopy or inter-row). The extrapolated rarefaction method provides a 95% confidence interval of the expected taxa richness based on the bootstrap method. The coordinates represent the sampled number of individuals and overall population size for each taxa group, respectively.
Agronomy 11 01036 g005
Figure 6. Biplot correlation of the oribatid assemblages in four soil management/position components (green loading values). The ellipse describes the variance at 95% and points to oribatid species with different colors based on their main feeding guilds: black: macrosaprophagous, light blue: polyphagous, pink: mycophagous and green: microsaprohagous.
Agronomy 11 01036 g006
Figure 7. Differences of the five ecomorphotypes abundances in each soil management and position. Mean of the six replicates; different letters indicate significant differences (Duncan’s test; p < 0.05) within the positions and treatments.
Agronomy 11 01036 g007
Figure 8. Canonical Correspondence Analysis (CCA) ordination biplot of the total dataset showing the environmental factors (arrows) and microarthropod group distributions (dots). Positioning of the microarthropod group along each arrow indicates the approximate ranking of the weighted average of the group with respect to that factor.
Agronomy 11 01036 g008
Figure 9. Feeding functional biodiversity of the soil arthropods (%) in each management: macrosaprophagous in green (Ms: Acari, Isopoda, Coleoptera adult and larvae, Diplopoda and Collembola); herbivorous/fluid feeders in orange (H: Acari, Diptera larvae, Hemiptera, Lepidoptera larvae and Thysanoptera); microsaprophagous in violet (mcs: Acari, Diplura, Diptera larvae, Pauropoda and Collembola); mycophagous in purple (myc: Acari, Coleoptera, Collembola and Protura); polyphagous in light green (pol: Acari, Formicidae, Psocoptera and Symphyla) and predators/parasitoids in dark yellow (P: Araneida, Coleoptera, Chilopoda, Coleoptera larvae, Diplura, Hymenoptera, Acari, Pseudoscorpionida and Diptera larvae).
Agronomy 11 01036 g009
Table 1. Cumulative fruit yield, cumulative pruning weight, TCSA increment and the fruit yield-to-pruning weight ratio of olive trees (cv. Frantoio) subjected to different soil management systems (NC: Natural Cover; CT: Conservative Tillage). Values are the means ± standard errors of nine trees per treatment within each time period. Least significant differences (LSD) were calculated by ANOVA (p ≤ 0.05).
Years after PlantingSoil ManagementCumulative Fruit Yield (kg Tree−1)Cumulative Pruning Weight (kg Tree−1)ΔTCSA
(dm−2)
Fruit Yield/Pruning Weight
0–3
(training)
NC2.2 ± 2.97 b-0.15 ± 0.03 b-
CT6.8 ± 5.44 a-0.25 ± 0.08 a-
4–7
(onset of production)
NC33.1 ± 9.20 b16.2 ± 5.51 b1.02 ± 0.15 b2.23 ± 1.05
CT57.3 ± 16.27 a23.4 ± 10.35 a1.22 ± 0.23 a2.61 ± 0.49
8–14
(full production)
NC100.2 ± 6.1857.9 ±4.10 b1.59 ± 0.151.78 ± 0.13
CT117.5 ± 7.0077.4 ± 6.49 a1.51 ± 0.131.64 ± 0.21
0–14
(whole period)
NC139.5 ± 7.17 b73.7 ± 3.96 b2.93 ± 0.17 1.91 ± 0.08
CT188.7 ± 7.73 a104.2 ± 7.09 a3.26 ± 0.18 1.90 ± 0.19
Mean values followed by standard errors in parentheses. Different letters indicate significant differences (Duncan’s test; p < 0.05) within the positions and treatments.
Table 2. Soil physical and chemical properties * under different management systems (NC and CT) and positions (UC and IR).
ManagementPositionBD
g cm−3
MWDdry
mm
MWDwet
mm
AC
m3 m−3
AWC
m3 m−3
TOC
%
HC
%
DH
%
NCUC1.39
(±0.08)
11.0 a
(±0.27)
6.7 a
(±0.11)
0.16 b
(±0.03)
0.18 a
(±1*10−2)
2.0 a
(±0.12)
0.51 a
(±0.06)
49.9
(±6.33)
IR1.44
(±0.10)
12.1 a
(±0.18)
6.6 a
(±0.08)
0.13 b
(±0.05)
0.17 ab
(±2*10−3)
1.9 a
(±0.13)
0.41 ab
(±0.10)
37.3
(±6.84)
CTUC1.23
(±0.04)
6.4 b
(±0.61)
5.3 b
(±0.37)
0.27 a
(±0.01)
0.16 bc
(±3*10−3)
1.7 a
(±0.08)
0.36 b
(±0.07)
37.1
(±6.00)
IR1.36
(±0.02)
6.9 b
(±1.03)
1.7 c
(±0.13)
0.29 a
(±0.01)
0.14 c
(±5*10−4)
1.4 b
(±0.04)
0.20 b
(±0.04)
32.8
(±5.60)
* Mean values followed by standard errors in parentheses. Different letters indicate significant differences (Duncan’s test; p < 0.05) within the positions and treatments.
Publisher’s Note: MDPI stays neutral with regard to jurisdictional claims in published maps and institutional affiliations.

