
Valorization of Cereal By-Products from the Milling Industry as a Source of Nutrients and Bioactive Compounds to Boost Resource-Use Efficiency

 , ,
, ,  ,
,  ,
,  , ,
, ,  ,
,  and
and
Abstract
:
1. Introduction
2. Materials and Methods
2.1. Samples and Samples Preparation
2.2. Standards and Reagents
2.3. Determination of Nutrients and Energy Value
2.4. Evaluation of Chemical Constituents
2.4.1. Organic Acids
2.4.2. Free Sugars
2.4.3. Fatty Acids
2.4.4. Tocopherols
2.5. Evaluation of Phenolic Compounds and Bioactivities
2.5.1. Extracts Preparation
2.5.2. Phenolic Compounds
2.5.3. Antioxidant Activity
2.5.4. Antibacterial Activity
2.6. Statistical Analysis
3. Results and Discussion
3.1. Compositional Features of the Cereal By-Products
3.2. Phenolic Composition of the Cereal By-Products
3.3. Bioactivity of the Cereal By-Products
4. Conclusions
Supplementary Materials
Author Contributions
Funding
Institutional Review Board Statement
Informed Consent Statement
Conflicts of Interest
References
- Monnet, A.F.; Laleg, K.; Michon, C.; Micard, V. Legume enriched cereal products: A generic approach derived from material science to predict their structuring by the process and their final properties. Trends Food Sci. Technol. 2019, 86, 131–143. [Google Scholar] [CrossRef]
- Kim, H.; Caulfield, L.E.; Garcia-Larsen, V.; Steffen, L.M.; Coresh, J.; Rebholz, C.M. Plant-based diets are associated with a lower risk of incident cardiovascular disease, cardiovascular disease mortality, and all-cause mortality in a general population of middle-aged adults. J. Am. Heart Assoc. 2019, 8, 1–13. [Google Scholar] [CrossRef] [PubMed]
- Lynch, H.; Johnston, C.; Wharton, C. Plant-based diets: Considerations for environmental impact, protein quality, and exercise performance. Nutrients 2018, 10, 1841. [Google Scholar] [CrossRef] [Green Version]
- Bigliardi, B.; Galati, F. Innovation trends in the food industry: The case of functional foods. Trends Food Sci. Technol. 2013, 31, 118–129. [Google Scholar] [CrossRef]
- Klopčič, M.; Slokan, P.; Erjavec, K. Consumer preference for nutrition and health claims: A multi-methodological approach. Food Qual. Prefer. 2020, 82, 1–10. [Google Scholar] [CrossRef]
- Saini, A.; Panwar, D.; Panesar, P.; Bera, M. Bioactive compounds from cereal and pulse processing byproducts and their potential health benefits. Austin J. Nutr. Metab. 2019, 6, 1–7. [Google Scholar]
- Tapia-Hernández, J.A.; Del-Toro-Sánchez, C.L.; Cinco-Moroyoqui, F.J.; Juárez-Onofre, J.E.; Ruiz-Cruz, S.; Carvajal-Millan, E.; López-Ahumada, G.A.; Castro-Enriquez, D.D.; Barreras-Urbina, C.G.; Rodríguez-Felix, F. Prolamins from cereal by-products: Classification, extraction, characterization and its applications in micro- and nanofabrication. Trends Food Sci. Technol. 2019, 90, 111–132. [Google Scholar] [CrossRef]
- Tsadik, Y.Y.G.; Emire, S.A. Development of value added products from byproducts of Ethiopian wheat milling industries. J. Food Process. Technol. 2015, 6, 1–8. [Google Scholar]
- Ghafoor, K.; Özcan, M.M.; AL-Juhaımı, F.; Babıker, E.E.; Sarker, Z.I.; Ahmed, I.A.M.; Ahmed, M.A. Nutritional composition, extraction, and utilization of wheat germ oil: A review. Eur. J. Lipid Sci. Technol. 2017, 119, 1–9. [Google Scholar] [CrossRef]
- Tolouie, H.; Mohammadifar, M.A.; Ghomi, H.; Yaghoubi, A.S.; Hashemi, M. The impact of atmospheric cold plasma treatment on inactivation of lipase and lipoxygenase of wheat germs. Innov. Food Sci. Emerg. Technol. 2018, 47, 346–352. [Google Scholar] [CrossRef] [Green Version]
- Yun, L.; Wang, S.; Wu, T.; Li, Q.; Zhang, M. Structural characterization of a novel glycoprotein in wheat germ and its physicochemical properties. Int. J. Biol. Macromol. 2018, 117, 1058–1065. [Google Scholar] [CrossRef] [PubMed]
- Anderson, C.; Simsek, S. Mechanical profiles and topographical properties of films made from alkaline extracted arabinoxylans from wheat bran, maize bran, or dried distillers grain. Food Hydrocoll. 2019, 86, 78–86. [Google Scholar] [CrossRef]
- Holguín-Acuña, A.L.; Carvajal-Millán, E.; Santana-Rodríguez, V.; Rascón-Chu, A.; Márquez-Escalante, J.A.; de León-Renova, N.E.P.; Gastelum-Franco, G. Maize bran/oat flour extruded breakfast cereal: A novel source of complex polysaccharides and an antioxidant. Food Chem. 2008, 111, 654–657. [Google Scholar] [CrossRef]
- Arte, E.; Huang, X.; Nordlund, E.; Katina, K. Biochemical characterization and technofunctional properties of bioprocessed wheat bran protein isolates. Food Chem. 2019, 289, 103–111. [Google Scholar] [CrossRef] [Green Version]
- AOAC International. Official Methods of Analysis of AOAC International, 20th ed.; Latimer, G.W., Ed.; AOAC International: Gaithersburg, MD, USA, 2016. [Google Scholar]
- Mariotti, F.; Tomé, D.; Mirand, P.P. Converting nitrogen into protein—Beyond 6.25 and Jones’ factors. Crit. Rev. Food Sci. Nutr. 2008, 48, 177–184. [Google Scholar] [CrossRef]
- European Union. Regulation (EU) No 1169/2011 of the European Parliament and of the Council of 25 October 2011; European Union: Brussels, Belgium, 2011. [Google Scholar]
- Pereira, C.; Barros, L.; Carvalho, A.M.; Ferreira, I.C.F.R. Use of UFLC-PDA for the Analysis of Organic Acids in Thirty-Five Species of Food and Medicinal Plants. Food Anal. Methods 2013, 6, 1337–1344. [Google Scholar] [CrossRef]
- Spréa, R.M.; Fernandes, Â.; Calhelha, R.C.; Pereira, C.; Pires, T.C.S.P.; Alves, M.J.; Canan, C.; Barros, L.; Amaral, J.S.; Ferreira, I.C.F.R. Chemical and bioactive characterization of the aromatic plant: Levisticum officinale W.D.J. Koch: A comprehensive study. Food Funct. 2020, 11, 1292–1303. [Google Scholar] [CrossRef]
- Bessada, S.M.F.; Barreira, J.C.M.; Barros, L.; Ferreira, I.C.F.R.; Oliveira, M.B.P.P. Phenolic profile and antioxidant activity of Coleostephus myconis (L.) Rchb.f.: An underexploited and highly disseminated species. Ind. Crop. Prod. 2016, 89, 45–51. [Google Scholar] [CrossRef] [Green Version]
- De Sá, I.S.; Peron, A.P.; Leimann, F.V.; Bressan, G.N.; Krum, B.N.; Fachinetto, R.; Pinela, J.; Calhelha, R.C.; Barreiro, M.F.; Ferreira, I.C.F.R.; et al. In vitro and in vivo evaluation of enzymatic and antioxidant activity, cytotoxicity and genotoxicity of curcumin-loaded solid dispersions. Food Chem. Toxicol. 2019, 125, 29–37. [Google Scholar] [CrossRef] [PubMed] [Green Version]
- Alves, M.J.; Ferreira, I.C.F.R.; Lourenço, I.; Costa, E.; Martins, A.; Pintado, M. Wild mushroom extracts as inhibitors of bacterial biofilm formation. Pathogens 2014, 3, 667–679. [Google Scholar] [CrossRef] [Green Version]
- Mahmoud, A.A.; Mohdaly, A.A.A.; Elneairy, N.A.A. Wheat germ: An overview on nutritional value, antioxidant potential and antibacterial characteristics. Food Nutr. Sci. 2015, 6, 265–277. [Google Scholar] [CrossRef] [Green Version]
- Otten, J.J.; Hellwig, J.P.; Meyers, L.D. Dietary Reference Intakes: The Essential Guide to Nutrient Requirements; Otten, J.J., Hellwig, J.P., Meyers, L.D., Eds.; The National Academies Press: Washington, WA, USA, 2006. [Google Scholar]
- Navarro, S.L.B.; Capellini, M.C.; Aracava, K.K.; Rodrigues, C.E.C. Corn germ-bran oils extracted with alcoholic solvents: Extraction yield, oil composition and evaluation of protein solubility of defatted meal. Food Bioprod. Process. 2016, 100, 185–194. [Google Scholar] [CrossRef]
- Cardoso, R.V.C.; Fernandes, Â.; Heleno, S.A.; Rodrigues, P.; Gonzaléz-paramás, A.M.; Barros, L.; Ferreira, I.C.F.R. Physicochemical characterization and microbiology of wheat and rye flours. Food Chem. 2019, 280, 123–129. [Google Scholar] [CrossRef] [PubMed] [Green Version]
- National Food Institute Cereals and Starch Products. Available online: https://frida.fooddata.dk/index.php/food/lists/grouped/26?lang=en&#group26 (accessed on 20 January 2021).
- INRAE CIRAD AFZ Cereal Byproducts—Tables of Composition and Nutritional Values of Feed Materials. Available online: https://feedtables.com/ (accessed on 20 January 2021).
- Rizzello, C.G.; Nionelli, L.; Coda, R.; De Angelis, M.; Gobbetti, M. Effect of sourdough fermentation on stabilisation, and chemical and nutritional characteristics of wheat germ. Food Chem. 2010, 119, 1079–1089. [Google Scholar] [CrossRef]
- Cardoso, R.V.C.; Fernandes, Â.; Barreira, J.C.M.; Verde, S.C.; Antonio, A.L.; Gonzaléz-paramás, A.M.; Barros, L.; Ferreira, I.C.F.R. Effectiveness of gamma and electron beam irradiation as preserving technologies of fresh Agaricus bisporus Portobello: A comparative study. Food Chem. 2019, 278, 760–766. [Google Scholar] [CrossRef] [Green Version]
- Barreira, J.C.M.; Pereira, J.A.; Oliveira, M.B.P.P.; Ferreira, I.C.F.R. Sugars profiles of different chestnut (Castanea sativa Mill.) and almond (Prunus dulcis) cultivars by HPLC-RI. Plant Foods Hum. Nutr. 2010, 65, 38–43. [Google Scholar] [CrossRef]
- Abdelghany, A.M.; Zhang, S.; Azam, M.; Shaibu, A.S.; Feng, Y.; Qi, J.; Li, Y.; Tian, Y.; Hong, H.; Li, B.; et al. Natural variation in fatty acid composition of diverse world soybean germplasms grown in China. Agronomy 2020, 10, 24. [Google Scholar] [CrossRef] [Green Version]
- Becker, R. Fatty acids in food cereal grains and grain products. In Fatty Acids in Foods and their Health Implications; CRC Press: Boca Raton, FL, USA, 2000. [Google Scholar]
- Armanino, C.; De Acutis, R.; Festa, M.R. Wheat lipids to discriminate species, varieties, geographical origins and crop years. Anal. Chim. Acta 2002, 454, 315–326. [Google Scholar] [CrossRef]
- Nikolić, N.; Radulović, N.; Momcilović, B.; Nikolić, G.; Lazić, M.; Todorovic, Z. Fatty acids composition and rheology properties of wheat and wheat and white or brown rice flour mixture. Eur. Food Res. Technol. 2008, 227, 1543–1548. [Google Scholar] [CrossRef]
- Kan, A. Characterization of the Fatty Acid and Mineral Compositions of Selected Cereal Cultivars from Turkey. Rec. Nat. Prod. 2015, 9, 124–134. [Google Scholar]
- Thomas, R.; Bhat, R.; Kuang, Y. Composition of amino acids, fatty acids, minerals and dietary fiber in some of the local and import rice varieties of Malaysia. Int. Food Res. J. 2015, 22, 1148–1155. [Google Scholar]
- Górnaś, P.; Radenkovs, V.; Pugajeva, I.; Soliven, A.; Needs, P.W.; Kroon, P.A. Varied composition of tocochromanols in different types of bran: Rye, wheat, oat, spelt, buckwheat, corn, and rice. Int. J. Food Prop. 2015, 19, 1757–1764. [Google Scholar] [CrossRef] [Green Version]
- Ansolin, M.; Deboni, T.M.; Richter, W.; Ming, C.C.; Gonçalves, L.A.G. Extraction of Wheat Germ Oil with Alcohol Solvents; UNOPAR: Paraná, Brazil, 2015. [Google Scholar]
- Van Hung, P. Phenolic compounds of cereals and their antioxidant capacity. Crit. Rev. Food Sci. Nutr. 2016, 56, 25–35. [Google Scholar] [CrossRef]
- Călinoiu, L.F.; Vodnar, D.C. Whole grains and phenolic acids: A review on bioactivity, functionality, health benefits and bioavailability. Nutrients 2018, 10, 1615. [Google Scholar] [CrossRef] [PubMed] [Green Version]
- Clifford, M.N.; Johnston, K.L.; Knight, S.; Kuhnert, N. Hierarchical scheme for LC-MSn identification of chlorogenic acids. J. Agric. Food Chem. 2003, 51, 2900–2911. [Google Scholar] [CrossRef] [PubMed]
- Clifford, M.N.; Knight, S.; Kuhnert, N. Discriminating between the six isomers of dicaffeoylquinic acid by LC-MSn. J. Agric. Food Chem. 2005, 53, 3821–3832. [Google Scholar] [CrossRef] [PubMed]
- Ferreres, F.; Gomes, N.G.M.; Valentão, P.; Pereira, D.M.; Gil-Izquierdo, A.; Araújo, L.; Silva, T.C.; Andrade, P.B. Leaves and stem bark from Allophylus africanus P. Beauv.: An approach to anti-inflammatory properties and characterization of their flavonoid profile. Food Chem. Toxicol. 2018, 118, 430–438. [Google Scholar] [CrossRef]
- Hirawan, R.; Beta, T. C-Glycosylflavone and lignan diglucoside contents of commercial, regular, and whole-wheat spaghetti. Cereal Chem. J. 2011, 88, 338–343. [Google Scholar] [CrossRef]
- Roriz, C.L.; Barros, L.; Carvalho, A.M.; Santos-Buelga, C.; Ferreira, I.C. Pterospartum tridentatum, Gomphrena globosa and Cymbopogon citratus: A phytochemical study focused on antioxidant compounds. Food Res. Int. 2014, 62, 684–693. [Google Scholar] [CrossRef] [Green Version]
- Andreasen, M.F.; Christensen, L.P.; Meyer, A.S.; Hansen, Å. Content of phenolic acids and ferulic acid dehydrodimers in 17 rye (Secale cereale L.) varieties. J. Agric. Food Chem. 2000, 48, 2837–2842. [Google Scholar] [CrossRef]
- Kulichová, K.; Sokol, J.; Nemeček, P.; Maliarová, M.; Maliar, T.; Havrlentová, M.; Kraic, J. Phenolic compounds and biological activities of rye (Secale cereale L.) grains. Open Chem. 2019, 17, 988–999. [Google Scholar] [CrossRef]
- Skrajda-Brdak, M.; Konopka, I.; Tańska, M.; Czaplicki, S. Changes in the content of free phenolic acids and antioxidative capacity of wholemeal bread in relation to cereal species and fermentation type. Eur. Food Res. Technol. 2019, 245, 2247–2256. [Google Scholar] [CrossRef] [Green Version]
- Zou, Y.; Yang, M.; Zhang, G.; He, H.; Yang, T. Antioxidant activities and phenolic compositions of wheat germ as affected by the roasting process. J. Am. Oil Chem. Soc. 2015, 92, 1303–1312. [Google Scholar] [CrossRef]
- Vaher, M.; Matso, K.; Levandi, T.; Helmja, K.; Kaljurand, M. Phenolic compounds and the antioxidant activity of the bran, flour and whole grain of different wheat varieties. Procedia Chem. 2010, 2, 76–82. [Google Scholar] [CrossRef] [Green Version]
- López-Perea, P.; Guzmán-Ortiz, F.A.; Román-Gutiérrez, A.D.; Castro-Rosas, J.; Gómez-Aldapa, C.A.; Rodríguez-Marín, M.L.; Falfán-Cortés, R.N.; González-Olivares, L.G.; Torruco-Uco, J.G. Bioactive compounds and antioxidant activity of wheat bran and barley husk in the extracts with different polarity. Int. J. Food Prop. 2019, 22, 646–658. [Google Scholar] [CrossRef]
- Samyor, D.; Deka, S.C.; Das, A.B. Phytochemical and antioxidant profile of pigmented and non-pigmented rice cultivars of Arunachal Pradesh, India. Int. J. Food Prop. 2016, 19, 1104–1114. [Google Scholar] [CrossRef]
- Smuda, S.S.; Mohsen, S.M.; Olsen, K.; Aly, M.H. Bioactive compounds and antioxidant activities of some cereal milling by-products. J. Food Sci. Technol. 2018, 55, 1134–1142. [Google Scholar] [CrossRef] [PubMed] [Green Version]
- Korycińska, M.; Czelna, K.; Jaromin, A.; Kozubek, A. Antioxidant activity of rye bran alkylresorcinols and extracts from whole-grain cereal products. Food Chem. 2009, 116, 1013–1018. [Google Scholar] [CrossRef]
- Shahidi, F.; Zhong, Y. Measurement of antioxidant activity. J. Funct. Foods 2015, 18, 757–781. [Google Scholar] [CrossRef]
- Călinoiu, L.F.; Vodnar, D.C. Thermal processing for the release of phenolic compounds from wheat and oat bran. Biomolecules 2020, 10, 21. [Google Scholar] [CrossRef] [Green Version]

| Wheat Germ | Maize Bran–Germ | Rye Bran | Wheat Bran | |
|---|---|---|---|---|
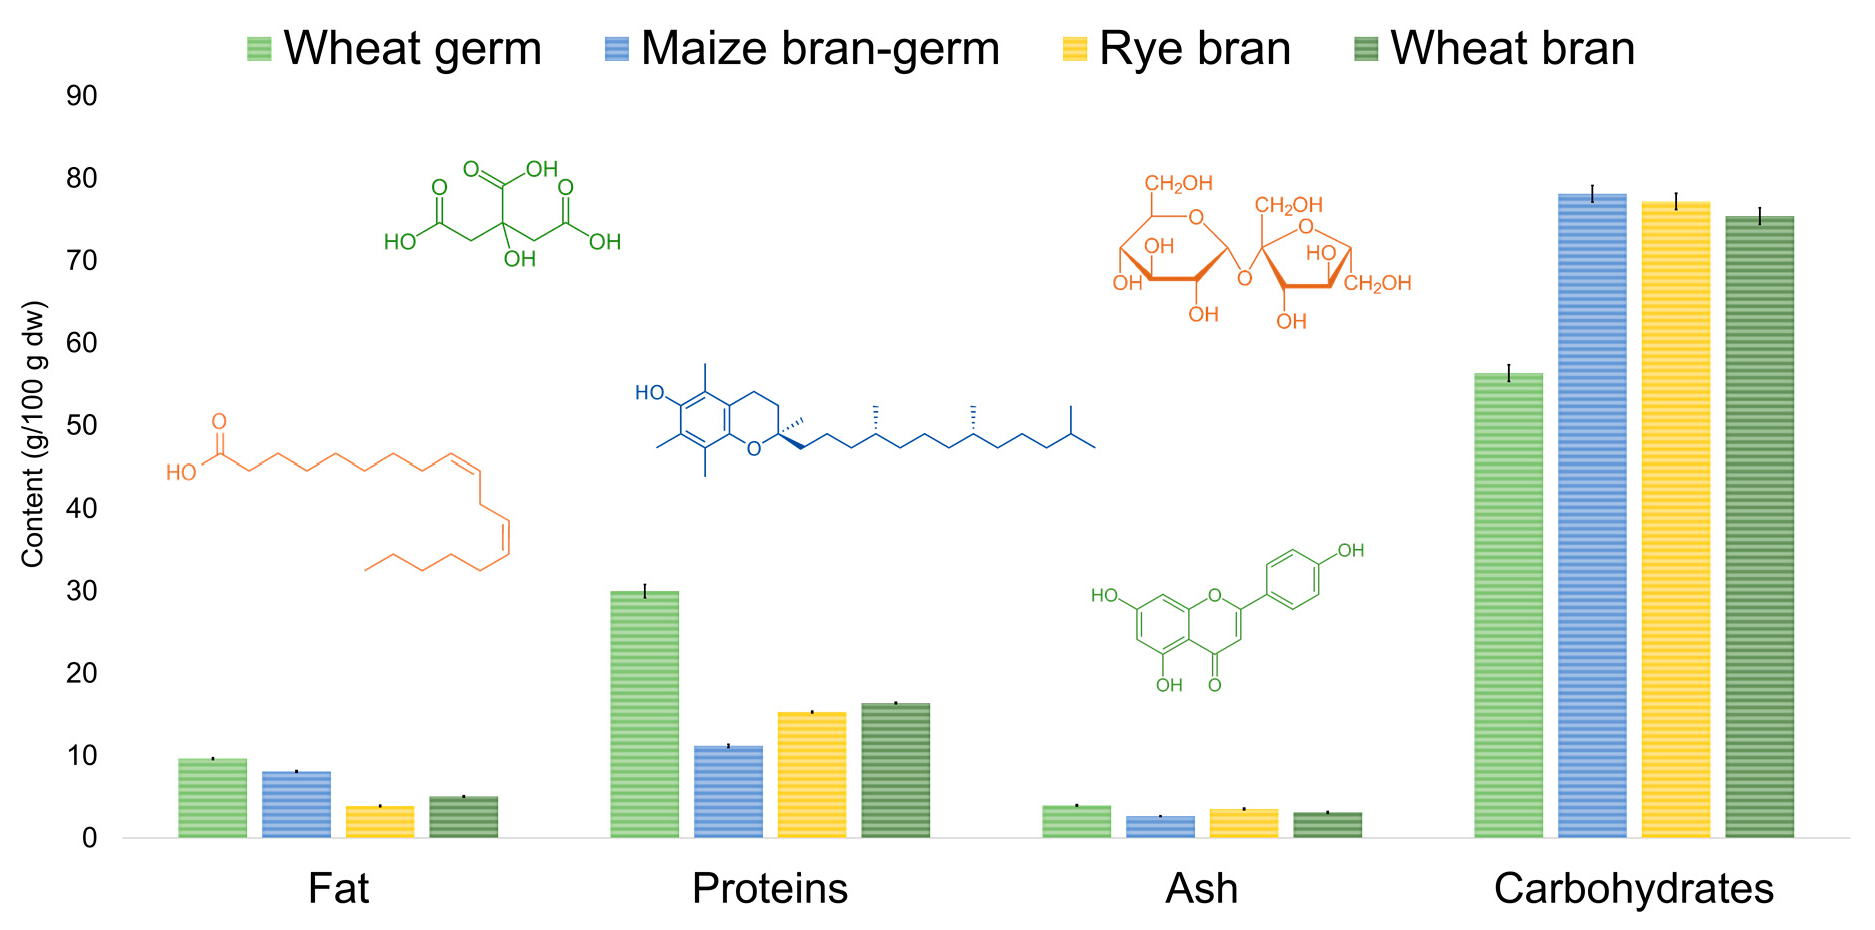
| Fat (g/100 g dw) | 9.64 ± 0.01 a | 8.08 ± 0.01 b | 3.9 ± 0.1 d | 5.05 ± 0.02 c |
| Proteins (g/100 g dw) | 30.0 ± 0.1 a | 11.2 ± 0.2 d | 15.3 ± 0.1 c | 16.4 ± 0.1 b |
| Ash (g/100 g dw) | 3.97 ± 0.05 a | 2.66 ± 0.04 d | 3.54 ± 0.04 b | 3.12 ± 0.04 c |
| Carbohydrates (g/100 g dw) | 56.35 ± 0.02 d | 78.12 ± 0.04 a | 77.2 ± 0.1 b | 75.42 ± 0.01 c |
| Energy (kcal/100 g dw) | 432.3 ± 0.1 a | 429 ± 0.2 b | 405.4 ± 011 d | 412.8 ± 0.1 c |
| Wheat Germ | Maize Bran–Germ | Rye Bran | Wheat Bran | |
|---|---|---|---|---|
| Free sugars (g/100 g dw) | ||||
| Fructose | nd | 0.15 ± 0.02 | nd | nd |
| Glucose | 0.18 ± 0.01 c | 0.16 ± 0.01 b | nd | 0.14 ± 0.01 a |
| Sucrose | 10.4 ± 0.1 a | 3.84 ± 0.01 b | 2.92 ± 0.03 c | 2.9 ± 0.1 c |
| Trehalose | 0.25 ± 0.01 | nd | nd | nd |
| Raffinose | 4.65 ± 0.03 a | 0.4 ± 0.1 d | 0.59 ± 0.01 c | 1.69 ± 0.01 b |
| Total of free sugars | 15.2 ± 0.1 a | 4.4 ± 0.1 c | 3.51 ± 0.02 d | 4.7 ± 0.1 b |
| Organic acid (g/100 g dw) | ||||
| Oxalic acid | 0.090 ± 0.001 b | 0.105 ± 0.001 a | 0.0471 ± 0.0001 d | 0.0593 ± 0.0001 c |
| Malic acid | nd | nd | tr | tr |
| Ascorbic acid | tr | tr | nd | nd |
| Shikimic acid | nd | nd | nd | tr |
| Citric acid | 0.857 ± 0.002 a | 0.204 ± 0.001 d | 0.424 ± 0.001 c | 0.539 ± 0.001 b |
| Fumaric acid | tr | tr | tr | tr |
| Total of organic acids | 0.946 ± 0.002 a | 0.309 ± 0.001 d | 0.471 ± 0.001 c | 0.598 ± 0.001 b |
| Wheat Germ | Maize Bran–Germ | Rye Bran | Wheat Bran | |
|---|---|---|---|---|
| Fatty acids (relative %) | ||||
| C14:0 | 0.12 ± 0.01 b | nd | 0.14 ± 0.01 a | 0.126 ± 0.001 b |
| C15:0 | 0.073 ± 0.003 c | nd | 0.15 ± 0.01 a | 0.104 ± 0.001 b |
| C16:0 | 18.02 ± 0.02 a | 10.6 ± 0.3 c | 15.59 ± 0.04 b | 18.3 ± 0.2 a |
| C16:1 | 0.17 ± 0.02 c | 0.101 ± 0.004 d | 0.27 ± 0.02 a | 0.20 ± 0.01 b |
| C18:0 | 0.86 ± 0.01 c | 2.955 ± 0.001 a | 1.3 ± 0.1 b | 1.32 ± 0.01 b |
| C18:1n9c | 13.4 ± 0.1 d | 29.0 ± 0.1 a | 17.31 ± 0.04 b | 16.07 ± 0.04 c |
| C18:2n6c | 57.1 ± 0.1 a | 54.8 ± 0.2 c | 53.9 ± 0.1 d | 56.3 ± 0.2 b |
| C18:3n3 | 8.0 ± 0.1 b | 1.04 ± 0.01 d | 8.6 ± 0.1 a | 5.17 ± 0.05 c |
| C20:0 | 0.205 ± 0.001 c | 0.48 ± 0.01 a | nd | 0.24 ± 0.01 b |
| C20:1 | 1.35 ± 0.03 b | 0.168 ± 0.005 d | 1.456 ± 0.003 a | 1.0 ± 0.1 c |
| C22:0 | 0.25 ± 0.02 c | 0.36 ± 0.03 b | 0.42 ± 0.01 a | 0.41 ± 0.01 a |
| C20:5n3 | 0.30 ± 0.02 c | nd | 0.47 ± 0.01 a | 0.40 ± 0.02 b |
| C24:0 | 0.20 ± 0.01 d | 0.46 ± 0.01 b | 0.49 ± 0.03 a | 0.29 ± 0.01 c |
| SFA | 19.73 ± 0.02 b | 14.9 ± 0.3 d | 18.1 ± 0.1 c | 20.8 ± 0.2 a |
| MUFA | 14.9 ± 0.1 d | 29.2 ± 0.1 a | 19.03 ± 0.02 b | 17.3 ± 0.1 c |
| PUFA | 65.4 ± 0.1 a | 55.9 ± 0.2 d | 62.9 ± 0.1 b | 61.9 ± 0.3 c |
| Tocopherols (mg/100 g dw) | ||||
| α-Tocopherol | 13.46 ± 0.01 a | 3.38 ± 0.02 d | 4.1 ± 0.1 c | 5.23 ± 0.04 b |
| β-Tocopherol | 9.27 ± 0.04 a | 0.12 ± 0.03 d | 1.27 ± 0.01 c | 2.99 ± 0.01 b |
| γ-Tocopherol | nd | 1.61 ± 0.03 a | nd | 0.140 ± 0.001 b |
| δ-Tocopherol | 0.046 ± 0.001 | nd | nd | nd |
| Total of tocopherols | 22.8 ± 0.1 a | 5.10 ± 0.02 d | 5.4 ± 0.1 c | 8.35 ± 0.04 b |
| Peak | Rt (min) | λmax (nm) | [M-H]− (m/z) | MS2 (m/z) | Tentative Identification |
|---|---|---|---|---|---|
| 1 | 4.7 | 301 | 487 | 162 (100) | p-Coumaric acid dihexoside |
| 2 | 4.8 | 311 | 341 | 179(100), 161(15), 132(5) | Caffeic acid hexoside |
| 3 | 5.43 | 311 | 341 | 179(100), 161(15), 132(5) | Caffeic acid hexoside |
| 4 | 11.45 | 345 | 579 | 459(35), 429(10), 357(5), 327(10), 309(5) | Luteolin-O-pentoside-C-hexoside |
| 5 | 12.11 | 287 | 385 | 267 (100), 249(20) | Unknown compound |
| 6 | 12.86 | 336 | 563 | 545(43), 473(100), 443(7), 383(31), 353(28), 311(5) | Apigenin-C-pentoside-C-hexoside |
| 7 | 13.21 | 326 | 563 | 545(20), 473(92), 443(100), 383(28), 353(25), 311(5) | Apigenin-C-hexoside-C-pentoside |
| 8 | 14.21 | 336 | 563 | 545(32), 473(100), 443(98), 383(38), 353(31), 311(5) | Apigenin-C-pentoside-C-hexoside |
| 9 | 17.11 | 324 | 515 | 353(60), 191(100), 179(30), 173(5), 161(5), 135(5) | 3,5-O-Dicaffeoylquinic acid |
| 10 | 19.65 | 331 | 769 | 563(11), 545(81), 425(100), 335(31) | Sinapic acid ester of apigenin-C-diglycoside |
| 11 | 20.53 | 331 | 769 | 563(10), 545(89), 425(100), 335(12) | Sinapic acid ester of apigenin-C-diglycoside |
| Peak | Tentative Identification | Content (mg/g Extract) | |||
|---|---|---|---|---|---|
| Wheat Germ | Maize Bran–Germ | Rye Bran | Wheat Bran | ||
| 1 | p-Coumaric acid dihexoside | nd | nd | 0.57 ± 0.02 | nd |
| 2 | Caffeic acid hexoside | 0.088 ± 0.001 b | 0.046 ± 0.001 c | nd | 0.115 ± 0.006 a |
| 3 | Caffeic acid hexoside | nd | nd | nd | nd |
| 4 | Luteolin-O-pentoside-C-hexoside | 0.121 ± 0.004 * | nd | nd | 0.084 ± 0.001 |
| 5 | Unknown compound | nd | nq | nq | nd |
| 6 | Apigenin-C-pentoside-C-hexoside | 0.602 ± 0.01 * | nd | nd | 0.39 ± 0.01 |
| 7 | Apigenin-C-hexoside-C-pentoside | 1.004 ± 0.058 * | nd | nd | 0.80 ± 0.05 |
| 8 | Apigenin-C-pentoside-C-hexoside | 2.9 ± 0.1 a | nd | 0.067 ± 0.002 c | 2.1 ± 0.1 b |
| 9 | 3,5-O-Dicaffeoylquinic acid | 0.34 ± 0.01 a | nd | 0.293 ± 0.001 b | 0.35 ± 0.01 a |
| 10 | Sinapic acid ester of apigenin-C-diglycoside | 0.16 ± 0.01 * | nd | nd | 0.140 ± 0.001 |
| 11 | Sinapic acid ester of apigenin-C-diglycoside | 0.470 ± 0.001 a | nd | 0.057 ± 0.001 c | 0.413 ± 0.007 b |
| Σ Phenolic acids | 1.066 ± 0.002 a | 0.046 ± 0.001 d | 0.93 ± 0.02 c | 1.017 ± 0.001 b | |
| Σ Flavonoids | 4.7 ± 0.1 a | nd | 0.067 ± 0.002 c | 3.4 ± 0.1 b | |
| Σ Phenolic compounds | 5.7 ± 0.1 a | 0.046 ± 0.001 d | 0.418 ± 0.003 c | 4.3 ± 0.1 b | |
| Wheat Germ | Maize Bran–Germ | Rye Bran | Wheat Bran | Trolox | |
|---|---|---|---|---|---|
| TBARS | 4.8 ± 0.1 a | 0.62 ± 0.01 c | 0.98 ± 0.01 b | 0.26 ± 0.01 d | 0.023 ± 0.001 e |
| OxHLIA, Δt 60 min | na | na | 0.58 ± 0.02 | na | 0.020 ± 0.001 |
| OxHLIA, Δt 120 min | na | na | 1.02 ± 0.04 * | na | 0.041 ± 0.001 |
| Wheat Germ | Maize Bran–Germ | Rye Bran | Wheat Bran | Ampicillin | Imipenem | Vancomycin | ||||||||
|---|---|---|---|---|---|---|---|---|---|---|---|---|---|---|
| MIC | MBC | MIC | MBC | MIC | MBC | MIC | MBC | MIC | MBC | MIC | MBC | MIC | MBC | |
| Gram-negative bacteria | ||||||||||||||
| Escherichia coli | 10 | >20 | 10 | >20 | 20 | >20 | 20 | >20 | <0.15 | <0.15 | <0.0078 | <0.0078 | nt | nt |
| Klebsiella pneumoniae | >20 | >20 | >20 | >20 | >20 | >20 | >20 | >20 | 10 | 20 | <0.0078 | <0.0078 | nt | nt |
| Morganella morganii | 20 | >20 | 20 | >20 | 20 | >20 | 20 | >20 | 20 | >20 | <0.0078 | <0.0078 | nt | nt |
| Proteus mirabilis | >20 | >20 | >20 | >20 | >20 | >20 | >20 | >20 | <015 | <0.15 | <0.0078 | <0.0078 | nt | nt |
| Pseudomonas aeruginosa | >20 | >20 | >20 | >20 | >20 | >20 | >20 | >20 | >20 | >20 | 0.5 | 1 | nt | nt |
| Gram-positive bacteria | ||||||||||||||
| Enterococcus faecalis | 10 | >20 | 20 | >20 | 20 | >20 | 20 | >20 | <0.15 | <0.15 | nt | nt | <0.0078 | <0.0078 |
| Listeria monocytogenes | 10 | >20 | 20 | >20 | 20 | >20 | 10 | >20 | <0.15 | <0.15 | <0.0078 | <0.0078 | nt | nt |
| MRSA | 10 | >20 | 2.5 | >20 | 5 | >20 | 5 | >20 | <0.15 | <0.15 | nt | nt | 0.25 | 0.5 |
Publisher’s Note: MDPI stays neutral with regard to jurisdictional claims in published maps and institutional affiliations. |
© 2021 by the authors. Licensee MDPI, Basel, Switzerland. This article is an open access article distributed under the terms and conditions of the Creative Commons Attribution (CC BY) license (https://creativecommons.org/licenses/by/4.0/).
Share and Cite
Cardoso, R.V.C.; Fernandes, Â.; Pinela, J.; Dias, M.I.; Pereira, C.; Pires, T.C.S.P.; Carocho, M.; Vasallo, E.F.; Ferreira, I.C.F.R.; Barros, L. Valorization of Cereal By-Products from the Milling Industry as a Source of Nutrients and Bioactive Compounds to Boost Resource-Use Efficiency. Agronomy 2021, 11, 972. https://doi.org/10.3390/agronomy11050972
Cardoso RVC, Fernandes Â, Pinela J, Dias MI, Pereira C, Pires TCSP, Carocho M, Vasallo EF, Ferreira ICFR, Barros L. Valorization of Cereal By-Products from the Milling Industry as a Source of Nutrients and Bioactive Compounds to Boost Resource-Use Efficiency. Agronomy. 2021; 11(5):972. https://doi.org/10.3390/agronomy11050972
Chicago/Turabian StyleCardoso, Rossana V. C., Ângela Fernandes, José Pinela, Maria Inês Dias, Carla Pereira, Tânia C. S. P. Pires, Márcio Carocho, Esteban Fernández Vasallo, Isabel C. F. R. Ferreira, and Lillian Barros. 2021. "Valorization of Cereal By-Products from the Milling Industry as a Source of Nutrients and Bioactive Compounds to Boost Resource-Use Efficiency" Agronomy 11, no. 5: 972. https://doi.org/10.3390/agronomy11050972