Communication

Durum and Bread Wheat Flours. Preliminary Mineral Characterization and Its Potential Health Claims

by
María Ciudad-Mulero
1,
María Cruz Matallana-González
1,
María Jesús Callejo
2,
José M. Carrillo
3,
Patricia Morales
1,* and
Virginia Fernández-Ruiz
1,*
1
Departamento de Nutrición y Ciencia de los Alimentos, Facultad de Farmacia, Universidad Complutense de Madrid (UCM), Plaza Ramón y Cajal s/n, 28040 Madrid, Spain
2
Departamento Química y Tecnología de Alimentos, Escuela Técnica Superior de Ingeniería Agronómica, Alimentaria y de Biosistemas (E.T.S.I.A.A.B.), Universidad Politécnica de Madrid, Ciudad Universitaria s/n, 28040 Madrid, Spain
3
Unidad de Genética, Departamento de Biotecnología y Biología General, Escuela Técnica Superior de Ingeniería Agronómica, Alimentaria y de Biosistemas (E.T.S.I.A.A.B.), Universidad Politécnica de Madrid, Ciudad Universitaria s/n, 28040 Madrid, Spain
*
Authors to whom correspondence should be addressed.
Agronomy 2021, 11(1), 108; https://doi.org/10.3390/agronomy11010108
Submission received: 7 December 2020 / Revised: 29 December 2020 / Accepted: 6 January 2021 / Published: 8 January 2021

Abstract

:
Wheat is one of the most important cereals in terms of its role in the human diet. The distribution of the nutrients in wheat grains depends largely on their morphology, the bran fraction being the richest in minerals, thus developing important functions related to human health. The main purpose of this study was to point out the potential nutritional and health claims related to the mineral composition based on the current European legislation in order to valorize the interesting wheat varieties traditionally consumed in Spain. The mineral composition (microelements: Fe, Cu, Mn, and Zn; and macrolements: Ca, Mg, Na, and K) were evaluated in different milling fractions (white flour, whole grain flour, and bran fraction) of 4 wheat varieties of durum (Triticum turgidum ssp. durum Linnaeus) and bread (Triticum aestivum Linnaeus) wheat. As expected, the mineral concentration was higher in the case of bran and whole grain flour, K and Mg being the principal minerals found. A difference between wheat genotype and harvesting year have been found. Moreover, regarding these preliminary results, some samples analysed in the present study met the conditions of use of different approved health claims that could support the possibility to consider wheat flours, especially whole grain flour and bran fraction as functional foods, but some did not.

Graphical Abstract

1. Introduction

Cereals and their derivatives are staple foods in the Mediterranean dietary pattern and their consumption is essential as part of a healthy diet [1]. Cereals have also been a cornerstone of the history of human food from a cultural point of view, as they were the first plants to be cultivated by humans in the eastern Mediterranean [2]. In terms of their role in the diet, wheat (Triticum aestivum Linnaeus, Triticum durum Desfontaines) is one of the most important cereals [3], which is used as an ingredient in a wide range of food products [4,5]. Flours obtained from bread wheat varieties (Triticum aestivum L.) are widely used for bread and other bakery products elaboration, while durum wheat flours (Triticum turgidum ssp. durum L.) have technological properties that makes it suitable for good-quality pasta production [5,6,7].
The distribution of the nutrients, and particularly the mineral fraction, in wheat grains depends largely on their morphology. The grain is structured into three differentiated parts (bran, endosperm, and germ), each of which has a different nutrient concentration [1]. Bran is the outer part of the wheat grains and it contains a significant amount of water-soluble proteins (albumins) [8], has a high dietary fibre content (mainly insoluble fraction) [5,9], and is rich in vitamins (particularly B-group vitamins such as thiamin, riboflavin, and niacin) and minerals (magnesium, potassium, calcium, iron, zinc, and selenium). This layer also has a high presence of bioactive compounds with antioxidant properties, such as phenolic compounds (mainly ferulic acid, flavonoids, and tannins) [5,10]. Finally, the germ is located near the base of the grain, and in the case of wheat, this fraction is rich in lipids and is notable for its content in proteins (albumins, globulins, glutenins) and vitamins, particularly B-group vitamins and vitamin E (tocopherols and tocotrienols) [11].
Minerals are essential micronutrients for human health and wheat stands out for being an important source of these components, including microelements such as Fe, Cu, Mn, and Zn; and macroelements, such as Mg, Ca, Na, and K. Iron plays an important role in the synthesis of haemoglobin. Moreover, it is a structural component of myoglobin as well as cofactor of several enzymes [12,13]. Copper is also important in the haemoglobin synthesis and it is a cofactor of numerous enzymes that are implicated in redox processes [14,15]. Zinc is a microelement, which has important enzymatic, regulatory, and structural functions. It is one of the most important minerals in terms of human health as there are more than 300 enzymes, which are dependent of Zn. Moreover, Zn is an essential mineral for the growth and it also promotes the wound healing [13,14,16]. Manganese is another important microelement as it is a key constituent of several enzymes. It is essential for numerous metabolic functions and for intracellular activities [17]. Among macroelements, calcium is the most abundant mineral in the human body, which is mainly located in bones and teeth. It is necessary for the growth and normal maintenance of the bone tissue and it is also involved in blood coagulation, in the maintenance of neuromuscular activity, as well as in the regulation of the membrane’s permeability [14,17]. Magnesium is an important mineral for the normal functioning of the body. It is a cofactor of several intracellular enzymes and it is involved in the neuromuscular function [14,17]. Sodium is the main cation of the extracellular liquid, while potassium is the major cation of the intracellular liquid. Sodium and potassium play an important role in the regulation of hydrolytic and acid- base balance [17].
Given that cereals, and particularly wheat, are staple foods that play a key role in the human diet, it is highly desirable to find ways to improve their nutritional quality. In this sense, traditional genetic improvement programs are currently being developed in order to obtain varieties of bread wheat and durum wheat that have a greater content in mineral elements (Fe, Zn, Cu, Mg, K, etc.) and other bioactive compounds such as dietary fibre, arabinoxylans, and phenolic compounds, which have numerous benefits for human health [5].
As far as the author’s knowledge, this is the first report of mineral composition of Cajeme, Marius, Endural, and Aldural wheat varieties. Therefore, in the present work, the mineral compositions (macro and microelements) were preliminary characterized in different wheat flours (whole grain flour, white flour, and bran fraction) obtained from different wheat varieties (Cajeme and Marius, corresponding to bread wheat; and Endural and Aldura, corresponding to durum wheat), as part of a genetic improvement project.
Moreover, the main purpose of this study was to firstly characterize the micro and macroelements of these wheat varieties flours in order to point out the potential nutritional and health claims related to their mineral composition that can be mentioned in the food labelling, based on the current European legislation, and valorise these interesting wheat varieties.

2. Materials and Methods

2.1. Wheat Samples

Whole grain flours, white flours, and bran fractions from different bread wheat (Triticum aestivum L., Cajeme and Marius varieties) and durum wheat (Triticum turgidum ssp. durum L., Endural and Aldura varieties) were analysed (Table 1). The present work is part of project reference AGL2012-38345, funded by Spanish Ministry of Science and Technology. The growing conditions of studied wheat varieties were controlled and were the same (management practices, soil fertilization uses, among others) regardless of the year of harvest in order to avoid potential differences (biases) in the mineral content due to the use of fertilizers. The wheat grains were harvested (40°26′47.36″ N, 3°44′21.00″ W) in two different and consecutive years and processed in the Escuela Técnica Superior de Ingeniería Agronómica, Alimentaria y de Biosistemas, Universidad Politécnica de Madrid, Spain.

2.2. Milling Process

The whole grain flour was obtained using a Tekator Mill equipment and sieve with 1 mm of mesh. To obtain white flour, a Chopin CD1 mill (Villeneuve-la-Garenne, France) was used in 4 stages (1 crushing and 3 compressions). The extraction rates for white flours are shown in Table 2. The composition of bran fraction was calculated by application of the Equation (1).

2.3. Standards and Reagents

HCl, HNO3, micro (Fe, Cu, Mn, and Zn) and macroelements (Ca, Mg, Na, and K) standards (>99% purity), as well as La2O3 and CsCl (>99% purity) were purchased from Merck (Darmstadt, Germany).

2.4. Total Mineral Content (Ashes) and Mineral Elements Analysis

Flour samples obtained from the studied wheat varieties were subject to dry-ash mineralization at 550 °C. Minerals were extracted in an acid mixture (1 mL 50% HCl + 1 mL 50% HNO3) and made up to 25 mL of distilled water. For the quantification of the macroelements, additional dilutions 1/10 (v/v) were prepared in order to avoid interferences. For the analysis of Ca and Mg, these dilutions were made with La2O3/HCl, whereas in the case of Na and K, CsCl was used [18]. For each sample, triplicate mineralization and extractions were carried out. Mineral concentrations were determined in the acid extracts by atomic absorption spectroscopy (AAS) with air/acetylene flame in a Perkin-Elmer 2280 spectrophotometer (Waltham, MA, USA), using the following wavelengths: 589.0 nm in Na analysis, 766.5 nm in K, 422.7 nm in Ca, 285.2 nm in Mg, 324.8 nm in Cu, 248.3 nm in Fe, 279.5 nm in Mn, and 213.8 nm in case of Zn. Slit was 0.7 with the exception of K, Fe, and Mn, in which 0.2 was used.
A standard reference material 1567a (Analysts, Analytical Chemistry Division, National Bureau of Standards) was used in order to calibrate instruments and evaluate the reliability of analytical methods for the determination of mineral elements in wheat flours. The certified concentrations of mineral elements in this standard reference material were the following: 1.41 ± 0.05 mg of iron per 100 g; 0.21 ± 0.02 mg of copper per 100 g; 0.94 ± 0.09 mg of manganese per 100 g; 1.16 mg of zinc per 100 g; 19.1 ± 0.4 mg of calcium per 100 g; 40 ± 2 mg of magnesium per 100 g, 0.61 ± 0.08 mg of sodium per 100 g, and 133 ± 3 mg of potassium per 100 g. The standard reference material was regularly analysed and the deviation of the analytical values compared to the reference values was always less than 5%.
In the case of bran fraction, total mineral content (ashes) and mineral elements were calculated by application of the following Equation (1):
Bran   concentration = Whole   grain   concentration ( White   flour   concentration × Extraction   rate ) ( 1 Extraction   rate )

2.5. Statistical Analysis

Mean ± standard deviations (SD) were determined using Statgraphics Plus 5.1 software (Madrid, Spain) to analyse data at the 95% confidence level. The data were statistically analysed by Analysis of variance (ANOVA), followed by Tukey test. The statistical significance level was set at p < 0.05.

3. Results and Discussion

3.1. Mineral Composition in Durum and Bread Flours

In the present study ash content, microelements (Fe, Cu, Mn, Zn) and macroelements (Mg, Ca, Na, K) were analysed in white and whole wheat flours (Table 3). Moreover, the content of these minerals was calculated in the bran fraction by using Equation (1) (Table 4). K and Mg were the main minerals in the studied samples, while Mn and Cu were found in the lowest amounts. This pattern is typical of cereals and it has been observed by other authors in different cereals grains, including wheat [19,20,21], rice [22], corn [23], oat [24,25], barley [24,26], and rye [27].
Mineral concentration varied widely among the different milling fractions of the wheat cultivars, bran fraction being the richest ones [19]. The results suggested that whole wheat flour and bran fraction from bread wheat varieties were generally higher in ash content than samples obtained from durum wheat varieties.
Regarding the analysed white flours, Zn and Fe were the main microelements, with values of 1.6–4.7 mg of Zn/100 g (samples S-M#1-WF and D-E#2-WF, with extraction rates of 67% and 59%, respectively) and 0.7(S-C#2-WF, 70% of extraction rate)–2.9 mg of Fe/100 g (D-E#2-WF, 59% of extraction rate). The obtained results were in accordance with those reported by other authors in durum wheat [28] and bread wheat [19,29,30]. On the other hand, among macroelements, K and Mg were the most abundant, and the content of these minerals ranged between 107.6–168.8 mg of K per 100 g of flour (samples D-A#1-WF and D-A#2-WF, with extraction rates of 63% and 58%, respectively) and between 50.1–223.0 mg of Mg per 100 g of flour (samples S-M#1-WF and D-E#2-WF, with extraction rates of 67% and 59%, respectively). Comparing the obtained results with those reported by different authors, Cubadda et al. (2009) found higher concentrations of K (320 mg/100 g) in durum wheat (Triticum turgidum), while the content of Mg observed by these researchers (112 mg/100 g) [28] were very similar with what was found in samples S-C#2-WF, with 70% of extraction rate (118.8 mg of Mg per 100 g) and S-M#2-WF, with 69% of extraction rate (108.8 mg of Mg per 100 g). Moreover, similar concentrations of K and lower content of Mg have been observed in bread wheat (Triticum aestivum) by De Brier et al., (2015) (150 mg of K/100 g; 19.10 mg of Mg/100 g) [30] and Vignola et al., (2016) (90.02–123.16 mg of K/100 g; 15.94–26.38 mg of Mg/100 g) [19].
Comparing the obtained values of mineral content in whole-wheat flours with those reported by other authors, it is observed that Hernández-Rodríguez et al. (2011) showed similar concentrations of Fe, Mn, Na, and K in different durum and bread whole wheat flours [31]. Recently, Simsek et al. (2019) analysed thirty hard red spring wheat cultivars (T. aestivum) and their results of K content (330–540 mg/100 g) [21] were in accordance with the concentration found in our study (304.2–553.5 mg/100 g in S-C#2-WGF and S-M#1-WGF, respectively). However, the samples analysed by Simsek et al., (2019) were richer in Ca and lower in Zn [21] in comparison to the whole-wheat flours studied in the present work.
Regarding the calculated samples of bran fraction (Table 4), it is observed that samples from Cajeme variety were the richest (p < 0.05) in Fe. The content of this mineral ranged from 2.3 mg/100 g (S-M#1-Bran) to 12.8 mg/100 g (S-C#2-Bran). These values were similar to those obtained by Shi et al. (2010) and by Roye et al. (2019), who studied the mineral composition of wheat bran (Triticum aestivum) and reported values of 10.79 mg of Fe/100 g and 4.91 mg of Fe/100 g, respectively [32,33]. The other microelements analysed in the present study were found between 1.3–6.4 mg of Cu per 100 g (samples S-M#2-Bran and D-A#1-Bran, respectively), 3.8–8.8 mg of Mn per 100 g (samples S-M#1-Bran and S-C#2-Bran, respectively), and 10.6–24.4 mg of Zn per 100 g (samples D-A#1-Bran and S-C#1-Bran, respectively). Comparing with other authors, it is observed that Anjum et al. (2002) reported similar values of Cu (2.9–5.3 mg/100 g) and Mn (6.8–9.7 mg/100 g) [29], while Shi et al. (2010) and Roye et al. (2019) also analysed wheat bran and obtained lower values of Cu and Zn and higher values of Mn [32,33]. The calculated values of Zn were slightly higher than those reported by Wang et al. (2020), who indicated that Zinc content over the years and across countries ranged from 2.38 to 15.98 mg/100 g in bran, with an average of 8.65 mg/100 g [34]. In the case of macrolements, samples from Marius variety are noted for their content in K, achieving 1371.5 mg/100 g in the case of S-M#1-Bran. The obtained results of this mineral were lower than those reported by Roye et al. (2019), who obtained values of 1606 mg of K per 100 g of wheat bran (T. aestivum). These authors also reported values of Ca (81.4 mg/100 g) higher than the content obtained in our study, which ranged from 6.5 to 43.1 mg of Ca/100 g (samples D-A#1-Bran and D-E#2-Bran, respectively). Moreover, the concentration of Mg in the analysed samples was between 207.9 mg/100 g (S-C#1-Bran) and 1000.1 mg/100 g (S-M#2-Bran), being these values in accordance with other found in the scientific literature (658.7 mg of Mg per 100 g of wheat bran) [33].
In the present study, it was also observed that whole wheat flour and bran fraction corresponding to second harvesting year were significantly higher (p < 0.05) in Zn, Mg, and Ca, while Na and K from whole wheat flour and bran fraction of this year were significantly lower (p < 0.05), comparing with the same samples of previous harvesting year. Moreover, white flours corresponding to the first harvesting year, with the exception of Aldura variety, present a significantly higher (p < 0.05) amount of ash than the second harvesting year samples. Regarding mineral content, the higher amount (p < 0.05) of Zn, Mg, and Ca were found in the bran of second harvesting year (S-C#2-Bran, S-M#2-Bran, and D-E#2-Bran, respectively), while bran fraction of the first harvesting year were richer in Cu, Na, and K. On the other hand, Mn was found in higher amount (p < 0.05) in samples obtained from bread varieties, being the sample S-C#1-Bran the richest in this microelement (8.8 mg/100 g, dw). In general, white flour obtained from durum wheat varieties was richest in K. The influence of genotype and environmental conditions on the mineral composition of wheat has been studied by different authors. In this sense, Vignola et al. (2016) analysed eleven commercial bread wheat cultivars from Argentina and reported that K was the prevailing element in the studied cultivars, followed by Mg, Ca, Mn, and Fe, pointed out that the concentrations of mineral elements in whole grain were significantly influenced by genotype and harvest year [19]. Benincasa et al. (2015) also quantified mineral content in wheat flours, concluding that in all analysed wheat species, the most abundant mineral was P (59% of total, on average), followed by K, Mg, and Ca (25, 10, and 4% of total, on average, respectively). Fe, as well as Mn, accounted for about 0.4% of total microelements, while Zn represented 0.2% [35]. Moreover, Ficco et al. (2009) analysed mineral content in whole set of 84 Italian durum wheat cultivars and reported values for Fe, Cu, and K similar to our results; however, these authors found lower amount of Zn, Na, and Mg and higher content of Mn and Ca [36]. Within the genotypes analysed by Ficco et al., (2009), there were about two-fold differences in Fe, Zn, and Mn contents, suggesting that there was some genetic potential to increase the content of these elements in durum wheat grains [36].

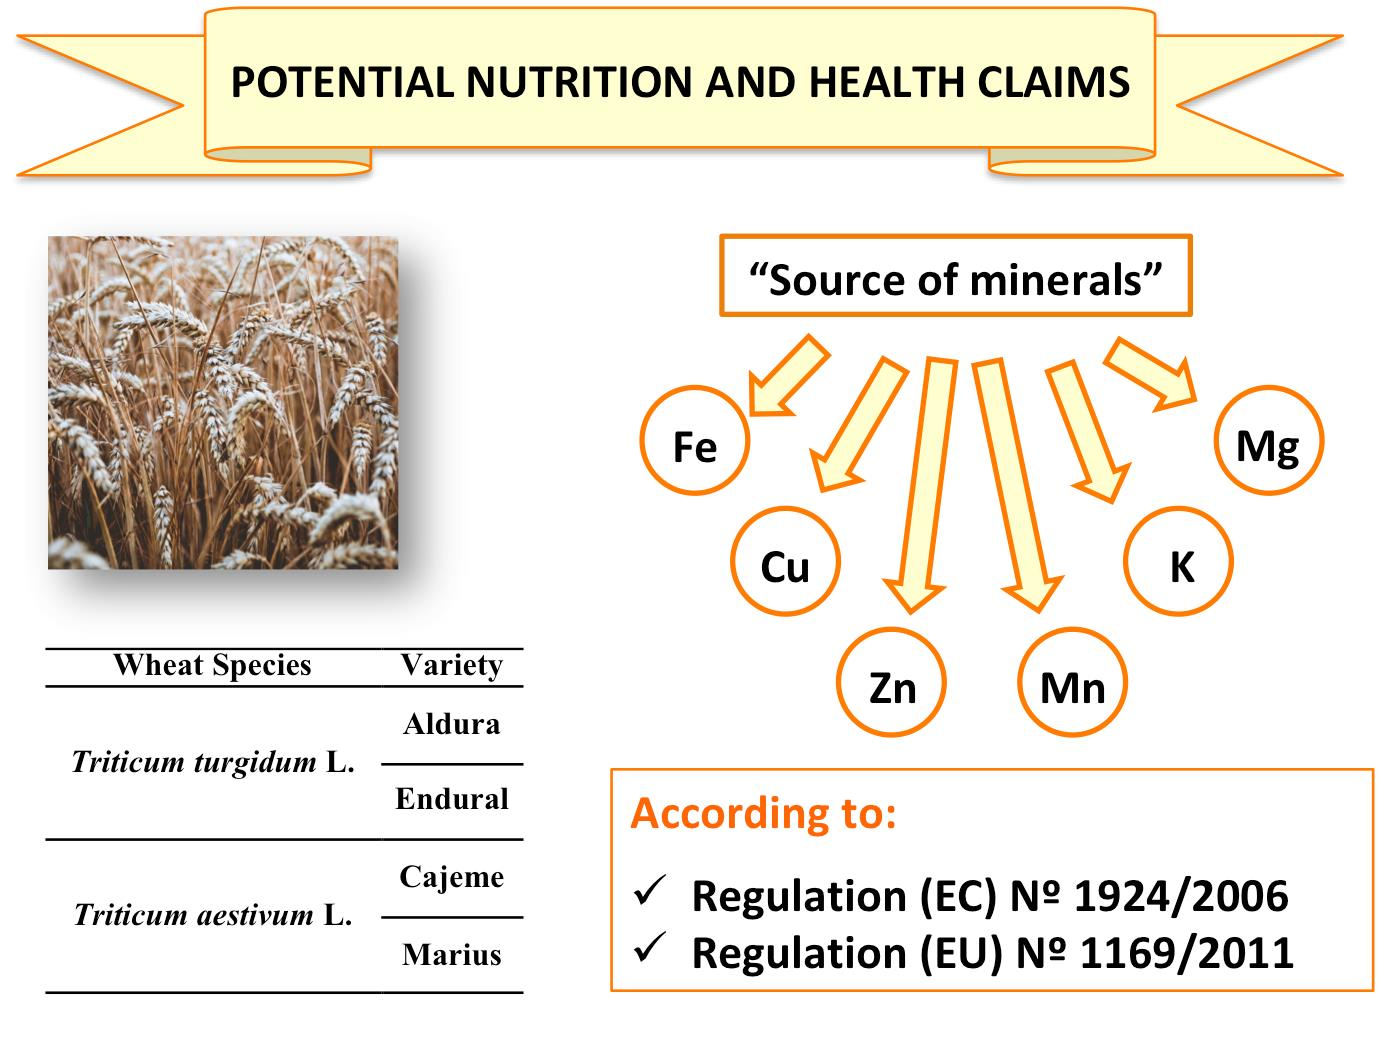
3.2. Potential Nutritional and Health Claims of Analysed Durum and Bread Wheat Flours

Samples analysed in the present study met the conditions of use of different approved health claims (see Table 5) that could support the possibility to consider wheat flours, especially whole grain flour and bran fraction, as functional foods. Among the mechanisms of absorption of minerals in the human body, active transport is highlighted. However, there are several factors, which are involved on the mineral absorption, including the age and the individual physiological state, the amount of mineral consumed, or the composition of the diet. In this sense, it is important to stand out that cereals, and especially whole grains, contain some compounds, such as inositol phosphates, that can negatively affect the bioaccessibility of minerals. However, cereals also present significant amounts of other bioactive compounds with prebiotic effect, such as arabinoxylans, which increase the bioaccessibility of minerals as they favour their absorption.
Regarding the potential health claims for microelements, some white flours (samples D-A#1-WF, D-E#2-WF, and S-C#1-WF, with extraction rates of 63%, 59%, and 68%, respectively), all analysed samples whole grain flour (with the exception of sample S-M#1-WGF), and all bran samples are considered as a source of Iron and meet the requirements of Regulation (EC) No 1924/2006 and Regulation No (EU) 1169/2011 (2.1 mg of iron per 100 g of food, fw) for Fe approved health claims.
For Copper, all white flours with the exception of samples D-A#1-WF (extraction rate of 63%), D-E#2-WF (extraction rate of 59%), and S-C#1-WF (extraction rate of 68%), all analysed samples whole grain flour, and all bran samples could be considered as a source of Cu (0.15 mg of copper per 100 g of food, fw) and meet the requirements for Cu approved health claims.
Some white flours (S-C#1-WF, S-C#2-WF, and S-M#1-WF), with extraction rates of 68%, 70%, and 67%, respectively), all whole grain flour, and all bran samples meet the requirement for Manganese health claims, since all of them provide at least 0.3 mg of manganese per 100 g of food, fw.
Finally, all white flours with the exception of S-M#1-WF (extraction rate of 67%), all analysed samples of whole grain flour, and all bran samples, could be considered as a source of Zn and meet the Regulation (EC) No 1924/2006 and Regulation No (EU) 1169/2011 requirements for Zn health claims, since all of them cover at least 1.5 mg of zinc per 100 g of food, fw.
Regarding the potential macroelements health claims applied to the analysed flours, all white flours with the exception of S-M#1-WF (extraction rate of 67%), all analysed samples of whole grain flour, and all bran samples, could be considered as a source of Magnesium (at least 56.25 mg of magnesium per 100 g of food, fw), and meet the necessary requirements for Mg health claims.
On the other hand, all whole grain flours analysed samples (with the exception of S-C#2-WGF) and all calculated Bran fractions meet the requirements for Potassium health claims “Potassium contributes to normal functioning of the nervous system and normal muscle function” and “Potassium contributes to the maintenance of normal blood pressure,” since all of them cover at least 300 mg of potassium per 100 g of food, fw.
This is a relevant aspect because nowadays consumers demand food products with added functional properties. In this sense, the analysed wheat flours obtained using the traditional genetic improvement contain relevant amounts of minerals and, consequently, they could be used as ingredients in the development of a wide range of food products with added functional properties. However, further studies are required in order to evaluate the influence of the edaphic factors on the mineral composition of wheat flours to corroborate the potential health claims attribute to these wheat varieties.

4. Conclusions

Wheat is one of the most important cereals in terms of its role in the human diet and it contains relevant amounts of minerals. Genotype and environmental factors affect the mineral content of wheat. In the studied samples, K and Mg were the main minerals. Due to their mineral composition, some analysed wheat flours can make use of a large number of approved health claims. This fact emphasizes the importance of the consumption of wheat flours (especially whole grain flour and bran fraction) as a mineral source, with supported health benefits. Moreover, these preliminary results indicate that some of the analysed wheat flours could be used as functional ingredients to develop food products with added functional properties in terms of their mineral composition. Moreover, it is important to highlight that wheat flours need to be individually evaluated in order to ensure that they meet the standard, since in view of obtained results, some samples met desired standards and some did not. Further studies regarding soil composition will be performed in order to support the proposed potential health claims despite of the influence of the edaphic factors on the mineral composition.

Author Contributions

Conceptualization, M.C.M.-G., V.F.-R., and P.M.; funding acquisition, J.M.C.; investigation, M.C.-M..; methodology, V.F.-R.; resources, J.M.C.; supervision, V.F.-R. and P.M.; validation, V.F.-R. and P.M.; writing—original draft, M.C.-M.; writing—review and editing, J.M.C., M.C.M.-G., V.F.-R., P.M., and M.J.C. All authors have read and agreed to the published version of the manuscript.

Funding

This research was funded by Spanish Ministry of Science and Technology (project reference AGL2012-38345), and ALIMNOVA research group (UCM 252/2017).

Acknowledgments

The authors are grateful to project reference AGL2012-38345 from the Spanish Ministry of Science and Technology, and to ALIMNOVA research group (UCM 252/2017).

Conflicts of Interest

The authors declare no conflict of interest.

References

  1. Ortega, R.M.; Aparicio Vizuete, A.; Jiménez Ortega, A.I.; Rodríguez Rodríguez, E. Cereales de grano completo y sus beneficios sanitarios. Nutr. Hosp. 2015, 32, 25–31. [Google Scholar] [PubMed]
  2. Mataix Verdú, J. Nutrición y Alimentación Humana, 2nd ed.; Ergon: Madrid, Spain, 2009. [Google Scholar]
  3. FAO. Food and Agriculture Organization of the United Nations. Crop Prospects and Food Situation-Quarterly Global Report No. 3; FAO: Rome, Italy, 2020. [Google Scholar]
  4. Lv, J.; Yub, L.; Lu, Y.; Niu, Y.; Liu, L.; Costa, J.; Yu, L. Phytochemical compositions, and antioxidant properties, and antiprolifera-tive activities of wheat flour. Food Chem. 2012, 135, 325–331. [Google Scholar] [CrossRef] [PubMed]
  5. Ciudad-Mulero, M.F.H.; Barros, L.; Fernandes, Â.; Ferreira, I.C.; Callejo, M.J.; Matallana-González, M.C.; Fernández-Ruiz, V.; Morales, P.; Carrillo, J.M. Potential Health Claims of Durum and Bread Wheat Flours as Functional Ingredients. Nutrients 2020, 12, 504. [Google Scholar] [CrossRef] [PubMed] [Green Version]
  6. Taccari, M.; Aquilanti, L.; Polverigiani, S.; Osimani, A.; Garofalo, C.; Milanović, V.; Clementi, F. Microbial Diversity of Type I Sourdoughs Prepared and Back-Slopped with Wholemeal and Refined Soft (Triticum aestivum) Wheat Flours. J. Food Sci. 2016, 81, M1996–M2005. [Google Scholar] [CrossRef]
  7. Visioli, G.; Comastri, A.; Imperiale, D.; Paredi, G.; Faccini, A.; Marmiroli, N. Gel-Based and Gel-Free Analytical Methods for the Detection of HMW-GS and LMW-GS in Wheat Flour. Food Anal. Methods 2016, 9, 469–476. [Google Scholar] [CrossRef]
  8. Chaquilla-Quilca, G.; Balandrán-Quintana, R.R.; Huerta-Ocampo, J.A.; Ramos-Clamont Montfort, G.; Luna-Valdez, J.G. Identifi-cation of proteins contained in aqueous extracts of wheat bran through a proteomic approach. J. Cereal Sci. 2018, 80, 31–36. [Google Scholar] [CrossRef]
  9. Rasane, P.; Jha, A.; Sabikhi, L.; Kumar, A.; Unnikrishnan, V.S. Nutritional advantages of oats and opportunities for its processing as value added foods—A review. J. Food Sci. Technol. 2013, 52, 662–675. [Google Scholar] [CrossRef] [Green Version]
  10. Gong, L.; Cao, W.; Chi, H.; Wang, J.; Zhang, H.; Liu, J.; Sun, B. Whole cereal grains and potential health effects: Involvement of the gut microbiota. Food Res. Int. 2018, 103, 84–102. [Google Scholar] [CrossRef]
  11. Finnie, S.; Atwell, W.A. Wheat Flour, 2nd ed.; AACC International: Eagan, MN, USA, 2016. [Google Scholar]
  12. Abbaspour, N.; Hurrell, R.; Kelishadi, R. Review on iron and its importance for human health. J. Res. Med. Sci. 2014, 19, 164–174. [Google Scholar]
  13. Garcia-Oliveira, A.L.; Chander, S.; Ortiz, R.; Menkir, A.; Gedil, M. Genetic Basis and Breeding Perspectives of Grain Iron and Zinc Enrichment in Cereals. Front. Plant Sci. 2018, 9, 937. [Google Scholar] [CrossRef]
  14. Carocho, M.; Rodrigues, P.; Ciudad-Mulero, M.; Fernández-Ruiz, V.; Ferreira, E.; Heleno, S.; Rodrigues, P.; Barros, L.; Ferreira, I.C. Comparison of different bread types: Chemical and physical parameters. Food Chem. 2020, 310, 125954. [Google Scholar] [CrossRef] [PubMed]
  15. Krzywoszyńska, K.; Witkowska, D.; Swiatek-Kozlowska, J.; Szebesczyk, A.; Kozłowski, H. General Aspects of Metal Ions as Sig-naling Agents in Health and Disease. Biomolecules 2020, 10, 1417. [Google Scholar] [CrossRef] [PubMed]
  16. Nriagu, J. Reference Module in Earth. Systems and Environmental Sciences; Elsevier: Amsterdam, The Netherlands, 2018. [Google Scholar]
  17. Zoroddu, M.A.; Aaseth, J.; Crisponi, G.; Medici, S.; Peana, M.; Nurchi, V.M. The essential metals for humans: A brief overview. J. Inorg. Biochem. 2019, 195, 120–129. [Google Scholar] [CrossRef] [PubMed]
  18. Fernández-Ruiz, V.; Olives, A.I.; Cámara, M.; Sánchez-Mata, M.C.; Torija, M.E. Mineral and trace elements content in 30 acces-sions of tomato fruits (Solanum lycopersicum L.) and wild relatives (Solanum pimpinellifolium L., Solanum cheesmaniae L. Riley, and Solanum habrochaites S. Knapp & D.M. Spooner). Biol. Trace Elem. Res. 2011, 141, 329–339. [Google Scholar] [PubMed]
  19. Vignola, M.B.; Moiraghi, M.; Salvucci, E.; Baroni, M.; Perez, G.T. Whole meal and white flour from Argentine wheat genotypes: Mineral and arabinoxylan differences. J. Cereal Sci. 2016, 71, 217–223. [Google Scholar] [CrossRef]
  20. Jaskulska, I.; Jaskulski, D.; Gałęzewski, L.; Knapowski, T.; Kozera, W.; Wacławowicz, R. Mineral Composition and Baking Value of the Winter Wheat Grain under Varied Environmental and Agronomic Conditions. J. Chem. 2018, 2018, 1–7. [Google Scholar] [CrossRef] [Green Version]
  21. Simsek, S.; Budak, B.; Schwebach, C.S.; Ovando-Martínez, M. Historical vs. modern hard red spring wheat: Analysis of the chem-ical composition. Cereal Chem. 2019, 96, 937–949. [Google Scholar] [CrossRef]
  22. Swamy, B.M.; Samia, M.; Boncodin, R.; Marundan, S.; Rebong, D.B.; Ordonio, R.L.; Miranda, R.T.; Rebong, A.T.O.; Alibuyog, A.Y.; Adeva, C.C.; et al. Compositional analysis of genetically engineered GR2E “Golden Rice” in compari-son to that of conventional rice. J. Agric. Food Chem. 2019, 67, 7986–7994. [Google Scholar] [CrossRef]
  23. Wang, F.; Zhao, H.; Yu, C.; Tang, J.; Wu, W.; Yang, Q. Determination of the geographical origin of maize (Zea mays L.) using min-eral element fingerprints. J. Sci. Food Agric. 2020, 100, 1294–1300. [Google Scholar] [CrossRef]
  24. Chappell, A.; Scott, K.P.; Griffiths, I.A.; Cowan, A.A.; Hawes, C.; Wishart, J.; Martin, P. The agronomic performance and nutri-tional content of oat and barley varieties grown in a northern maritime environment depends on variety and growing condi-tions. J. Cereal Sci. 2017, 74, 1–10. [Google Scholar] [CrossRef] [Green Version]
  25. Maximino, J.V.D.O.; Barros, L.M.; Pereira, R.M.; De Santi, I.I.; Aranha, B.C.; Busanello, C.; Viana, V.E.; Freitag, R.A.; Batista, B.L.; De Oliveira, A.C.; et al. Mineral and Fatty Acid Content Variation in White Oat Genotypes Grown in Brazil. Biol. Trace Element Res. 2020, 1–13. [Google Scholar] [CrossRef]
  26. Panizo-Casado, M.; Déniz-Expósito, P.; Rodríguez-Galdón, B.; Afonso-Morales, D.; Ríos-Mesa, D.; Díaz-Romero, C.; Rodríguez-Rodríguez, E.M. The chemical composition of barley grain (Hordeum vulgare L.) landraces from the Canary Islands. J. Food Sci. 2020, 85, 1725–1734. [Google Scholar] [CrossRef] [PubMed]
  27. Bağci, A.; Gecgel, Ü.; Dursun, N.; Özcan, M.M.; Tamkoç, A.; Özer, İ.; Özcan, M.M. The Oil Yield, Mineral Content, and Fatty Acid Compositions of Some Rye (Secale cereale) Grains. Iran J. Chem. Chem. Eng. 2019, 38, 285–292. [Google Scholar]
  28. Cubadda, F.; Aureli, F.; Raggi, A.; Carcea, M. Effect of milling, pasta making and cooking on minerals in durum wheat. J. Cereal Sci. 2009, 49, 92–97. [Google Scholar] [CrossRef]
  29. Anjum, F.M.; Butt, M.S.; Ahmad, N.; Ahmad, I. Phytate and mineral content in different milling fractions of some Pakistani spring wheats. Int. J. Food Sci. Technol. 2002, 37, 13–17. [Google Scholar] [CrossRef]
  30. De Brier, N.; Gomand, S.V.; Donner, E.; Paterson, D.; Delcour, J.A.; Lombi, E.; Smolders, E. Distribution of Minerals in Wheat Grains (Triticum aestivum L.) and in Roller Milling Fractions Affected by Pearling. J. Agric. Food Chem. 2015, 63, 1276–1285. [Google Scholar] [CrossRef] [PubMed]
  31. Rodríguez, L.H.; Morales, D.A.; Rodríguez, E.R.; Romero, C.D. Minerals and trace elements in a collection of wheat landraces from the Canary Islands. J. Food Compos. Anal. 2011, 24, 1081–1090. [Google Scholar] [CrossRef]
  32. Shi, R.; Zhang, Y.; Chen, X.; Sun, Q.; Zhang, F.; Römheld, V.; Zou, C. Influence of long-term nitrogen fertilization on micronutrient density in grain of winter wheat (Triticum aestivum L.). J. Cereal Sci. 2010, 51, 165–170. [Google Scholar] [CrossRef]
  33. Roye, C.; Bulckaen, K.; De Bondt, Y.; Liberloo, I.; Van De Walle, D.; Dewettinck, K.; Courtin, C. Side-by-side comparison of composition and structural properties of wheat, rye, oat, and maize bran and their impact on in vitro fermentability. Cereal Chem. J. 2020, 97, 20–33. [Google Scholar] [CrossRef] [Green Version]
  34. Wang, M.; Kong, F.; Liu, R.; Fan, Q.; Zhang, X. Zinc in Wheat Grain, Processing, and Food. Front. Nutr. 2020, 7, 124. [Google Scholar] [CrossRef]
  35. Benincasa, P.; Galieni, A.; Manetta, A.C.; Pace, R.; Guiducci, M.; Pisante, M.; Stagnari, F. Phenolic compounds in grains, sprouts and wheatgrass of hulled and non-hulled wheat species. J. Sci. Food Agric. 2015, 95, 1795–1803. [Google Scholar] [CrossRef] [PubMed]
  36. Ficco, D.B.M.; Riefolo, C.; Nicastro, G.; De Simone, V.; Di Gesù, A.M.; Beleggia, R.; Platani, C.; Cattivelli, L.; De Vita, P. Phytate and mineral elements concentration in a collection of Italian durum wheat cultivars. Field Crops Res. 2009, 111, 235–242. [Google Scholar] [CrossRef]
  37. European Comission. Commission Regulation (EU) No 432/2012 of 16 May, L136/1:40 (25/5/2012). Establishing a list of permitted health claims made on foods, other than those referring to the reduction of disease risk and to children’s development and health. Off. J. Eur. Union 2012, 136, 1–40. [Google Scholar]
  38. European Parliament & Council of the European Union. Regulation (EC) No 1924/2006 of the European Parliament and of the Council of 20 December 2006 on nutrition and health claims made on foods. Off. J. Eur. Union 2006, 304, 18–63. [Google Scholar]
  39. European Parliament & Council of the European Union. Regulation (EU) No 1169/2011 of the European Parliament and of the Council of 25 October 2011 on the provision of food information to consumers. Off. J. Eur. Union 2011, 50, 18–63. [Google Scholar]
Table 1. Analysed samples of wheat flour.
SpeciesVarietyHarvesting YearSample Code
White Flour
Triticum turgidum L.Aldura2013D-A#1-WF
2014D-A#2-WF
Endural2013D-E#1-WF
2014D-E#2-WF
Triticum aestivum L.Cajeme2013S-C#1-WF
2014S-C#2-WF
Marius2013S-M#1-WF
2014S-M#2-WF
Whole Grain Flour
Triticum turgidum L.Aldura2013D-A#1-WGF
2014D-A#2-WGF
Endural2013D-E#1-WGF
2014D-E#2-WGF
Triticum aestivum L.Cajeme2013S-C#1-WGF
2014S-C#2-WGF
Marius2013S-M#1-WGF
2014S-M#2-WGF
Bran
Triticum turgidum L.Aldura2013D-A#1-Bran
2014D-A#2- Bran
Endural2013D-E#1- Bran
2014D-E#2- Bran
Triticum aestivum L.Cajeme2013S-C#1- Bran
2014S-C#2- Bran
Marius2013S-M#1- Bran
2014S-M#2- Bran
Table 2. Extraction rates (%) of analysed white flours.
Sample CodeExtraction Rate (%)
Triticum turgidum L.D-A#1-WF63
D-A#2-WF58
D-E#1-WF63
D-E#2-WF59
Triticum aestivum L.S-C#1-WF68
S-C#2-WF70
S-M#1-WF67
S-M#2-WF69
Table 3. Ash (g/100 g, dry weight) and mineral content (mg/100 g, dry weight) in different bread and durum wheat flour (white flour and whole wheat flour) (mean ± SD).
Sample CodeAshFeCuMnZnMgCaNaK
White Flour
Triticum turgidum L.D-A#1-WF0.8 ± 0.0 b,A2.9 ± 0.2 e,Bnd0.1 ± 0.0 a,A2.2 ± 0.1 b,A69.0 ± 1.2 b,A5.8 ± 0.3 a,A15.8 ± 4.0 b,B107.6 ± 4.6 a,A
D-A#2-WF0.9 ± 0.0 b,A1.3 ± 0.0 b,A1.0 ± 0.1 cd0.3 ± 0.0 b,B4.1 ± 0.2 d,B197.9 ± 8.7 e,B19.6 ± 1.2 d,B3.5 ± 0.2 a,A168.8 ± 0.6 b,B
D-E#1-WF *---------
D-E#2-WF1.2 ± 0.1 c2.8 ± 0.1 de1.1 ± 0.0 d0.3 ± 0.0 b4.7 ± 0.2 e223.0 ± 4.9 f18.6 ± 0.4 d2.7 ± 0.1 a165.6 ± 7.2 b
Triticum aestivum L.S-C#1-WF1.2 ± 0.1 c,B2.5 ± 0.0 d,B0.5 ± 0.1 a,A0.6 ± 0.0 f,B2.7 ± 0.2 c,A70.6 ± 3.4 b,A12.0 ± 0.9 b,A43.6 ± 1.9 d,B122.6 ± 8.6 a,A
S-C#2-WF0.7 ± 0.0 a,A0.7 ± 0.1 a,A1.0 ± 0.0 c,B0.4 ± 0.0 e,A3.0 ± 0.0 c,A118.8 ± 0.3 d,B18.5 ± 1.0 d,B3.1 ± 0.4 a,A111.7 ± 10.9 a,A
S-M#1-WF0.9 ± 0.1 b,B2.1 ± 0.3 c,Bnd0.4 ± 0.0 d,B1.6 ± 0.1 a,A50.1 ± 2.7 a,A10.6 ± 0.4 b,A21.4 ± 0.2 c,B125.1 ± 14.0 a,A
S-M#2-WF0.6 ± 0.0 a,A0.8 ± 0.1 a,A0.9 ± 0.0 b0.3 ± 0.0 c,A2.8 ± 0.1 c,B108.8 ± 3.0 c,B15.2 ± 0.2 c,B2.4 ± 0.1 a,A109.9 ± 5.9 a,A
Whole Grain Flour
Triticum turgidum L.D-A#1-WGF1.5 ± 0.1 ab,A4.5 ± 0.0 c,B2.4 ± 0.1 g,B1.5 ± 0.0 a,A5.6 ± 0.1 b,A138.0 ± 3.5 b,A6.1 ± 0.2 a,A47.8 ± 1.6 d,B408.1 ± 10.0 e,B
D-A#2-WGF1.9 ± 0.2 c,B2.8 ± 0.0 b,A1.6 ± 0.1 de,A2.3 ± 0.2 b,B7.8 ± 0.1 e,B318.9 ± 1.4 d,B25.5 ± 0.6 e,B3.8 ± 0.0 a,A342.9 ± 6.4 bc,A
D-E#1-WGF1.4 ± 0.0 a,A4.6 ± 0.1 c,A0.6 ± 0.0 a,A1.2 ± 0.0 a,A6.6 ± 0.0 c,A163.0 ± 3.6 c,A5.4 ± 0.2 a,A43.9 ± 3.1 d,B408.9 ± 3.9 e,B
D-E#2-WGF2.2 ± 0.0 d,B6.6 ± 0.0 e,B1.3 ± 0.1 bc,B2.7 ± 0.1 c,B8.0 ± 0.0 e,B344.2 ± 2.4 e,B29.7 ± 1.9 f,B3.4 ± 0.1 a,B332.6 ± 11.7 ab,A
Triticum aestivum L.S-C#1-WGF1.9 ± 0.0 c,B5.7 ± 0.2 d,B1.9 ± 0.2 f,B3.2 ± 0.0 d,B5.8 ± 0.1 b,A114.5 ± 2.7 a,A14.3 ± 0.2 c,A24.3 ± 1.9 b,B383.5 ± 2.6 de,B
S-C#2-WGF1.6 ± 0.0 b,A4.2 ± 0.5 c,A1.4 ± 0.0 cd,A2.4 ± 0.2 b,A9.5 ± 0.3 f,B315.7 ± 1.5 d,B23.8 ± 0.3 de,B3.7 ± 0.2 a,A304.2 ± 2.6 a,A
S-M#1-WGF1.9 ± 0.1 c,A2.2 ± 0.1 a,A1.9 ± 0.3 ef,B2.9 ± 0.1 c,B4.6 ± 0.1 a,A112.0 ± 3.7 a,A12.2 ± 0.9 b,A36.3 ± 3.0 c,B553.5 ± 31.6 f,B
S-M#2-WGF2.1 ± 0.0 d,B2.7 ± 0.3 b,B1.0 ± 0.0 b,A2.4 ± 0.0 b,A7.3 ± 0.2 d,B385.1 ± 2.4 f,B22.1 ± 0.2 d,B3.9 ± 0.1 a,A368.1 ± 21.2 cd,A
In each column, different letters mean statistically significant differences (p < 0.05) compared by Tukey test; small superscript letter means differences between all white or whole grain analysed flours, whereas capital superscript letter means difference due to the harvesting year for the same wheat variety. nd (non-detected). * Due to the sample D-E#1-WF was no available, results corresponding to sample D-E#1-WF are not shown.
Table 4. Ash (g/100 g, dry weight) and mineral content (mg/100 g, dry weight) in different bread and durum wheat bran.
Bread and Durum Wheat Bran
Sample Code AshFeCuMnZnMgCaNaK
Triticum turgidum L.D-A#1-BranMean2.87.16.43.811.3255.66.547.7919.8
Range2.6–3.06.9–7.36.1–6.73.7–3.911.0–11.6246.3–264.95.9–7.143.0–52.4898.9–940.7
D-A#2- BranMean3.54.82.55.212.8486.033.3.6583.3
Range3.2–3.84.7–4.92.3–2.74.8–5.612.4–13.2475.7–496.332.0–35.23.2–4.0569.0–597.6
D-E#2- BranMean3.712.11.66.212.6518.843.16.3 572.9
Range3.6–3.912.0–12.21.5–1.75.9–6.512.2–13.0508.0–529.641.6–44.65.7–6.9529.6–529.6
Triticum aestivum L.S-C#1- BranMean3.412.64.98.812.2207.920.360.6937.9
Range3.3–3.512.0–13.24.4–5.48.7–8.911.9–12.5206.7–209.118.5–22.154.2–67.0911.6–964.2
S-C#2- BranMean3.912.82.36.824.4775.235.75.7753.4
Range3.8–4.011.8–13.82.2–2.46.2–7.423.3–25.5769.6–780.832.5–38.95.0–6.4715.4–791.4
S-M#1- BranMean3.82.35.38.110.6237.816.665.81371.5
Range3.6–4.02.2–2.44.9–5.77.8–8.410.4–10.8231.5–244.115.5–17.759.7–71.91326.2–1416.8
S-M#2- BranMean5.56.51.37.017.21000.137.45.4920.0
Range5.4–5.65.7–7.31.2–1.46.9–7.116.2–18.2986.7–1.013.536.3–38.55.0–5.8880.9–959.1
Table 5. Potential Health Claims related to mineral content found to analysed samples (according to Regulation (EU) No 432/2012 and Regulation (EC) No 1924/2006) [37,38].
MineralApproved Health ClaimsConditions of Use of the ClaimsSamples Which Met the Conditions of Use of the Claims
Iron“Iron contributes to normal cognitive function, normal energy-yielding metabolism, normal formation of red blood cells and haemoglobin, normal oxygen transport in the body, normal function of the immune system and to the reduction of tiredness and fatigue.”The claim may be used only for food which is at least a source of iron (at least 2.1 mg of iron per 100 g of food, fw) according to Regulation (EC) No 1924/2006 [38] and Regulation (EU) No 1169/2011 [39]. White flours: samples D-A#1-WF, D-E#2-WF, and S-C#1-WF.
“Iron has a role in the process of cell division.”Whole grain flours: all analysed samples (with the exception of sample S-M#1-WGF).
Bran fractions: all analysed samples.
Copper“Copper contributes to maintenance of normal connective tissues.”The claim may be used only for food which is at least a source of copper (at least 0.15 mg of copper per 100 g of food, fw) according to Regulation (EC) No 1924/2006 [38] and Regulation (EU) No 1169/2011 [39].White flours: all analysed samples (with the exception of D-A#1-WF and S-M#1-WF).
“Copper contributes to normal energy-yielding metabolism, normal functioning of the nervous system, normal hair pigmentation, normal iron transport in the body, normal skin pigmentation, normal functioning of the immune system.”Whole grain flours: all analysed samples.
“Copper contributes to the protection of cells from oxidative stress.”Bran fractions: all analysed samples.
Manganese“Manganese contributes to normal energy-yielding metabolism and normal formation of connective tissue.”The claim may be used only for food which is at least a source of manganese (at least 0.3 mg of manganese per 100 g of food, fw) according to Regulation (EC) No 1924/2006 [38] and Regulation (EU) No 1169/2011 [39].White flours: samples S-C#1-WF, S-C#2-WF, and S-M#1-WF.
“Manganese contributes to the maintenance of normal bones.”Whole grain flours: all analysed samples.
“Manganese contributes to the protection of cells from oxidative stress.”Bran fractions: all analysed samples.
Zinc“Zinc contributes to normal acid-base metabolism, normal metabolism of carbohydrate, macronutrients, fatty acids, and vitamin A.”The claim may be used only for food which is at least a source of zinc (at least 1.5 mg of zinc per 100 g of food, fw) according to Regulation (EC) No 1924/2006 [38] and Regulation (EU) No 1169/2011 [39].White flours: all analysed samples (with the exception of S-M#1-WF).
“Zinc contributes to normal DNA synthesis, normal protein synthesis, normal fertility, and reproduction and normal cognitive function.”
“Zinc contributes to the maintenance of normal bones, hair, nails, and skin.”Whole grain flours: all analysed samples.
“Zinc contributes to the maintenance of normal testosterone levels in the blood and to the maintenance of normal vision.”
“Zinc contributes to the normal function of the immune system and to the protection of cells from oxidative stress.”Bran fractions: all analysed samples.
“Zinc has a role in the process of cell division.”
Magnesium“Magnesium contributes to a reduction of tiredness and fatigue, electrolyte balance, normal energy-yielding metabolism, normal functioning of the nervous system, normal muscle function, normal protein synthesis, normal psychological function.” The claim may be used only for food which is at least a source of magnesium (at least 56.25 mg of magnesium per 100 g of food, fw) according to Regulation (EC) No 1924/2006 [38] and Regulation (EU) No 1169/2011 [39].White flours: all analysed samples (with the exception of S-M#1-WF).
“Magnesium contributes to the maintenance of normal bones and teeth.”Whole grain flours: all analysed samples.
“Magnesium has a role in the process of cell division.”Bran fractions: all analysed samples.
Potassium“Potassium contributes to normal functioning of the nervous system and normal muscle function.”The claim may be used only for food which is at least a source of potassium (at least 300 mg of potassium per 100 g of food, fw) according to Regulation (EC) No 1924/2006 [38] and Regulation (EU) No 1169/2011 [39].Whole grain flours: all analysed samples (with the exception of S-C#2-WGF).
“Potassium contributes to the maintenance of normal blood pressure.”Bran fractions: all analysed samples.
Publisher’s Note: MDPI stays neutral with regard to jurisdictional claims in published maps and institutional affiliations.

