Article

Estimating Farm Wheat Yields from NDVI and Meteorological Data

1
Vlaamse Instelling voor Technologisch Onderzoek NV, 2400 Mol, Belgium
2
Department of Earth and Environmental Sciences, Faculty of BioScience Engineering, University of Leuven, 3001 Leuven, Belgium
*
Author to whom correspondence should be addressed.
Agronomy 2021, 11(5), 946; https://doi.org/10.3390/agronomy11050946
Submission received: 29 March 2021 / Revised: 22 April 2021 / Accepted: 8 May 2021 / Published: 11 May 2021
(This article belongs to the Special Issue Remote Sensing in Agriculture)

Abstract

:
Information on crop yield at scales ranging from the field to the global level is imperative for farmers and decision makers. The current data sources to monitor crop yield, such as regional agriculture statistics, are often lacking in spatial and temporal resolution. Remotely sensed vegetation indices (VIs) such as NDVI are able to assess crop yield using empirical modelling strategies. Empirical NDVI-based crop yield models were evaluated by comparing the model performance with similar models used in different regions. The integral NDVI and the peak NDVI were weak predictors of winter wheat yield in northern Belgium. Winter wheat (Triticum aestivum) yield variability was better predicted by monthly precipitation during tillering and anthesis than by NDVI-derived yield proxies in the period from 2016 to 2018 (R2 = 0.66). The NDVI series were not sensitive enough to yield affecting weather conditions during important phenological stages such as tillering and anthesis and were weak predictors in empirical crop yield models. In conclusion, winter wheat yield modelling using NDVI-derived yield proxies as predictor variables is dependent on the environment.

1. Introduction

The availability of reliable crop yield data at scales ranging from the field level to the global level is imperative. In the first place, farmers need reliable crop yield estimates. Knowledge of crop yield at the field level helps farmers to monitor yield effects of certain management choices, identify potential threats (e.g., consequences of increasing drought occurrence during the growing season) and enhance potential opportunities [1]. In addition, for insurance purposes, knowledge of average yield and yield variability is essential [1]. In the second place, crop yield data are needed for decision making and strategic planning [2,3]. For example, to identify regions appropriate for setting up a specific agricultural development program, regional crop yield data are indispensable for policy and decision makers.
Currently, crop yield statistics are the main source of crop yield data [4]. However, the spatial and temporal scale of these crop yield statistics are not adequate, since these data are typically only available at regional or country levels and are assessed yearly [5]. In order to evaluate the effect of local environmental conditions on crop yield, crop yield data at higher resolution than regional or country levels are needed.
Crop yield data derived from remote-sensed vegetation indices (VIs) could offer crop yield data at a higher spatial and temporal resolution. The spatial resolution of VIs can be as high as a few meters, and some VIs are available at a daily scale [4]. VIs monitor particular properties of crops that can be related to final crop yield. A VI that is often used to monitor crop yield is the normalized difference vegetation index (NDVI), an indicator of the photosynthetic active biomass [6]. Several studies have shown that information on the photosynthetic active biomass (i.e., NDVI) during the growing season or at particular stages of the crop growing season is related to crop yield [4,6,7,8].
Monitoring crop yield from space using VIs sounds promising, and several studies have already shown the potential of VI-derived crop yield estimates [2,4,5,6,9,10,11,12]. Empirical or mechanistic modeling strategies are used to derive crop yield from VIs [13]. Mechanistic crop yield models are more data intensive compared to empirical crop yield models. Mechanistic models require crop growth parameters such as VIs, soil properties, and management information to calibrate plant growth models used to derive crop yield. Empirical crop yield models are less data intensive, since they relate VIs to crop yield using statistical techniques such as simple linear regressions or random forests. The methodology to calculate NDVI-derived yield predictors used in empirical crop yield models varies from study to study. For example, NDVI-derived yield predictors used in empirical crop yield models range from the peak NDVI during the growing season to time-integrated NDVI values during the growing season and growing-degree-integrated NDVI values [3,4,6,14]. This raises the issue of environmental dependency in terms of the methodology used to determine VI-derived yield predictors in empirical crop models.
The aim of this paper is to evaluate the integral NDVI, peak NDVI, monthly precipitation, and monthly temperature for setting up an empirical winter wheat (Triticum aestivum) yield model for northern Belgium. Winter wheat is an important crop in northern Belgium. In 2018, winter wheat accounted for 60,909 ha, making it the third most cultivated crop in northern Belgium [15]. Winter wheat yield in northern Belgium was on average 7.1 Mg/ha between 2016 and 2018. The empirical model results were compared to similar models used in different regions to evaluate environment dependency of NDVI-based empirical winter wheat yield models. The importance of the predictor variables in the winter wheat yield empirical model was used to provide insight into which variables impact winter wheat yield changes in northern Belgium.

2. Materials and Methods
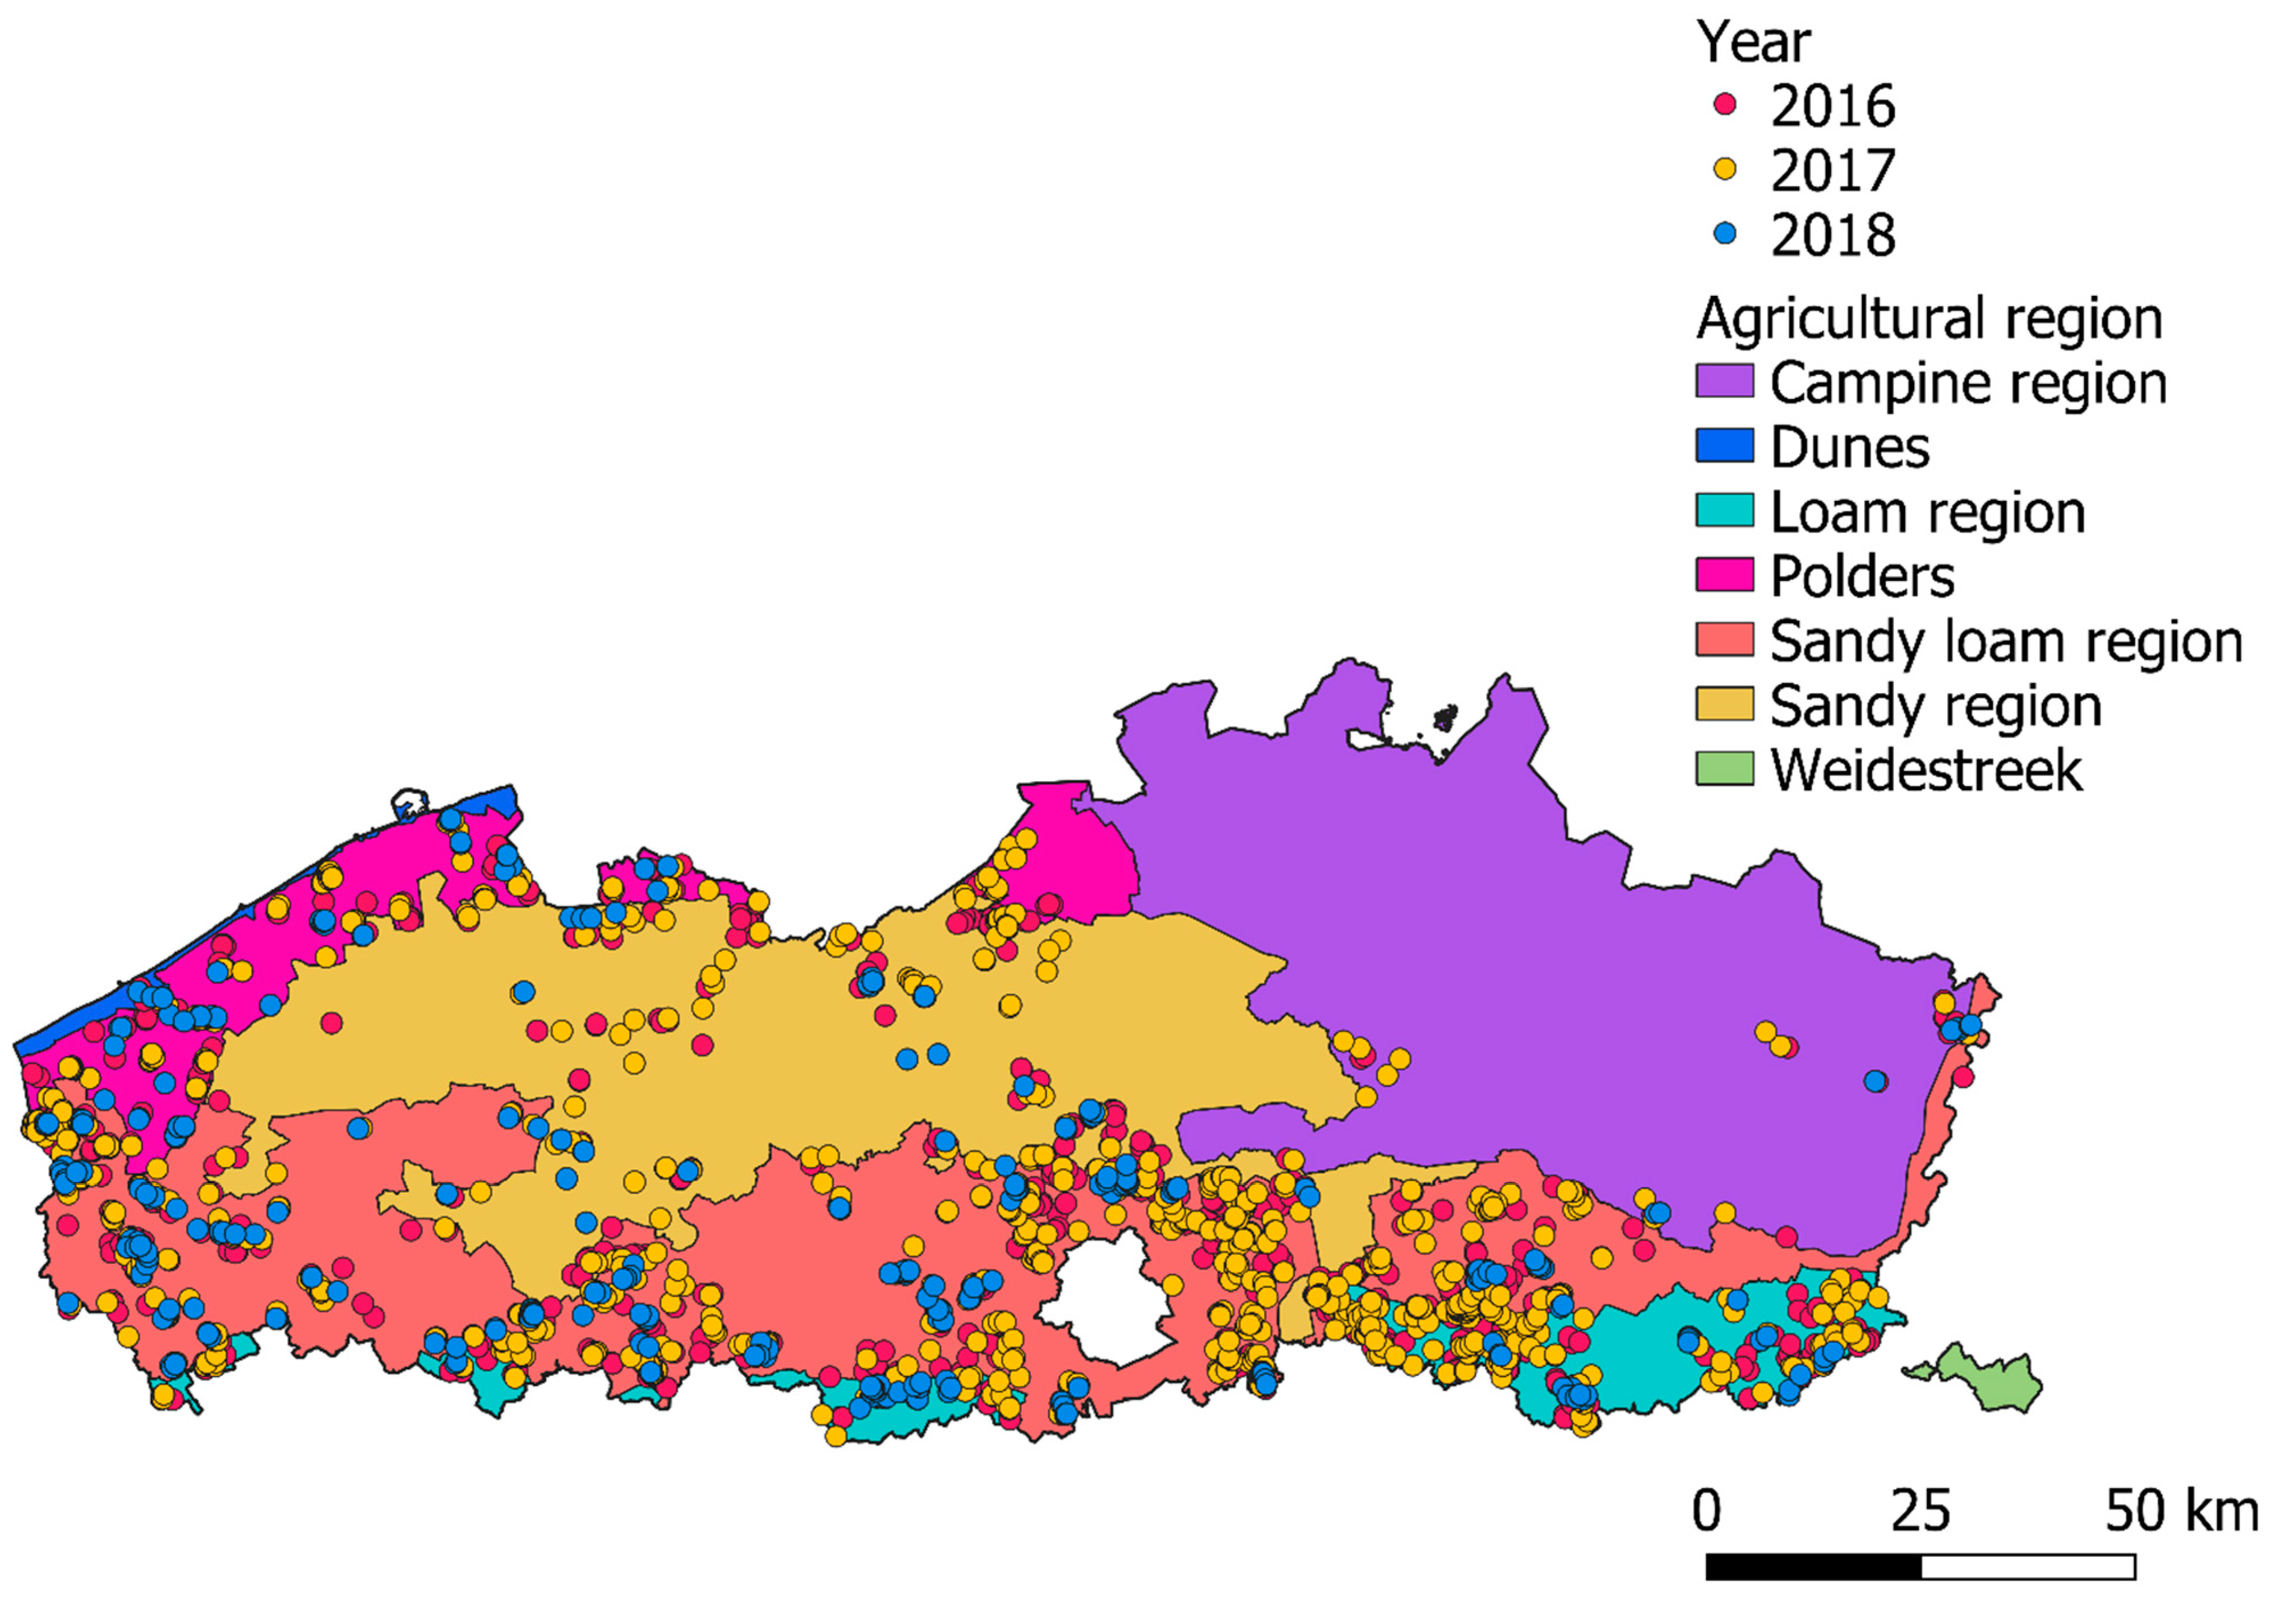
2.1. Study Area

Information on the location, shape and yield of 1485 winter wheat fields was available through the land use parcel database from the Department of Agriculture and Fisheries (Figure 1). Yearly winter wheat yield data at the farm level was available for 2016, 2017 and 2018. This information was used to determine the yield at field level. A parcel area threshold of 0.01 km2 was set to ensure that the extracted NDVI profiles for each field were pure. The total number of winter wheat fields was equal to 666 in 2016, 609 in 2017 and 210 in 2018.

2.2. Remote Sensing Data: NDVI

A 10 m inwards buffer was applied to each field to ensure that the extracted NDVI series represented the fields. The platform https://openeo.org/ (accessed on 27 January 2021) was used to extract 5 daily Sentinel-2 NDVI pixels (10 m resolution) within each buffered winter wheat field, apply a cloud mask based on the scene classification layer from Sentinel-2 and compute the average NDVI series for each field from the extracted NDVI pixels [16]. The obtained results were cloud-free NDVI series for each winter wheat field.
The NDVI series were used to calculate the integral NDVI (hereafter referred to as aNDVI) and the peak NDVI (hereafter referred to as maxNDVI) for each field. NDVI values were considered from 1 January until harvest on 12 July for the calculation of aNDVI and maxNDVI. The aNDVI was calculated using the trapezoidal rule, following [4]. For the calculation of aNDVI and maxNDVI, NDVI values below 0.2 were discarded, following [4,6]. In addition, only NDVI series that had at least 10 NDVI observations were retained for the calculation of aNDVI and maxNDVI. A total of 543 of the initial number of wheat fields (36%) were discarded because their NDVI series had less than 10 observations. aNDVI and maxNDVI were calculated for 942 winter wheat fields.

2.3. Data Analysis

Two separate random forest models were built to predict winter wheat yield based on the NDVI yield predictors aNDVI and maxNDVI. The first model used aNDVI as a predictor variable (henceforth, Model 1) and the second model used maxNDVI as a predictor variable to predict winter wheat yield in northern Belgium (henceforth, Model 2). These two models were used to evaluate (i) which NDVI-derived yield predictor (i.e., aNDVI or maxNDVI) better predicts winter wheat yield in northern Belgium and (ii) the environmental dependency of NDVI-derived yield proxies. The latter was done by comparing the model performances to the model performance of the winter wheat yield model for Latvia published by [4], which used the same methodology to model winter wheat yield. In a second stage, a random forest winter wheat yield model with weather variables at field level, aNDVI and maxNDVI as predictor variables was built. Monthly precipitation values and maximum temperature values during the winter wheat growing season from January to July were used in this model (henceforth referred to as Model 3). Monthly minimum temperature values were not included in Model 3 to avoid collinearity. Variable importance was calculated for each predictor variable of Model 3, which allowed for the evaluation of the yield predictiveness of weather variables in comparison to the NDVI-derived yield predictors (i.e., aNDVI and maxNDVI). The random forest models were built based on 500 trees. The out of bag prediction error (MSE) and the explained variance (R2) computed on the out of bag data were used to evaluate model performance of the random forests. The R package ranger was used to build the random forests regression models [17]. This package applies Breiman’s random forest algorithm. Variable importance was evaluated by the permutation accuracy importance. This variable importance measure has been shown to be less biased than variable importance measures based on the Gini (for classification forests) or variance of the response (for regression forests) indices [18]. Significance of the permutation accuracy importance was evaluated by applying the methodology of [19], which applies a permutation test of the computed variable importance.

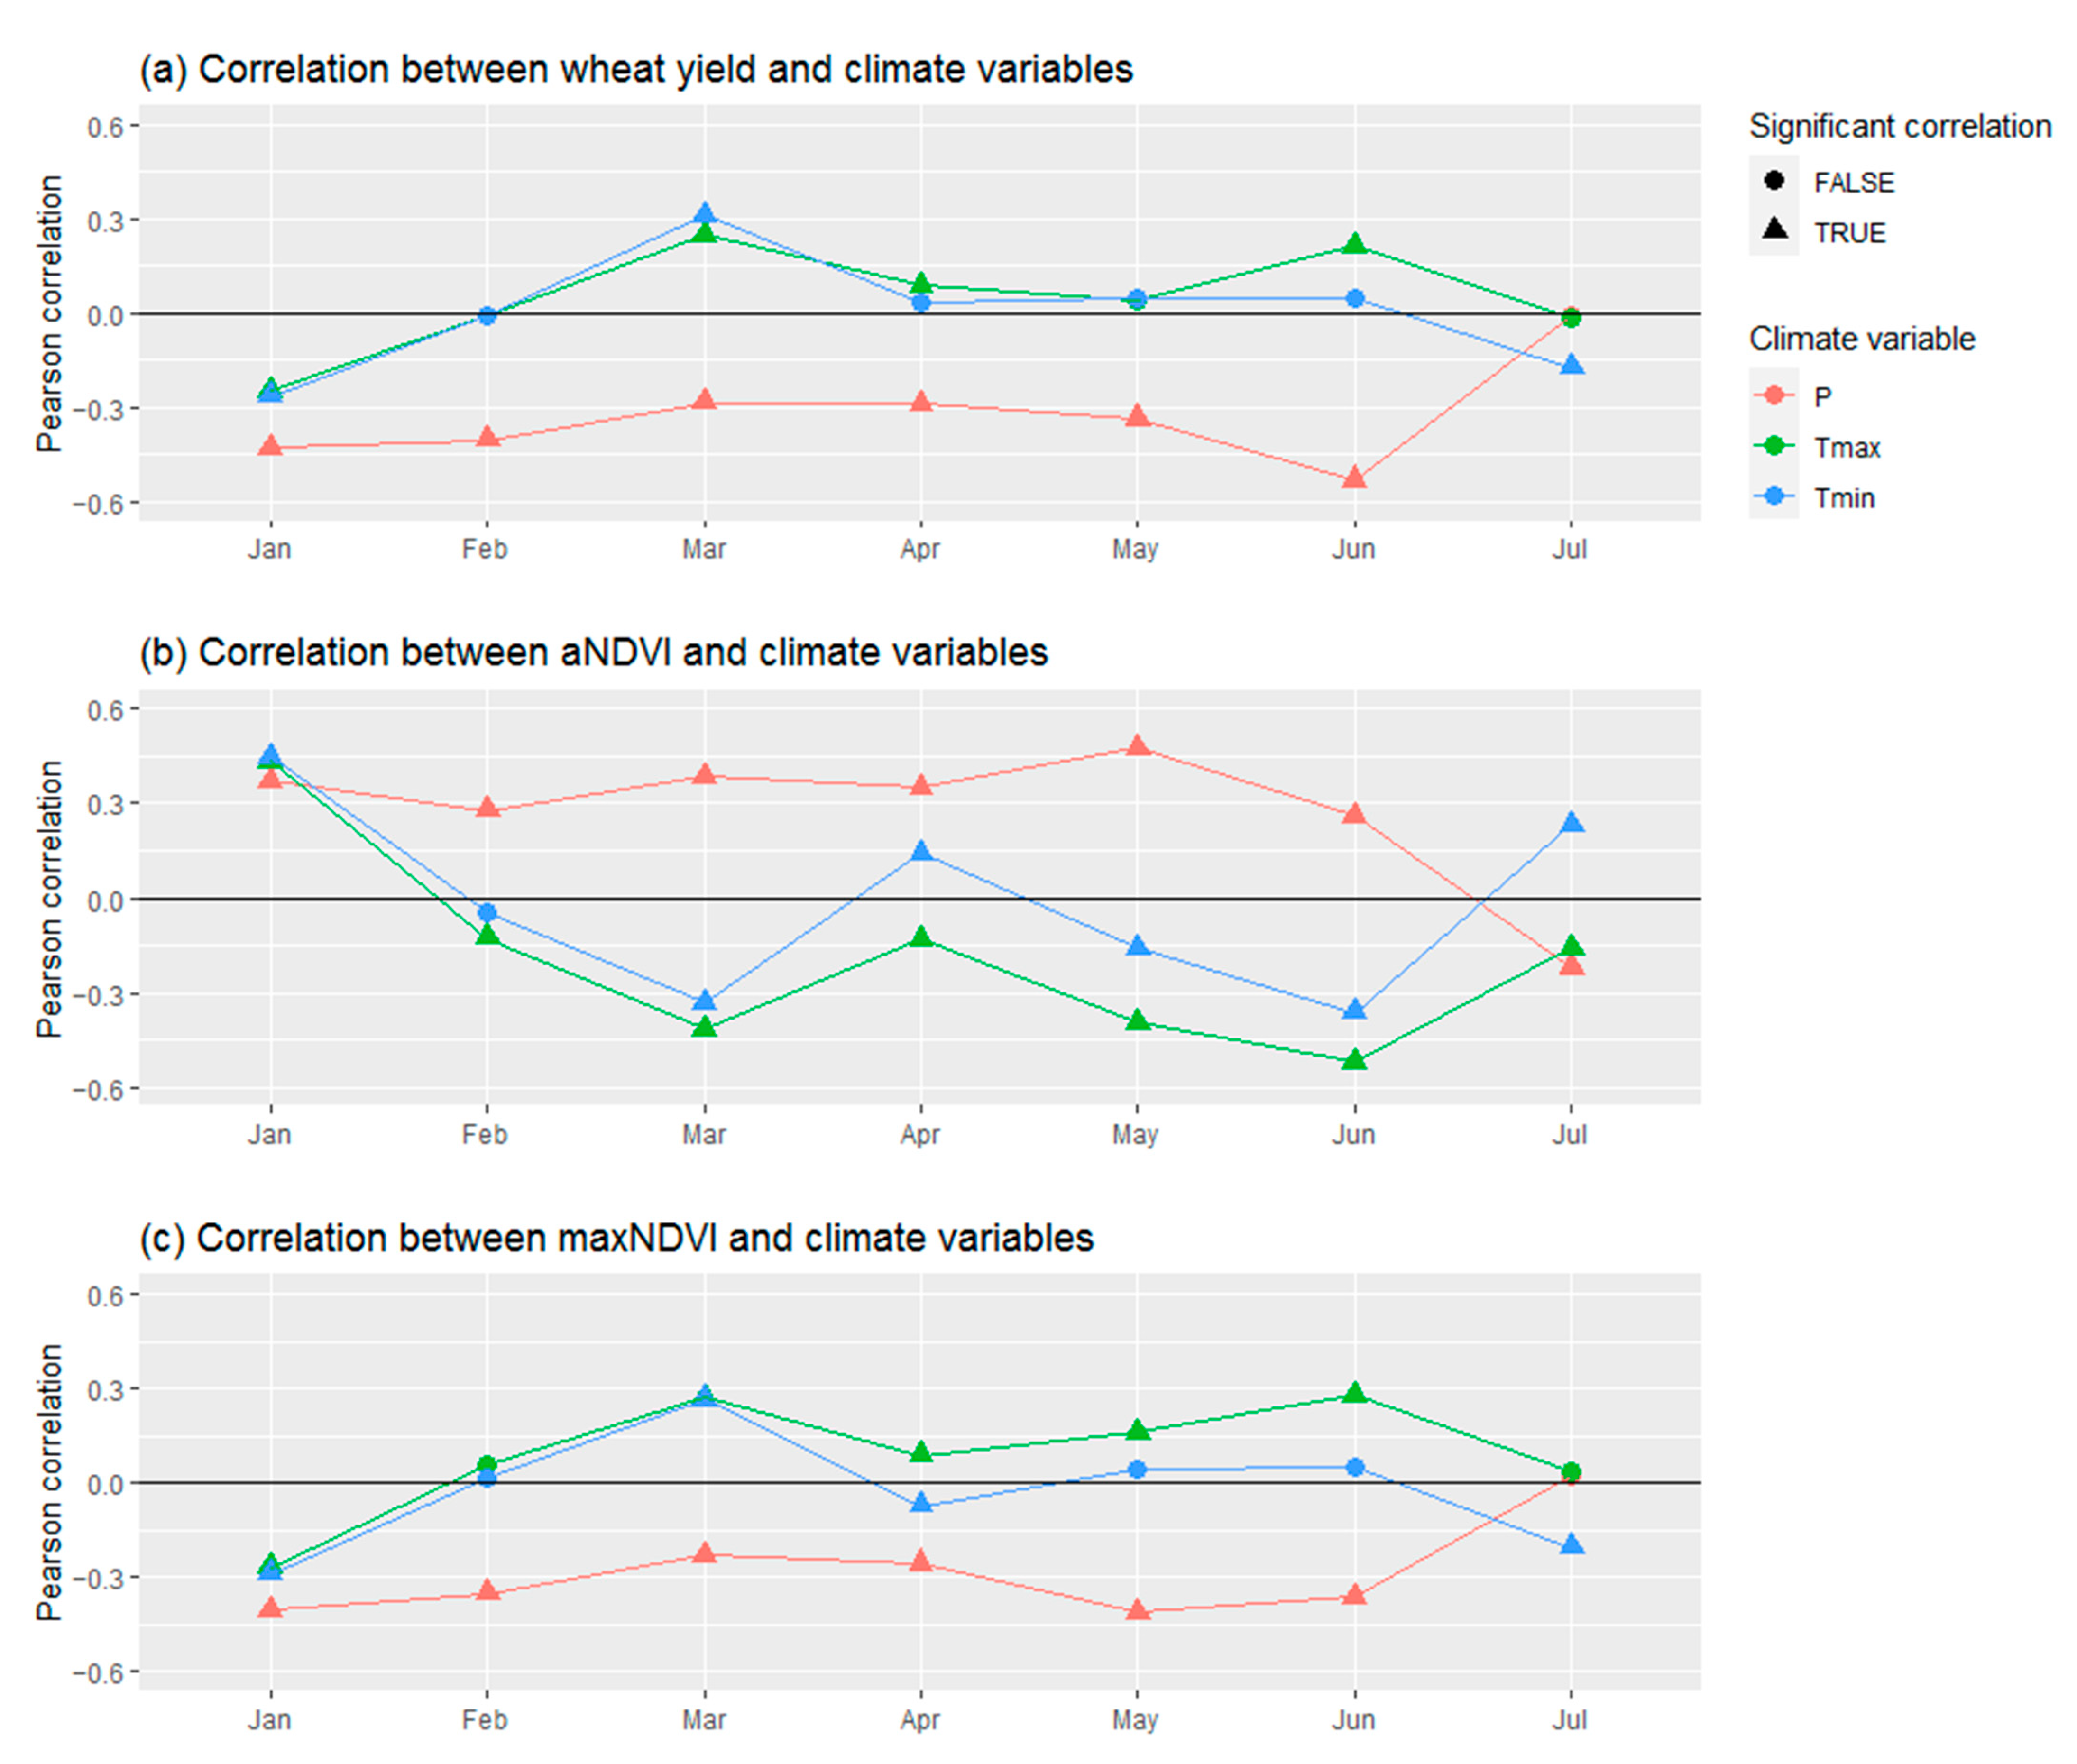
2.4. Effect of Weather on Wheat Yield

For each field, monthly minimum temperature, maximum temperature and precipitation (Tmin, Tmax and P) were extracted from a 5 km resolution grid for the years 2016–2018, as provided by the Royal Meteorological Institute [20]. The Pearson correlation between winter wheat yield and the monthly weather variables was calculated for the growing season from January to July. The change in Pearson correlation throughout the wheat yield growing season was used to identify the months and weather variables that influenced wheat yield the most. In addition, the Pearson correlation between the NDVI-derived yield proxies (i.e., aNDVI and maxNDVI) and the monthly weather variables for the winter wheat growing season from January to July were calculated. The correlation patterns between winter wheat yield and weather variables, aNDVI and weather variables, and maxNDVI and monthly weather variables were compared in order to evaluate if aNDVI and maxNDVI capture the winter wheat yield weather sensitivity.

3. Results

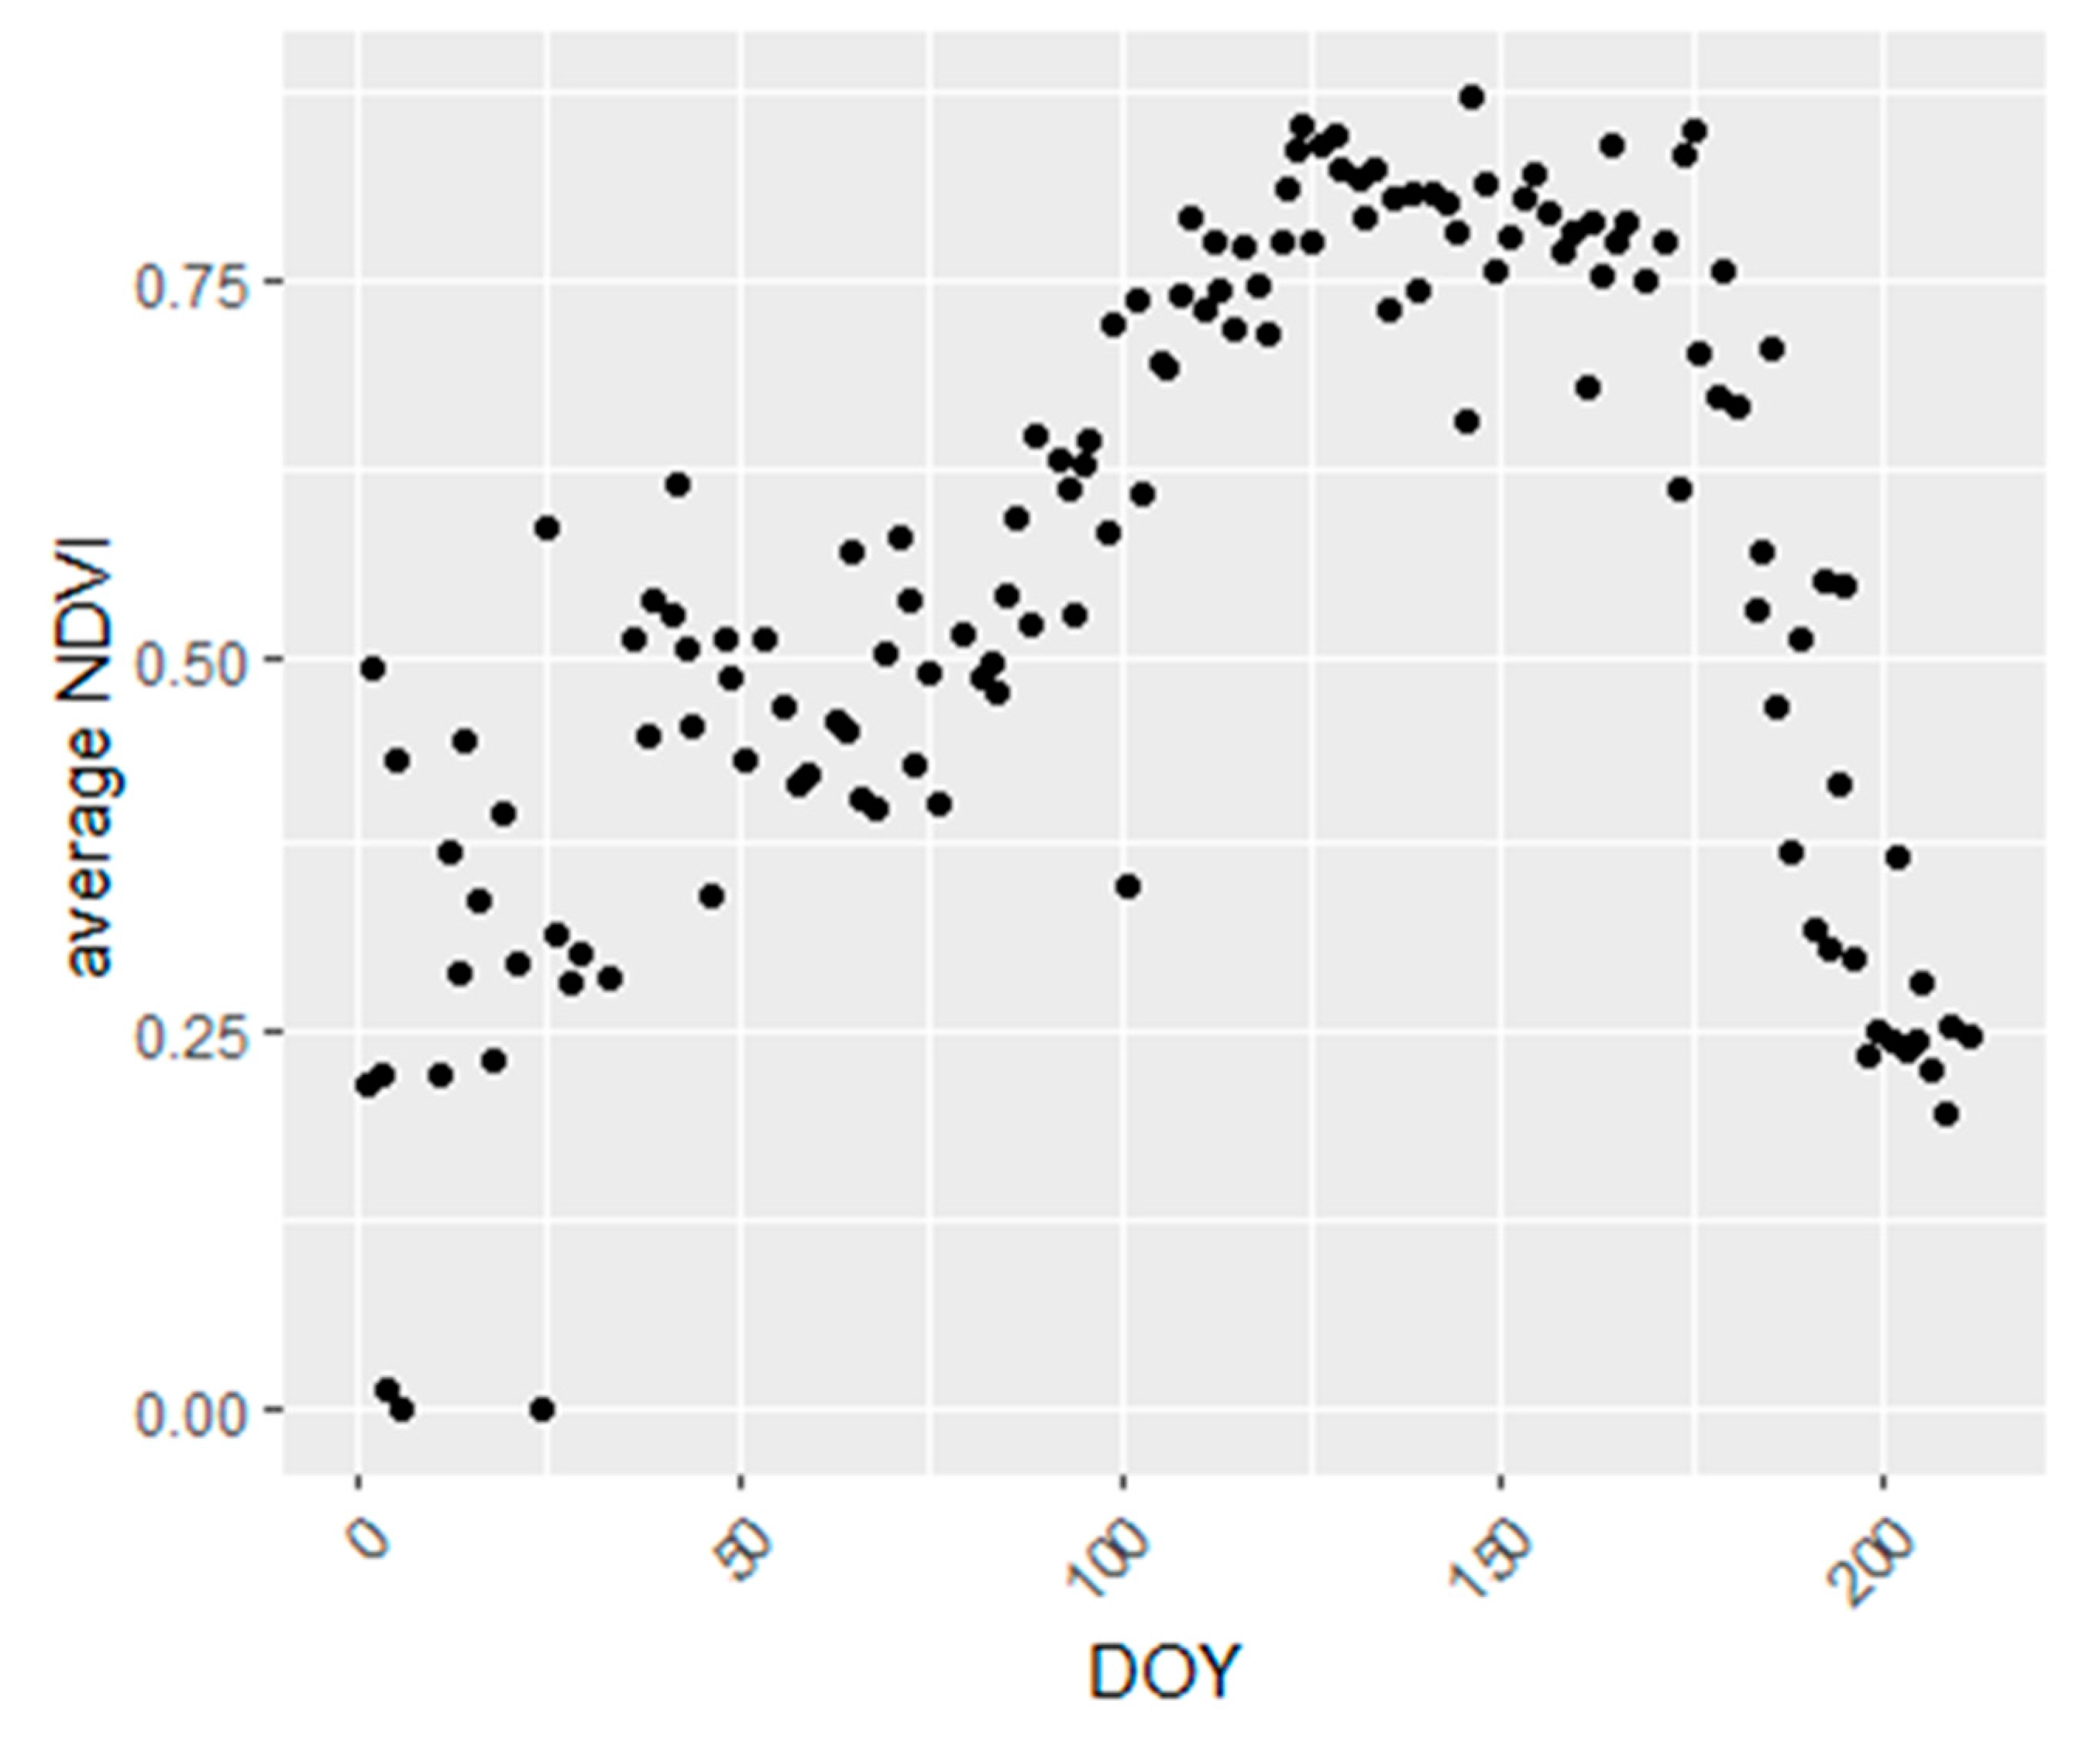
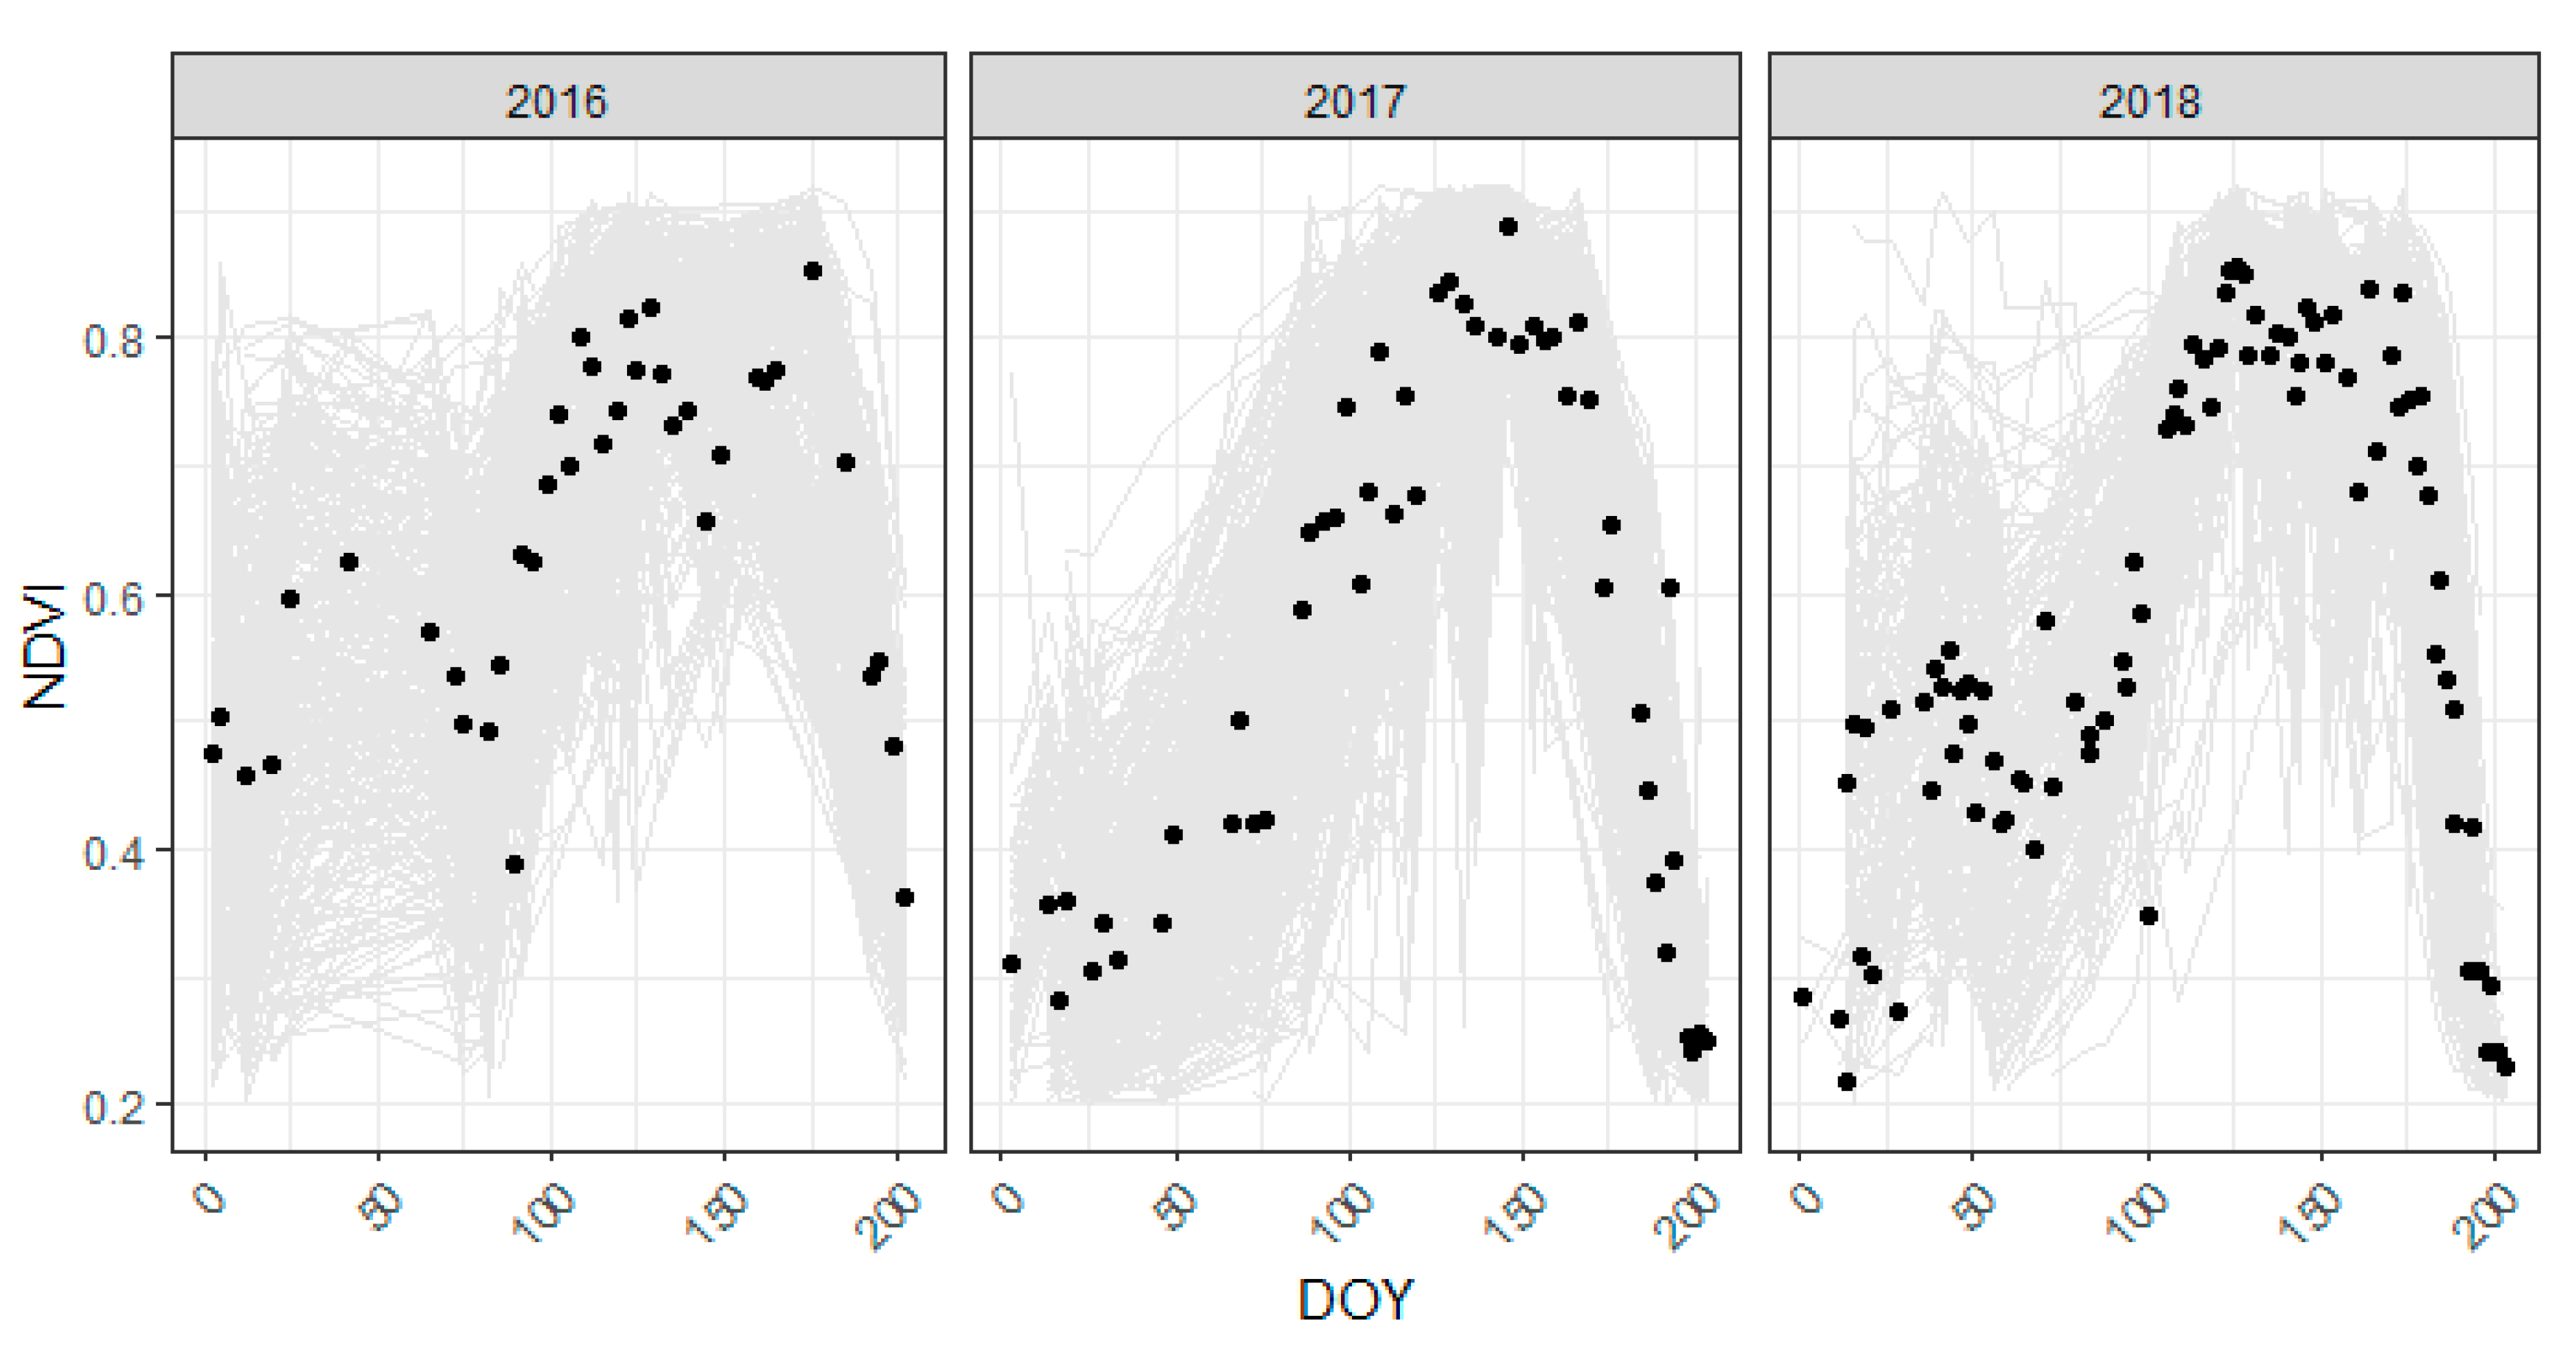
3.1. NDVI Series of Winter Wheat in Northern Belgium

The average NDVI series of the winter wheat fields for the years 2016 to 2018 in northern Belgium is presented in Figure 2. The average NDVI for the years 2016 to 2018 peaked around the end of May (DOY (day of year) 151) and dropped around the end of July (DOY 212).

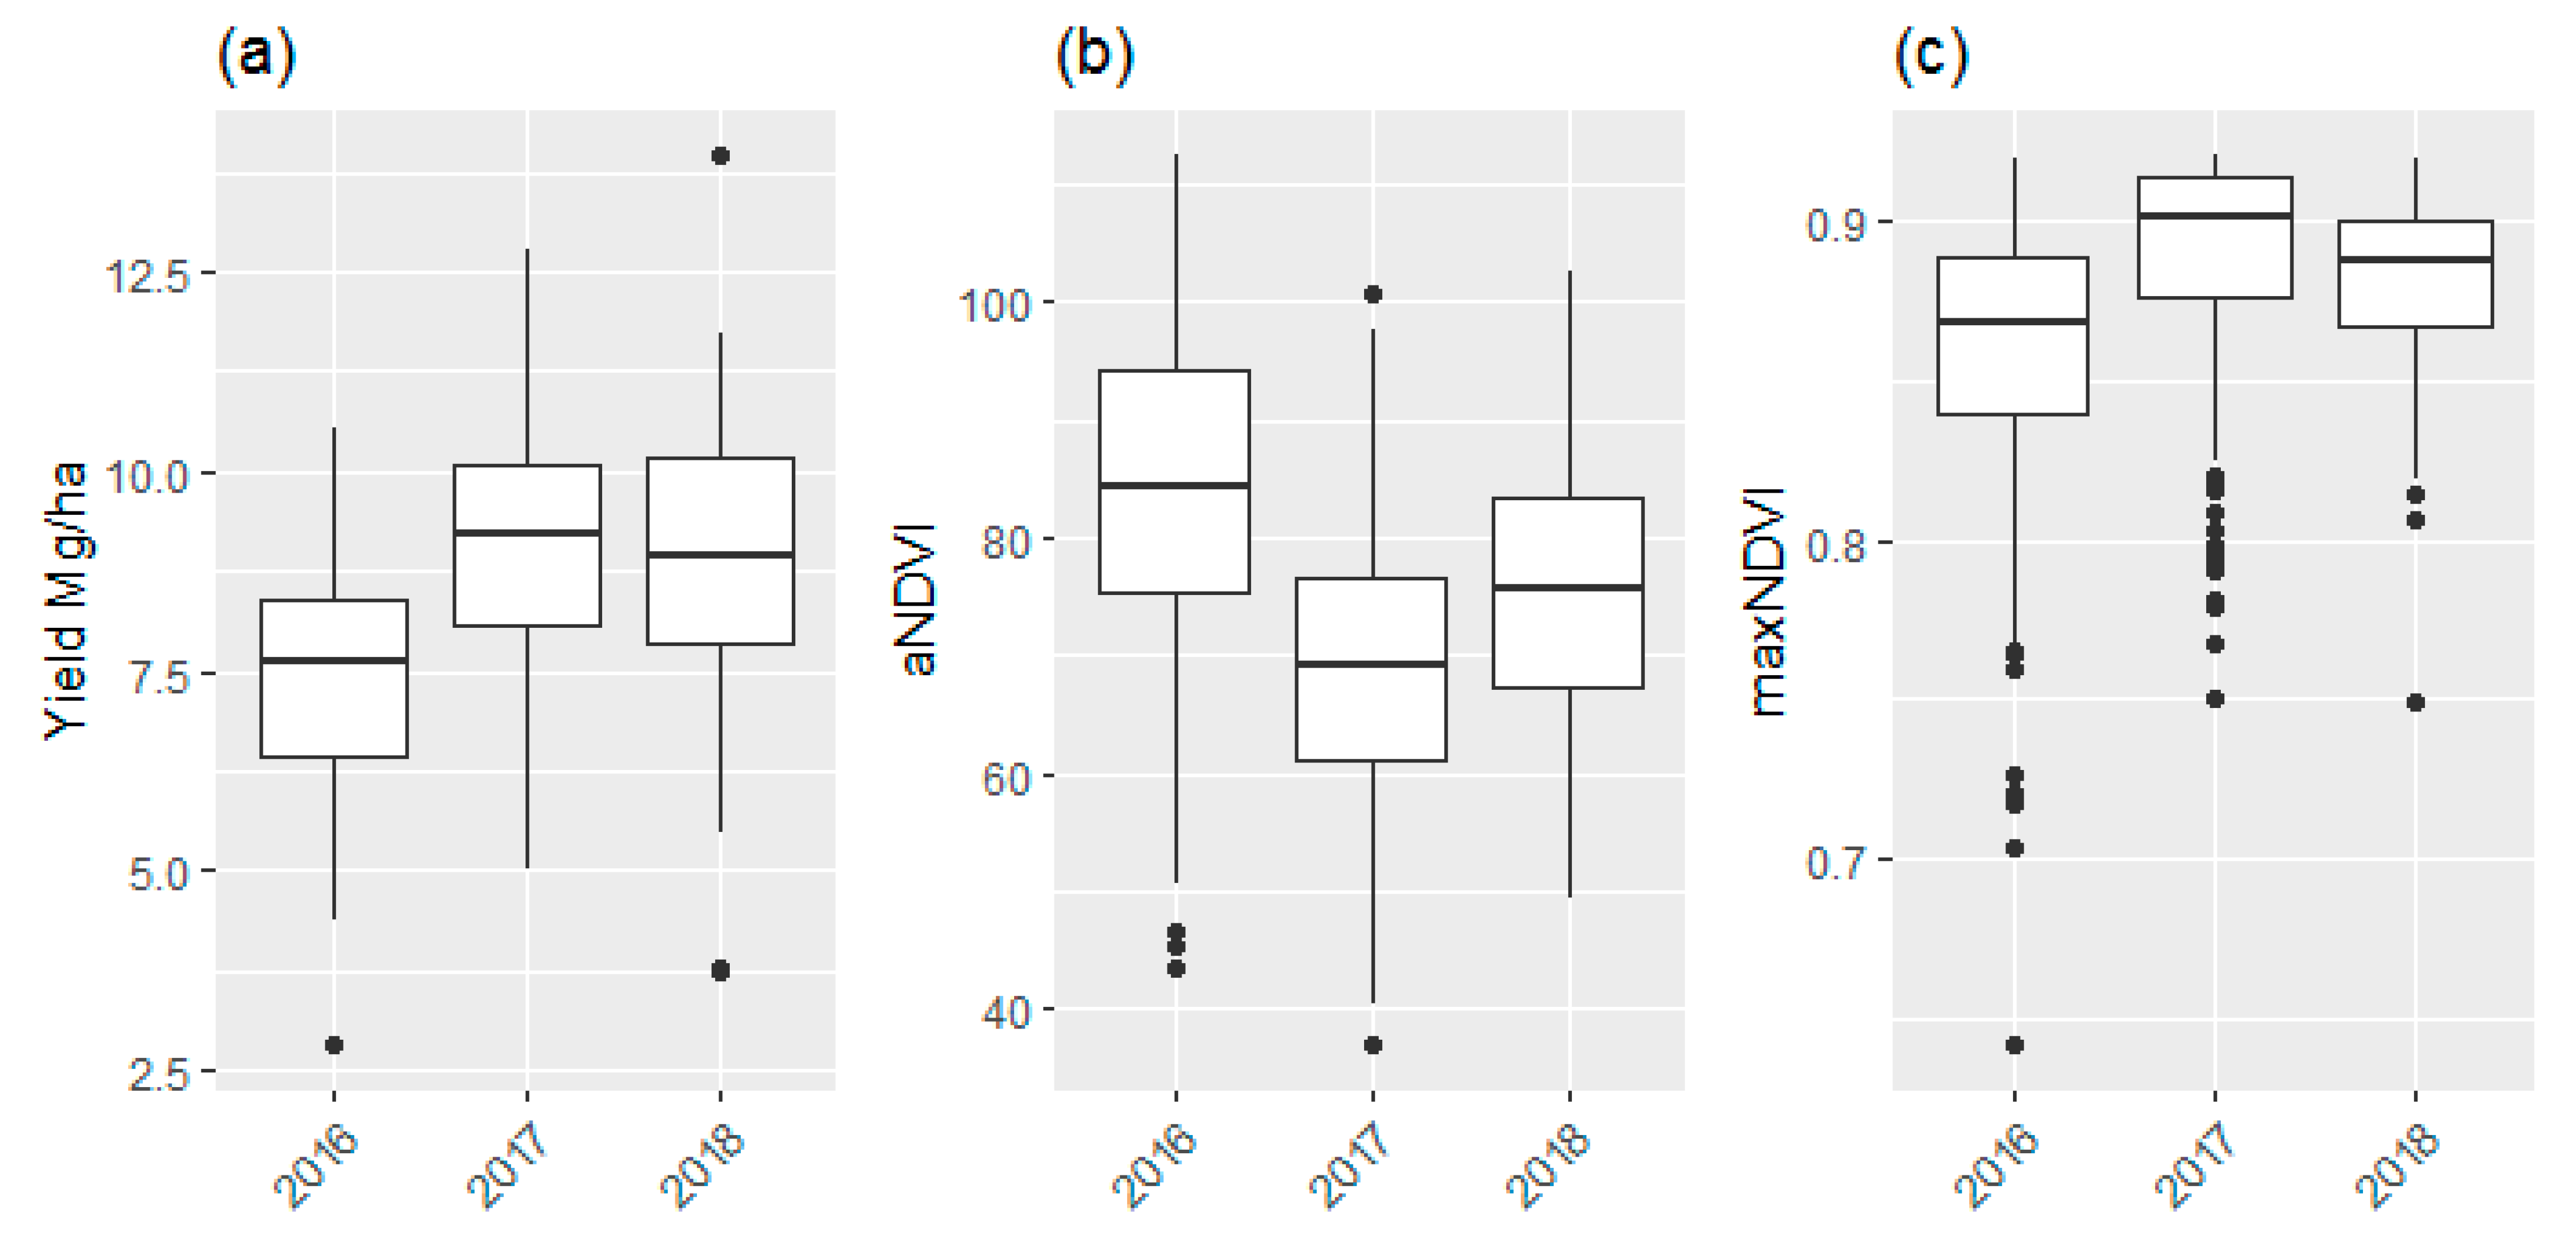
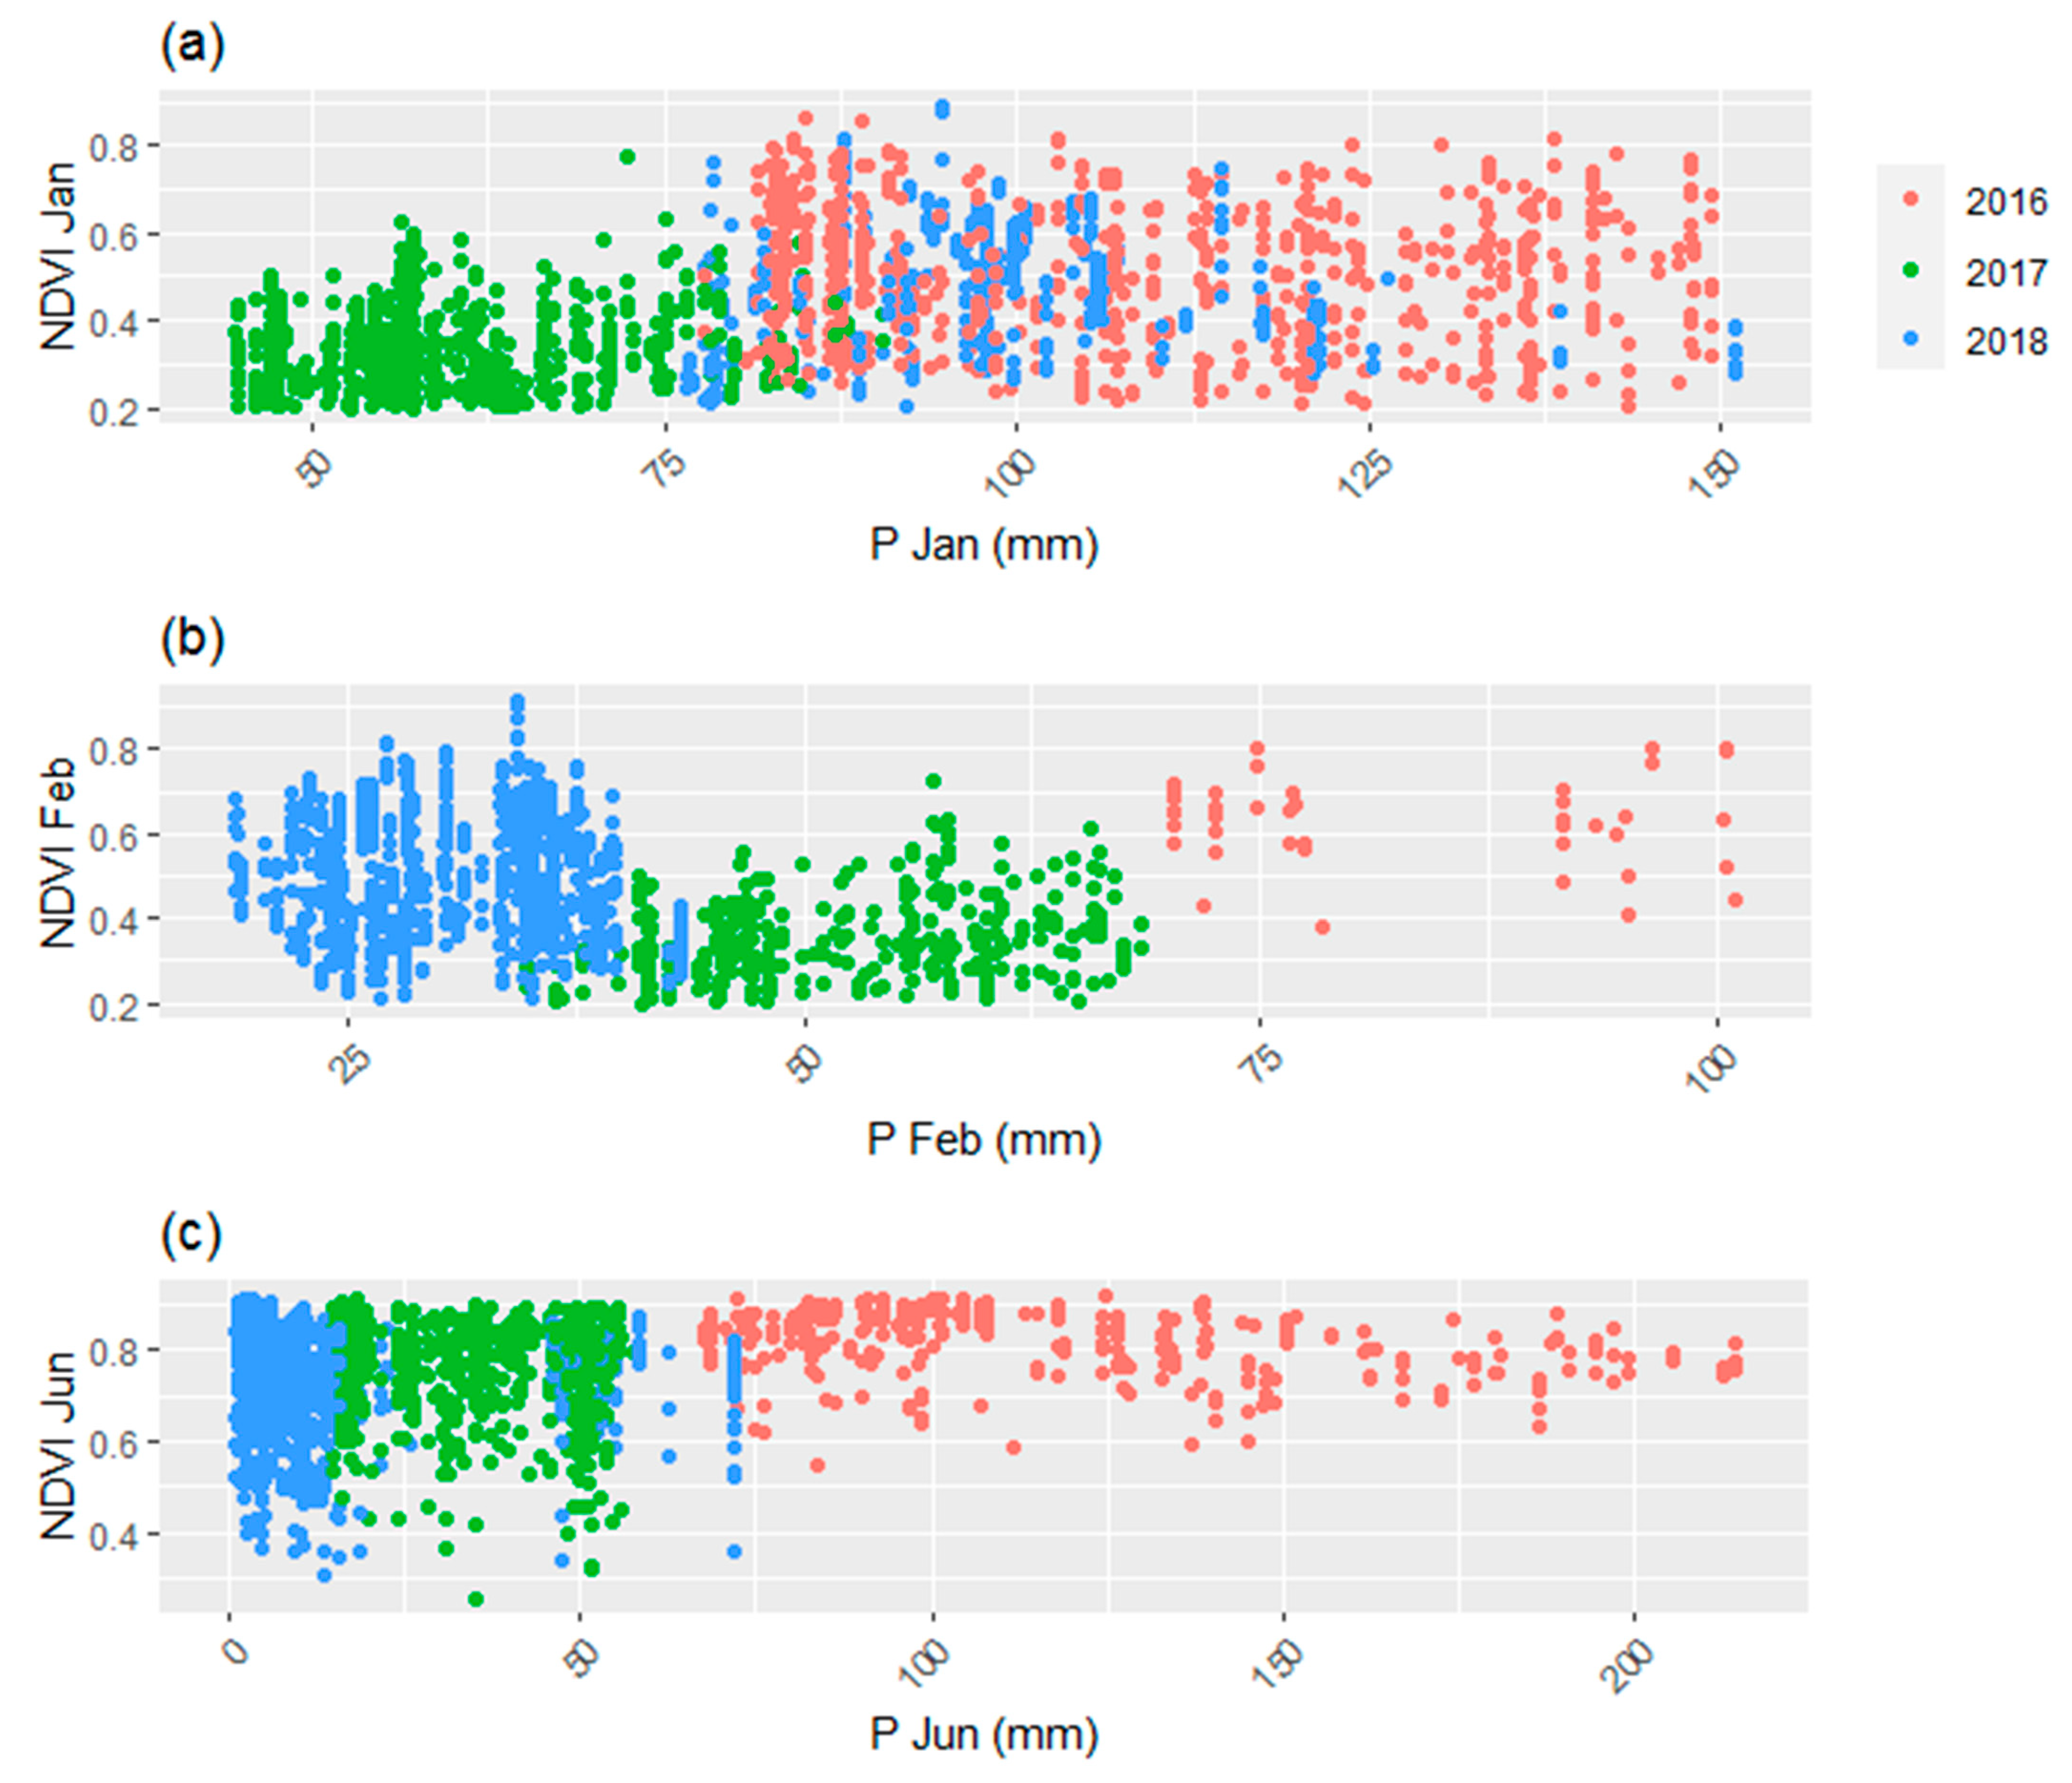
3.2. aNDVI, maxNDVI and Crop Yield

The NDVI series used for the calculation of aNDVI and maxNDVI for the years 2016 to 2018 is presented in Figure 3. The number of fields used to calculate aNDVI and maxNDVI was equal to 335, 409 and 198 in 2016, 2017 and 2018, respectively. Higher NDVI values early in the growing season (before the end of March (DOY 90)) were observed in 2016 compared to 2017 and 2018 (Figure 3). The percentage of NDVI observations available in early (defined as January to the end of March (DOY < 90)), mid (defined as the end of March (DOY > 90) to the end of May (DOY < 151)) and end (defined as the end of May (DOY > 151) to 21 July (DOY < 202)) of the winter wheat growing season was similar in 2016, 2017 and 2018. The percentage of NDVI observations available in the early growing season was equal to 40%, 32% and 32% in 2016, 2017 and 2018, respectively. The percentage of NDVI observations available in mid growing season was equal to 37%, 39% and 32% in 2016, 2017 and 2018, respectively. The percentage of NDVI observations available in late growing season was equal to 22%, 30% and 34% in 2016, 2017 and 2018, respectively.
Winter wheat yield, aNDVI and maxNDVI from 2016 to 2018 is visualized in Figure 4. Winter wheat yield was lowest in 2016 and highest in 2017 (Figure 4a). The variation in aNDVI for the years 2016 to 2018 does not align with the variation in winter wheat yield for the same period (Figure 4a,b). aNDVI was lowest in 2017 and highest in 2016. maxNDVI for the years 2016 to 2018 showed a similar pattern as the winter wheat yield (Figure 4a,c). Similar to the observed winter wheat yield, maxNDVI was lowest in 2016 and highest in 2017. In Figure 5, winter wheat yield is plotted as a function of the calculated aNDVI and maxNDVI.

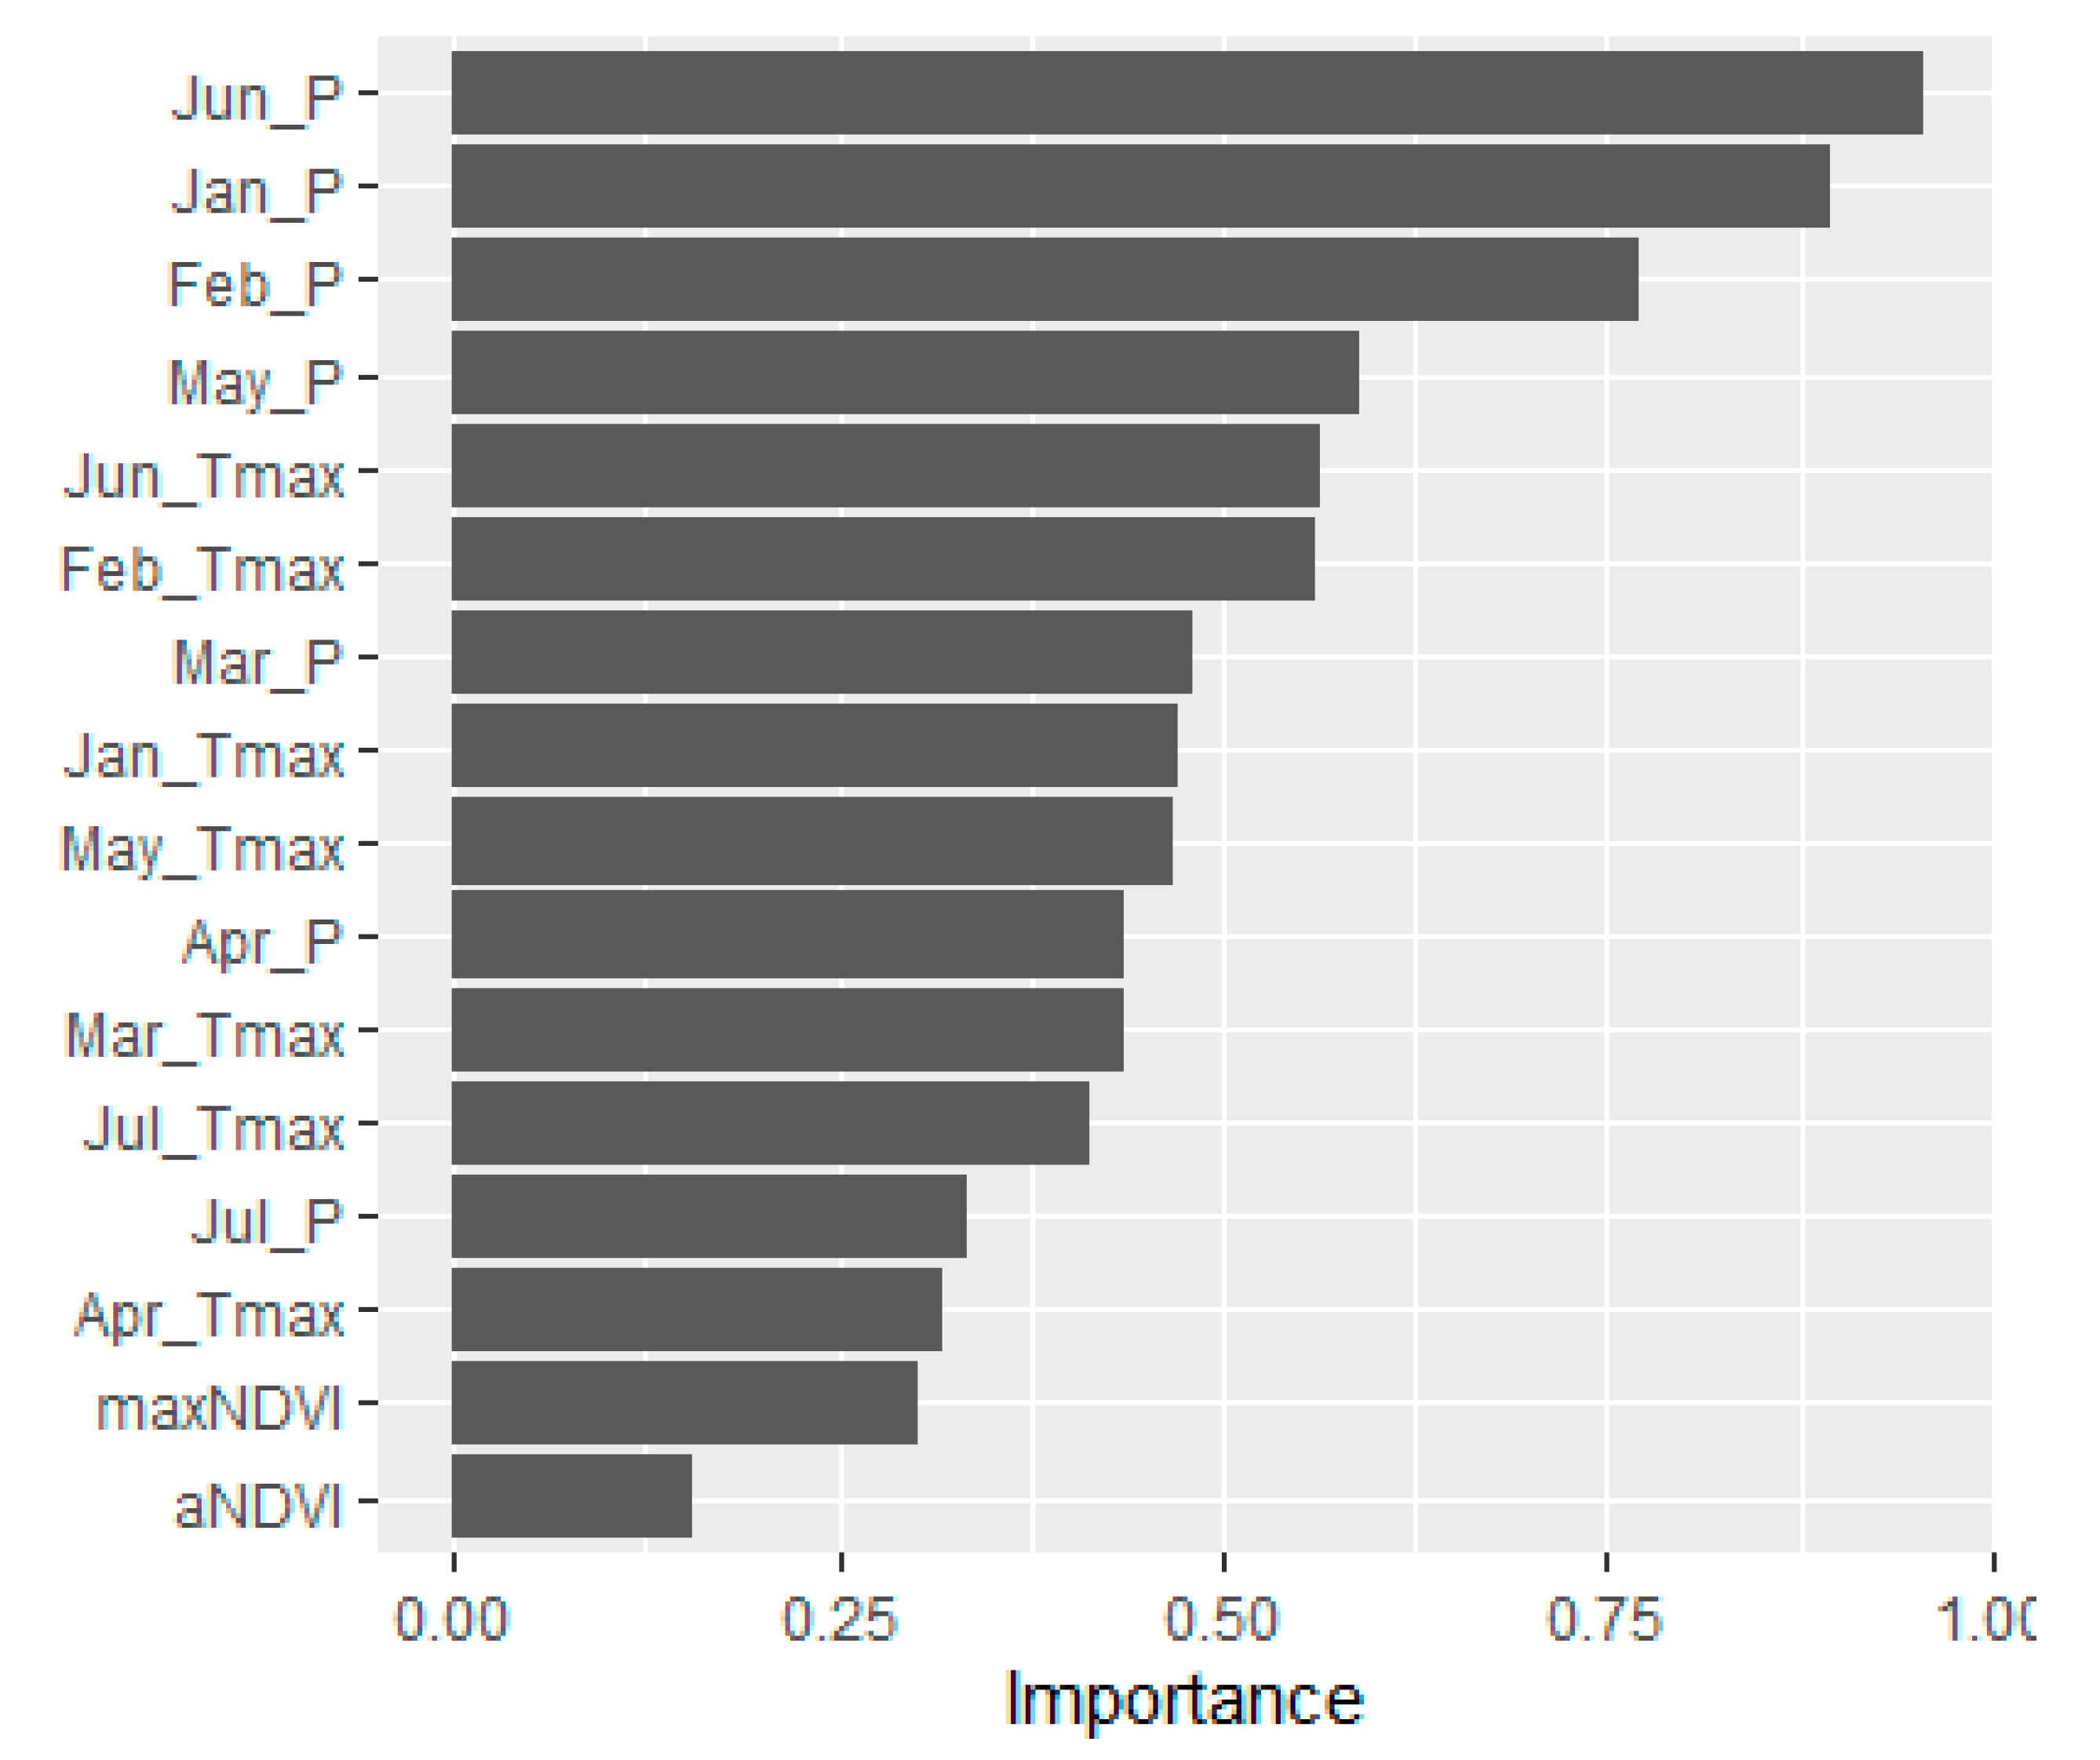
3.3. Wheat Yield Random Forest Models

The model performance metrics of the random forest models to predict winter wheat yield with predictor variable(s) aNDVI (Model 1), maxNDVI (Model 2), and monthly precipitation and maximum temperatures from January to July, aNDVI and maxNDVI, (Model 3) are presented in Table 1. The model performance metrics of the random forests Model 1 and Model 2 indicated that both aNDVI and maxNDVI were poor predictors of winter wheat yield in northern Belgium. When weather variables were added to the random forest wheat yield model, the model performance increased strongly (Model 3, Table 1).
The importance scores of the predictor variables for Model 3 are visualized in Figure 6. Precipitation in June had the highest variable importance score in Model 3. In addition, precipitation in the months January, February and May had high importance scores. Precipitation in these months thus played an important role in Model 3. Maximum temperature in the months June, February, January and May had also high importance scores. The NDVI-derived yield proxies aNDVI and maxNDVI had an importance score equal to 0.15 and 0.30, respectively. With these scores, aNDVI and maxNDVI had the lowest importance scores of all predictor variables, pointing at their poor predictor value for winter wheat yield. This was already indicated by the model performance of Model 1 and Model 2 (Table 1). The p-values of the permutation variable importance scores were smaller than 0.05 for all predictor variables except for the predictor variable aNDVI, which had a p-value equal to 0.14.

3.4. Effect of Weather on Winter Wheat Yield

The Pearson correlation between winter wheat yield and the monthly precipitation (P) and minimum and maximum temperatures (Tmin and Tmax) is presented in Figure 7a. Winter wheat yield was negatively correlated with precipitation in June, January and February, indicating that high precipitation values in these months resulted in low winter wheat yield. The negative correlation between precipitation and winter wheat yield was strongest in June and weaker in the months of January and February. Precipitation in the other months (except for the month of July) had lower, but also negative, correlation values with winter wheat yield. A positive correlation between winter wheat yield and minimum and maximum temperature in March and maximum temperature in June was observed. This indicates that high temperatures in these months resulted in higher winter wheat yield. The correlation values between minimum and maximum temperature and winter wheat yield were smaller than the negative correlation values between precipitation and winter wheat yield (Figure 7a).
The pattern in correlation values between monthly precipitation, minimum and maximum temperature and aNDVI was dissimilar to the correlation pattern observed between winter wheat yield and the considered monthly weather variables (Figure 7a,b). This indicates that aNDVI was influenced in another way by the considered weather variables. However, for maxNDVI, a similar correlation pattern between monthly weather variables and winter wheat yield was observed (Figure 7a,c). Similar to winter wheat yield, maxNDVI was negatively correlated with precipitation in June, January and February. In addition, maxNDVI was positively correlated with minimum and maximum temperature in March and maximum temperature in June. These were also the months where a positive correlation between winter wheat yield and minimum and maximum temperatures was observed.
In Figure 8, NDVI for the months of January, February and June is plotted as a function of the monthly precipitation in these months. These are the three months that showed the strongest negative correlation between winter wheat yield and monthly precipitation (Figure 7). High precipitation values in the month of June did not correspond to lower NDVI values, despite the negative correlation between winter wheat yield and precipitation during this month (Figure 7c). Interestingly, the variability in NDVI observations in June decreased with increasing precipitation. Expected lower NDVI values caused by higher precipitation values were not observed for the months of January and February (Figure 7a,b).

4. Discussion

The model performance metrics of the yield model using aNDVI as a predictor variable for winter wheat yield modelling in northern Belgium indicated that the integral NDVI during the growing season (aNDVI) was not a good predictor of winter wheat yield (Table 1, Model 1), which is in contrast to a study in Latvia [4]. The variance explained for winter wheat yield at the regional scale in Latvia using aNDVI as a predictor reached 27% and 16% using a linear regression method and random forest model, respectively [4]. When the weather predictors of precipitation and temperature and information on the location of the field were added to the models, the variance explained for winter wheat yield in Latvia reached 84% and 96% using a linear regression method and random forest model, respectively [4]. Adding information on the location of the field, by including which of the seven agricultural regions of northern Belgium the field was located in (Figure 1), to Model 1 had a negligible effect on the model performance (R2 = 0.09). Each agricultural region is characterized by a distinctive mixture of soil and terrain conditions. A similar approach was developed by [6] in northern France, where the combined use of NDVI and meteorological variables performed well for different soils and management regimes without incorporating these variables directly into the yield model.
When maxNDVI instead of aNDVI was used as a predictor in the winter wheat yield model of northern Belgium, the model performance did not improve (Table 1, Model 2). The model performance increased slightly when information on the location of the field was added to Model 2; however, the model performance remained poor (R2 = 0.25). This is in contrast to studies in other regions, where peak NDVI has been shown to capture wheat yield variability well [3,21]. In the present study, maxNDVI occurred on average on 24 May 2016 [DOY 145], 24 May 2017 [DOY 144] and 13 May 2018 [DOY 133]. Winter wheat anthesis, which is a crucial stage for final wheat yield, typically takes place in June in Belgium [22]. The observed maxNDVI occurred on average close to winter wheat anthesis. Therefore, maxNDVI was expected to be a better predictor of winter wheat yield. However, the scatterplot of maxNDVI and winter wheat yield for the years 2016 to 2018 indicated that maxNDVI was close to NDVI saturation for most fields, irrespective of the final yields (Figure 5). The low yield prediction power of maxNDVI was likely caused by dense green biomass in the studied fields. Therefore the NDVI likely saturated prior to capturing the seasonal green biomass peak, resulting in a poor predictor of winter wheat yield [3].
The poor model evaluation metrics of winter wheat yield models based on aNDVI and maxNDVI in northern Belgium compared to other regions suggest that NDVI does not capture winter wheat yield variability well in northern Belgium. From these results we concluded that modelling winter wheat yield based on NDVI using an empirical model is environmentally dependent. The environmental dependency of wheat yield models based on fAPAR, another vegetation index, was already demonstrated by [23,24]. In rain-fed regions with high yields in Europe, the correlations between fAPAR and yield were low, whereas in regions where yield is water-limited, high correlations between fAPAR and yield were found [23]. In the former case, the addition of stress factors improved the model performance [24]. The higher average yields in northern Belgium (i.e., 8.2 Mg/ha from 2016 to 2018) compared to Latvia (i.e., 5.2 Mg/ha from 2014 to 2018) might also partly explain the low performance of the wheat yield model based on NDVI in northern Belgium. The authors of [25] found that the model performance of soybean and corn yield models based on surface reflectance and vegetation indices decreased with increasing yield. The decrease in model performance is related to the saturation of multi-spectral data (including NDVI) at high yields [25].
The correlation pattern between aNDVI and monthly weather variables did not align with the correlation pattern between winter wheat yield and monthly weather variables (Figure 7a,b). However, in a previous study in Latvia [4], aNDVI was correlated with monthly temperature data in a similar way to winter wheat yield. Winter wheat yield was negatively correlated with monthly precipitation from January to June (Figure 7a). In contrast, aNDVI of the studied winter wheat fields was positively correlated with monthly precipitation from January to June (Figure 7b). NDVI values during the months of January, February and June had no negative effect of high precipitation values (Figure 8). Other studies have shown that waterlogging resulted in lower NDVI values of wheat [26,27,28]. In contrast, ref. [29] found that wheat leaf physiology and shoot growth were not significantly affected by waterlogging in early or late crop growth stages, whereas seed production did decrease. The non-response of wheat leaf physiology to flooding shown in this experiment could also explain the non-response of NDVI to high precipitation values in the present study. NDVI values in January and February 2016 were higher compared to 2017 and 2018 (Figure 8a,b). The high NDVI values in January and February 2016 could be related to favorable winter conditions in 2015. Temperatures in November and December and precipitation in November 2015 were higher than the long-term average values from 1981 to 2010 [30]. The positive effect of the favorable winter conditions in 2015 on the NDVI were not offset by the high precipitation values in January and February in 2016. In addition, the negative effects of high June precipitation may not have been captured by NDVI because NDVI values were close to saturation in June (Figure 3). Therefore aNDVI was not a good predictor for winter wheat yield in northern Belgium because it did not capture the negative effect of high precipitation on winter wheat yield in the months January, February and June.
The correlation pattern between maxNDVI and monthly weather variables aligned with the correlation pattern between winter wheat yield and monthly weather variables (Figure 7a,c). The negative correlation between maxNDVI and precipitation in June, January and February is, however, not as strong as the correlation between winter wheat yield and precipitation during these months. maxNDVI occurred, on average, before June in 2016, 2017 and 2018. Therefore, the causality of the observed correlation between maxNDVI and weather variables in June and July is unlikely.
The winter wheat yield model with monthly weather variables indicated that precipitation in the months of June, January and February was the most important variable explaining winter wheat yield variability in the period from 2016 to 2018 in northern Belgium (Figure 6). This was also confirmed by the Pearson correlation between winter wheat yield and precipitation in June, January and February (Figure 7). These Pearson correlation values indicated that high precipitation values in June, January and February resulted in low winter wheat yield. June is an important month for winter wheat in northern Belgium, as it is in this month that wheat anthesis occurs [22], which is a sensitive crop stage. Adverse weather conditions during this important phenological stage impact wheat yield [22]. Winter wheat yield losses between 34 and 92% caused by waterlogging around anthesis have been reported [22,31]. On average, precipitation in June was equal to 119 mm in 2016, 36 mm in 2017 and 14 mm in 2018 during the wheat tillering phase. In January and February, precipitation was 109 mm in 2016 compared to 59 mm in 2017 and 92 mm in 2018. Average precipitation in February was equal to 81 mm in 2016, 53 mm in 2017 and 31 mm in 2018. The high precipitation in June, January and February in 2016 caused the low winter wheat yield in 2016 (Figure 4). The results of Model 3 confirmed that easily accessible weather variables explained winter wheat yield variability better than NDVI-derived variables in northern Belgium from 2016 to 2018.

5. Conclusions

This research demonstrates that the applicability of empirical winter wheat yield modelling using NDVI-derived yield proxies as predictor variables is environmentally dependent. For the period from 2016 to 2018, the NDVI-derived yield proxies aNDVI and maxNDVI were not able to explain winter wheat yield variability. This was caused by the lack of sensitivity of the NDVI series to monthly precipitation in June, January and February, which were shown to influence wheat yield the most in the period from 2016 to 2018. In conclusion, the effect of adverse weather conditions during important phenological stages such as tillering and anthesis on winter wheat yield was not captured by the NDVI series. Winter wheat yield variability was better predicted by monthly precipitation and temperature data than by NDVI-derived yield proxies in the period from 2016 to 2018 in northern Belgium.

Author Contributions

Conceptualization and methodology, A.G. and A.V.; validation, formal analysis, writing—original draft preparation, A.V.; data curation and writing—review and editing, A.G. and A.V.; supervision, A.G., funding acquisition, A.G. All authors have read and agreed to the published version of the manuscript.

Funding

The authors acknowledge funding from the European Union’s Horizon 2020 Research and Innovation Programme under grant agreement No. 818346.

Institutional Review Board Statement

Not applicable.

Informed Consent Statement

Not applicable.

Data Availability Statement

Not applicable.

Acknowledgments

The authors are grateful to the Royal Meteorological Institute for weather data and to the Department of Agriculture and Fisheries for agricultural parcel and yield data.

Conflicts of Interest

The authors declare no conflict of interest.

References

  1. Lobell, D.B.; Thau, D.; Seifert, C.; Engle, E.; Little, B. A Scalable Satellite-Based Crop Yield Mapper. Remote Sens. Environ. 2015, 164, 324–333. [Google Scholar] [CrossRef]
  2. Doraiswamy, P.C.; Akhmedov, B.; Beard, L.; Stern, A.; Mueller, R. Operational Prediction of Crop Yields Using MODIS Data and Products. In Workshop Proceedings: Remote Sensing Support to Crop Yield Forecast and Area Estimates; ISPRS Archives XXXVI-8/W48; ISPRS: Stresa, Italy, 2007; p. 5. [Google Scholar]
  3. Becker-Reshef, I.; Vermote, E.; Lindeman, M.; Justice, C. A Generalized Regression-Based Model for Forecasting Winter Wheat Yields in Kansas and Ukraine Using MODIS Data. Remote Sens. Environ. 2010, 114, 1312–1323. [Google Scholar] [CrossRef]
  4. Vannoppen, A.; Gobin, A.; Kotova, L.; Top, S.; De Cruz, L.; Vīksna, A.; Aniskevich, S.; Bobylev, L.; Buntemeyer, L.; Caluwaerts, S.; et al. Wheat Yield Estimation from NDVI and Regional Climate Models in Latvia. Remote Sens. 2020, 12, 2206. [Google Scholar] [CrossRef]
  5. Milesi, C.; Samanta, A.; Hashimoto, H.; Kumar, K.K.; Ganguly, S.; Thenkabail, P.S.; Srivastava, A.N.; Nemani, R.R.; Myneni, R.B. Decadal Variations in NDVI and Food Production in India. Remote Sens. 2010, 2, 758–776. [Google Scholar] [CrossRef] [Green Version]
  6. Durgun, Y.Ö.; Gobin, A.; Duveiller, G.; Tychon, B. A Study on Trade-Offs between Spatial Resolution and Temporal Sampling Density for Wheat Yield Estimation Using Both Thermal and Calendar Time. Int. J. Appl. Earth Obs. Geoinf. 2020, 86, 101988. [Google Scholar] [CrossRef]
  7. Genovese, G.; Vignolles, C.; Nègre, T.; Passera, G. A Methodology for a Combined Use of Normalised Difference Vegetation Index and CORINE Land Cover Data for Crop Yield Monitoring and Forecasting. A Case Study on Spain. Agronomie 2001, 21, 91–111. [Google Scholar] [CrossRef] [Green Version]
  8. Rojas, O. Operational Maize Yield Model Development and Validation Based on Remote Sensing and Agro-meteorological Data in Kenya. Int. J. Remote Sens. 2007, 28, 3775–3793. [Google Scholar] [CrossRef] [Green Version]
  9. Rembold, F.; Atzberger, C.; Savin, I.; Rojas, O. Using Low Resolution Satellite Imagery for Yield Prediction and Yield Anomaly Detection. Remote Sens. 2013, 5, 1704–1733. [Google Scholar] [CrossRef] [Green Version]
  10. Bolton, D.K.; Friedl, M.A. Forecasting Crop Yield Using Remotely Sensed Vegetation Indices and Crop Phenology Metrics. Agric. For. Meteorol. 2013, 173, 74–84. [Google Scholar] [CrossRef]
  11. Waldner, F.; Horan, H.; Chen, Y.; Hochman, Z. High Temporal Resolution of Leaf Area Data Improves Empirical Estimation of Grain Yield. Sci. Rep. 2019, 9, 15714. [Google Scholar] [CrossRef] [Green Version]
  12. Franch, B.; Vermote, E.F.; Skakun, S.; Roger, J.C.; Becker-Reshef, I.; Murphy, E.; Justice, C. Remote Sensing Based Yield Monitoring: Application to Winter Wheat in United States and Ukraine. Int. J. Appl. Earth Obs. Geoinf. 2019, 76, 112–127. [Google Scholar] [CrossRef]
  13. Weiss, M.; Jacob, F.; Duveiller, G. Remote Sensing for Agricultural Applications: A Meta-Review. Remote Sens. Environ. 2020, 236, 111402. [Google Scholar] [CrossRef]
  14. Lai, Y.R.; Pringle, M.J.; Kopittke, P.M.; Menzies, N.W.; Orton, T.G.; Dang, Y.P. An Empirical Model for Prediction of Wheat Yield, Using Time-Integrated Landsat NDVI. Int. J. Appl. Earth Obs. Geoinf. 2018, 72, 99–108. [Google Scholar] [CrossRef]
  15. Departement Landbouw en Visserij Voorlopige Arealen Landbouwteelten uit de Verzamelaanvraag. 2018. Available online: https://lv.vlaanderen.be/nl/nieuws/voorlopige-arealen-landbouwteelten-uit-de-verzamelaanvraag-2018 (accessed on 2 March 2021).
  16. Schramm, M.; Pebesma, E.; Milenković, M.; Foresta, L.; Dries, J.; Jacob, A.; Wagner, W.; Mohr, M.; Neteler, M.; Kadunc, M.; et al. The OpenEO API–Harmonising the Use of Earth Observation Cloud Services Using Virtual Data Cube Functionalities. Remote Sens. 2021, 13, 1125. [Google Scholar] [CrossRef]
  17. Wright, M.N.; Ziegler, A. Ranger: A Fast Implementation of Random Forests for High Dimensional Data in C++ and R. J. Stat. Softw. 2017, 77, 1–17. [Google Scholar] [CrossRef] [Green Version]
  18. Strobl, C.; Zeileis, A. Danger: High Power!—Exploring the Statistical Properties of a Test for Random Forest Variable Importance. In COMPSTAT 2008–Proceedings in Computional Statistics; Physica Verlag: Heidelberg, Germany, 2008; ISBN 978-3-7908-2083-6. [Google Scholar]
  19. Altmann, A.; Toloşi, L.; Sander, O.; Lengauer, T. Permutation Importance: A Corrected Feature Importance Measure. Bioinforma. Oxf. Engl. 2010, 26, 1340–1347. [Google Scholar] [CrossRef] [PubMed]
  20. Journée, M.; Delvaux, C.; Bertrand, C. Precipitation Climate Maps of Belgium. Adv. Sci. Res. 2015, 12, 73–78. [Google Scholar] [CrossRef] [Green Version]
  21. Skakun, S.; Franch, B.; Vermote, E.; Roger, J.C.; Justice, C.; Masek, J.; Murphy, E. Winter Wheat Yield Assessment Using Landsat 8 and Sentinel-2 Data. In Proceedings of the IGARSS 2018–2018 IEEE International Geoscience and Remote Sensing Symposium, Valencia, Spain, 22–27 July 2018; pp. 5964–5967. [Google Scholar]
  22. Gobin, A. Weather Related Risks in Belgian Arable Agriculture. Agric. Syst. 2018, 159, 225–236. [Google Scholar] [CrossRef]
  23. López-Lozano, R.; Duveiller, G.; Seguini, L.; Meroni, M.; García-Condado, S.; Hooker, J.; Leo, O.; Baruth, B. Towards Regional Grain Yield Forecasting with 1km-Resolution EO Biophysical Products: Strengths and Limitations at Pan-European Level. Agric. For. Meteorol. 2015, 206, 12–32. [Google Scholar] [CrossRef]
  24. Durgun, Y.Ö.; Gobin, A.; Gilliams, S.; Duveiller, G.; Tychon, B. Testing the Contribution of Stress Factors to Improve Wheat and Maize Yield Estimations Derived from Remotely-Sensed Dry Matter Productivity. Remote Sens. 2016, 8, 170. [Google Scholar] [CrossRef] [Green Version]
  25. Skakun, S.; Kalecinski, N.I.; Brown, M.G.L.; Johnson, D.M.; Vermote, E.F.; Roger, J.-C.; Franch, B. Assessing Within-Field Corn and Soybean Yield Variability from WorldView-3, Planet, Sentinel-2, and Landsat 8 Satellite Imagery. Remote Sens. 2021, 13, 872. [Google Scholar] [CrossRef]
  26. Uddin, S.; Schilling, R.; Xu, B.; Tahmasbian, I.; Napier, T.; Dehaan, R.; Mcdonald, G.; Tavakkoli, E. Comparing Genotypic Variation in Wheat in Response to Transient Waterlogging in Alkaline Sodic Soils. In Proceedings of the 2019 Agronomy Australia Conference, Wagga Wagga, Australia, 25–29 August 2019. [Google Scholar]
  27. Arguello, M.N.; Mason, R.E.; Roberts, T.L.; Subramanian, N.; Acuña, A.; Addison, C.K.; Lozada, D.N.; Miller, R.G.; Gbur, E. Performance of Soft Red Winter Wheat Subjected to Field Soil Waterlogging: Grain Yield and Yield Components. Field Crops Res. 2016, 194, 57–64. [Google Scholar] [CrossRef] [Green Version]
  28. Rahman, M.; Di, L.; Yu, E.; Lin, L.; Yu, Z. Remote Sensing Based Rapid Assessment of Flood Crop Damage Using Novel Disaster Vegetation Damage Index (DVDI). Int. J. Disaster Risk Sci. 2020. [Google Scholar] [CrossRef]
  29. Ploschuk, R.A.; Miralles, D.J.; Colmer, T.D.; Ploschuk, E.L.; Striker, G.G. Waterlogging of Winter Crops at Early and Late Stages: Impacts on Leaf Physiology, Growth and Yield. Front. Plant Sci. 2018, 9. [Google Scholar] [CrossRef] [Green Version]
  30. MeteoBelgië Analyse van Het Jaar 2015. Available online: https://www.meteobelgie.be/klimatologie/101-jaar-2015/2084-jaar-2015 (accessed on 4 March 2021).
  31. De San Celedonio, R.P.; Abeledo, L.G.; Miralles, D.J. Identifying the Critical Period for Waterlogging on Yield and Its Components in Wheat and Barley. Plant Soil. 2014, 378, 265–277. [Google Scholar] [CrossRef]
Figure 1. Location of the studied winter wheat fields in northern Belgium from 2016 (n = 666), 2017 (n = 609) and 2018 (n = 210). The seven agricultural regions of northern Belgium are also visualized.
Agronomy 11 00946 g001
Figure 2. Average NDVI for the 1485 winter wheat fields studied from 2016 to 2018. DOY: day of year.
Agronomy 11 00946 g002
Figure 3. NDVI series used for the calculation of aNDVI and maxNDVI for the years 2016 to 2018 for each field (light grey). The black points represent the average NDVI profile of all fields in a particular year. DOY: day of year.
Agronomy 11 00946 g003
Figure 4. (a) Winter wheat yield (Mg/ha); (b) aNDVI; (c) maxNDVI for 942 fields from 2016 to 2018.
Agronomy 11 00946 g004
Figure 5. (a) Scatterplot of winter wheat yield against aNDVI; (b) scatterplot of winter wheat yield against maxNDVI; Color of the points indicate the year of observation (red = 2016, green = 2017 and blue = 2018).
Agronomy 11 00946 g005
Figure 6. Importance scores of predictor variables for Model 3. In Model 3, winter wheat yield was modelled as a function of monthly precipitation values and maximum temperature values during the winter wheat growing season from January to July, aNDVI and maxNDVI. P: precipitation; Tmax: maximum temperature; months from January to July are indicated by the first three letters of each month.
Agronomy 11 00946 g006
Figure 7. (a) Pearson correlation between winter wheat yield and monthly precipitation (P), minimum temperature (Tmin) and maximum temperature (Tmax) for the months from January to July); (b) Pearson correlation between aNDVI and monthly precipitation (P), minimum temperature (Tmin) and maximum temperature (Tmax) for the months from January to July; (c) Pearson correlation between maxNDVI and monthly precipitation (P), minimum temperature (Tmin) and maximum temperature (Tmax) for the months from January to July. The months from January to July are indicated by the first three letters of each month. Significant correlation values (i.e., p-value < 0.01) and non-significant correlation values (i.e., p-value > 0.01) are indicated with triangles and circles, respectively.
Agronomy 11 00946 g007
Figure 8. (a) Scatterplot of NDVI observation and precipitation for the month of January; (b) scatterplot of NDVI observation and precipitation for the month of February; (c) scatterplot of NDVI observation and precipitation for the month of June.
Agronomy 11 00946 g008
Table 1. Model performance metrics of Model 1: yield~aNDVI, Model 2: yield~maxNDVI, and Model 3: yield~aNDVI + maxNDVI + Jan_P + Feb_P + Mar_P + Apr_P + May_P + Jun_P + Jul_P + Jan_Tmax + Feb_Tmax + Mar_Tmax + Apr_Tmax + May_Tmax + Jun_Tmax + Jul_Tmax (where P is precipitation; Tmax is maximum temperature; months from January to July are indicated by the first three letters of each month).
Model Performance MetricsModel 1Model 2Model 3
Out of bag prediction error (MSE)3.542.780.95
R squared (out of bag)−0.27520.00130.6593
Publisher’s Note: MDPI stays neutral with regard to jurisdictional claims in published maps and institutional affiliations.

