Article

Rice Residue-Based Biochar Mitigates N2O Emission from Acid Red Soil

1
Research Center on Ecological Sciences, Jiangxi Agricultural University, Nanchang 330045, China
2
Department of Agronomy, Faculty of Agricultural Sciences, University of the Punjab, Lahore 54590, Pakistan
3
Department of Agronomy, University of Agriculture, Faisalabad 38040, Pakistan
4
Department of Botany, University of Agriculture, Faisalabad 38040, Pakistan
5
Department of Soil Science, Bahauddin Zakariya University, Multan 60000, Pakistan
6
College of Plant Science and Technology, Huazhong Agricultural University, Wuhan 430070, China
7
Key Labortory of Crops Physiology, Ecology and Genetic Breeding, Ministry of Education/College of Agronomy, Jiangxi Agricultural University, Nanchang 330045, China
8
College of Agriculture, Nanjing Agricultural University, Nanjing 210095, China
9
China Guangxi Hydraulic Research Institute, Nanning 530023, China
10
Guangxi Key Laboratory of Water Engineering Materials and Structures, Nanning 530023, China
*
Author to whom correspondence should be addressed.
Agronomy 2021, 11(12), 2462; https://doi.org/10.3390/agronomy11122462
Submission received: 16 November 2021 / Revised: 22 November 2021 / Accepted: 23 November 2021 / Published: 3 December 2021

Abstract

:
Biochar application is considered an effective approach to mitigating nitrous oxide (N2O) emissions from agricultural soils. However, the mechanisms of biochar to mitigate N2O emissions from acidic red soils are still unclear. Therefore, the present study aims to underpin mechanisms associated with rice residue-based biochar in mitigating N2O emissions from acid soils. Soil treated with different rates of biochar control, from 1%, 2%, and 3%, and different soil properties, including soil pH, microbial biomass carbon (MBC), NH4+-N, NO3-N, genes abundance (nosZ, nirK, AOA, and AOB), and enzymatic activities ((nitrate reductase (NR) and urease (UR)) were studied. The application of 3% biochar increased the soil pH (5.21–6.48), MBC (565–685 mg/kg), NO3-N contents (24.23–44.5 mg/kg), genes abundance (nosZ, nirK, AOA, and AOB) and UR activity. The highest N2O emission (43.60 μg kg−1) was recorded and compared with the application of 1% (26.3 μg kg−1), 2% (18.33 μg kg−1), and 3% biochar (8.13 μg kg−1). Applying 3% biochar effectively reduced the N2O emission due to increased soil pH, MBC, NO3-N contents, genes abundance (nosZ, nirK, AOA, and AOB), and weakened NH4+-N and NR activities. Therefore, increasing soil pH, genes abundance, and weakened nitrification following the addition of rice residue-based biochar can effectively reduce the N2O emissions from acidic red soils.

1. Introduction

Nitrous oxide (N2O) is a potent greenhouse gas (GHG) that has persisted in the atmosphere for over 120 years, accelerating ozone layer depletion [1]. Agriculture is a major source of N2O emissions, and it has contributed 60% to global anthropogenic N2O emissions [2]. In the agriculture sector, excessive use of nitrogenous fertilizer is a major reason for this increase in N2O emissions [3]. Similarly, soil organic matter, poor crop residue management, tillage practices, and crop rotations also affect N2O from agriculture soils [4,5]. The substantial increase in N2O emissions is a major reason for climate change and subsequent global warming. This has increased the concern across the globe to reduce the N2O emissions by using efficient measures to reduce impacts associated with rapid climate change and global warming [6,7].
Agricultural soils, particularly acidic soils, are the primary source of N2O emissions; therefore, proper measures must be adapted to reduce N2O emissions from acidic soils. Globally, different practices, including biochar application and liming materials, are used to mitigate N2O emissions from acidic soils [5]. Every year, significant quantities of crop residues are produced, and generally, farmers burn these residues, which pose a serious threat in the form of increasing greenhouse gases and environmental pollution. These residues can be changed into agricultural input by pyrolysis into biochar [5,8]. Biochar has gained attention across the globe to improve soil organic carbon (SOC), soil fertility, and reduce greenhouse gases (GHGs) [9]. N2O emission from soils is directly linked with the soil N cycle, which mainly consists of nitrification and de-nitrification processes [10]. Moreover, different abiotic factors, including soil pH, SOC, N availability, and enzymatic activities, modulate the soil microbes and thus indirectly affect the N cycle and subsequent N2O emissions [11]. Soil pH is a major factor that fundamentally affects the aforementioned processes and therefore affects the N2O emission [5]. Generally, N2O emission in acid soils with low pH is significantly higher than alkaline soils with high pH [5]. Biochar works as a redox catalyst and plays an appreciable role in reducing N2O emissions. Generally, biochar has an alkaline pH and contains a significant amount of base cations, which increases the soil pH [12]. This increase in soil pH following the addition of biochar increases soil nitrate reductase activity (N2O-R), reducing the N2O emission by weakening denitrification and increasing the reduction of N2O into N2 [5]. Biochar also reduces the NO3 leaching and accumulation in soil [13]. Additionally, it also favors the reduction in soil NH4+ owing to its high adsorption capacity [14]. Therefore, this reduction in substrate availability (N) reduces N2O emission, which is considered a significant driver in processing N2O emissions [15]. Biochar also changed the activities of microbes and the abundance of denitrifying genes, including nosZ and nirK that controls soil N2O emission. Biochar application substantially increased the nosZ abundance, which induced an increment in N2OR that favors the reduction of N2O into N2 and therefore resulted in a reduction in N2O emission [16].
Previously, different authors also noted that biochar application appreciably reduced the soil N2O emission. For instance, Rittl et al. [17] noted that biochar application significantly reduced the soil N2O emissions, which largely depend on rate of biochar, soil properties, and climatic conditions. In another study, the application of 5% biochar significantly reduced the N2O, which was highly affected by soil moisture contents [18]. Moreover, García et al. [19] also observed that biochar addition reduced N2O emissions in haplic phaeozem soil compared to haplic calcisol. Thus, all these studies indicated that biochar reduces the N2O emission depending on biochar application rate, soil, and biochar properties. Agricultural soils, especially acidic and tropical soils, are a major reason for N2O emission [20]. Therefore, decreasing N2O emissions from these soils is an urgent task. The application of biochar to acidic soils can be a promising option to reduce N2O emissions. Rice residue-based straw biochar possesses an excellent potential to improve soil health, crop yield and reduce N2O emissions [12,21,22]. However, the mechanism of rice residue-based biochar in mitigating the N2O from red acidic soils is not fully explored and there are many research gaps. For instance, the effect of rice residue-based biochar on soil microbial biomass carbon, genes abundance, and enzymatic activities are not explored yet. Thus, we made an attempt to explore the mechanisms behind the reduction in the N2O from red acidic soils following the addition of rice residue-based biochar. The objectives of our study were: (i) to determine the impact of biochar application on soil pH, soil mineral nitrogen, and soil microbial biomass carbon and (ii) to determine the impact of biochar on genes abundance (nosZ, nirK, AOA, and AOB), soil enzymatic activities (NR and UR), and soil N2O emissions.

2. Materials and Methods

2.1. Experimental Details

The study was performed at Jiangxi Agricultural University in 2019. Soil samples from the experimental station were collected oven-dried and subjected to determine the diverse soil characteristics. The soil was recognized as silt loam (sand, silt, and clay: 24.7%, 57.8%, and 17.5%) with pH 5.21, organic carbon 1.61 g kg−1, total nitrogen 1.0 g kg−1, and cation exchange capacity (CEC) 7.10 cmol kg−1. The soil collected for the experimental purpose was subjected to incubation at 40% water-filled pore spaces (WFPS) for seven days at 25 ± 1 °C to establish the microbial activities. The study was comprised of different rates of rice residues-based biochar, i.e., control 0% (no biochar), 1%, 2%, and 3% biochar application rates. In control, no biochar was applied, whereas, in 1%, 2%, and 3%, biochar was applied at the rate of 22.4, 44.8, and 67.2 t ha−1. Biochar used for the study was prepared from rice residues by pyrolysis (600 °C) for 8 h. The prepared biochar was sieved (2 mm) prior to the start of the experiment. After that, 500 mL glass beakers were taken, 100 g incubated soil was added in each beaker, with biochar added according to treatments in each beaker and carefully mixed, and moisture was brought to 60% WFPS. The biochar had pH 9.95, carbon content 640 g kg−1, nitrogen content 4.71 g kg−1, and CEC 11.05 cmol kg−1. The experiment was performed for 50 days at 25 ± 1 °C in the control chamber. The experimental beakers were regularly visited, and moisture content was maintained at 60% WFPS by the addition of distilled water [23]. The study was performed in a complete randomized design, with each treatment comprising of 3 replicates.

2.2. N2O Sampling and Analysis

The sample of N2O gas was collected from the headspace of the glass beakers after adding the biochar at different intervals (1, 3, 5, 7, 10, 13, 16, 19, 23, 26, 29, 31, 32, 35, 38, 41, 44, 47, and 50 days). The glass jars were covered with a thin plastic sheet to prevent moisture loss. Nonetheless, 40 pinholes in each sheet were made for proper airing conditions. N2O produced in each glass jar was measured by the procedures of Shaaban et al. [24]. After that, jars were closed for 60 min with an airtight lid with a rubber septum for gas sampling. The quantity of gas produced in head-spaces was measured twice. Once when jars were closed (T0) and later after 60 min (T60) of closing glass jars. We used an airtight three-way stop-cock syringe to collect the gas samples from headspaces. After that, a gas-chromatograph (GC) (Agilent 7890B Santa Clara, CA, USA) was used to measure N2O from the gas collected from headspace, and flux of N2O gas was determined by methods Shaaban et al. [24] with given below equation:
F = P × V / W × Δ c / Δ t × 273 / ( T + 273 )
In this equation, F indicates the N2O emission rate (μg kg−1 h−1), and P indicates the N2O density at standard conditions. Furthermore, V and W indicate the volume of the jar (500 mL) and soil weight. Δc is N2O production over 60 min and Δt is sealing time for N2O production, which was 60 min, and T indicating the temperature of incubation (25 °C). Additionally, cumulative N2O flux (μg kg−1) was measured using daily N2O emission over a 50-day period with an equation given by Jin et al. [25].
Cumulative   gas   flux = i = 1 n ( Ri ×   24   ×   Di )
Here, Ri is N2O gas emission (μg kg−1 h−1) at sampling dates, whereas n shows the number of sampling while Di is days in sampling interval.

2.3. Determination of Soil Characteristic

A total of 600 g soil was taken in 1000 mL beakers to determine different soil properties and placed in the same conditions where the glass beakers for N2O determination were placed. Similarly, in these glass beakers, biochar was also applied as per treatment discussed above for gas jars. The soil samples were taken after 2, 9, 15, 22, 28, 35, 42, and 50 days to determine soil pH, MBC, NH4+-N, and NO3-N contents. Soil pH was determined by pH meter in a (soil: distilled water (1:2.5)) mixture Shaaban et al. [26]. Likewise, soil extract was prepared using 1 M KCL solution in 1:5 ratios of soil and KCL. After that, the soil solution was shaken for 1 h, and the filtrate was obtained using Whatman filter paper (No. 40). The NH4+-N and NO3-N contents in the extract were determined with a discrete chemistry analyzer (Smart Chem 200, Italy) [27]. Soil MBC was estimated by the procedures of Vance et al. [28] and Xiao et al. [29]. We took 20 g soil and fumigated it with chloroform for 24 h. After that, we took both the fumigated and the non-fumigated soil and extracted these with K2SO4 (0.5 M), which were shaken for 30 min. The filtrates were obtained with filter paper, and soil carbon content was measured by total organic carbon (TOC) analyzer.

2.4. Analysis of the Genes and Soil Enzymes

The genes abundance (nosZ, nirK, AOA, and AOB) in soil samples was determined before applying the biochar and 1, 15, 30, and 50 days after applying biochar. The soil DNA was extracted with a special DNA kit for soils ((Nohe Zhiyuan Science and Technology Co. Ltd., Beijing, China). After that, extracted DNA was dissolved in 100 μL sterile water and stored (−80 °C). After that, q-PCR was performed on a CFX96 Real-Time PCR System (Bio-Rad, USA) to quantity the AOA, AOB, nosZ, and nirK genes. For the q-PCR amplification, the reaction system consisted of 20 μL, which included 10 μL SYBR Green (TaKaRa, Japan), 0.2 μL Rox DYEII, 1 μL DNA template, 0.4 μL each primer (10 μmol/L), and 8.0 μL sterilized water. The copy number of the AOA, AOB, nosZ, and nirK genes per g/dry soil was determined by normalizing the extraction yield. The activity of soil nitrate reductase (NR) was measured by the phenol disulfonic acid procedure, whereas the activity of urease (UR) was determined by the sodium phenate-sodium hypochlorite colorimetric method [30].

2.5. Statistical Analysis

ANOVA was implemented using the Statistix-8.1 to compare the significant difference in soil properties, N2O emissions, enzymatic activities, and genes abundance caused due to input of different amounts of biochar application. The percent increase and decrease in each parameter were calculated by subtracting the maximum value from the minimum value. Then, the minimum and last obtained value was multiplied with 100 to calculate the percent increase and decrease [31]. The soft origin-10 was used to prepare the different graphs [32].

3. Results

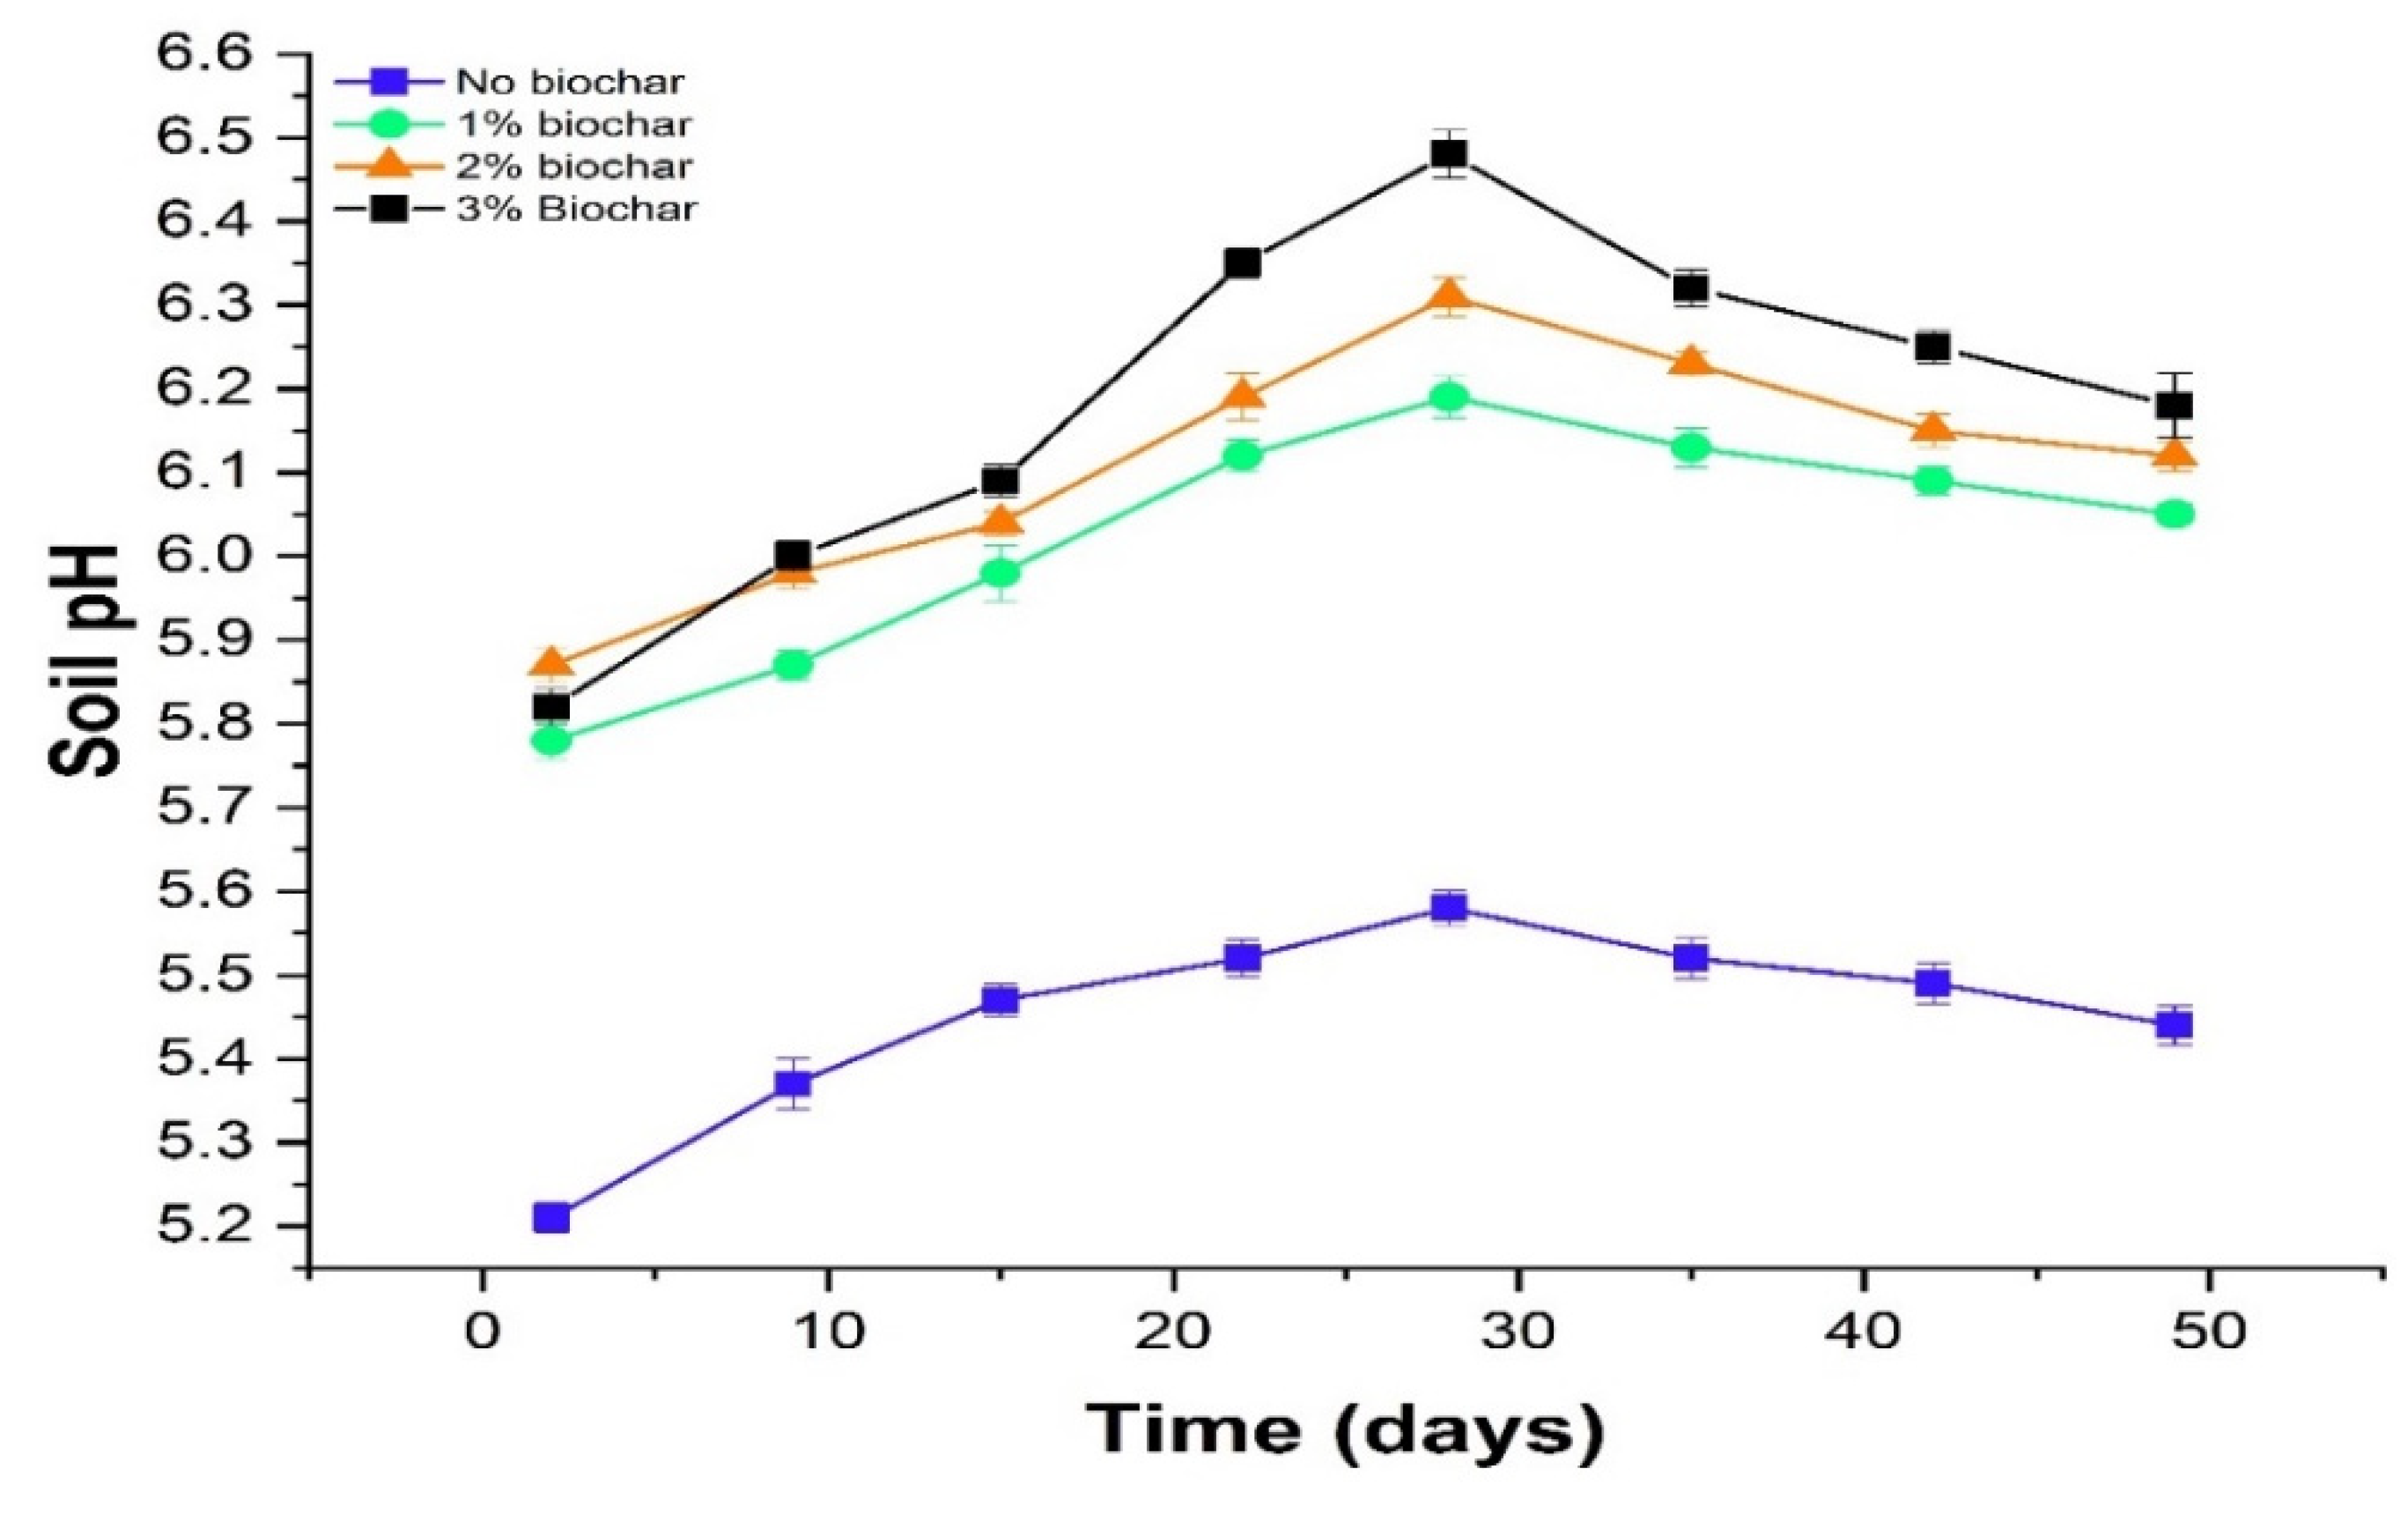
3.1. Effect of Rice Residue-Based Biochar on Soil pH

Biochar application significantly (p ≤ 0.01) affected the soil pH during the study period. However, the application of 3% biochar significantly increased the soil pH by 13.78% compared to the control (Figure 1). The biochar application (3%) increased the soil pH from 5.21 to 5.82 on day two, and afterward, pH showed an increasing trend up to 28 days, where pH reached the maximum value (6.48). Moreover, after 28 days, soil pH in biochar treated and control showed a decreasing trend until the end of the study (Figure 1).

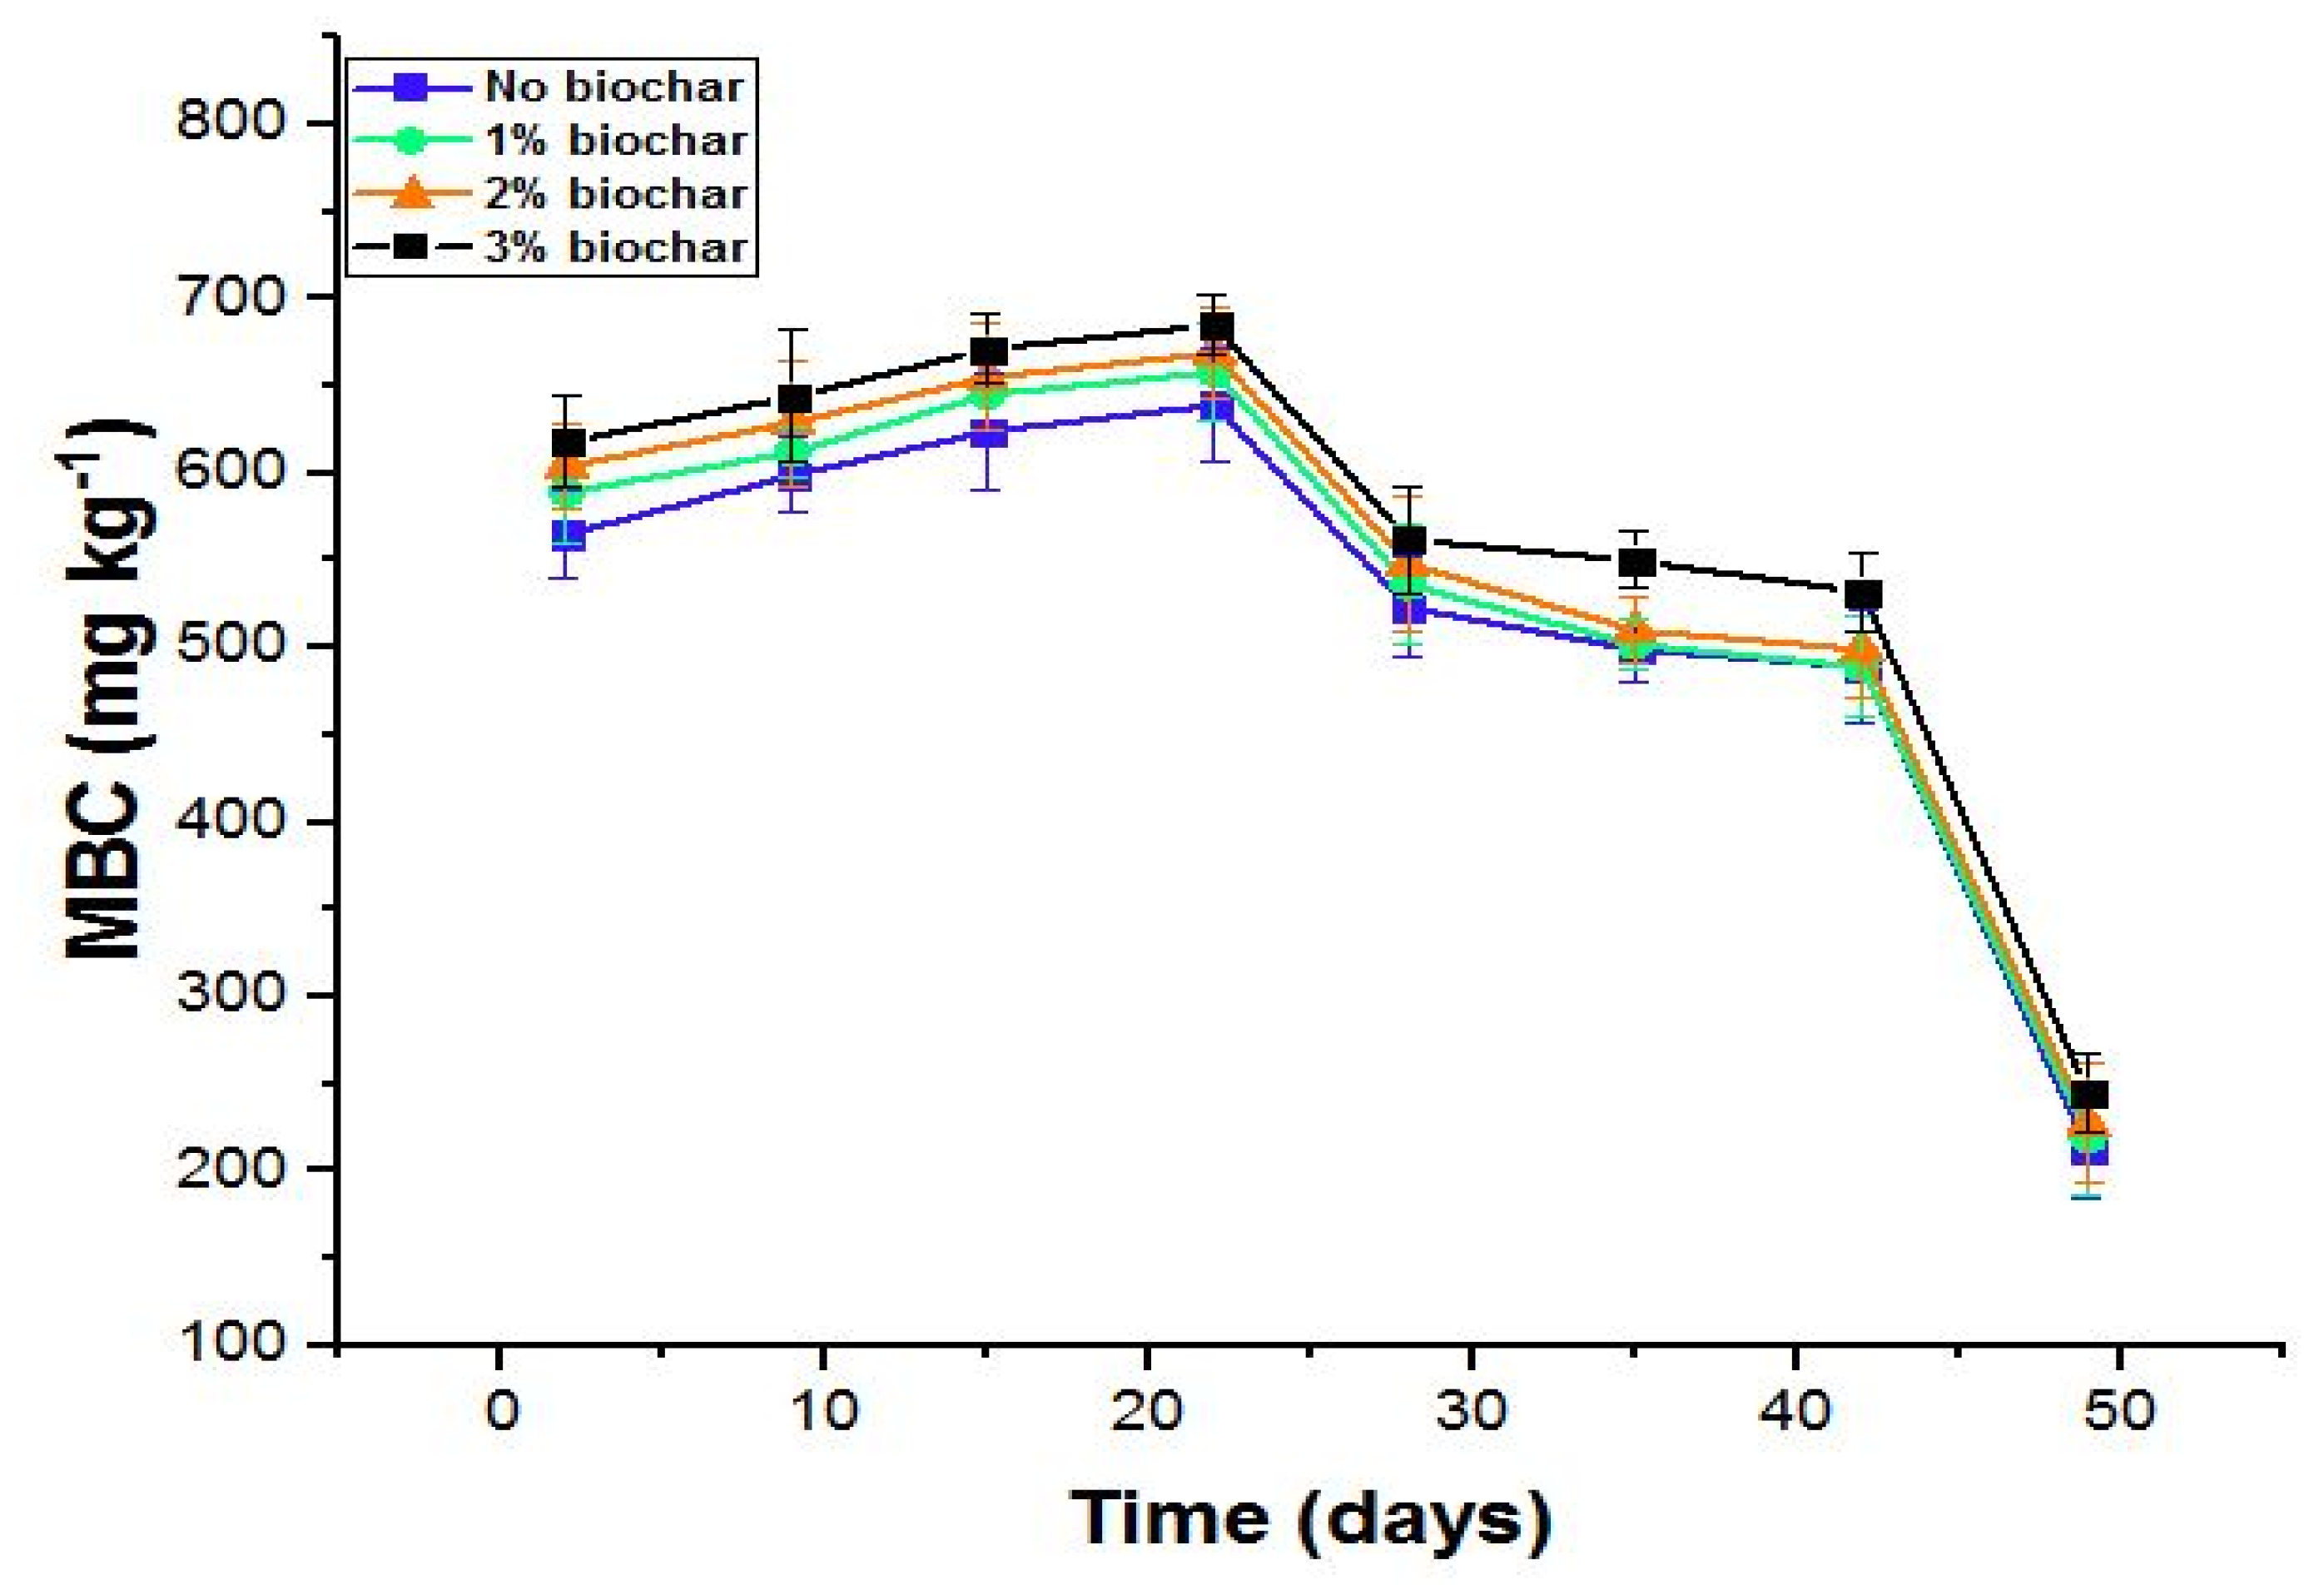
3.2. Effect of Rice Residue-Based Biochar on Soil Microbial Biomass Carbon

Biochar application significantly (p ≤ 0.01) affected the microbial biomass carbon (MBC) contents (Figure 2). A significant increase of 11.08% in MBC was noted with biochar addition compared to control (Figure 2). The increase in biochar application rate significantly increased the soil MBC (Figure 2). Soil MBC showed an increasing trend until day 22, with a maximum MBC (685 mg kg−1) recorded on day 22 with 3% biochar rate; after that, 2% biochar rate (669 mg kg−1), and a lowest MBC (639 mg kg−1) was recorded in control (Figure 2). After 22 days, soil MBC showed a decrease until the end of the study period (Figure 2).

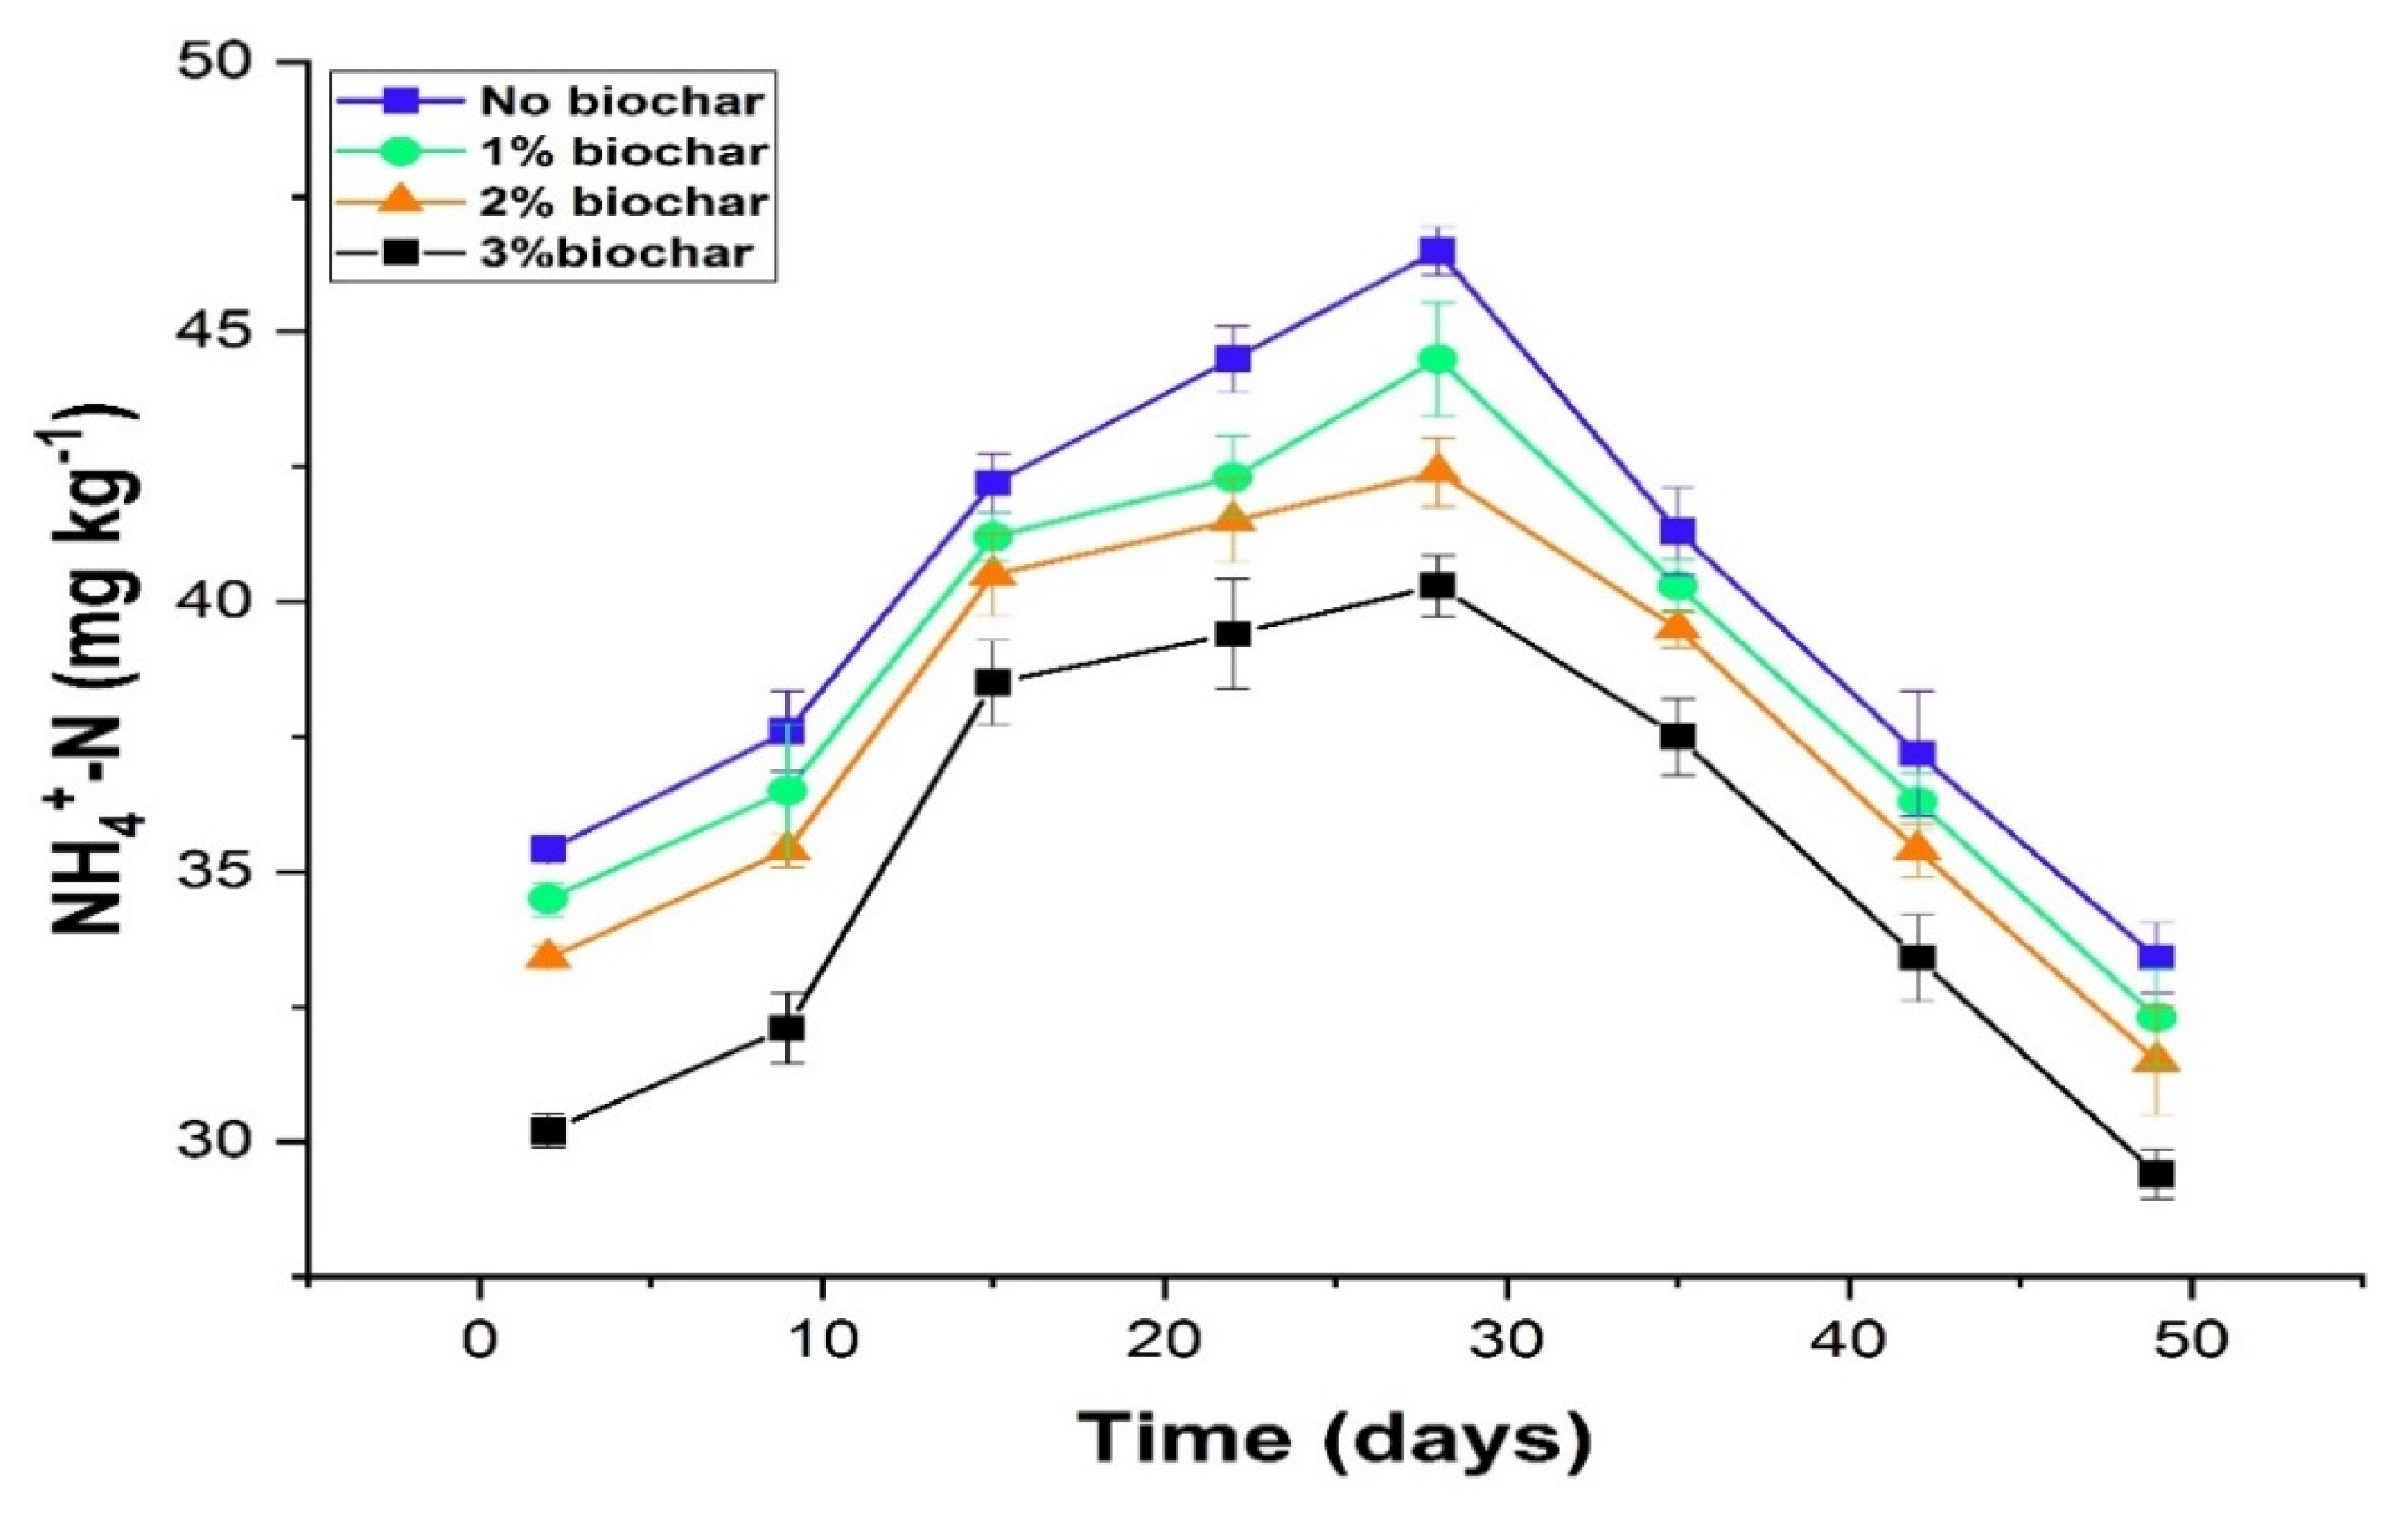
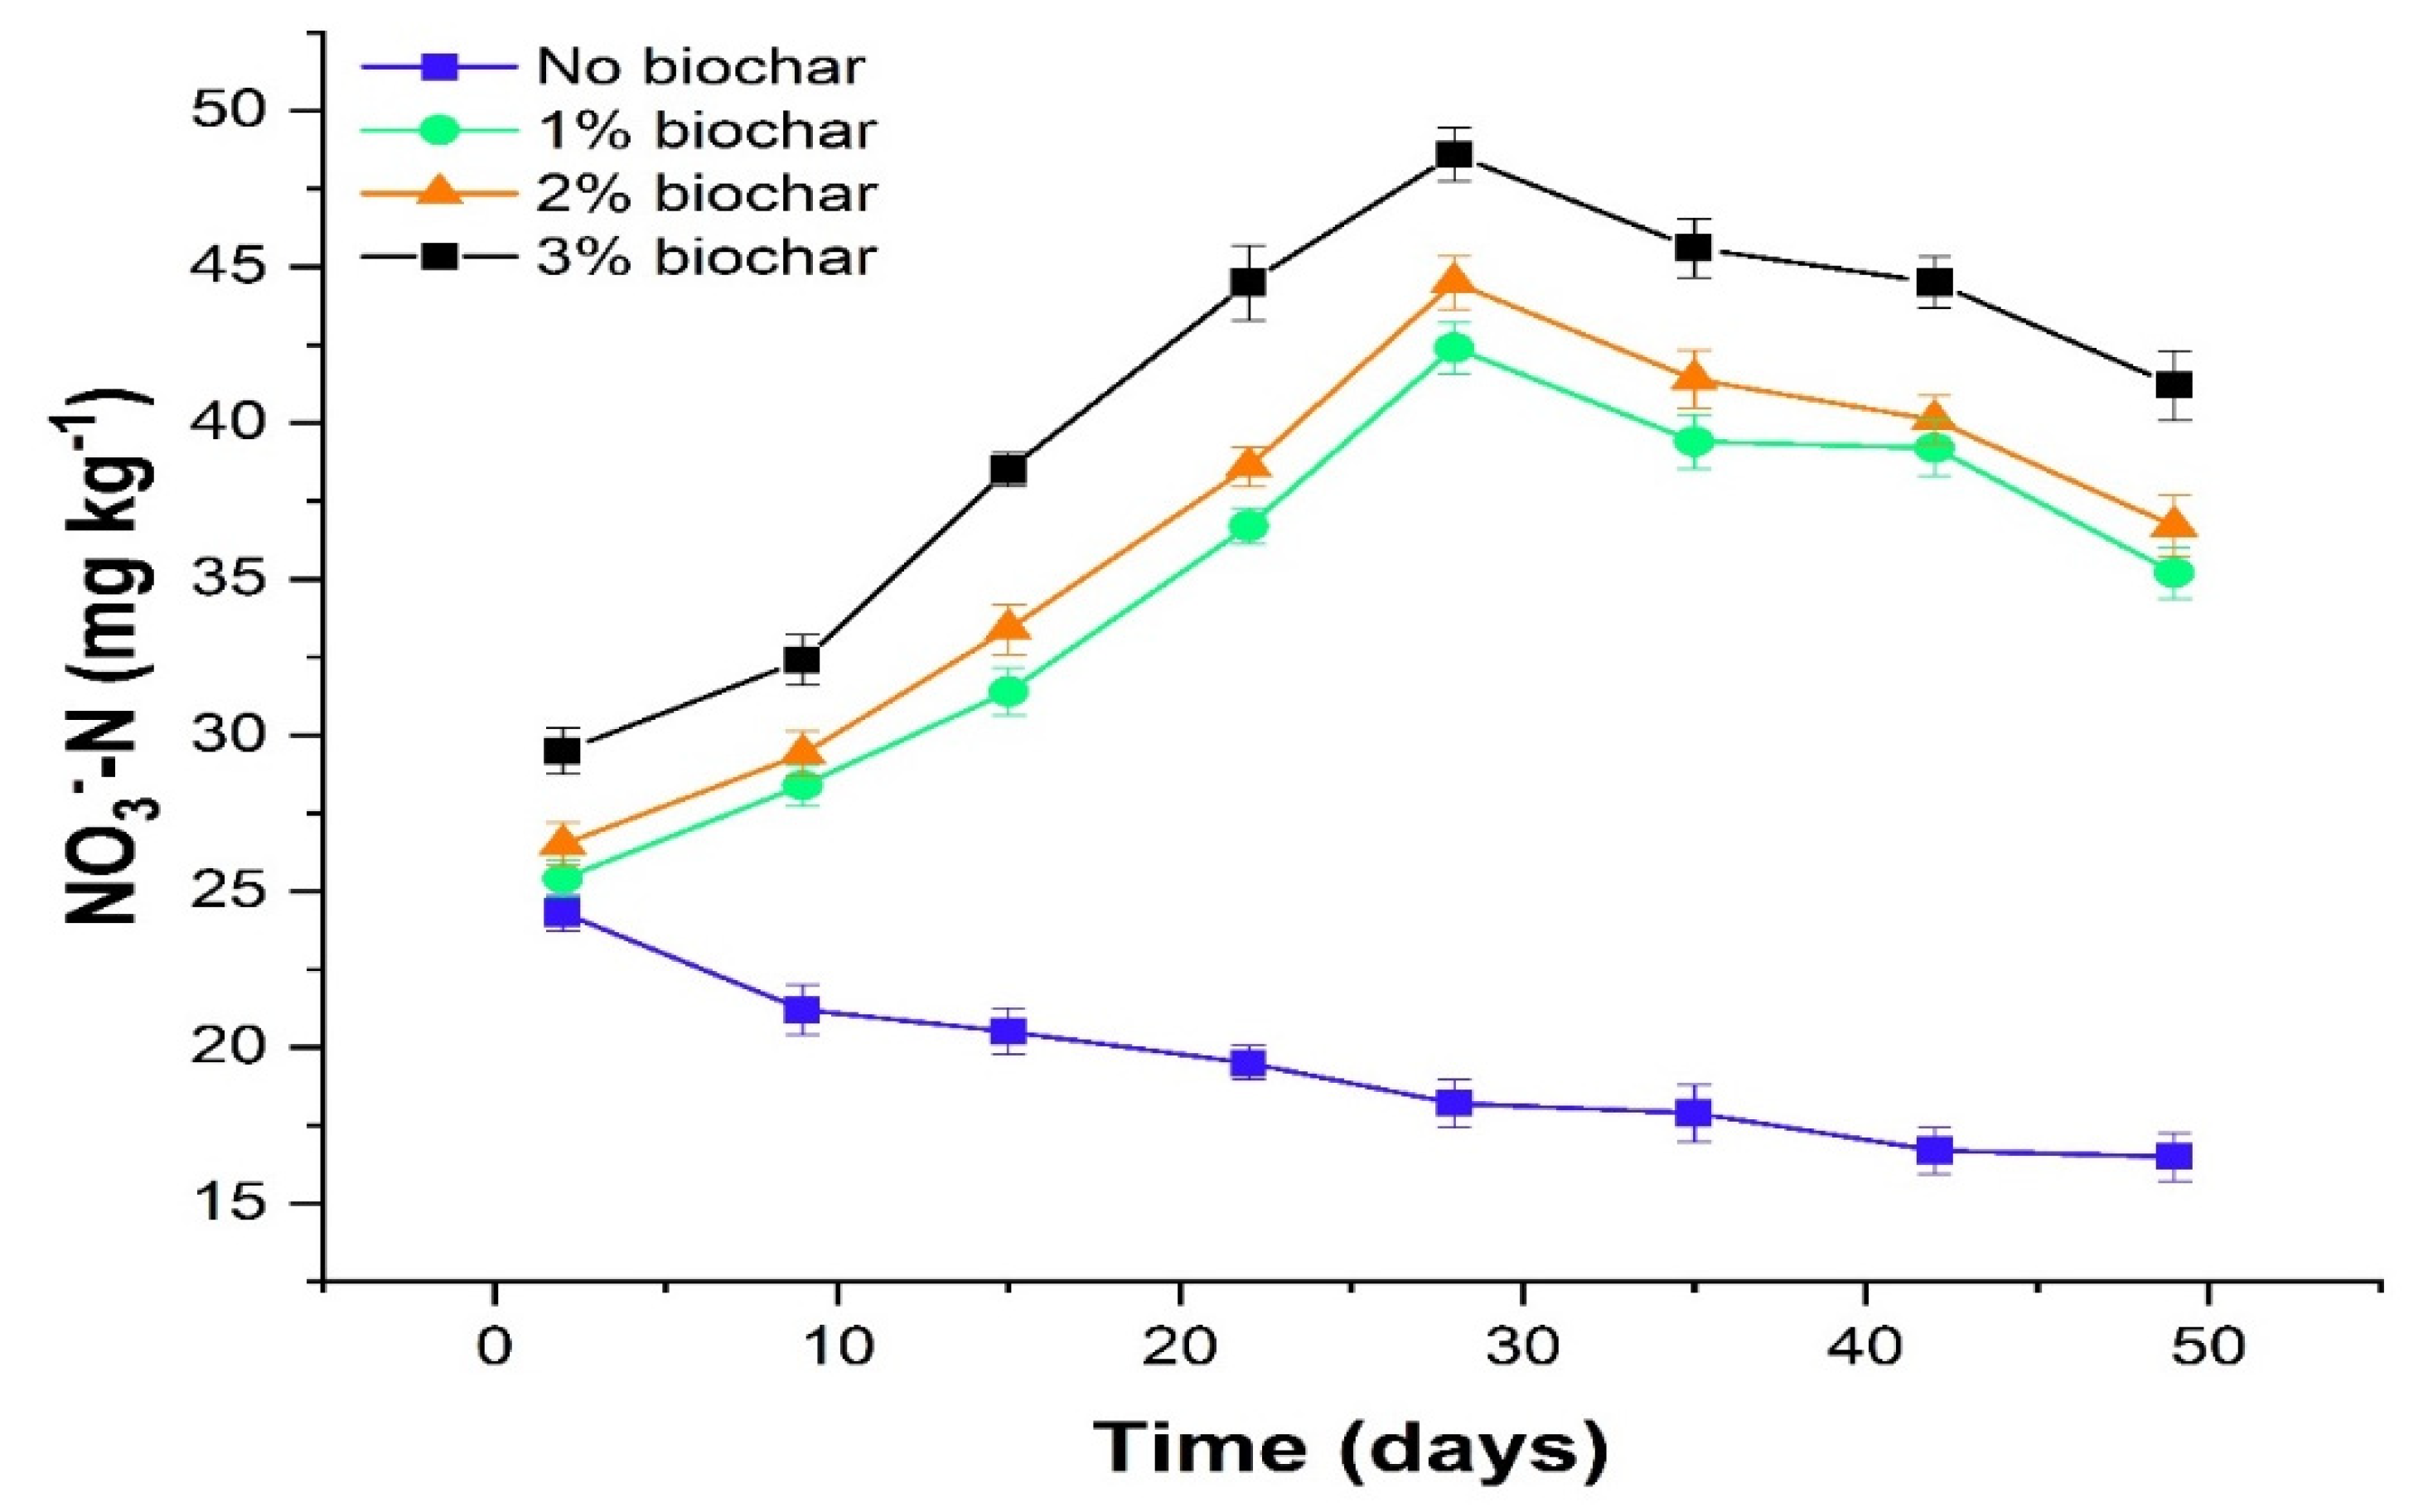
3.3. Effect of Rice Residue-Based Biochar on Soil Mineral Nitrogen (NH4+-N and NO3-N)

Soil NH4+-N content was markedly (p ≤ 0.01) influenced by diverse rates of biochar (Figure 3). The application of biochar increased the NH+4-N contents by 17.48% compared to control (Figure 3). The NH+4-N concentration at day 2 in control, 1%, 2%, and 3% biochar remained as 35.4, 34.5, 33.4, and 30.2 mg kg−1; however, after day 2 biochar application favored the significant reduction in NH4+-N concentration until day 28. On day 28, maximum NH4+-N concentration (46.5 mg kg−1) was noted in no-biochar addition; after that, 1% biochar and lowest NH4+-N concentration (42.4 mg kg−1) was noted in 3% biochar rate (Figure 3). Moreover, after 28 days, soil NH4+-N showed a declining trend in control and biochar-treated soils. Biochar application significantly (p ≤ 0.01) increased the soil NO3-N concentration. However, this increase was the maximum with a higher rate of biochar application (3%) compared to control and 1% and 2% biochar rate (Figure 4). In control soil, NO3-N concentration showed a decreasing trend from start to end. While in biochar application, NO3-N concentration showed an increasing trend from day 2 until day 28, and after soil NO3-N concentration was consistently decreased in biochar-treated soil until the end of the study (Figure 4). The overall trend of soil NO3-N concentration for biochar application was recorded as: 3% > 2% > 1% > control (Figure 4).

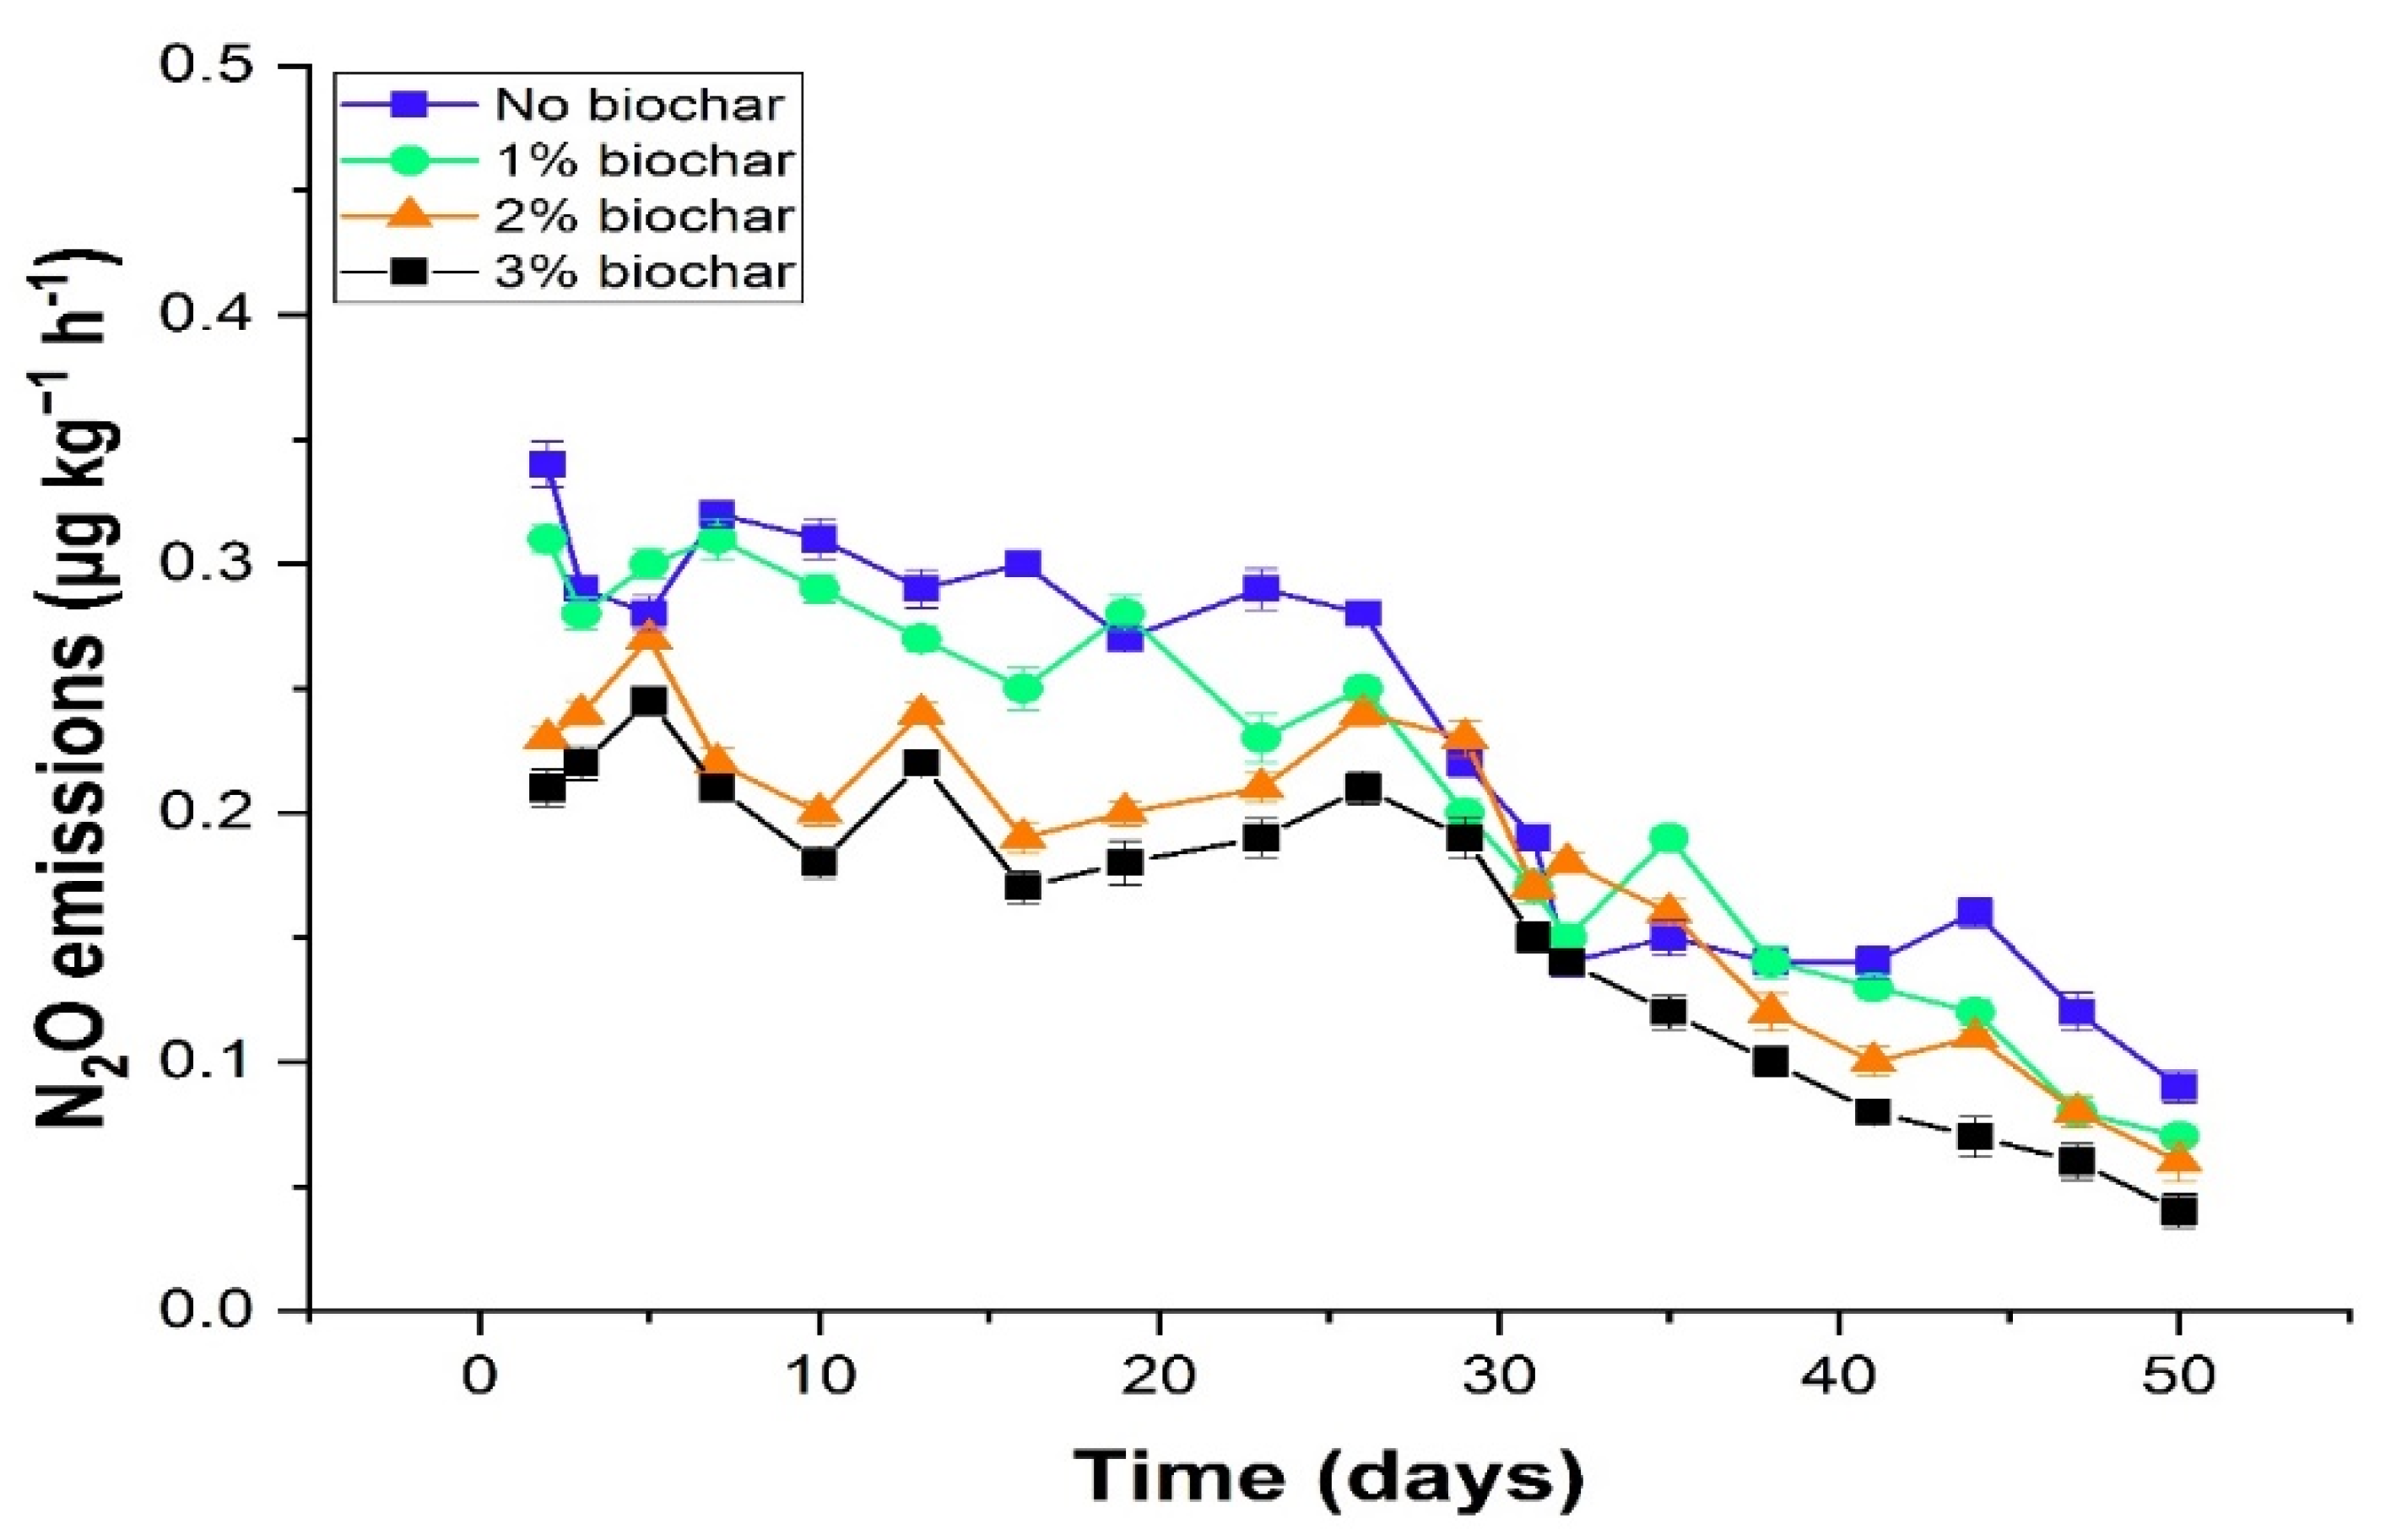
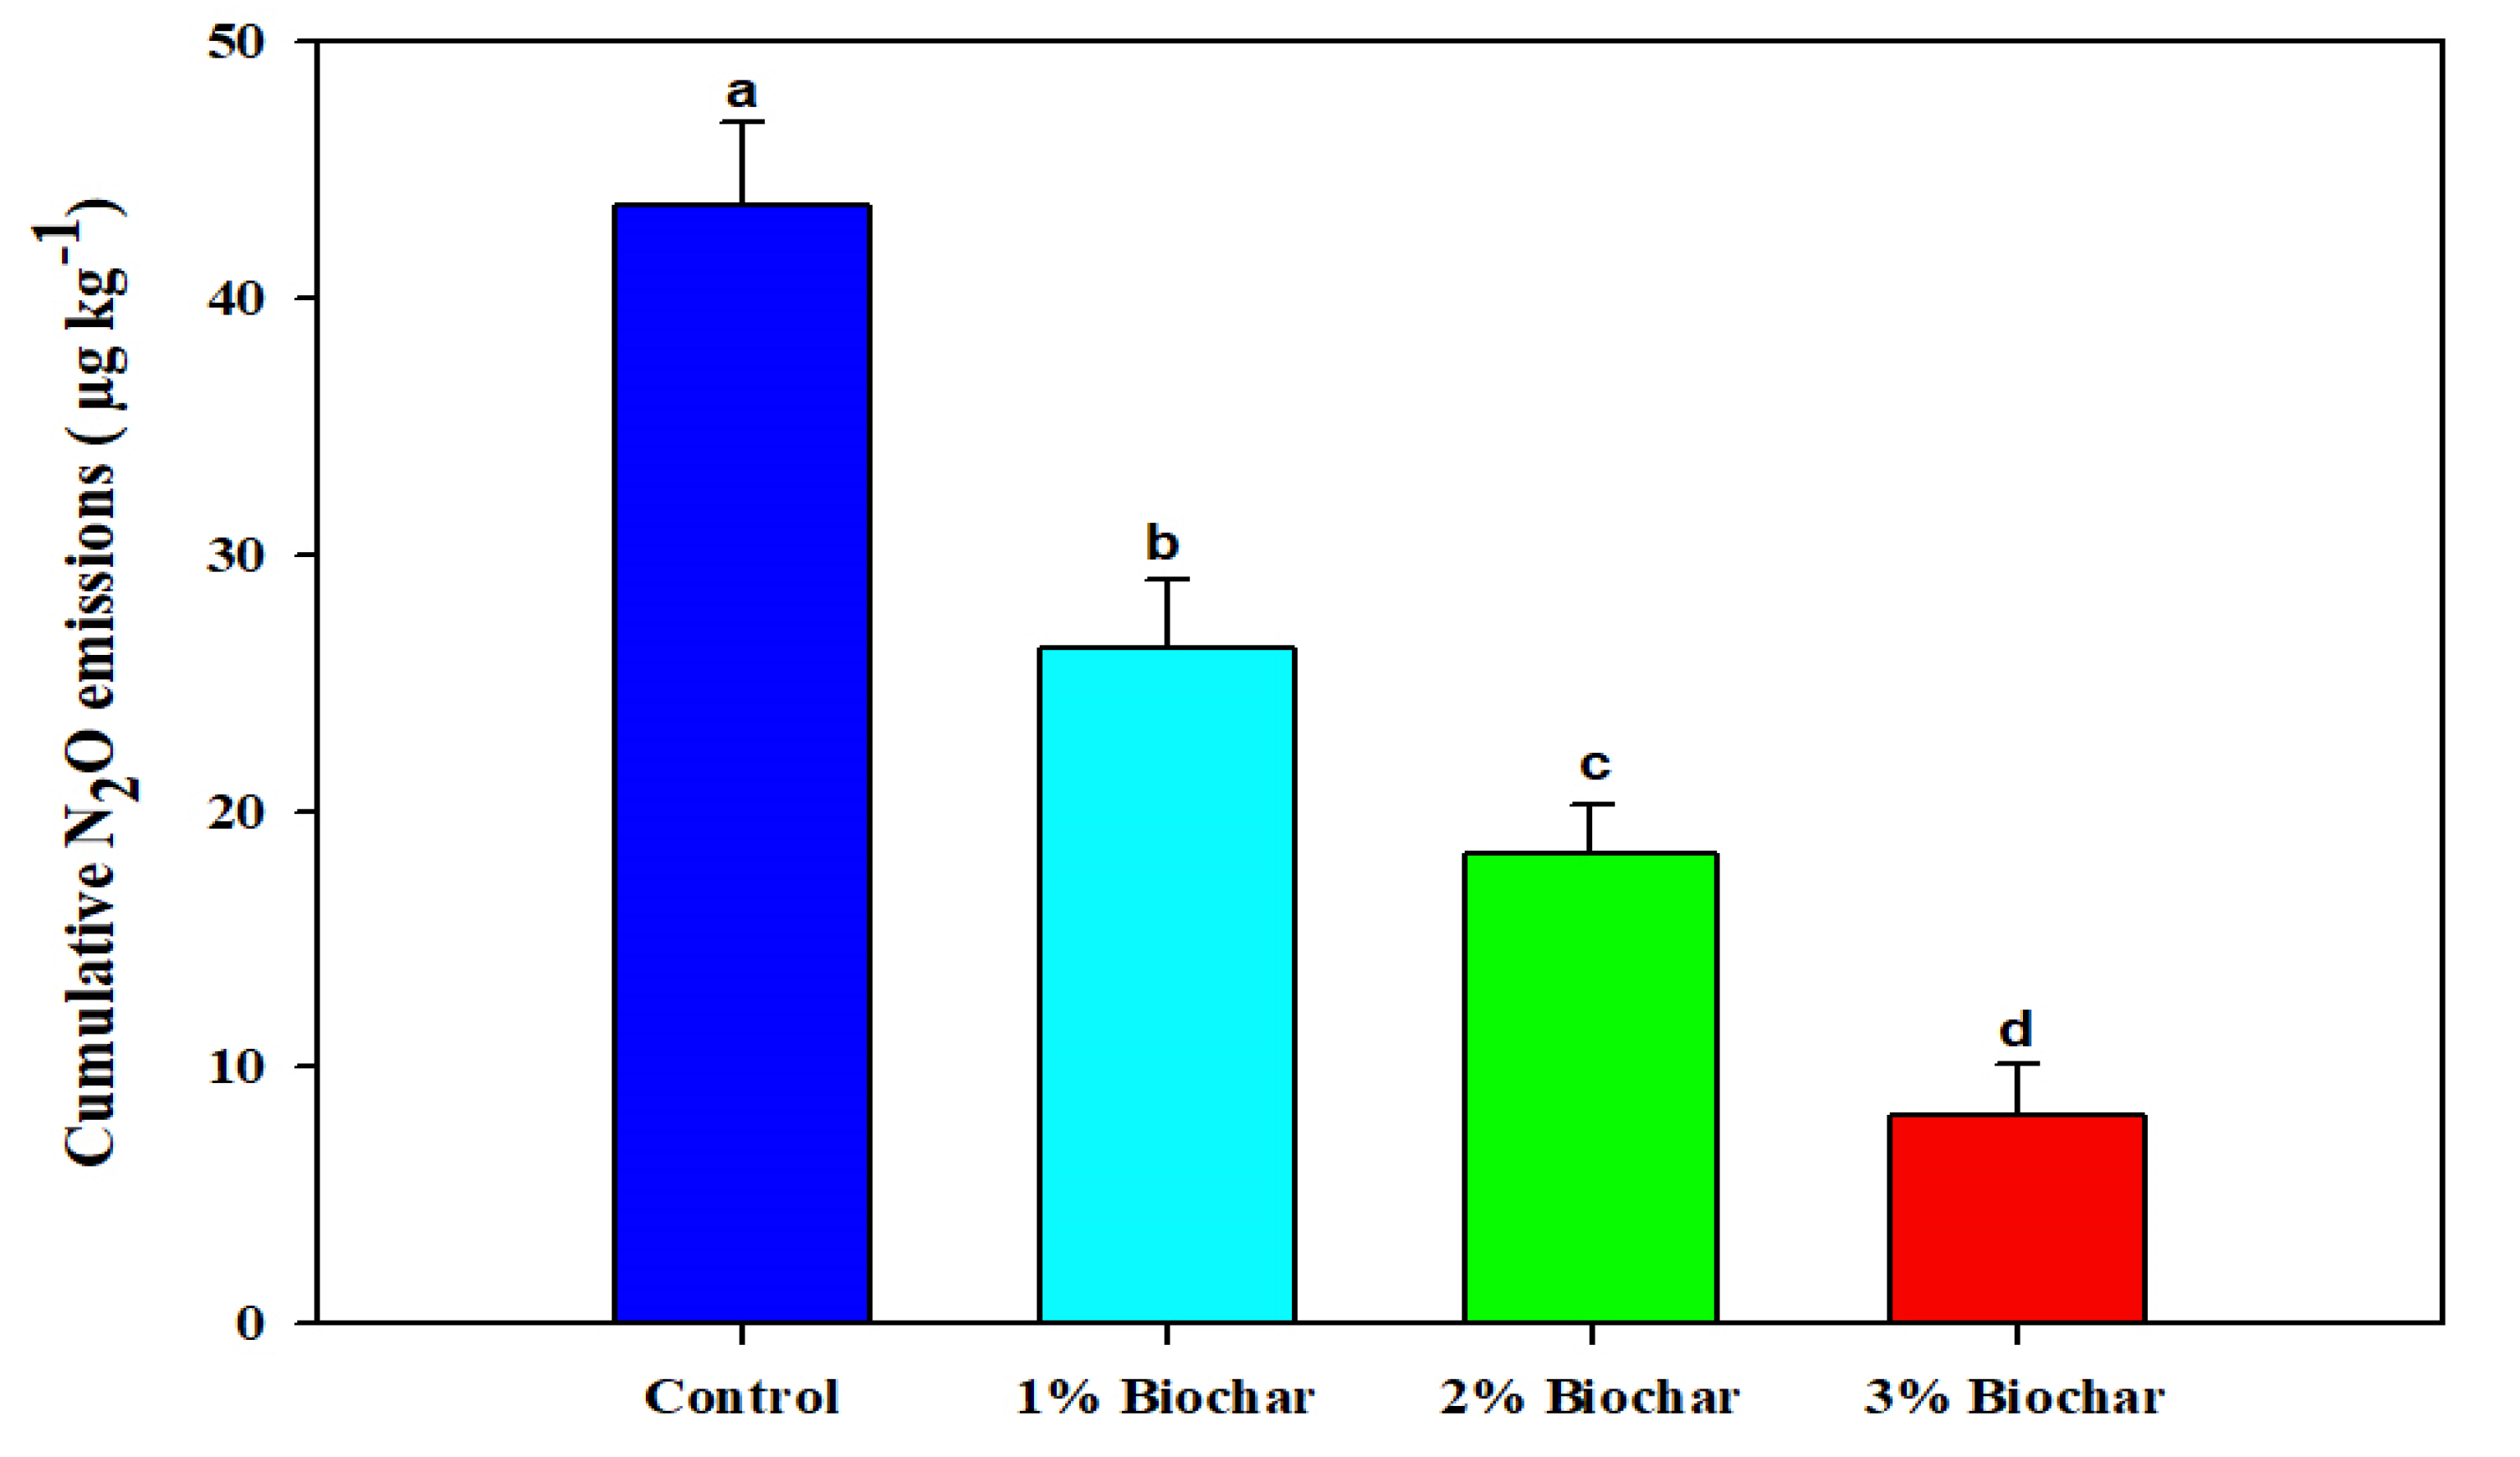
3.4. Effect of Rice Residue-Based Biochar on Soil N2O Emissions

Biochar application had a significant (p ≤ 0.01) impact on soil N2O emissions (Figure 5). N2O emissions were significantly higher in control; after that, 1% and 2% biochar application and the lowest N2O emission was recorded in 3% biochar application (Figure 5). The application of 3% biochar markedly reduced the N2O emission by 462% compared to control. Moreover, the highest N2O emission (0.34 µ g kg−1 ha−1) was recorded on day 2 in the control soil; after that, 1% biochar and 2% and 3% application (Figure 5). After day 2 N2O emissions showed an inconsistent trend until the end of the study period. The 3% biochar application remained the most effective, and it significantly reduced the N2O emissions compared to the 1% and 2% biochar rate and control (Figure 5). The biochar application also reduced the cumulative N2O emission compared to control (Figure 6). The highest cumulative N2O emission was recorded in control (no biochar), while the lowest N2O emission was recorded in soil treated with 3% biochar (Figure 6). The application of 3% biochar reduced N2O emissions by 462%, whereas 2% biochar and 1% biochar application reduced the N2O emissions by 225% and 113% compared to control (Figure 6).

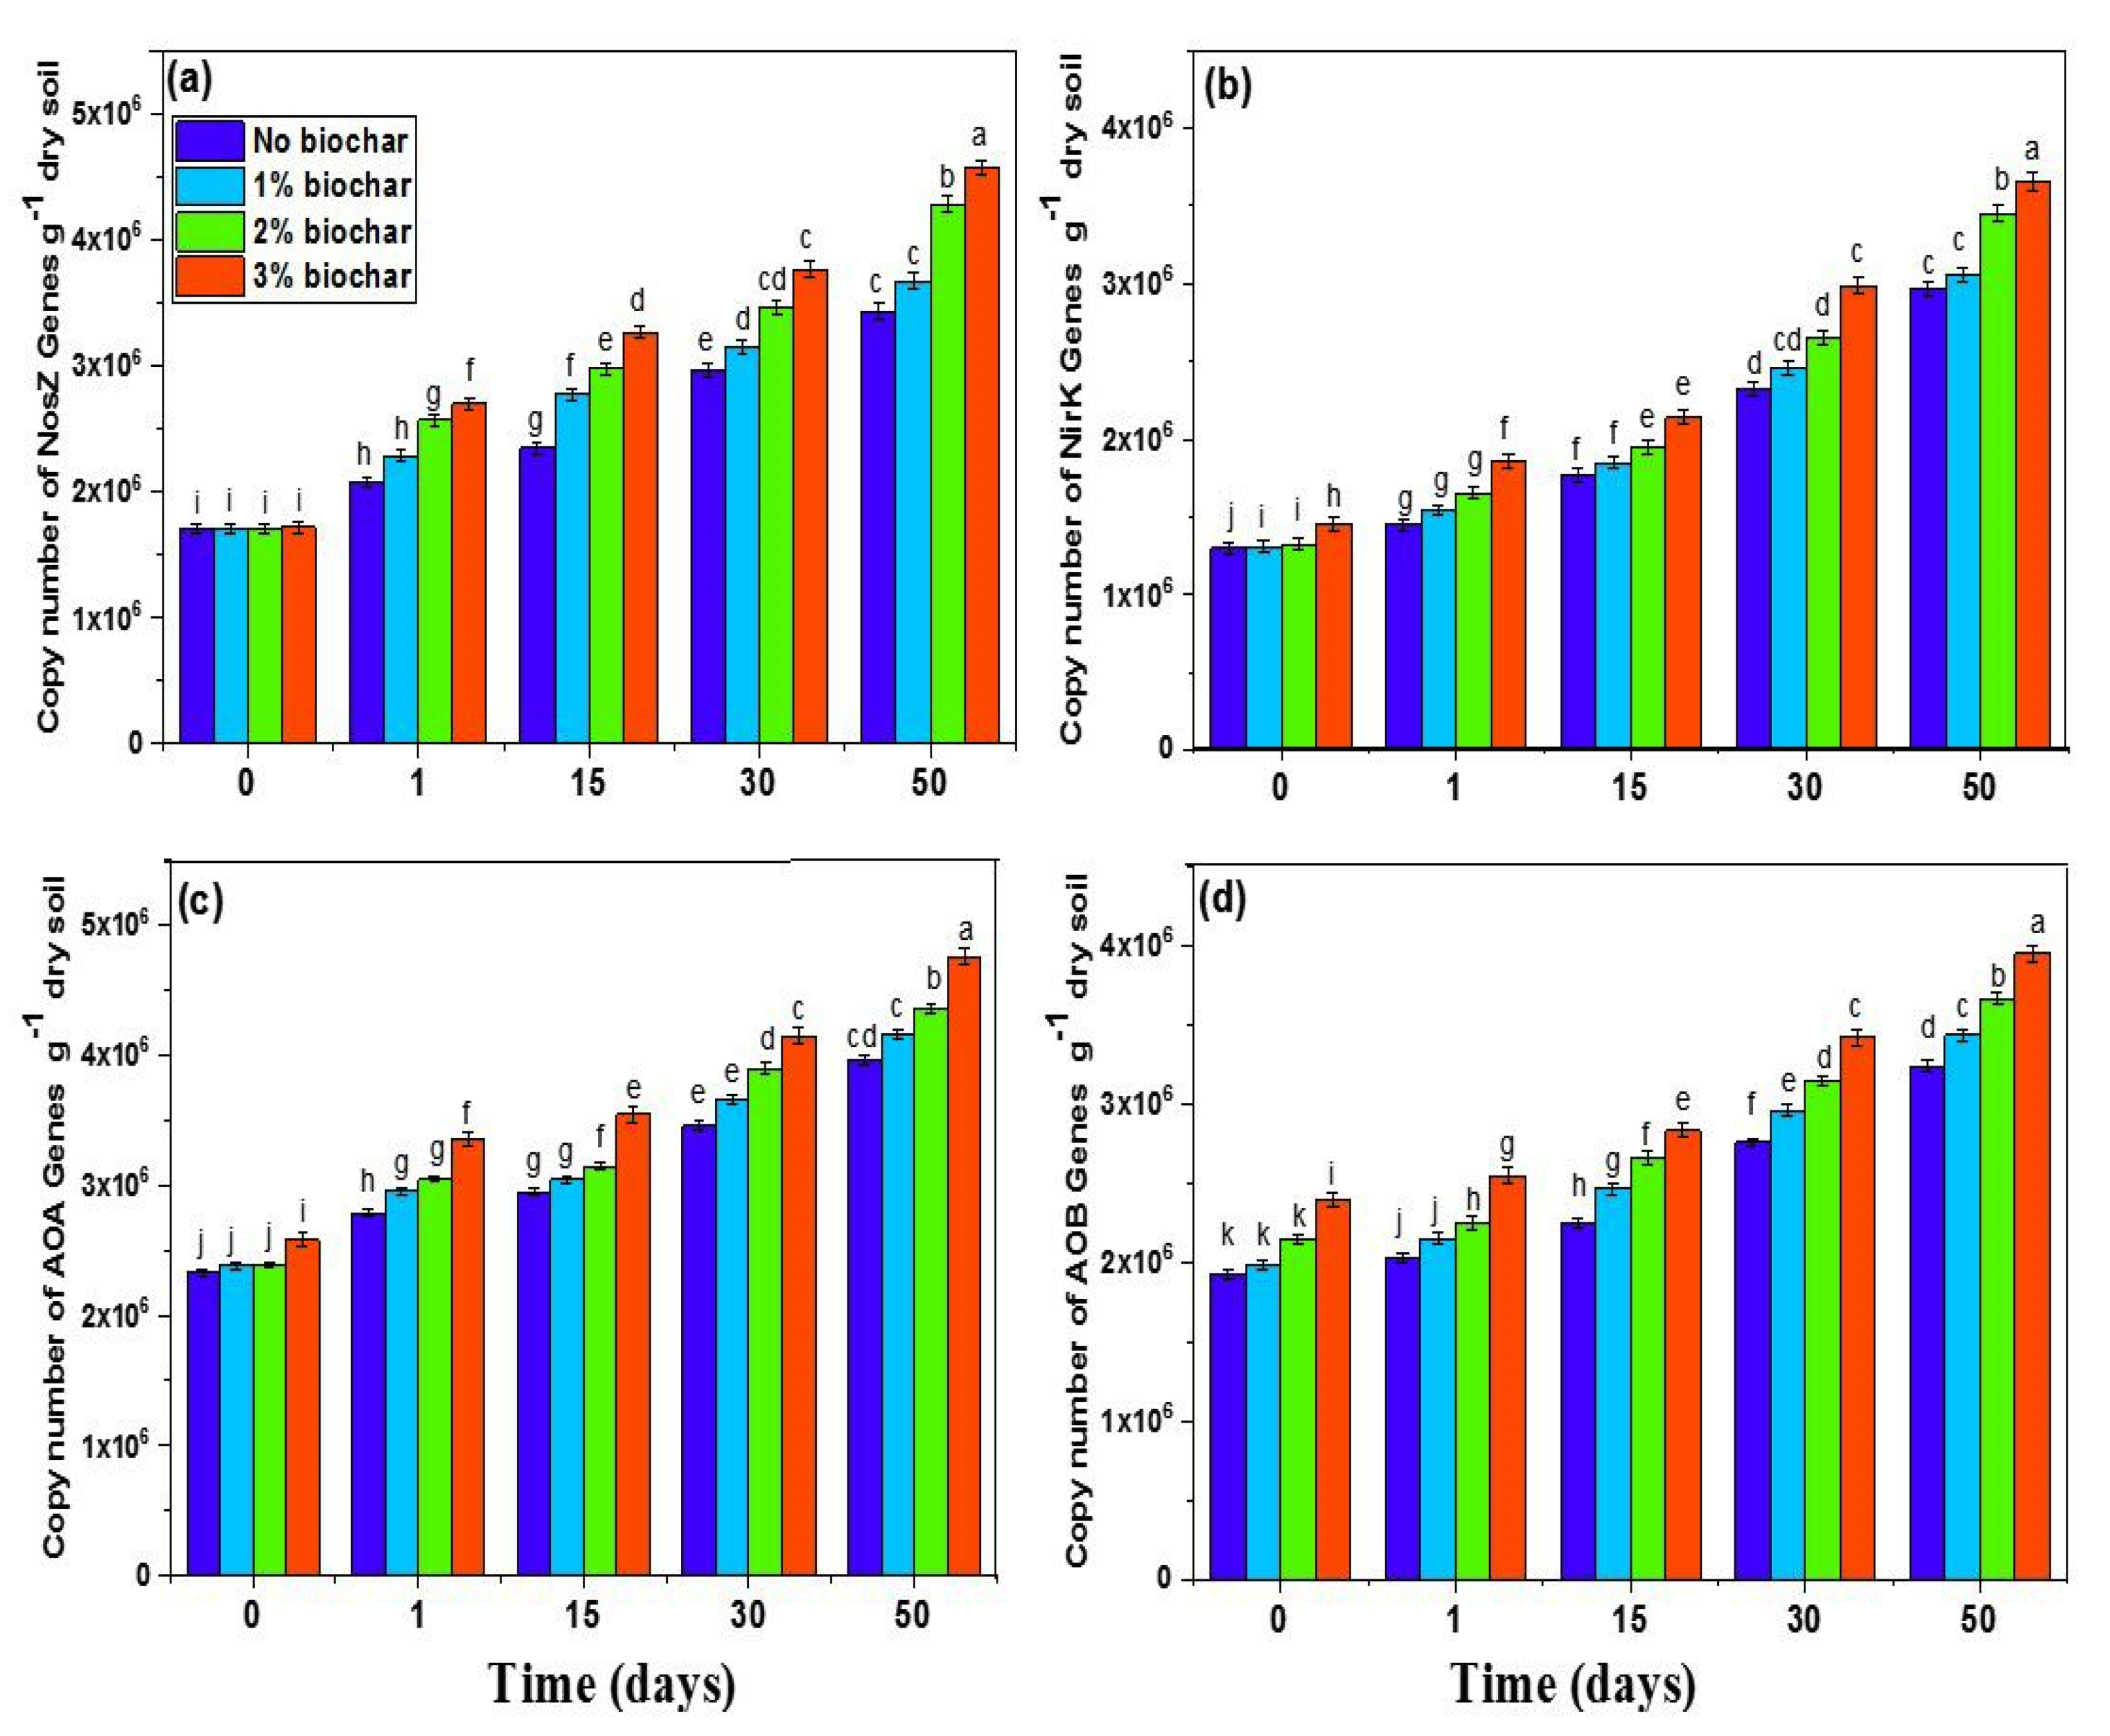
3.5. Effect of Rice Residue-Based Biochar on Gene’s Abundance

Biochar application showed a significant (p ≤ 0.01) positive influence on nitrous oxide reductase (nosZ), nitrite reductase (nirK), ammonia-oxidizing archaea (AOA), and ammonia-oxidizing bacteria (AOB) abundance during the study period (Figure 7). At the start of the study, there was no significant difference in genes abundance for control and biochar treated soils (Figure 7). Overall, maximum nosZ and nirK genes during the study period were recorded in soil treated with 3% biochar; after that, 2% biochar and the lowest number of both nosZ and nirK genes were recorded in control (Figure 7a,b).
AOA and AOB were similar in control and biochar treated soils at the start of the study; however, both genes showed an increasing trend until the end of the study and reached a maximum value at 45 days (Figure 7c,d). On day 45, the maximum number of AOA genes (4.75 × 10⁶ g−1 dry soil) was recorded in soil treated with 3% biochar; after that, 2% biochar (4.35 × 10⁶ g−1 dry soil) and 1% biochar and the lowest number of AOA genes (3.95 × 10⁶ g−1 dry soil) was recorded in control soil (Figure 7c). Likewise, a higher number of AOB genes (3.94 × 10⁶ g−1 dry soil) at day 45 was recorded in 3% biochar amended soil followed closely with 2% biochar amended soil (3.65 × 10⁶ g−1 dry soil) and a minimum number of AOA genes (3.23 × 10⁶ g−1 dry soil) was recorded in control un-amended soil (Figure 7d).

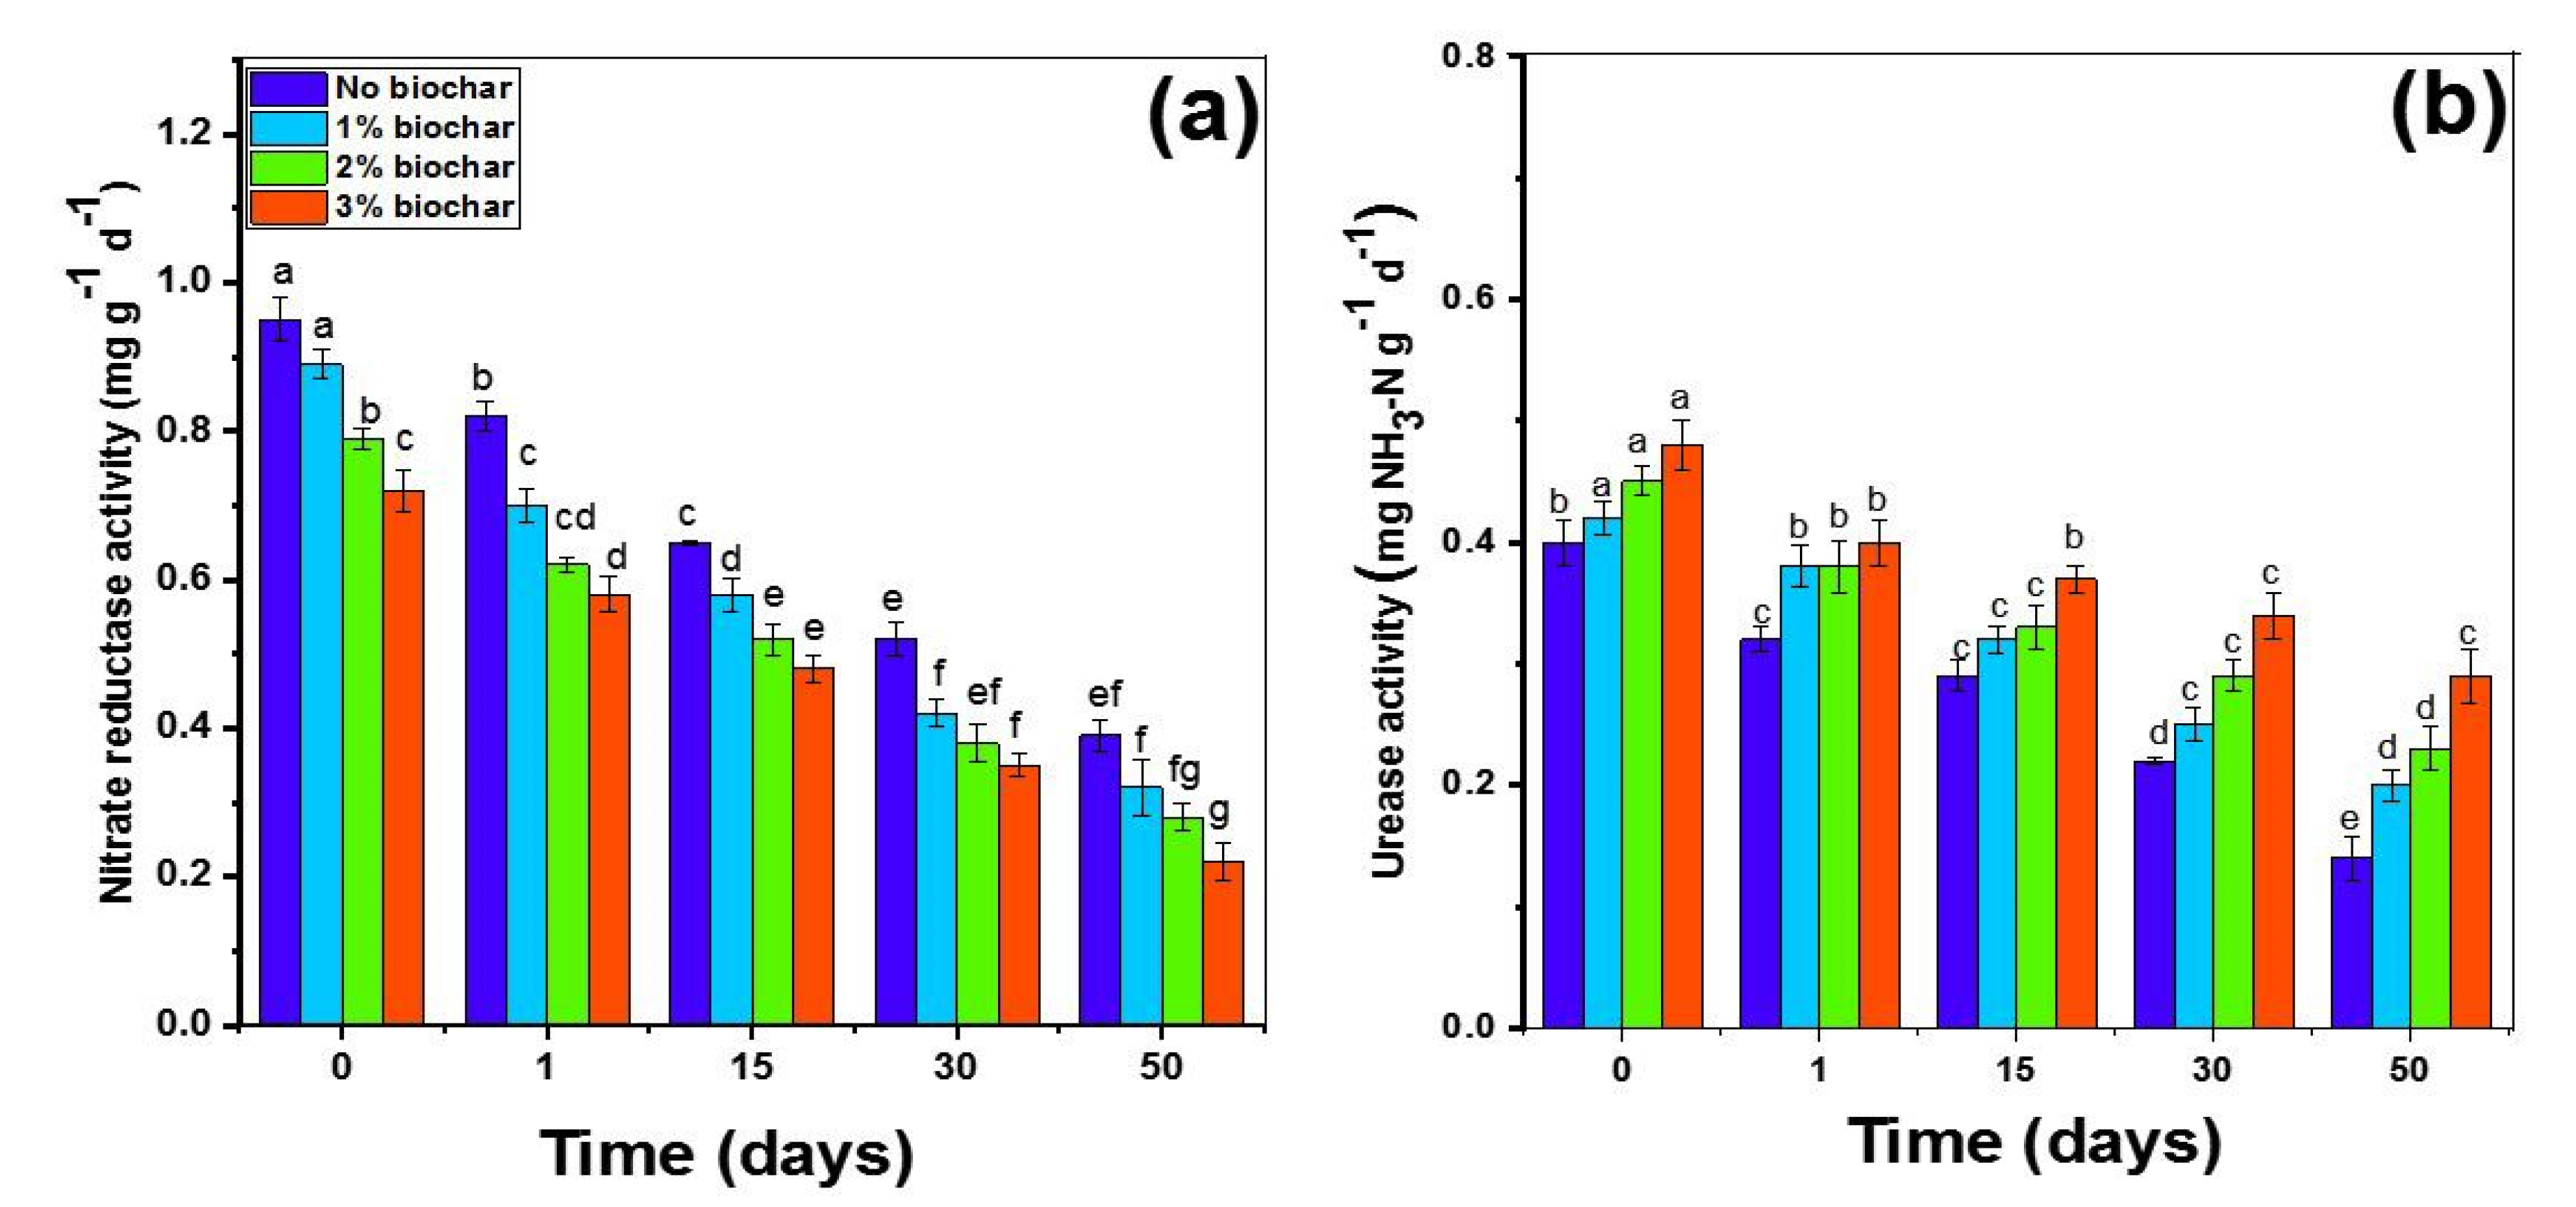
3.6. Effect of Rice Residue-Based Biochar on Soil Enzymatic Activities

The activities of both enzymes nitrate reductase (NR) and urease (UR) were significantly (p ≤ 0.01) different among control and biochar amended soils (Figure 8). Biochar application significantly inhibited the activity of NR by 32% during the study period compared to control (Figure 8a). However, it was dose-dependent, and a higher rate of biochar (3%) considerably inhibited the NR activity compared with the 1% and 2% biochar rate and control (Figure 8a). The NR activity was found maximum at the start of the study control soil, and after that, 1%, 2%, and 3% biochar rate; after that, NR activity showed a consistent decrease until day 45, whereas again, the maximum NR activity was noted in control and the lowest NR activity was noted in 3% biochar rate (Figure 8a). Conversely, the addition of different biochar rates improved the UR activity by 18.24% compared to control (Figure 8b). The maximum UR activity (0.48 NH3-N g−1 d−1) was recorded at the start of the study in soil treated with 3% biochar; after that, 2% biochar treated soil, and the lowest UR activity (0.4 NH3-N g−1 d−1) was recorded in control. After that, UR activity showed a decreasing trend in both biochar amended soils and control (Figure 8b).

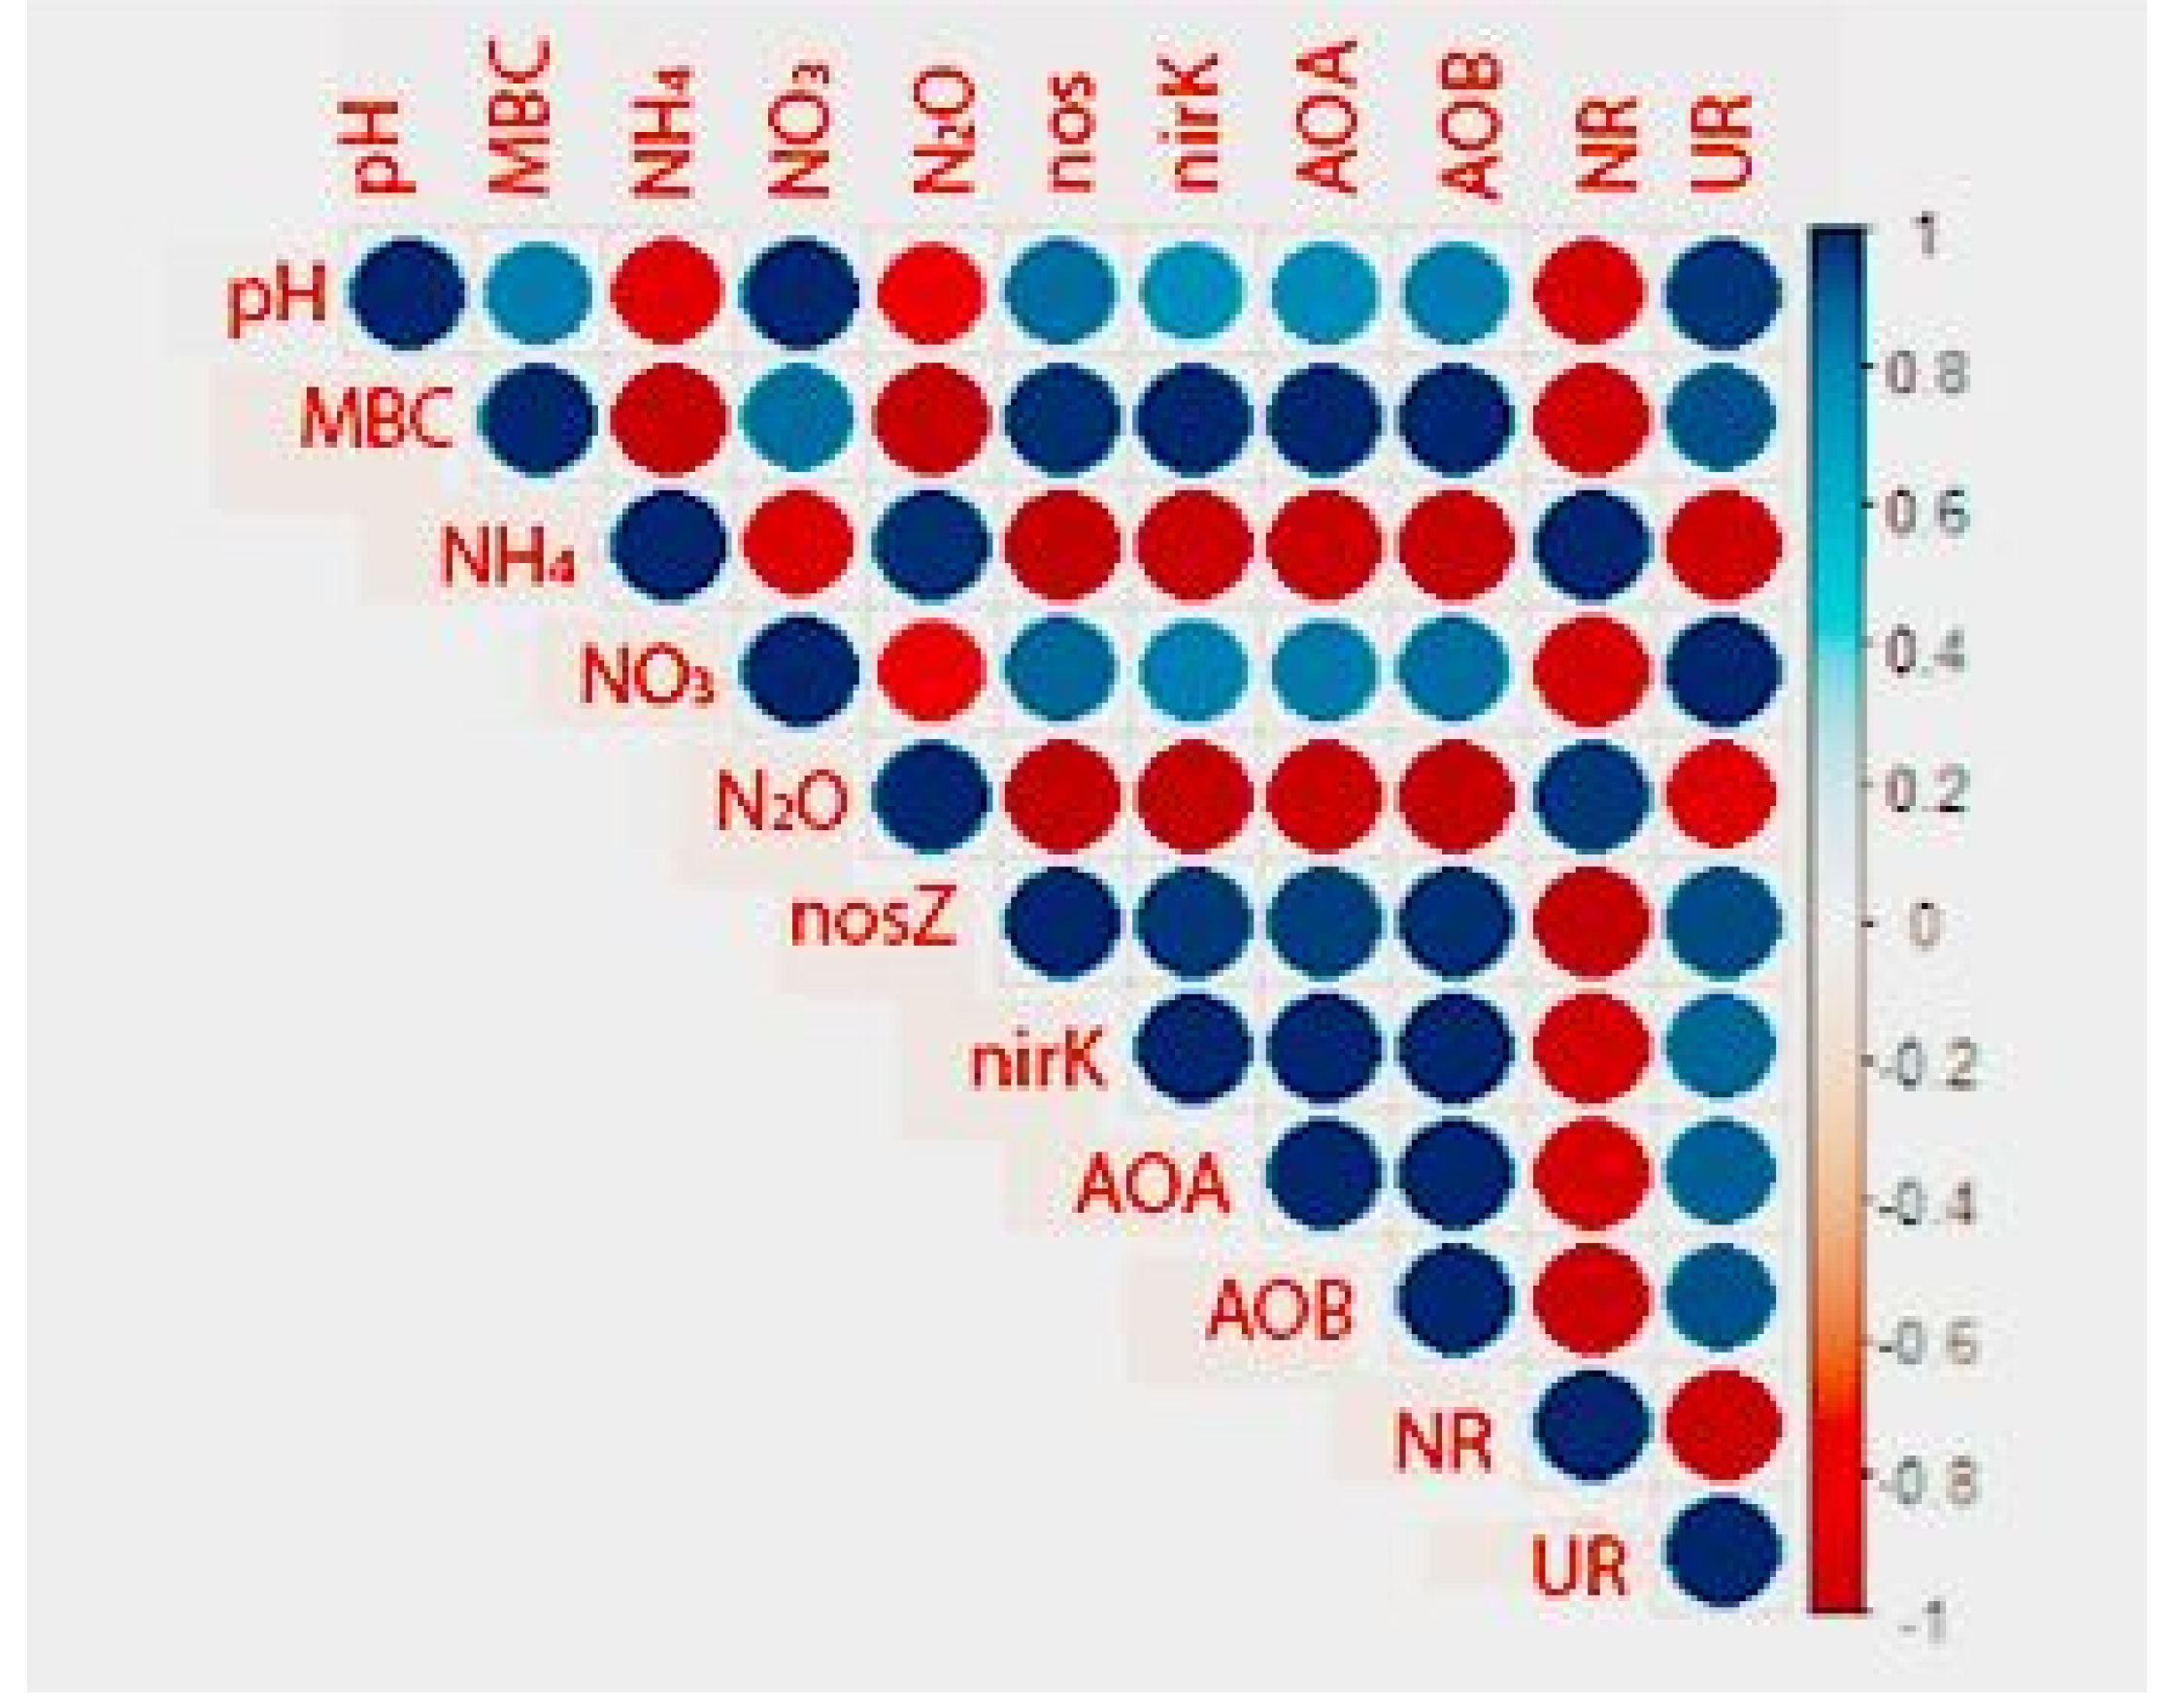
3.7. Correlation Analysis

The data were subjected to Pearson’s correlation analysis to determine the relationship between different studied traits (Figure 9). Soil N2O emission was positively linked with NH4+-N contents; however, N2O emissions were negatively linked with soil pH, NO3-N, genes abundance, and NR activity. Moreover, a strong positive correlation was noted between N2O emissions and NH4 contents, whereas a strong negative association was recorded between N2O emission and soil pH, NO3, genes abundance, and NR activity (Figure 9).

4. Discussion

Soil pH is the most important factor that affects the N2O emission from soils [5]. Thus, altering soil pH triggers not only the various soil biochemical processes but also affects soil health and N2O emission [33]. Biochar addition significantly augmented the soil pH (Figure 1). However, the application of biochar (3%) significantly increased the soil pH compared to 1% and 2% biochar application and control (Figure 1). The increase in soil pH altered the soil microbe’s activity and regulated the microbial N availability, therefore affecting the soil N2O emission [34]. The N2O emissions in the current study were negatively associated with soil pH, and the application of 3% substantially increased soil pH and resulted in minimum N2O emissions (Figure 5). Higher soil pH suppresses NR activity that converts the NO3 into NO2 [35]. Indeed, rice residue biochar expressively reduced NR activity, particularly at a 3% biochar rate, and enhanced the NO3 and decreased the NO2 and consequently N2O emission. Therefore, biochar-induced augmentation in soil pH is a possible mechanism for reducing N2O emissions from acidic soils [1].
Mineral nitrogen plays a significant role in N2O production soils. Likewise, NH4 acts as a reaction substrate of nitrification and plays an impervious role in N2O emissions from soils [36]. In the current study, the application of biochar reduced the NH4 availability (Figure 3), which correlated with lower N2O emissions. Previously, some researchers also noted that biochar application reduced the NH4 availability in soils [14,37]. These researchers recorded that biochar reduced the NH4 availability due to oxidation of biochar surface and its ability to absorb the NH4 due to the presence of large adsorption sites, thus resulting in a reduction in NH4 availability and subsequent N2O emissions. The reduction in NH4 content in biochar-treated soil showed a lack of nitrification substrate that resulted in a significant reduction in N2O emissions (Figure 5). NO3 is a major reaction substrate for de-nitrification that involves the conversion of NO3 into NO2 and finally into N2O [13]. In the current study, the application of biochar increased the NO3 contents (Figure 4). This increase in NO3 contents was due to a decrease in NR activity following the addition of biochar, thus leading to the accumulation of N3O [38] and resulting in a reduction in N2O emissions. Thus, in this study, we believe that de-nitrification is main process linked with a biochar-induced reduction in N2O emissions. Additionally, NO3 promoted microbial activity for N2O reduction and thus indirectly reduced N2O emissions [39]. We noted a more pronounced inhibitory effect on N2O emission at higher biochar application compared to lower rates (Figure 5). The higher biochar application provides favorable conditions for reducing bacteria, and it increasing nosZ genes abundance, thus significantly reduces the N2O emissions [40].
AOA, AOB, nosZ, and nirK genes play a significant role in de-nitrification, and nosZ genes are mainly linked with the N2O reductase enzyme (N2OR), which involves in the conversion of N2O to N2 [41]. In the current study, the application of biochar significantly increased the abundance of AOA, AOB, nosZ, and nirK genes (Figure 7). The variable rates of biochar (1%, 2%, and 3%) inhibited N2O emission because of the increase in abundance of nosZ genes that promote the N2O reduction into N2 [42,43]. Nonetheless, the abundance of nosZ genes significantly increased with increasing soil pH (Figure 1). Biochar application enhanced the transcription of nosZ genes at higher pH [44] and led to a reduction in N2O emissions. Moreover, higher N2O emissions (Figure 5) in control (no biochar soil) can be attributed to restricting the functioning of N2OR at low pH owing to less transcription of nosZ genes [45]. Thus, this investigation provides evidence that biochar increased the abundance of nosZ genes, which in turn increased the bacterial ability to synthesize the N2OR, consequently reducing the N2O emissions.

5. Conclusions

The rice residue-based biochar significantly inhibited the N2O emission compared to un-amended soil. The application of a higher biochar rate (3%) increased the soil pH, genes abundance (AOA, AOB, nosZ, and nirK), NO3, and decreased the NH4 contents and reductase activity, and inhibited N2O emission. Thus, this study indicates that biochar-induced inhibition in N2O emission from acid soils is linked with increased soil pH, genes abundance, and decreased NH4+ contents. Additionally, this study also indicates that the amount of biochar application is crucial to maximize the inhibitory effect of biochar on N2O emissions from acidic soils.

Author Contributions

Conceptualization, M.A. and G.H.; methodology, M.A.; resources, G.H.; data curation, M.A.; writing—original draft preparation, M.U.H. and M.A.; writing—review and editing, M.B.C., A.M., M.N., M.S., F.R., M.B., A.R., H.T., Z.C. and J.S.; funding acquisition, G.H. All authors have read and agreed to the published version of the manuscript.

Funding

This work was supported by the National Key R&D Program of China (2016YFD0300208); National Natural Science Foundation of China (41661070); and Key disciplines (construction) of ecology in the 13th Five-Year Plan of Jiangxi Agricultural University.

Data Availability Statement

Not applicable.

Acknowledgments

This research was funded by the National Key Research and development Program of China (2016YFD0300208) and National Natural Science Foundation of China (41661070); Key disciplines (construction) of ecology in the 13th Five-Year Plan of Jiangxi Agricultural University.

Conflicts of Interest

The authors declare no conflict of interest.

References

  1. Yang, Z.; Yu, Y.; Hu, R.; Xu, X.; Xian, J.; Yang, Y.; Liu, L.; Cheng, Z. Effect of rice straw and swine manure biochar on N2O emission from paddy soil. Sci. Rep. 2020, 10, 10843. [Google Scholar] [CrossRef] [PubMed]
  2. Hagemann, N.; Harter, J.; Kaldamukova, R.; Guzman-Bustamante, I.; Ruser, R.; Graeff, S.; Kappler, A.; Behrens, S. Does soil aging affect the N2O mitigation potential of biochar? A combined microcosm and field study. GCB Bioenergy 2017, 9, 953–964. [Google Scholar] [CrossRef]
  3. Zaman, M.; Nguyen, M.L. How application timings of urease and nitrification inhibitors affect N losses from urine patches in pastoral system. Agric. Ecosyst. Environ. 2012, 156, 37–48. [Google Scholar] [CrossRef]
  4. Luo, L.; Wang, G.; Shi, G.; Zhang, M.; Zhang, J.; He, J.; Xiao, Y.; Tian, D.; Zhang, Y.; Deng, S.; et al. The characterization of biochars derived from rice straw and swine manure, and their potential and risk in N and P removal from water. J. Environ. Manag. 2019, 245, 1–7. [Google Scholar] [CrossRef]
  5. Aamer, M.; Shaaban, M.; Hassan, M.U.; Guoqin, H.; Ying, L.; Ying, T.H.; Rasul, F.; Qiaoying, M.; Zhuanling, L.; Rasheed, A.; et al. Biochar mitigates N2O emissions from acidic soils by increasing the nosZ sand nirK gene abundance and soil pH. J. Environ. Manag. 2020, 255, 109891. [Google Scholar] [CrossRef]
  6. Reay, D.S.; Davidson, E.A.; Smith, K.A.; Smith, P.; Melillo, J.M.; Dentener, F.; Crutzen, P.J. Global agriculture and nitrous oxide emissions. Nat. Clim. Chang. 2012, 2, 410–416. [Google Scholar] [CrossRef]
  7. Nicholas, S. Economic development, climate and values: Making policy. Proc. R. Soc. B Biol. Sci. 2015, 1812, 820. [Google Scholar]
  8. Domene, X.; Enders, A.; Hanley, K.; Lehmann, J. Ecotoxicological characterization of biochars: Role of feedstock and pyrolysis temperature. Sci. Total Environ. 2015, 512–513, 552–561. [Google Scholar] [CrossRef] [Green Version]
  9. Case, S.D.C.; Uno, H.; Nakajima, Y.; Stoumann Jensen, L.; Akiyama, H. Bamboo biochar does not affect paddy soil N2O emissions or source following slurry or mineral fertilizer amendment—A 15N tracer study. J. Plant Nutr. Soil Sci. 2018, 181, 90–98. [Google Scholar] [CrossRef] [Green Version]
  10. Harter, J.; Guzman-Bustamante, I.; Kuehfuss, S.; Ruser, R.; Well, R.; Spott, O.; Kappler, A.; Behrens, S. Gas entrapment and microbial N2O reduction reduce N2O emissions from a biochar-amended sandy clay loam soil. Sci. Rep. 2016, 6, 39574. [Google Scholar] [CrossRef] [Green Version]
  11. Gul, S.; Whalen, J.K.; Thomas, B.W.; Sachdeva, V.; Deng, H. Physico-chemical properties and microbial responses in biochar-amended soils: Mechanisms and future directions. Agric. Ecosyst. Environ. 2015, 206, 46–59. [Google Scholar] [CrossRef]
  12. Wang, N.; Chang, Z.Z.; Xue, X.M.; Yu, J.G.; Shi, X.X.; Ma, L.Q.; Li, H.B. Biochar decreases nitrogen oxide and enhances methane emissions via altering microbial community composition of anaerobic paddy soil. Sci. Total Environ. 2017, 581, 689–696. [Google Scholar] [CrossRef]
  13. Cao, H.; Ning, L.; Xun, M.; Feng, F.; Li, P.; Yue, S.; Song, J.; Zhang, W.; Yang, H. Biochar can increase nitrogen use efficiency of Malus hupehensis by modulating nitrate reduction of soil and root. App. Soil Ecol. 2019, 135, 25–32. [Google Scholar] [CrossRef]
  14. Maucieri, C.; Zhang, Y.; McDaniel, M.D.; Borin, M.; Adams, M.A. Short-term effects of biochar and salinity on soil greenhouse gas emissions from a semi-arid Australian soil after re-wetting. Geoderma 2017, 307, 267–276. [Google Scholar] [CrossRef]
  15. Aamer, M.; Hassan, M.U.; Shaaban, M.; Rasul, F.; Haiying, T.; Ma Qiaoying, M.; Batool, M.; Rasheed, A.; Chuan, Z.; Qitao, S.; et al. Rice straw biochar mitigates N2O emissions under alternate wetting and drying conditions in paddy soil. J. Saudi Chem. Soc. 2021, 25, 101172. [Google Scholar] [CrossRef]
  16. Liu, H.; Li, H.; Zhang, A.; Rahaman, M.A.; Yang, Z. Inhibited effect of biochar application on N2O emissions is amount and time-dependent by regulating denitrification in a wheat-maize rotation system in North China. Sci. Total Environ. 2020, 721, 137636. [Google Scholar] [CrossRef] [PubMed]
  17. Rittl, T.F.; Oliveira, D.M.S.; Canisares, L.P.; Sagrilo, E.; Butterbach-Bahl, K.; Dannenmann, M.; Cerri, C.E.P. High application rates of biochar to mitigate N2O emissions from a n-fertilized tropical soil under warming conditions. Front. Environ. Sci. 2021, 8, 611873. [Google Scholar] [CrossRef]
  18. He, C.; Manevski, K.; Andersen, M.N.; Hu, C.; Dong, W.; Li, J. Abiotic mechanisms for biochar effects on soil N2O emission. Intern. Agrophys. 2019, 33, 537–546. [Google Scholar] [CrossRef]
  19. García, M.; Roig, A.; Sánchez-Monedero, M.A.; Cayuela, M.L. Biochar increases soil N2O emissions produced by nitrifcation-mediated pathways. Front. Environ. Sci. 2014, 2, 25. [Google Scholar]
  20. Liu, S.; Lin, F.; Wu, S.; Cheng, J.; Sun, Y.; Jin, Y.; Li, S.; Li, Z.; Zou, J. A meta-analysis of fertilizer-induced soil NO and combined with N2O emissions. Glob. Chang. Biol. 2016, 23, 2520–2532. [Google Scholar] [CrossRef]
  21. Sun, X.; Han, X.; Ping, F.; Zhang, L.; Zhang, K.; Chen, M.; Wu, W. Effect of rice-straw biochar on nitrous oxide emissions from paddy soils under elevated CO2 and temperature. Sci. Total Environ. 2018, 628, 1009–1016. [Google Scholar] [CrossRef]
  22. Lai, L.; Ismail, M.R.; Yusof, M.M.; Ismail, R. Rice straw biochar and different urea rates on rice yield and CH4 and CO2 gases emissions. Chil. J. Agric. Res. 2021, 81, 448–455. [Google Scholar] [CrossRef]
  23. Deng, B.; Li, Z.; Zhang, L.; Ma, Y.; Li, Z.; Zhang, W.; Guo, X.; Niu, D.; Siemann, E. Increases in soil CO2 and N2O emissions with warming depend on plant species in restored alpine meadows of Wugong Mountain, China. J. Soils Sediments 2016, 16, 777–784. [Google Scholar] [CrossRef]
  24. Shaaban, M.; Peng, Q.A.; Hu, R.; Wu, Y.; Lin, S.; Zhao, J. Dolomite application to acidic soils: A promising option for mitigating N2O emissions. Environ. Sci. Pollut. Res. 2015, 22, 19961–19970. [Google Scholar] [CrossRef] [PubMed]
  25. Jin, T.; Shimizu, M.; Marutani, S.; Desyatkin, A.R.; Iizuka, N.; Hata, H.; Hatano, R. Effect of chemical fertilizer and manure application on N2O emission from reed canary grassland in Hokkaido, Japan. Soil Sci. Plant Nutr. 2010, 56, 53–65. [Google Scholar] [CrossRef] [Green Version]
  26. Shaaban, M.; Abid, M.; Qi-An, P. Short term influence of gypsum, farm manure and commercial humic acid on physical properties of salt affected soil in rice paddy system. J. Chem. Soc. Pak. 2013, 35, 1034–1040. [Google Scholar]
  27. Wu, L.; Tang, S.; He, D.; Wu, X.; Shaaban, M.; Wang, M.; Zhao, J.; Khan, I.; Zheng, X.; Hu, R.; et al. Conversion from rice to vegetable production increases N2O emission via increased soil organic matter mineralization. Sci. Total Environ. 2017, 583, 190–201. [Google Scholar] [CrossRef]
  28. Vance, E.D.; Brookes, P.C.; Jenkinson, D.S. An extraction method for measuring soil microbial C. Soil Biol. Biochem. 1987, 19, 159–164. [Google Scholar] [CrossRef]
  29. Xiao, Y.; Che, Y.; Zhang, F.; Li, Y.; Liu, M. Effects of biochar, N fertilizer, and crop residues on greenhouse gas emissions from acidic soils. CLEAN Soil Air Water 2018, 4, 1700346. [Google Scholar] [CrossRef]
  30. Lu, R.K. Soil Analytical Methods of Agronomic Chemical; China Agricultural Science and Technology Press: Beijing, China, 2000; pp. 10–58. [Google Scholar]
  31. Aamer, M.; Shaaban, M.; Hassan, M.U.; Ying, L.; Haiying, T.; Qiaoying, M.; Munir, H.; Rasheed, A.; Xinmei, L.; Ping, L.; et al. N2O Emissions Mitigation in Acidic Soil following Biochar Application under Different Moisture Regimes. J. Soil Sci. Plant Nutr. 2020, 20, 2454–2464. [Google Scholar] [CrossRef]
  32. Wang, C.; Yan, Z.; Wang, Z.; Batool, M.; El-Badri, A.M.; Bai, F.; Li, Z.; Wang, B.; Zhou, G.; Kuai, J. Subsoil tillage promotes root and shoot growth of rapeseed in paddy fields and dryland in Yangtze River Basin soils. Eur. J. Agron. 2021, 130, 126351. [Google Scholar] [CrossRef]
  33. Shaaban, M.; Wu, Y.; Khalid, M.S.; Peng, Q.; Xu, X.; Wu, L.; Hu, R. Reduction in soil N2O emissions by pH manipulation and enhanced nosZ gene transcription under different water regimes. Environ. Pollut. 2018, 235, 625–631. [Google Scholar] [CrossRef]
  34. Zhang, H.; Sun, H.; Zhou, S.; Bai, N.; Zheng, X.; Li, S.; Zhang, J.; Lv, W. Effect of straw and straw biochar on the community structure and diversity of ammonia-oxidizing bacteria and archaea in rice-wheat rotation ecosystems. Sci. Rep. 2019, 9, 9367. [Google Scholar] [CrossRef] [Green Version]
  35. Zhang, M.; Wang, J.; Bai, S.H.; Teng, Y.; Xu, Z. Evaluating the effects of phytoremediation with biochar additions on soil nitrogen mineralization enzymes and fungi. Environ. Sci. Pollut. Res. 2018, 25, 23106–23116. [Google Scholar] [CrossRef] [PubMed]
  36. Feng, Z.; Sheng, Y.; Cai, F.; Wang, W.; Zhu, L. Separated pathways for biochar to affect soil N2O emission under different moisture contents. Sci. Total Environ. 2018, 645, 887–894. [Google Scholar] [CrossRef] [PubMed]
  37. Singh, B.P.; Hatton, B.J.; Singh, B.; Cowie, A.L.; Kathuria, A. Influence of biochars on nitrous oxide emission and nitrogen leaching from two contrasting soils. J. Environ. Qual. 2010, 39, 1224–1235. [Google Scholar] [CrossRef]
  38. Nelissen, V.; Saha, B.K.; Ruysschaert, G.; Boeckx, P. Effect of different biochar and fertilizer types on N2O and NO emissions. Soil Biol. Biochem. 2014, 70, 244–255. [Google Scholar] [CrossRef]
  39. Baggs, E.M. Soil microbial sources of nitrous oxide: Recent advances in knowledge, emerging challenges and future direction. Curr. Opin. Environ. Sustain. 2011, 3, 321–327. [Google Scholar] [CrossRef]
  40. Harter, J.; El-Hadidi, M.; Huson, D.H.; Kappler, A.; Behrens, S. Soil biochar amendment affects the diversity of nosz transcripts: Implications for N2O formation. Sci. Rep. 2017, 7, 3338. [Google Scholar] [CrossRef] [Green Version]
  41. Levy-Booth, D.J.; Prescott, C.E.; Grayston, S.J. Microbial functional genes involved in nitrogen fixation, nitrification and denitrification in forest ecosystems. Soil Biol. Biochem. 2014, 75, 11–25. [Google Scholar] [CrossRef]
  42. Cayuela, M.L.; Sánchez-Monedero, M.A.; Roig, A.; Hanley, K.; Enders, A.; Lehmann, J. Biochar and denitrification in soils: When, how much and why does biochar reduce N2O emissions? Sci. Rep. 2013, 3, 1732. [Google Scholar] [CrossRef] [PubMed] [Green Version]
  43. Shi, Y.L.; Liu, X.R.; Zhang, Q.W. Effects of combined biochar and organic fertilizer on nitrous oxide fluxes and the related nitrifier and denitrifier communities in a saline alkali soil. Sci. Total Environ. 2019, 686, 199–211. [Google Scholar] [CrossRef]
  44. Li, H.; Dong, X.; Da Silva, E.B.; De Oliveira, L.M.; Chen, Y.; Ma, L.Q. Mechanisms of metal sorption by biochars: Biochar characteristics and modifications. Chemosphere 2017, 178, 466–478. [Google Scholar] [CrossRef] [PubMed]
  45. Qu, Z.; Wang, J.; Almoy, T.; Bakken, L.R. Excessive use of nitrogen in Chinese agriculture results in high N2O/(N2O+N2) product ratio of denitrification, primarily due to acidification of the soils. Glob. Chang. Biol. 2014, 20, 1685–1698. [Google Scholar] [CrossRef] [PubMed] [Green Version]
Figure 1. Effect of variable rates of rice residue-based biochar on soil pH. The data in the figure shows the mean of three replicates with ±S.E.
Agronomy 11 02462 g001
Figure 2. Effect of variable rates of rice residue-based biochar on soil MBC. The data in the figure shows the mean of three replicates with ±S.E.
Agronomy 11 02462 g002
Figure 3. Effect of variable rates of rice residue-based biochar on soil NH4+-N The data in the figure shows the mean of three replicates with ±S.E.
Agronomy 11 02462 g003
Figure 4. Effect of variable rates of rice residue-based biochar on soil NO3-N The data in the figure shows the mean of three replicates with ±S.E.
Agronomy 11 02462 g004
Figure 5. Effect of variable rates of rice residue-based biochar on soil N2O emissions. The data in the figure shows the mean of three replicates with ±S.E.
Agronomy 11 02462 g005
Figure 6. Effect of variable rates of rice residue-based biochar on soil cumulative N2O emissions. The data in the vertical bars shows the mean of three replicates with ±S.E.
Agronomy 11 02462 g006
Figure 7. Effect of variable rates of rice residue-based biochar on nosZ (a), nirK (b), AOA (c), and AOB (d) genes. The data in the form of bars indicate the mean of three replicates with ±S.E. and different letters on bars showing the significant difference at p ≤ 0.5.
Agronomy 11 02462 g007
Figure 8. Effect of variable rates of rice residue-based biochar on soil nitrate reductase (a) and urease activity (b). The data in the form of bars indicate the mean of three replicates with ±S.E. and different letters on bars showing the significant difference at p ≤ 0.5.
Agronomy 11 02462 g008
Figure 9. Pearson’s correlations between the studied traits. MBC: microbial biomass carbon, NR: nitrate reductase, UR: urease.
Agronomy 11 02462 g009
Publisher’s Note: MDPI stays neutral with regard to jurisdictional claims in published maps and institutional affiliations.

