Article

Factors Affecting New Agricultural Business Entities’ Adoption of Sustainable Intensification Practices in China: Evidence from the Main Apple-Producing Areas in the Loess Plateau

1
College of Urban and Environmental Science, Northwest University, Xi’an 710127, China
2
School of Public Policy and Management, Tsinghua University, Beijing 100084, China
3
China Institute of Rural Studies, Tsinghua University, Beijing 100084, China
*
Author to whom correspondence should be addressed.
Agronomy 2021, 11(12), 2435; https://doi.org/10.3390/agronomy11122435
Submission received: 28 October 2021 / Revised: 25 November 2021 / Accepted: 26 November 2021 / Published: 29 November 2021

Abstract

:
The unsustainability of China’s agricultural production requires an urgent shift from traditional to more sustainable practices; however, the acceleration thereof remains challenging. New agricultural business entities (NABEs) lead agricultural modernization and strongly guide the application of innovative agricultural technologies and models. Thus, an understanding of the factors that influence NABEs’ adoption of sustainable intensification practices will promote their widespread adoption. We developed a model based on innovation diffusion theory and the technology–organization–environment framework, which can both distinguish the influencing factors at different adoption stages and identify the influencing factors of technology adoption from a multidimensional perspective. The results indicate that differences in regional agroecological endowments emerge as the most important influencing factor. Relative advantage, perceived barriers, and agricultural extension services have a significant effect on adoption intention and decision, but a smaller effect on intention. Management and risk response capacities have a significant positive effect on adoption decisions, but no effect on intention. Meanwhile, organizational size has no effect on adoption intention or decision. Adoption intention significantly positively influences, but only partially explains, adoption decisions. Our findings provide a basis for technology promoters to categorize potential adopters by technology adoption stage and provide targeted strategies to stimulate technology demand.

1. Introduction

Over the past few decades, China’s agricultural productivity has increased rapidly, successfully feeding 22% of the world’s population with less than 9% of its arable land [1]. This scale is largely attributed to increased inputs of fertilizer, water, and pesticides, as well as the widespread adoption of high-yielding products during the Green Revolution [2,3]. Though the Green Revolution has achieved a certain level of success in China, it has also caused extensive ecological and environmental problems, such as soil degradation and water and environmental pollution [4,5]. The total area of degraded land in the world is estimated to be 1964 Mha, of which China has 145 Mha (or 7.4%) [6]. The loss of N and P through leaching and runoff leads to pollution in drinking water that affects 30% of the country’s population and leads to eutrophication in 61% of its lakes. Since the 1980s, the concept of sustainable intensification has received wide-spread attention from scholars and policy makers to address the adverse effects of unsustainable agricultural development on agricultural ecosystems and human health [7]. Sustainable intensification aims to avoid cultivation of more land—thereby also avoiding the loss of non-cultivation habitats—and to improve the overall performance of the system without incurring net environmental costs. It is currently a priority in the United Nations Sustainable Development Goals [8]. Agricultural technologies and techniques that can promote sustainable intensive farming are collectively referred to as sustainable intensive practices (SIPs) [9]. The promotion of SIPs has become an important strategy for China to advance its transformation of agricultural development from its primary reliance on resource consumption to resource efficiency and environmental friendliness [10,11]. SIPs aim to increase the productivity and resilience of agricultural production systems without negatively impacting soil and water resources or the integrity of associated non-agricultural ecosystems [8,12]. Despite significant efforts by the Chinese government to promote SIPs, their adoption in agricultural production remains slow.
Due to the combined push of increased productivity within agriculture and the pull of industrialization and urbanization on the rural labor force, a large number of rural laborers have moved to the cities and are engaging in non-agricultural industries. Along with the high cost and risk of agricultural production, resource and environmental constraints, and asymmetric supply and demand of agricultural products, the questions of who should farm and how are becoming increasingly prominent in China [13]. Against this background, new agricultural business entities (NABEs) have emerged in the form of family farms, farmer cooperatives, and agricultural enterprises. NABEs are tasked with developing modern agriculture, ensuring food security, and upgrading the industrial structure [14,15]. China currently has 3.224 million NABEs; these entities and smallholder farmers are expected to coexist for a long time [15,16]. NABEs have a demonstration effect and play a guiding role in leading the development of China’s agricultural modernization [17,18]. Therefore, a focus on the adoption of SIPs by NABEs in the study of agricultural technology diffusion and application, and exploration of factors that influence their technology adoption, will facilitate the design of more targeted policy strategies, while promoting the widespread application of SIPs among a wide range of farmers [17].
Given the important role of NABEs in accelerating the adoption of SIPs, this study attempts to enhance our understanding of the determinants of SIP adoption by NABEs. This study aims to (1) comprehensively identify the determinants of SIP adoption intention and decision by NABEs, based on the technology–organization–environment (TOE) theory; (2) confirm the differences in the explanatory power and influence of technical, organizational, and environmental factors in the two stages of adoption intention and decision; and (3) effectively identify the impact of regional differences in agroecological conditions on SIP adoption.

2. Literature Review

After years of innovative development, the constituent subjects of the modern agricultural management system and the practices of traditional farmers in China constitute completely different conceptual categories. Compared to traditional farmers, NABEs represent more specialized, integrated, organized, and socialized production and management organizations [15]. They are characterized by relatively largescale operations, better material and equipment conditions, higher scientific and technological levels of management, and higher labor productivity, resource utilization, and land productivity [19]. In analyzing the adoption behavior of green control technology on family farms, Gao et al. [20] emphasized that, compared to traditional farmers, family farms adopt a consumer-, market-, and future-oriented business strategy that emphasizes scale and entrepreneurial operations, as well as the concepts of agricultural product certification and brand marketing. In examining the willingness of farmer cooperatives to adopt agricultural information technology, Wang et al. [18] pointed out that, unlike traditional farmers, cooperatives have advantages in terms of scale, access to information, and policy support.
Despite the significant differences between NABEs and smallholder farmers, previous studies on SIP adoption focused on smallholder farmers; research on the adoption of SIPs by new business entities is lacking. Zeweld et al. [21] confirmed the important role of social capital, personal efficacy, training, and perceived usefulness in smallholder farmers’ intentions to adopt sustainable practices. Daxini et al. [22] found that Irish smallholder farmers’ intentions to follow a nutrient management plan was dominated by perceived behavioral control drives, followed by subjective norms, and finally, attitudes. Jera et al. [23] showed that dairy herd size, land tenure, dairy association membership, and agroecological potential are the key influences on the adoption of agroforestry practices by smallholder farmers in Zimbabwe. Pilarova et al. [24] showed that adoption of sustainable agricultural practices (SAP) by smallholder farmers in the Republic of Moldova was largely influenced by farmer characteristics and their impact on risk perceptions. Teklewold et al. [25], Kassie et al. [26], Kotu et al. [27], and Jabbar et al. [28] explored smallholder farmers’ choice of multiple SIPs and decision factors. Market access, education, information, extension services, and agroecological conditions were found to influence SIP adoption. A study by Cafer and Rikoon [29] found that access to cash and capital by service providers is more likely to influence smallholder farmers’ decision to adopt SIPs, compared with agricultural information. Ndiritu et al. [30] demonstrated gender differences in SIP adoption among smallholder farmers in Kenya. However, it is questionable whether these findings on smallholder SIPs adoption can be generalized to NABEs due to the unique characteristics of NABEs. Therefore, a specific study on SIP adoption in NABEs is necessary.
Based on a literature review, SIP adoption studies typically focus on the determinants of individual stages in technology adoption, such as adoption intention [21,22] and adoption decision [25,27,28,30]; however, few studies integrate multiple stages of SIP adoption. Technology adoption is a multi-stage sequential process [31], and the influence and explanatory power of antecedent factors at different stages of the adoption process have important differences [32]. Specifically, understanding the influences of the different adoption stages is useful for designing targeted demand stimulation strategies. Therefore, distinguishing the influencing factors at different adoption stages of SIPs is crucial.
Prior research has used a number of innovation diffusion theories to study technology adoption. These theories include the technology acceptance model (TAM) [33], the theory of reasoned action (TRA) [34], and the theory of planned behavior (TPB) [35], in addition to the theory of diffusion of innovation (DOI) [36] and the TOE theory [37]. The TRA and TPB primarily predict individual adoption, while the TAM, DOI, and TOE frameworks examine technology adoption at the organizational level. As the focus of this study is on SIP adoption by agribusinesses (rather than individuals), organization-level adoption theory is considered appropriate. TAM focuses extensively on technology and ignores social and psychological parameters [38], thus limiting its explanatory and predictive utility. The DOI theory emphasizes the multi-stage character of technology adoption, using constructs from organizational and technological contexts to explain adoption, but it neglects environmental factors. The TOE theory emphasizes not only the influence of technology itself on adoption, but also the influence of the organizational and external environment, thus providing a more comprehensive picture of the factors that influence the adoption of SIPs at the organizational level. Therefore, integrating the DOI and TOE theories allows for the multi-stage nature of SIP adoption to be considered while enabling the factors influencing SIP adoption to be studied from a multi-dimensional perspective.
According to literature reviews by Prokopy et al. [39], Tey and Brindal [40], Knowler and Bradshaw [41], Pannell et al. [42], and Baumgart-Getz et al. [43], the common factors influencing the adoption of SIPs can be categorized into six areas: socioeconomic (managerial capacity of decision makers), agroecological, institutional, informational and intentional, as well as technology perceived attributes. These six categories are similar to the TOE framework. Among them, technology perception attributes can be categorized as the technical context; managerial capabilities and intentions can be categorized as the organizational context; and agroecology, institutions, and information can be categorized as the environmental context in the TOE framework. Therefore, using the TOE framework to explore SIP adoption is feasible. Among the existing studies on SIP adoption, the decomposed theory of planned behavior [21,22], the integration of TPB with DOI [44], and the integration of interpersonal behavior theory with DOI [45] have been used to analyze the determinants of SIP adoption. However, research integrating DOI with TOE framework to analyze the adoption of SIPs at the organizational level has not been conducted thus far.
To address these research gaps, we developed a model based on a synthesis of two theoretical perspectives, namely, the DOI and TOE frameworks, which can both distinguish the influencing factors at different adoption stages and identify the influencing factors of technology adoption from a multidimensional perspective. We validated the comprehensive model using survey data from six typical apple-producing counties in the dominant apple-producing region of the Loess Plateau. This study is the first to analyze the SIP adoption behavior of NABEs from the perspective of organizational technology adoption. It provides valuable guidance for a clearer understanding of the agricultural technology adoption behavior of NABEs. Furthermore, the study considers the multiple stages of technology adoption, examining adoption behavior in terms of both intentions and decisions. This allows it to distinguish the relative importance of the factors that influence adoption intentions and decisions. Consequently, useful information for identifying policies and designing interventions to stimulate higher adoption rates is obtained. The study also contributes to the literature by applying the TOE framework to the field of SIP adoption, providing new insights into a more comprehensive and integrated understanding of the factors that influence SIP adoption. Finally, we used spatial interpolation of meteorological data from the investigated region and extracted spatial interpolation data using respondents’ latitude and longitude information to effectively capture agroecological information, such as climate and topography of respondents’ farm locations—this provides an effective method for accurately identifying the impact of regional differences in agroecological conditions on SIP adoption.

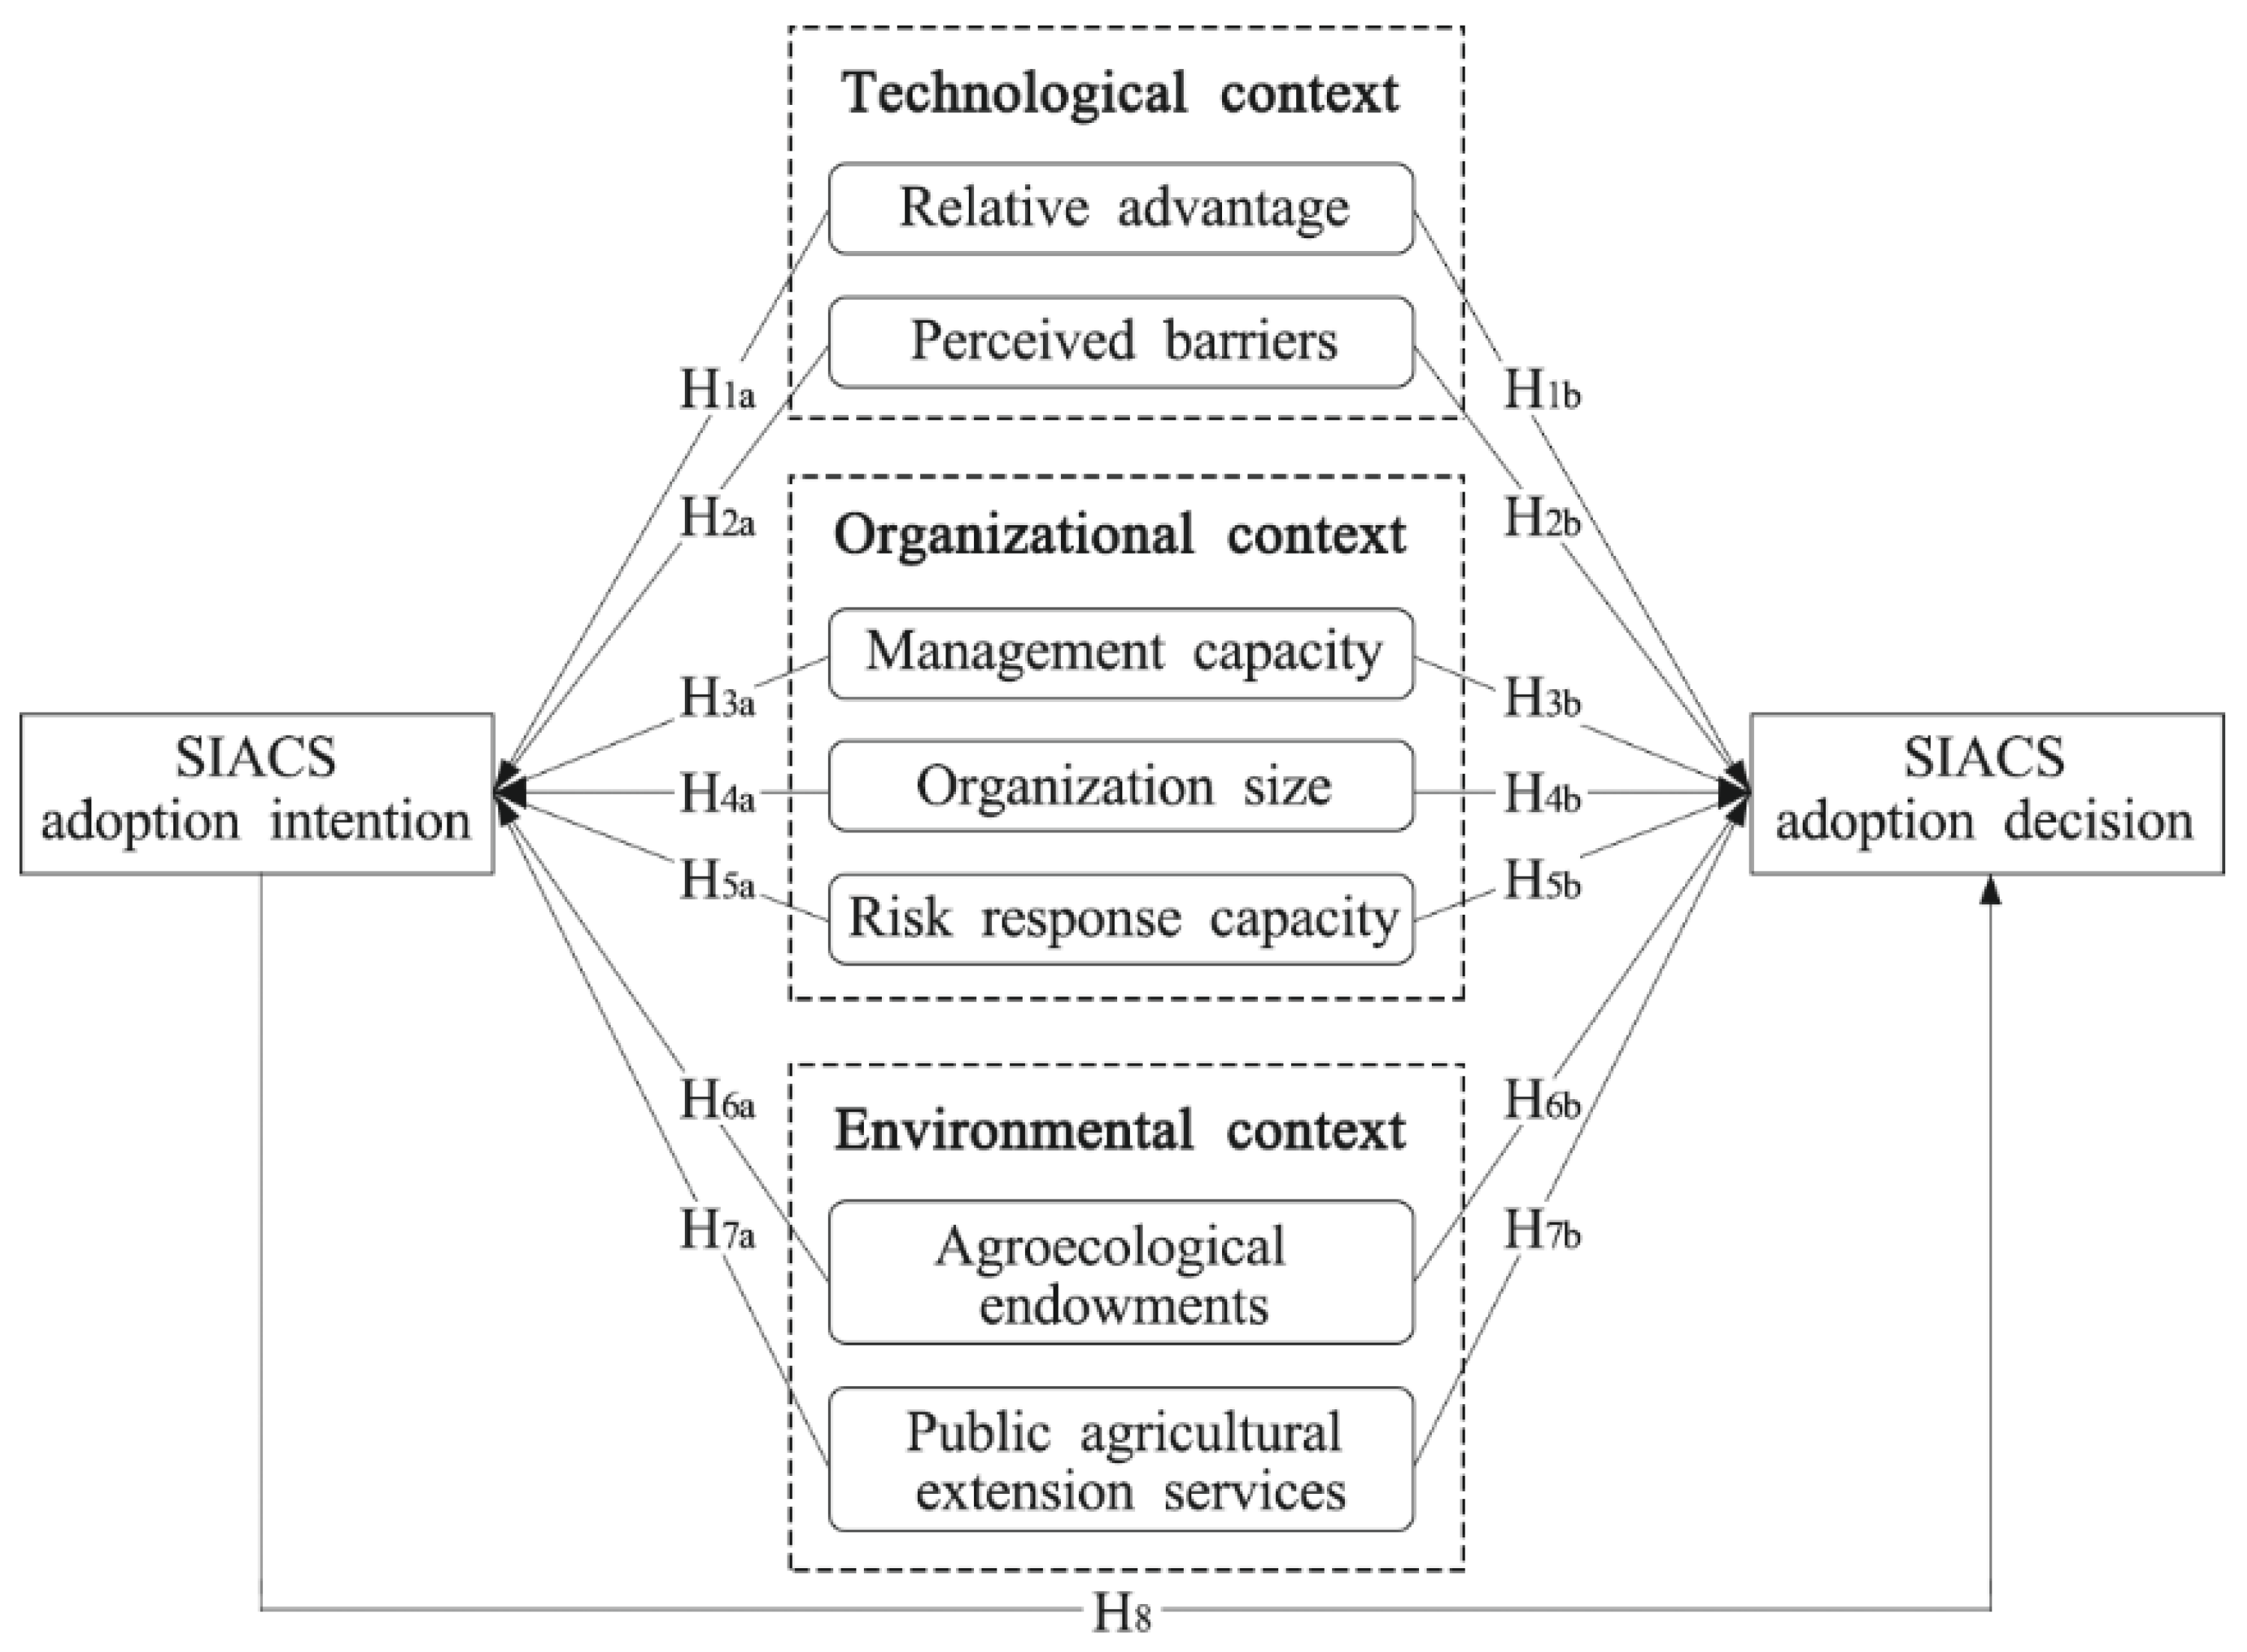
3. Research Model and Hypotheses

Based on the DOI and TOE frameworks, we propose a conceptual model for the adoption of sustainable intensive apple culture systems (SIACS, Figure 1). Maximum variable selection integrates and synthesizes previous studies that adopt the same techniques [39,40,41]. The model has seven constructs, each of which is explained by a set of determinants. Among these, relative advantage and perceived barriers are identified as the technological context; organizational size, managerial capacity, and risk response capacity constitute the organizational context; and agroecological endowments and public agricultural extension services represent the environmental context. For the dependent variables, intentions and decisions represent different subsequent stages of the technology adoption process [36], and distinguishing between them as different dependent variables is crucial [32]. Therefore, this study examines SIACS adoption in terms of both adoption intention and adoption decision. These predictors are discussed below.

3.1. Technology

Due to the nature of human reasoning, the characteristics of innovation must be subjectively perceived by those who consider adopting these innovations. The perception of innovation characteristics is often considered an important factor in adoption decisions. Rogers [36] identified five perceived characteristics as antecedents for adoption: relative advantage, compatibility, complexity, testability, and observability. A meta-analysis of 75 diffusion articles conducted by Tornatzky and Klein [46] concluded that relative advantage, complexity, and compatibility are most consistently significant in relation to innovation adoption. Kapoor et al. [47] conducted a meta-analysis of articles on Rogers’ innovation characteristics from 1996 to 2011, and their conclusions were consistent with the above findings. Zeweld et al. [21] concluded that perceived usefulness, perceived ease of use, and social capital were significant predictors of farmers’ adoption intentions. An empirical study by Pilarova et al. [24] demonstrated the important impact of risk perception on SAP adoption. Therefore, in this study, relative advantage, complexity, and risk perception are considered key factors for SIACS adoption, whereas complexity and risk perception are categorized as perceived barriers.
Relative advantage refers to the degree to which a new technology is perceived to provide greater benefits than an existing technology [36]. The technology diffusion theory [48] shows that identification of a new technology is a key prerequisite in influencing actors’ adoption decisions, and Lee [49] found that innovations that are perceived to have more operational value are more likely to be adopted. The advantage of SIACS over traditional planting patterns is that its dwarfing and wide rows of dense planting facilitate mechanical management of orchards and improve labor efficiency, which saves labor costs to a large extent. In addition, with SIACS, substantial yields in the third year and mature yields in the fifth year are expected [50], whereas there is no expectation of substantial yield until the eighth year with the conventional cropping pattern; hence, a clear advantage of SIACS is that it can shorten the payback period. In summary, companies that perceive a higher relative advantage of SIACS tend to be more likely to adopt it. Therefore, we hypothesized the following:
Hypothesis 1 (H1a).
There is a positive correlation between relative advantage and SIAC adoption intention.
Hypothesis 1 (H1b).
There is a positive correlation between relative advantage and SIAC adoption decision.
Complexity and risk perception are considered to be the main perceived barriers to innovation adoption. Complexity renders innovations more difficult to master and usually requires higher management skills, which in turn increase the risks associated with the innovation [51]. The existing literature on innovation diffusion suggests that the rate of adoption decreases as the complexity of innovation implementation increases [44]. That is, if potential adopters perceive the innovation as complex, the likelihood of adoption decreases. Risk perception is an individual’s identification of uncertainty when faced with a decision. Most farmers are risk averse because of uncertainty in terms of weather, pests and diseases [52]. Thus, introducing risk perception is necessary to assess the adoption behavior of SIACS. Under the intensive cultivation model, it takes approximately four years from initial planting to the productive period, indicating that characteristics such as slow technology effectiveness and a long technology action period increase the risk associated with adopting SIACS. Therefore, we hypothesized the following:
Hypothesis 2 (H2a).
Perceived barriers are negatively correlated with SIACS adoption intention.
Hypothesis 2 (H2b).
Perceived barriers are negatively correlated with SIACS adoption decision.

3.2. Organization

Organizational context refers to the influence of organizational characteristics on technology adoption decisions for the SIACS. The agricultural technology adoption literature has identified variables such as human capital factors (e.g., age, experience, education, and labor endowment of decision makers), organizational size, information availability, access to credit, and land tenure as important factors in adoption decisions in developing countries [24,39,53]. In this study, the proposed framework limits the organizational factors to organizational size, organizational management capacity, and an organization’s ability to cope with risk.
Organizational size is considered an important driver for the adoption of technological innovations. Large companies typically have more resources to test new technologies and a greater ability to bear the risks and costs of implementing them. In addition, the intertemporal tradeoffs between short- and long-term costs and returns are a key issue for the adoption of SIPs [54]. With the adoption of the SIACS, substantial yields are expected in the third year and mature yields in the fifth year [50]. This implies that the benefits from the SIACS are explicitly biased toward the future and require costs in the current period. In examining the intertemporal choices of actors, Green et al. [55] concluded that adopters have lower discount rates for large returns and higher discount rates for small returns. This phenomenon is known in behavioral economics as the quantitative effect. For SIACs, the larger the planted area, the larger the quantitative effect of future returns, and the lower the degree of time preference. Accordingly, the following hypothesis is proposed:
Hypothesis 3 (H3a).
There is a positive correlation between organizational size and SIACS adoption intention.
Hypothesis 3 (H3b).
There is a positive correlation between organizational size and SIACS adoption decision.
The SIACS is complex and involves a wide range of management decisions. Its operation includes a series of management procedures, such as seedling selection, manipulation of branch angles, fruit tree pruning, irrigation, fertilization, pest and disease control, and use of plant growth regulators [50]. The specific operation of each management procedure, in turn, involves many technical points. For example, in the control of branch angle, branches at angles higher than 45° theoretically grow vigorously and produce few flowers, while branches below 45° to the horizontal angles produce large flowers and have a large fruit size of good quality [50]. However, in practice, the control of orchard density branch angles varies, and managers should make appropriate judgments based on their skills and experience. The empirical literature has widely demonstrated that factors associated with improved management are related to adoption patterns: for example, the level of the adopter’s education is positively correlated with the level of adoption [40,56]. This suggests that management capabilities may be key to the successful adaptation and adoption of knowledge-intensive systems [49]. The higher the management capabilities of the organization, the more comprehensive the knowledge of the attributes of the technology will be. Accordingly, the following hypotheses are formulated:
Hypothesis 4 (H4a).
There is a positive relationship between organizational managerial competence and SIACS adoption intention.
Hypothesis 4 (H4b).
There is a positive relationship between organizational managerial competence and SIACS adoption decision.
Feder and Slade [57] considered market risk an important influencing factor in farmers’ technology choices. Climate change will lead to higher temperatures, increased crop demand for water, more variable rainfall, and extreme weather events that will adversely affect agriculture in many regions [53]. Risks or shocks play an important role in agricultural production decisions, especially in the uptake of agricultural technology [58]. Investment decisions that lack ex-post coping mechanisms, such as formal and informal insurance risks, will lead to reduced willingness of decision makers to engage in activities or investments that, while having a high expected outcome, carry a risk of failure or downside risk [59]. Profitable investments and innovations can only be undertaken by investors who are financially secure and adequately defended against adverse risks [60]. Accordingly, the following hypothesis is formulated:
Hypothesis 5 (H5a).
There is a positive relationship between organizational risk-coping capacity and SIACS adoption intention.
Hypothesis 5 (H5b).
There is a positive relationship between organizational risk-coping capacity and SIACS adoption decision.

3.3. Environment

Baumgart-Getz et al. [43] conducted a meta-analysis of the relevant literature on factors influencing the adoption of BMPs. They found that overall type and formality of education did not have a significant effect on the adoption of best management practices, but extension training had a positive impact on farmer adoption. Studies of the early stages of the extension process have also shown that access to extension services is a major determinant of the rate of adoption by different users [61]. In addition, agricultural production is constrained by natural environmental conditions that determine different agricultural practices and agrotechnological needs. Through a review and summary of the theoretical and empirical literature on the adoption of agricultural innovations and the impact of policy interventions to promote technology adoption, Feder and Umali [62] found that the agroclimatic environment is the most significant determinant of locational differences in adoption rates. Therefore, public agricultural extension services and the agroclimatic environment are used in this study to measure the policy and natural environments, respectively.
Information can shape awareness and attitudes to issues and has been shown to be an important factor in shaping farmers’ outlooks and expectations regarding resource issues and technology choices [63]; hence, policies to improve the information and knowledge base are likely to have important implications for technology adoption. Agricultural extension is a mechanism for conveying information to farmers about new technologies, more efficient management options, and better farming practices [64]. Effective agricultural extension services can eliminate or reduce the divergence between farmers’ perceived attributes of technology and its objective attributes [62]. In addition, access to public agricultural extension services can reduce the constraints on the availability of agricultural technology information caused by inefficiencies in the agricultural technology information market [65] and can facilitate the effective use of available technologies by improving the expertise and managerial capacity of the adopter [66]. As SIPs are knowledge-based innovations, extension services play an active role in their adoption [53]. Consequently, we propose the following hypothesis:
Hypothesis 6 (H6a).
Public agricultural extension services will have a positive impact on SIACS adoption intention.
Hypothesis 6 (H6b).
Public agricultural extension services will have a positive impact on SIACS adoption decision.
The important role of agroecological factors in influencing the adoption of SIPs has been widely documented in the recent literature [67]. Lee [54] noted that SIPs tend to be site-specific and that the heterogeneity in the agroclimatic environment, the underlying natural resource base, and other aspects implies that SIPs are often not widely replicated. Asymmetries in agroecological endowments will alter the likelihood of SIP adoption by decision makers [68], and heterogeneity in natural resources will affect performance and subsequent adoption decisions [69]. If technology is not compatible with the regional agroclimatic environment, the adoption rate may be low [70]. Thus, we propose the following hypothesis:
Hypothesis 7 (H7a).
Agroecological endowments will positively influence SIACS adoption intention.
Hypothesis 7 (H7b).
Agroecological endowments will positively influence SIACS adoption decision.

3.4. Adoption Intention

Intentions indicate the strength of willingness to perform or continue a behavior, and when intentions are formed, farmers are expected to implement them when opportunities arise. According to the rational action theory [71], intentions are the direct antecedents of behavior, and the stronger the intention, the more likely the behavior will be performed [22]. Previous research has shown that intention has a strong direct effect on future behavior [72]. Accordingly, we propose the following hypothesis:
Hypothesis 8.
SIACS adoption intentions will positively influence SIACS adoption decisions.

4. Materials and Methods

4.1. Measurement of Variables

4.1.1. Dependent Variable

The impact of complementarities among SIPs on adoption cannot be ignored [25]. Therefore, we extracted three interrelated SIPs (i.e., dwarf anvil intensive cultivation, combination of fertilizer-water integration and manure spreading, and drip irrigation system) from three key production aspects of the SIACS, namely, cultivation pattern selection, nutrient management, and irrigation. Then, we used the joint adoption of these three technologies to measure SIACS adoption. The measurement standards are presented in Table 1. For the cultivation pattern, dwarf anvil intensive cultivation is the basis of the SIACS; it is effective in increasing yields per unit area and thus in improving land use efficiency [50]. In terms of nutrient management, optimal yields are achieved when nutrients are derived from a mix of mineral fertilizers and natural sources [73]. Using a combination of fertilizer–water integration and manure spreading, taking advantage of the shallow root system and the well-developed capillary roots of dwarf anvil trees to make full use of nutrients is possible [73], while avoiding ground-water and soil contamination due to nutrient loss. Therefore, the combination of integrated fertilizer–water, shallow tillage, and spreading of organic fertilizer is the best fertilization practice for the SIACS. In terms of irrigation management, Fallahi et al. [74] suggested the use of a drip irrigation system in modern apple orchards, based on effective experiments on apple orchard irrigation systems. The drip irrigation system is not only effective in increasing water access to trees compared to other irrigation methods and thus producing significant water savings, but also improves yield and fruit quality. Without a drip irrigation system, precision application of fertilizer according to the needs of trees will be difficult. After manure spreading, and if dripping is not timely, it will be difficult to deliver fertilizer into the roots of the tree, and the fertilization effect will be greatly reduced. Hence, the drip system is also the basis for ensuring that water–fertilizer integration and manure spreading achieve the best results.

4.1.2. Independent Variable

As mentioned previously, only a few studies have focused on the adoption of SIPs at the organizational level. Therefore, the direct use of measurement metrics from previous studies in selecting the measurement factors for the constructs in our model is not feasible. While we used as many previously tested measurement factors as possible, we also ensured full reliability and validity by changing some of the measurement scales based on expert opinions (four experts with more than 10 years of SIACS experience and expertise), the SIACS-related literature, and technical reports. A brief description of the explanatory variables used in the model is presented in Table 1.
The relative advantage of the SIACS was measured in terms of labor cost savings and productivity improvement with reference to Davis’s [33] measurement scale. Perceived barriers were measured in terms of complexity and perceived risk, with the complexity measure adapted from Davis [33] and Wang et al. [18] and the perceived risk measure factor adapted from Im et al. [75].
The measures of Zhu et al. [76] and Jera et al. [23] were used for organizational size. Common managerial factors include those related to human capital: gender, age, education level, experience, the number of skilled workers and technical experts in the organization, and others [40,56]. Referring to Tey et al. [45] and Lee [54], we measured the management capacity in terms of both the level of formal education of the leader and the technical specialization of the employees. Agricultural shocks in China mainly include natural and price shocks [77]. Compared with grain crops, apple is a highly commercialized and marketable cash crop. Therefore, market demand is crucial to the value realization of apple products, and whether they can be sold smoothly at a reasonable price directly affects farmers’ production decisions and input levels. Based on this, we used the ability to respond to changes in market demand as an indicator to measure the ability to cope with price risk. Natural disasters, such as strong wind, hail, and frost occur frequently in apple-producing areas, thus rendering technological measures of decreasing disaster and agricultural risk avoidance measures crucial in coping with natural disasters and ensuring farmers’ incomes [78]. Therefore, we used agricultural insurance as a measure of the ability to cope with natural disasters.
For the agroclimatic environment, the temperature and precipitation data of each examined apple orchard were extracted by its GPS location, and the ecological suitability score of each subject was measured according to the apple climate suitability zoning criteria [79] (Table 2). An average of 10 years of observations from 2010 to 2019 was computed for the survey counties (see Section 4.2) and their surrounding adjacent stations. Then, these observations were spatially interpolated to obtain temperature and precipitation data for each survey county. Apple trees under dwarf anvil intensive cultivation have a shallow root system and are more sensitive to water, requiring timely irrigation during the dry season. Therefore, agroecological endowments were evaluated in terms of both their ecological suitability scores and irrigation water stability. The public agricultural extension service uses Wossen et al.’s [80] measurement criteria.
As part of a field survey, respondents were asked to rate the relative advantage, complexity, perceived risk, government extension efforts, and effectiveness of technical training using a Likert scale (where 1 D—strongly disagree and 5 D—strongly agree). Actual measured values were used for the area and number of employees. Technician employment, formal education, market risk response, natural risk response, and stability of irrigation water were assigned categorical values. Agroecological suitability was measured according to Table 2.

4.2. Data Collection

The data used in this study were obtained from a field survey of six apple-producing counties in the main apple-producing areas in the Loess Plateau from May to September 2019, which used a multi-stage sampling method. The main apple-producing areas in the Loess Plateau were the earliest regions in China to promote the SIACS, and the development of the SIACS in these areas is relatively mature [81]. Therefore, based on a comprehensive consideration of geographical distribution, the development of NABEs engaged in apple cultivation, and the promotion of the SIACS, we selected six survey counties from the main apple-producing areas in the Loess Plateau: Qianxian County, Qianyang County, Baishui County, Fengxiang County, Luochuan County, and Huanglong County. Qianxian County is located in the Guanzhong Plain, Qianyang and Fengxiang County are located in the dry plateau hilly ravine area of the Weibei Arid Highland, Baishui County is located in the transition zone between the Guanzhong Plain and the Loess Plateau, and Luochuan and Huanglong County are located in the Loess Plateau area. Finally, because NABEs are still in the development stage, relatively few mature NABEs are available, and even fewer are engaged in apple cultivation. Therefore, to ensure an appropriate sample size, we took a census of the NABEs engaged in apple cultivation in each case county.
We distributed 215 formal questionnaires through face-to-face interviews and collected 206 valid responses. The interviewees represented the leaders of the NABEs, such as the owner of a family farm, chairman or vice chairman of a cooperative, or general manager or technical manager of an agricultural enterprise. The list of NABEs engaged in apple cultivation in each survey county was obtained from the local agricultural bureau, which contained the location information of NABES to the village level. The NABEs are geographically dispersed, which made the research relatively difficult. During the preliminary field research, we found that remote sensing images of the SIACS and the traditional planting pattern were significantly different in texture (Figure 2). Thus, we could locate each NABE using remote sensing images combined with village-level location information from the local government; this enabled the planning of a reasonable research route to improve research efficiency.
The temperature and precipitation data in the text are from the Resource and Environment Data Cloud Platform of the Chinese Academy of Sciences (http://www.resdc.cn (accessed on 4 August 2020)).

4.3. Methods

We used a structural equation model (SEM) with observed and latent variables to test the conceptual model and assess the strength of the research hypotheses, namely the effects of technical, organizational and environmental factors on SIP adoption intentions and decisions. As the data analysis involves observed variables, endogenous latent variables (adoption intentions and adoption decisions), and exogenous latent variables (influencing factors), the variance explained by the model is higher than when other methods (e.g., regression analysis), are used. Schumacker and Lomax [82] found that most SEM studies had a sample size between 200 and 500. Furthermore, studies have been conducted to evaluate the effect of sample size on the results of SEMs [83,84]. These investigations have shown that a minimum of 100 cases should be used in the latent variable analysis. Having fewer than 100 observations results in the estimates of the population parameters becoming unreliable. The sample size of this study is 206, which meets the requirements of the SEM method. Partial least squares (PLS) was used to estimate the model. PLS is more suitable for small samples [85], as in the case of the current research; although the sample size of 206 is adequate, it is nevertheless relatively small.

5. Data Analysis and Results

The validity of the SEM is assessed in a two-step procedure, which aims to assess the reliability and validity of the measurement model before its use in the structural model.

5.1. Reliability and Validity of the Measurement Model

Confirmatory factor analysis (CFA) was applied to assess the reliability and validity of the measurement model. For a measurement model to have a sufficiently good model fit, the x2 value normalized by degrees of freedom (x2/df) should not exceed 3, and the non-normed fit index (NNFI) and comparative fit index (CFI) should exceed 0.9 [86]. For the current CFA model, x2/df was 1.629 (x2 = 188.924; df = 116), NNFI was 0.908, and CFI was 0.961, suggesting adequate model fit. Additionally, construct reliability measures the degree to which an item is free from random error and therefore yields consistent results. In this study, composite reliability (CR) coefficients were used for measurement. The results in Table 3 indicate that the CR values for all constructs were above the threshold of 0.70, indicating that the measurement model had a strong construct reliability [86].
Validity includes convergent validity and discriminant validity. Convergent validity assesses the consistency of multiple operationalizations. The average variance extracted (AVE) reflects the proportion of the variance in each indicator that is explained by variation in the latent variable. When the AVE is greater than 0.5, the latent variables demonstrate good convergent validity [87]. Table 3 shows that the standardized path loadings were all significant (p < 0.01) and had acceptable magnitudes. The AVE scores for all constructs were greater than 0.5, indicating a good convergent validity. Discriminant validity evaluates the degree of divergence between different constructs. We used Fornell and Larcker’s [87] criterion: the square root of AVE should be greater than the correlation between the interconstructs. As presented in Table 4, the square root of AVE for all variables was greater than the correlations among the latent variables; hence, the latter had a strong discriminative validity. The reliability, convergent validity, and discriminant validity of the latent variables were all satisfactory, indicating that these variables can be used to test the conceptual model.

5.2. Hypothesis Test of the Structural Equation Model

The theoretical model and its hypotheses were validated using AMOS 21.0 software. Table 5 shows the structural equation model’s analysis results. Technical, organizational, and environmental context accounted for 36.4% of the variance in adoption intention. Moreover, together with adoption intention explained 87.1% of the variance in adoption decision. It is possible that a model can explain a significant proportion of the variance in endogenous variables without fitting the data well; hence, we performed a goodness-of-fit test to judge how well the model fits. The model fit indices were within acceptable thresholds: the ratio of x2 to degrees of freedom was 1.868 (x2 = 229.805; df = 123), CFI = 0.897, GFI = 0.915, AGFI = 0.861, and RMSEA = 0.065 (Table 5).
The results of the hypotheses are presented in Table 6. Eleven of the 15 hypotheses have p-values less than 0.05, and the remaining 4 are not significant at the 0.05 level. In the technical context, perceived barriers negatively affect adoption intention and decision; relative advantage has a positive effect on both. Therefore, H1a, H2a, H1b, and H2b are supported. In the organizational context, management capacity and risk response capacity positively influence the adoption decision. Therefore, H3b and H5b are supported. However, unlike H3a, H4a, H5a, and H4b, these two factors have no significant effect on adoption intention, and organization size has no significant effect on adoption intention and decision. In the environmental context, agroecological endowments and public agricultural extension services are shown to have a significant positive effect on adoption intention and decision. Thus, H6a, H7a, H6b, and H7b are supported. Finally, adoption intention positively and significantly affects the adoption decision, and thus H8 is supported. A comparison result of the path coefficients of the factors that have a statistically significant effect on adoption intention at the 5% level indicates that agroecological endowment has the largest effect on adoption intention. Meanwhile, a comparison of the path coefficients of the influences that render the adoption decision statistically significant at the 5% level yields the same conclusion. This shows that the introduction or design of agricultural technologies that are compatible with regional agroecological endowments is essential to achieve their effective diffusion.

6. Discussion

6.1. Technological Context

The results show that relative advantage makes a significant contribution to adoption intention (standardized coefficient of 0.285). This is similar to the findings of Zeweld et al. [21] that respondents with positive attitudes are more willing to adopt SIPs. Relative advantage shows a significant facilitation effect on the adoption decision (standardized coefficient of 0.409). This finding is consistent with the argument below that perceived benefits are closely related to the acceptance and use of technology by potential users [88]. The large scale of NABEs requires the employment of labor, and the loss of labor and the ageing population in China’s rural areas has led to difficulties in finding labor and rising labor costs in daily operations. The SIACS can replace manual labor with machinery, which can greatly reduce labor costs and help NABEs to solve this dilemma. In addition, SIACS has significantly increased yields while improving product quality compared to traditional models. These may be important reasons why the perceived advantages significantly influence adoption intentions and adoption decisions.
Perceived barriers to SIACS adoption intention and adoption decisions show a significant inhibitory effect: when adopters perceive the SIACS as complex and risky, their intention to adopt it and the probability of them making a decision to do so will be significantly reduced by 0.344 and 0.382, respectively. This conclusion is supported by several studies [88,89], which suggest that the relative complexity and relative risk of technologies have a significant impact on adoption and that potential adopters hesitate to adopt complex and risky technologies. SIACS is a completely new model and the experience of the traditional model is not at all applicable to it, which invariably makes it more difficult for producers to master this new set of technologies. In addition, SIACS has high input costs, and both the complexity and high inputs increase the risk associated with SIACS. There is also the fact that agricultural production is often exposed to a high natural disaster risk and market risk, and China’s current agricultural insurance system is not very well developed, which results in NABEs being less resilient to risk. The combination of these factors may be the reason why perceived barriers significantly inhibit adoption intentions and adoption decisions.
Both relative advantage and perceived barriers have stronger effects on adoption decisions than on adoption intentions. Arts et al.’s [32] results support our findings that relative advantage and complexity are significantly stronger in relation to adoption decisions than to adoption intention. We also found that the role of perceived barriers is greater than that of relative advantage in the stage of adoption intention and the role of relative advantage is greater than that of perceived barriers in the stage of adoption decision. Possible reasons for this are that relative advantage represents experience qualities that rely heavily on the assessment of the consequences of the innovation, which are difficult to determine before adoption [90], and that producers place more emphasis on the features of the new technology, which increase its complexity before rather than after its adoption [91].

6.2. Organizational Context

In general, larger farms have greater economies of scale [92], and farm size is positively correlated with adoption rates; surprisingly, we find no significant effect of organizational size on either adoption intention or decision. Size has been shown to have a significant effect in many other technology adoption studies [88,93,94]; however, there are also studies that show no significant effect of size [69,95]. Feder et al. [61] noted that farm size has different effects on the likelihood of adoption, depending on the characteristics of the technology and institutional environment. Our study did not find a correlation between size and SIACS adoption, possibly due to the problem of moderate scale management in apple cultivation [96]. Basically, as the scale of management increases, the cost of production tends to decrease; once a critical point is reached, the cost of production increases. This study found that the production process of NABEs mainly depends on hired labor, and effective supervision of hired labor is difficult in an oversized planting area, leading to a sharp rise in labor costs [96]. Moreover, as a labor-intensive industry, labor accounts for the highest proportion of the total cost in apple production.
The results show that risk response capacity has no effect on SIACS adoption intention. Risk response refers to the preventive measures to avoid, bear, reduce, or share risks that are designated by decision makers on the basis of risk perception, according to the nature of the risks and their own risk tolerance. At the stage of forming the intention to adopt the SIACS, intention may depend more on producers’ perception of the risk of adopting the new technology and their own risk tolerance. Before making the decision to adopt the SIACS, the producer may not consider taking preventive measures to cope with the associated risks. Furthermore, we find that risk response capability has a significant positive impact on SIACS adoption decisions. This implies that a better understanding of potential risks and having ways to manage them may help adopters assess the costs and benefits of new technologies more effectively and thus know how to incorporate them into their production [88]). Dercon and Christiaensen [60] used a risk-based selection model to examine the impact of consumption risk on fertilizer input adoption. They found that the potential increase in fertilizer use from consumption smoothing is higher for farmers who have greater difficulty in maintaining consumption smoothing in dry years or who face larger rainfall variation. This illustrates the importance of improving adopters’ risk-responsiveness to production inputs.
A person’s decision to engage in a behavior depends partially on their ability to perform that behavior, which refers to resources such as the capital, human resources, knowledge, and technology required to perform the technique [97]. Daxini et al. [22] found that a farmer’s perception that he/she possesses or has access to the necessary resources and technical infrastructure is significantly and positively related to his/her intention to adopt nutrient management practices. Daxini et al. [97] also found that perceived control (the ability to perceive implementation behavior) was the most important driver of farmers’ intentions to follow nutrient management plans. However, our research found that management capabilities (the knowledge and technical resources required to implement the technology) have no effect on SIACS adoption intention. A possible reason is that adopters at the stage of forming adoption intention are more concerned with the technology itself and with the environment that influences technology adoption. It is also possible that management capabilities have an indirect effect on SIACS adoption intention, which should be a focus of future research. Zeweld et al. [21] found that perceived control also had a positive and significant effect on the intention to adopt minimum tillage, while it did not reach statistical significance for farmers’ intentions to adopt row cropping.
The results further show that management capabilities significantly and positively influence SIACS adoption decisions. According to our survey, 20.17% of the respondents were willing or very willing to adopt the SIACS, but had not done so. Reasons for their non-adoption include decision makers’ perception that they have limited knowledge to adapt the SIACS, that they do not have extra land to implement the SIACS, and that they do not have extra money to invest in building SIACS plantations. This shows the importance of the resources required for organizational implementation of technology in the adoption decision stage. A further possible explanation for this result is that the SIACS is a technical management practice that requires specialized knowledge, skills, and attention to detail. Workers’ education and technical knowledge are important for the adopter’s ability to make appropriate investment decisions; higher levels of education and access to technical knowledge can improve the ability of the adopter to evaluate information and enhance their understanding and adaptability to new technologies [98].

6.3. Environmental Context

Agroecological endowment is the most important influential factor in shaping SIACS adoption intention (0.361) and in making adoption decisions (0.699). This indicates that regional differences in the agroclimatic environment are the most critical factors influencing SIACS adoption. This finding confirms those of previous studies, including Tey [68], who investigated the relative importance of a range of multidimensional factors in the Malaysian vegetable production sector. The authors found that the most influential factor on the adoption of SAPs was the asymmetric distribution of resources across geographic regions. Their analysis of the final stages of the Green Revolution technology diffusion cycle also found that the agroclimatic environment is the most important factor in determining regional differences in adoption rates. Although ecological endowments have an important influence on both SIACS adoption intentions and adoption decisions, the effect on adoption decisions is much larger. Time-construction theory [99] may explain this result more reasonably—adoption decisions reflect behaviors that are more temporally proximate for adopters than adoption-intent responses, and behaviors that are more temporally proximate are more likely to receive context-specific and context-dependent influences.
Previous studies have shown that access to agricultural extension services is an important determinant of the adoption of SAPs [53,100]. The results of this study also confirm the important influence of access to agricultural extension services on SIACS adoption intentions and decisions. This implies that organizations with greater access to agricultural extension services are more likely to adopt the SIACS. These services can help business owners implement management practices by providing knowledge and technical expertise, which can help explain our results.

6.4. Adoption Intention

Our results show that adoption intention and decision exhibit a significant positive correlation, but this correlation is only 0.363. While intentions are often used as a proxy measure of adoption decisions [21,22], some previous studies [101,102] have shown that intentions are a far from perfect predictor of decision-making behaviors. Possible reasons are that intentions can change over time, and the more time passes, the greater the likelihood that unforeseen events will generate changes in intentions [103]. Furthermore, adoption decisions depend not only on producers’ intentions but also on organizations’ ability and resources for implementing the intention [103]. This view is confirmed by findings that managerial and risk coping capabilities have no effect on adoption intentions, while they have a significant positive effect on adoption decisions. Furthermore, this result confirms the findings of Arts et al. [32] that producers use different criteria in adoption intentions and adoption decisions.

7. Conclusions and Implications

This study aimed to identify the factors influencing adoption intention and adoption decision of the SIACS in NABEs and to confirm the differences in the factors influencing the two stages of adoption intention and decision. The results show that regional differences in agroecological conditions had the strongest influence on adoption intention and decision. This finding implies that agricultural experts, when they are developing or introducing new technologies, must pay great attention to the ecological suitability of new technologies in the regions where they are promoted. Emphasis must also be placed on raising producers’ awareness of the natural resource conditions required to implement the SIACS. For example, the ecological suitability of the SIACS in a particular locality can be demonstrated to producers by establishing demonstration plantations or by supporting the development of standard SIACS plantations.
Relative advantage, perceived barriers, and agricultural extension services have a significant impact on both adoption intention and decision and play a smaller role in the intention stage than in the decision stage. The agricultural extension sector can take advantage of emerging technologies, such as information and communication technologies, to provide more effective and efficient services—thereby increasing producers’ awareness of technological attributes. This difference suggests that extensionists can divide producers into two groups: those who have not formed an intention to adopt and those who have already formed this intention. Extension service resources can be skewed somewhat toward those who have already formed an intention to adopt, thus facilitating the shift from adoption intention to decision.
Neither management capacity nor risk response capacity has an effect on adoption intention, while both have a significant positive effect on adoption decision. This illustrates the importance of implementing SIACS competencies in the decision-making phase. Overcoming the challenges posed by adverse market conditions to SIACS implementation is a key to improving organizational risk response capacity, such as improving farmers’ price incentives and access to agricultural market information. Furthermore, this difference implies that, in enhancing producers’ capacity to implement the SIACS, managers can spend more of their resources on groups that have developed adoption intentions.
Organizational size is not significantly related to either adoption intentions or decisions. This implies that managers should avoid focusing on largescale operators while ignoring small- or medium-sized operators when implementing preferences related to SIACS adoption. The correlation between adoption intention and decision is 0.363, and the reason for the large gap between intention and decision is the limitation of the producers’ ability to implement the SIACS. A key policy implication of this result is that SIACS adoption would increase substantially if managers focused more on improving producers’ ability to implement the SIACS, such as through gardening subsidies and credit support.
In summary, the contributions of this study are fourfold. First, our study demonstrates the usefulness of integrating the DOI and TOE frameworks to understand organization-level SIP adoption behavior. The integration of the two frameworks provides an effective method to comprehensively analyze the determinants of SIP adoption at the organizational level and to distinguish their influences at different stages of adoption. Second, the results reveal the influence of technical, organizational, and environmental factors on NABEs’ intentions and decision to adopt SIACS, and confirm their varying influence between the two stages. This study provides a basis for technology promoters to categorize potential adopters by stage of technology adoption; it also provides targeted strategies to stimulate technology demand at different stages of adoption. Third, the agroecological conditions of the respondents were accurately quantified using GIS and remote sensing. The results demonstrate the importance of agroecological conditions in the adoption of SIPs at the organizational level, indicating that the ecological suitability of SIPs for a region is a prerequisite for their widespread adoption. Fourth, in the field of SIP adoption research, this study provides the first empirical evidence that adoption intentions can only partially explain adoption decisions, and finds that the organization’s technology adoption capabilities are an important influence in facilitating the shift from adoption intentions to adoption decisions.

8. Limitations and Future Research Directions

Although this study makes an important contribution to SIACS adoption, there are some limitations. First, the factors that influence the adoption of SIPs change over time [69]; this study used cross-sectional data to analyze the factors that influence SIACS and failed to consider time-related variables. In addition, regional differences in socioeconomic conditions can impact the probability of adoption of sustainable intensification technologies in different regions. However, when this study examines environmental contextual factors for SIACS adoption, only regional differences in agroecological conditions and policy factors are considered, and differences in other socioeconomic conditions are overlooked. Subsequently, we will explore ways to quantify the socio-economic conditions between regions and will then focus on the impact of these factors on the adoption of sustainable intensification technologies. Finally, new business owners are headed by rural elites, business leaders, or technicians. Leaders play the combined role of managers and major shareholders, and leader attitude has a crucial role in technology adoption [18]. The impact of leader attitude on SIACS adoption was not considered in our study. As attitude is an important factor in explaining technology adoption behaviors [21,22], further research is required to confirm the impact of leader attitude on SIACS adoption; this will facilitate the promotion of SIACS adoption by new business owners.

Author Contributions

All authors designed the research. Conceptualization, T.L.; Formal analysis, Z.W. and X.G.; Funding acquisition, T.L.; Investigation, Z.W., J.L., J.C. and X.G.; Methodology, Z.W., J.L. and J.C.; Project administration, T.L.; Supervision, T.L.; Visualization, J.C.; Writing—original draft, Z.W.; Writing—review and editing, J.L. and T.L. All authors have read and agreed to the published version of the manuscript.

Funding

This study was supported by the National Natural Science Foundation of China under Project No. 41771129.

Data Availability Statement

To access the data set please contact the corresponding author.

Acknowledgments

Thanks to the Agriculture Bureau and Fruit Bureau of Qianxian, Baishui, Luochuan, Huanglong, Qianyang and Fengxiang counties for their help and support in the data collection process.

Conflicts of Interest

The authors declare no conflict of interest.

References

  1. Huang, J.; Yang, J.; Rozelle, S. China’s agriculture: Drivers of change and implications for China and the rest of world. Agric. Econ. 2010, 41, 47–55. [Google Scholar] [CrossRef]
  2. Tilman, D.; Cassman, K.G.; Matson, P.A.; Naylor, R.; Polasky, S. Agricultural sustainability and intensive production practices. Nature 2002, 418, 671–677. [Google Scholar] [CrossRef]
  3. Jiao, X.-Q.; Mongol, N.; Zhang, F.-S. The transformation of agriculture in China: Looking back and looking forward. J. Integr. Agric. 2018, 17, 755–764. [Google Scholar] [CrossRef] [Green Version]
  4. Zhang, F.; Cui, Z.; Fan, M.; Zhang, W.; Chen, X.; Jiang, R. Integrated Soil-Crop System Management: Reducing Environmental Risk while Increasing Crop Productivity and Improving Nutrient Use Efficiency in China. J. Environ. Qual. 2011, 40, 1051–1057. [Google Scholar] [CrossRef] [PubMed]
  5. Lal, R. Sustainable intensification of China’s agroecosystems by conservation agriculture. Int. Soil Water Conserv. Res. 2018, 6, 1–12. [Google Scholar] [CrossRef]
  6. Lal, R. Soil carbon sequestration in China through agricultural intensification, and restoration of degraded and desertified ecosystems. Land Degrad. Dev. 2002, 13, 469–478. [Google Scholar] [CrossRef]
  7. Garnett, T.; Appleby, M.C.; Balmford, A.; Bateman, I.J.; Benton, T.G.; Bloomer, P.; Burlingame, B.; Dawkins, M.; Dolan, L.; Fraser, D.; et al. Sustainable Intensification in Agriculture: Premises and Policies. Sciene 2013, 341, 33–34. [Google Scholar] [CrossRef] [PubMed]
  8. Pretty, J. Intensification for redesigned and sustainable agricultural systems. Science 2018, 362, eaav0294. [Google Scholar] [CrossRef] [PubMed] [Green Version]
  9. Weltin, M.; Zasada, I.; Piorr, A.; Debolini, M.; Geniaux, G.; Perez, O.M.; Scherer, L.; Marco, L.T.; Schulp, C.J.E. Conceptualising fields of action for sustainable intensification—A system aticliterature review and application to regional case studies. Agric. Ecosyst. Environ. 2018, 257, 68–80. [Google Scholar] [CrossRef]
  10. Xu, C.; Chunru, H.; Taylor, D.C. Sustainable agricultural development in China. World Dev. 1992, 20, 1127–1144. [Google Scholar] [CrossRef]
  11. Jiao, X.-Q.; He, G.; Cui, Z.-L.; Shen, J.-B.; Zhang, F.-S. Agri-environment policy for grain production in China: Toward sustainable intensification. China Agric. Econ. Rev. 2018, 10, 78–92. [Google Scholar] [CrossRef]
  12. Godfray, H.C.J.; Beddington, J.R.; Crute, I.R.; Haddad, L.; Lawrence, D.; Muir, J.F.; Pretty, J.; Robinson, S.; Thomas, S.M.; Toulmin, C. Food Security: The Challenge of Feeding 9 Billion People. Science 2010, 327, 812–818. [Google Scholar] [CrossRef] [Green Version]
  13. Opinions of the CPC Central Committee and the State Council on Accelerating the Development of Modern Agriculture and Further Enhancing the Vitality of Rural Development; China Cooperative Economy; Central Committee of the Communist Party of China, State Council: Beijing, China, 2013; Volume 2, pp. 4–9.
  14. Kong, X.Z. Status and top level design of new agricultural management entities. Reform 2014, 5, 34–36. [Google Scholar]
  15. Zhang, H.Y. Institutional features and development direction of China’s modern agricultural management. Chin. Rural. Econ. 2018, 397, 25–35. [Google Scholar]
  16. Department of Rural Economic Institutions and Management (DREIM). General Administration of Rural Cooperative Economic Management (GARCEM); China Rural Business Management Statistics Annual Report; China Agricultural Press: China, Beijing, 2016. [Google Scholar]
  17. Ruan, R.P.; Cao, B.X.; Zhou, P.; Zheng, F.T. The driving capacity of New Agricultural Management Entities and its determinants: An analysis based on data from 2615 New Agricultural Management Entities in China. Chin. Rural. Econ. 2017, 11, 17–32. [Google Scholar]
  18. Wang, Y.-N.; Jin, L.; Mao, H. Farmer Cooperatives’ Intention to Adopt Agricultural Information Technology—Mediating Effects of Attitude. Inf. Syst. Front. 2019, 21, 565–580. [Google Scholar] [CrossRef]
  19. Yang, W.; Yan, W. Analysis on Function Orientation and Development Countermeasures of New Agricultural Business Entities. J. Northeast. Agric. Univ. 2016, 23, 82–88. [Google Scholar] [CrossRef]
  20. Gao, Y.; Zhang, X.; Lu, J.; Wu, L.; Yin, S. Adoption behavior of green control techniques by family farms in China: Evidence from 676 family farms in Huang-huai-hai Plain. Crop. Prot. 2017, 99, 76–84. [Google Scholar] [CrossRef]
  21. Zeweld, W.; Van Huylenbroeck, G.; Tesfay, G.; Speelman, S. Smallholder farmers’ behavioural intentions towards sustainable agricultural practices. J. Environ. Manag. 2017, 187, 71–81. [Google Scholar] [CrossRef] [PubMed] [Green Version]
  22. Daxini, A.; O’Donoghue, C.; Ryan, M.; Buckley, C.; Barnes, A.P.; Daly, K. Which factors influence farmers’ intentions to adopt nutrient management planning? J. Environ. Manag. 2018, 224, 350–360. [Google Scholar] [CrossRef] [PubMed]
  23. Jera, R.; Ajayi, O.C. Logistic modelling of smallholder livestock farmers’ adoption of tree-based fodder technology in Zimbabwe. Agrekon 2008, 47, 379–392. [Google Scholar] [CrossRef]
  24. Pilarova, T.; Bavorova, M.; Kandakov, A. Do farmer, household and farm characteristics influence the adoption of sustainable practices? The evidence from the Republic of Moldova. Int. J. Agric. Sustain. 2018, 16, 367–384. [Google Scholar] [CrossRef]
  25. Teklewold, H.; Kassie, M.; Shiferaw, B. Adoption of Multiple Sustainable Agricultural Practices in Rural Ethiopia. J. Agric. Econ. 2013, 64, 597–623. [Google Scholar] [CrossRef]
  26. Kassie, M.; Teklewold, H.; Jaleta, M.; Marenya, P.; Erenstein, O. Understanding the adoption of a portfolio of sustainable intensification practices in eastern and southern Africa. Land Use Policy 2015, 42, 400–411. [Google Scholar] [CrossRef]
  27. Kotu, B.H.; Alene, A.; Manyong, V.; Hoeschle-Zeledon, I.; Larbi, A. Adoption and impacts of sustainable intensification practices in Ghana. Int. J. Agric. Sustain. 2017, 15, 539–554. [Google Scholar] [CrossRef]
  28. Jabbar, A.; Wu, Q.; Peng, J.; Zhang, J.; Imran, A.; Yao, L. Synergies and Determinants of Sustainable Intensification Practices in Pakistani Agriculture. Land 2020, 9, 110. [Google Scholar] [CrossRef] [Green Version]
  29. Cafer, A.M.; Rikoon, J.S. Adoption of new technologies by smallholder farmers: The contributions of extension, research institutes, cooperatives, and access to cash for improving tef production in Ethiopia. Agric. Hum. Values 2018, 35, 685–699. [Google Scholar] [CrossRef]
  30. Ndiritu, S.W.; Kassie, M.; Shiferaw, B. Are there systematic gender differences in the adoption of sustainable agricultural intensification practices? Evidence from Kenya. Food Policy 2014, 49, 117–127. [Google Scholar] [CrossRef]
  31. Dimara, E.; Skuras, D. Adoption of agricultural innovations as a two-stage partial observability process. Agric. Econ. 2003, 28, 187–196. [Google Scholar] [CrossRef]
  32. Arts, J.W.; Frambach, R.T.; Bijmolt, T.H. Generalizations on consumer innovation adoption: A meta-analysis on drivers of intention and behavior. Int. J. Res. Mark. 2011, 28, 134–144. [Google Scholar] [CrossRef]
  33. Davis, F.D. Perceived Usefulness, Perceived Ease of Use, and User Acceptance of Information Technology. MIS Q. 1989, 13, 319–339. [Google Scholar] [CrossRef] [Green Version]
  34. Ajzen, I.; Fishbein, M. Understanding Attitudes and Predicting Social Behaviour; Prentice-Hall: Hoboken, NJ, USA, 1980. [Google Scholar]
  35. Ajzen, I. The Theory of Planned Behavior. Organ. Behav. Hum. Decis. Process. 1991, 50, 179–211. [Google Scholar] [CrossRef]
  36. Rogers, E. Diffusion of Innovations, 4th ed.; The Free Press: New York, NY, USA, 2003. [Google Scholar]
  37. Tornatzky, L.; Fleischer, M. The Process of Technology Innovation; Lexington Books: Lexington, KY, USA, 1990. [Google Scholar]
  38. Venkatesh, V.; Bala, H. Technology Acceptance Model 3 and a Research Agenda on Interventions. Decis. Sci. 2008, 39, 273–315. [Google Scholar] [CrossRef] [Green Version]
  39. Prokopy, L.; Floress, K.; Klotthor-Weinkauf, D.; Baumgart-Getz, A. Determinants of agricultural best management practice adoption: Evidence from the literature. J. Soil Water Conserv. 2008, 63, 300–311. [Google Scholar] [CrossRef]
  40. Tey, Y.S.; Brindal, M.K. Factors influencing the adoption of precision agricultural technologies: A review for policy implications. Precis. Agric. 2012, 13, 713–730. [Google Scholar] [CrossRef]
  41. Knowler, D.; Bradshaw, B. Farmers’ adoption of conservation agriculture: A review and synthesis of recent research. Food Policy 2007, 32, 25–48. [Google Scholar] [CrossRef]
  42. Pannell, D.J.; Marshall, G.R.; Barr, N.; Curtis, A.; Vanclay, F.; Wilkinson, R. Understanding and promoting adoption of conservation practices by rural landholders. Aust. J. Exp. Agric. 2006, 46, 1407–1424. [Google Scholar] [CrossRef] [Green Version]
  43. Baumgart-Getz, A.; Prokopy, L.S.; Floress, K. Why farmers adopt best management practice in the United States: A meta-analysis of the adoption literature. J. Environ. Manag. 2012, 96, 17–25. [Google Scholar] [CrossRef] [PubMed] [Green Version]
  44. Reimer, A.P.; Weinkauf, D.K.; Prokopy, L.S. The influence of perceptions of practice characteristics: An examination of agricultural best management practice adoption in two Indiana watersheds. J. Rural. Stud. 2012, 28, 118–128. [Google Scholar] [CrossRef]
  45. Tey, Y.S.; Li, E.; Bruwer, J.; Abdullah, A.M.; Brindal, M.; Radam, A.; Ismail, M.M.; Darham, S. The relative importance of factors influencing the adoption of sustainable agricultural practices: A factor approach for Malaysian vegetable farmers. Sustain. Sci. 2013, 9, 17–29. [Google Scholar] [CrossRef]
  46. Tornatzky, L.G.; Klein, K.J. Innovation characteristics and innovation adoption-implementation: A meta-analysis of findings. IEEE Trans. Eng. Manag. 1982, EM-29, 28–45. [Google Scholar] [CrossRef]
  47. Kapoor, K.K.; Dwivedi, Y.K.; Williams, M.D. Rogers’ Innovation Adoption Attributes: A Systematic Review and Synthesis of Existing Research. Inf. Syst. Manag. 2014, 31, 74–91. [Google Scholar] [CrossRef] [Green Version]
  48. Ryan, S.D.; Abitia, G.R.; Windsor, J.C. Factors affecting the adoption of knowledge management technologies: An international perspective. In Proceedings of the 6th Americas Conference on Information Systems (AMCIS 2000), Long Beach, CA, USA, 10–13 August 2000; pp. 1201–1294. Available online: http://aisel.aisnet.org/amcis2000/197/ (accessed on 15 October 2015).
  49. Lee, J. Discriminant analysis of technology adoption behavior: A case of internet technologies in small businesses. J. Comput. Inf. Syst. 2004, 44, 57–66. [Google Scholar] [CrossRef]
  50. Robinson, T. Advances in apple culture worldwide. Rev. Bras. Frutic. 2011, 33, 37–47. [Google Scholar] [CrossRef] [Green Version]
  51. Vanclay, F. Barriers to Adoption: A General Overview of the Issues. Rural. Soc. 1992, 2, 10–12. [Google Scholar] [CrossRef]
  52. Harwood, J.L.; Heifner, R.G.; Coble, K.H.; Perry, J.E.; Somwaru, A. Managing Risk in Farming: Concepts, Research, and Analysis. US Department of Agriculture, Economic Research Service, Washington, DC. Available online: http://www.ers.usda.gov/media/1761672/aer774.pdf (accessed on 15 October 2015).
  53. Noltze, M.; Schwarze, S.; Qaim, M. Understanding the adoption of system technologies in smallholder agriculture: The system of rice intensification (SRI) in Timor Leste. Agric. Syst. 2012, 108, 64–73. [Google Scholar] [CrossRef]
  54. Lee, D.R. Agricultural Sustainability and Technology Adoption: Issues and Policies for Developing Countries. Am. J. Agric. Econ. 2005, 87, 1325–1334. [Google Scholar] [CrossRef]
  55. Green, L.; Fry, A.F.; Myerson, J. Discounting of Delayed Rewards: A Life-Span Comparison. Psychol. Sci. 1994, 5, 33–36. [Google Scholar] [CrossRef]
  56. Ahuja, R.; Jain, M.; Sawhney, A.; Arif, M. Adoption of BIM by architectural firms in India: Technology–organization–environment perspective. Arch. Eng. Des. Manag. 2016, 12, 311–330. [Google Scholar] [CrossRef] [Green Version]
  57. Feder, G.; Slade, R. The Role of Public Policy in the Diffusion of Improved Agricultural Technology. Am. J. Agric. Econ. 1985, 67, 423–428. [Google Scholar] [CrossRef]
  58. Antle, J.M. Econometric Estimation of Producers’ Risk Attitudes. Am. J. Agric. Econ. 1987, 69, 509–522. [Google Scholar] [CrossRef]
  59. Rosenzweig, M.R.; Binswanger, H.P. Wealth, Weather Risk and the Composition and Profitability of Agricultural Investments. Econ. J. 1993, 103, 56. [Google Scholar] [CrossRef] [Green Version]
  60. Dercon, S.; Christiaensen, L. Consumption risk, technology adoption and poverty traps: Evidence from Ethiopia. J. Dev. Econ. 2011, 96, 159–173. [Google Scholar] [CrossRef] [Green Version]
  61. Feder, G.; Just, R.E.; Zilberman, D. Adoption of Agricultural Innovations in Developing Countries: A Survey. Econ. Dev. Cult. Chang. 1985, 33, 255–298. [Google Scholar] [CrossRef] [Green Version]
  62. Feder, G.; Umali, D.L. The adoption of agricultural innovations. Technol. Forecast. Soc. Chang. 1993, 43, 215–239. [Google Scholar] [CrossRef]
  63. Place, F.; Dewees, P. Policies and incentives for the adoption of improved fallows. Agrofor. Syst. 1999, 47, 323–343. [Google Scholar] [CrossRef]
  64. Owens, T.; Hoddinott, J.; Kinsey, B. The Impact of Agricultural Extension on Farm Production in Resettlement Areas of Zimbabwe. Econ. Dev. Cult. Chang. 2003, 51, 337–357. [Google Scholar] [CrossRef] [Green Version]
  65. Birkhaeuser, D.; Evenson, R.E.; Feder, G. The Economic Impact of Agricultural Extension: A Review. Econ. Dev. Cult. Chang. 1991, 39, 607–650. [Google Scholar] [CrossRef]
  66. Dinar, A.; Karagiannis, G.; Tzouvelekas, V. Evaluating the impact of agricultural extension on farms’ performance in Crete: A nonneutral stochastic frontier approach. Agric. Econ. 2007, 36, 135–146. [Google Scholar] [CrossRef]
  67. Kassie, M.; Jaleta, M.; Shiferaw, B.; Mmbando, F.; Mekuria, M. Adoption of interrelated sustainable agricultural practices in smallholder systems: Evidence from rural Tanzania. Technol. Forecast. Soc. Chang. 2013, 80, 525–540. [Google Scholar] [CrossRef]
  68. Tey, Y.S. The Adoption of Sustainable Agricultural Practices: An Integrative Approach for Malaysian Vegetable Farmers. Ph.D. Thesis, The University of Adelaide, Adelaide, Australia, 2013. [Google Scholar]
  69. D’Emden, F.H.; Llewellyn, R.S.; Burton, M.P. Adoption of conservation tillage in Australian cropping regions: An application of duration analysis. Technol. Forecast. Soc. Chang. 2006, 73, 630–647. [Google Scholar] [CrossRef]
  70. Dankyi, A.; Andah, K.; Moris, M.M.; Fosu, Y. Farmer characteristics, ecological zones and adoption decisions: A tobit model application for maize technology in Ghana. Agric. Food Sci. J. Ghana 2006, 4, 341–351. [Google Scholar] [CrossRef]
  71. Fishbein, M.; Ajzen, I. Predicting and Changing Behavior: The Reasoned Action Approach; Taylor and Francis: New York, NY, USA, 2010. [Google Scholar]
  72. Bamberg, S. How does environmental concern influence specific environmentally related behaviors? A new answer to an old question. J. Environ. Psychol. 2003, 23, 21–32. [Google Scholar] [CrossRef]
  73. Maliuk, T.; Pcholkina, N.; Kozlova, L.; Yeremenko, O. Nitrogen in Soil Profile and Fruits in the Intensive Apple Cultivation Technology. Mod. Dev. Paths Agric. Prod. 2019, 737–751. [Google Scholar] [CrossRef]
  74. Fallahi, E.; Neilsen, D.; Neilsen, G.H.; Fallahi, B.; Shafii, B. Efficient Irrigation for Optimum Fruit Quality and Yield in Apples. HortScience 2010, 45, 1616–1625. [Google Scholar] [CrossRef] [Green Version]
  75. Im, I.; Kim, Y.; Han, H.-J. The effects of perceived risk and technology type on users’ acceptance of technologies. Inf. Manag. 2008, 45, 1–9. [Google Scholar] [CrossRef]
  76. Zhu, K.; Dong, S.; Xu, S.; Kraemer, K.L. Innovation diffusion in global contexts: Determinants of post-adoption digital transformation of European companies. Eur. J. Inf. Syst. 2006, 15, 601–616. [Google Scholar] [CrossRef]
  77. Yang, W.J.; Ye, X.S. The Uncertainty and Multi-level Risk Prevention System of Chinese Agriculture. Guizhou Social Sci. 2008, 10, 94–98. [Google Scholar] [CrossRef]
  78. Feng, X.L.; Chen, Z.X.; Huo, X.X. Influencing factors of apple farmer adaptation to meteorological disasters. Resour. Sci. 2015, 37, 2491–2500. [Google Scholar]
  79. Lu, Q.N. The distribution and ecologic factors of apples in China. Sci. Agric. Sin. 1980, 46–51. [Google Scholar]
  80. Wossen, T.; Abdoulaye, T.; Alene, A.; Haile, M.G.; Feleke, S.; Olanrewaju, A.; Manyong, V. Impacts of extension access and cooperative membership on technology adoption and household welfare. J. Rural. Stud. 2017, 54, 223–233. [Google Scholar] [CrossRef] [PubMed]
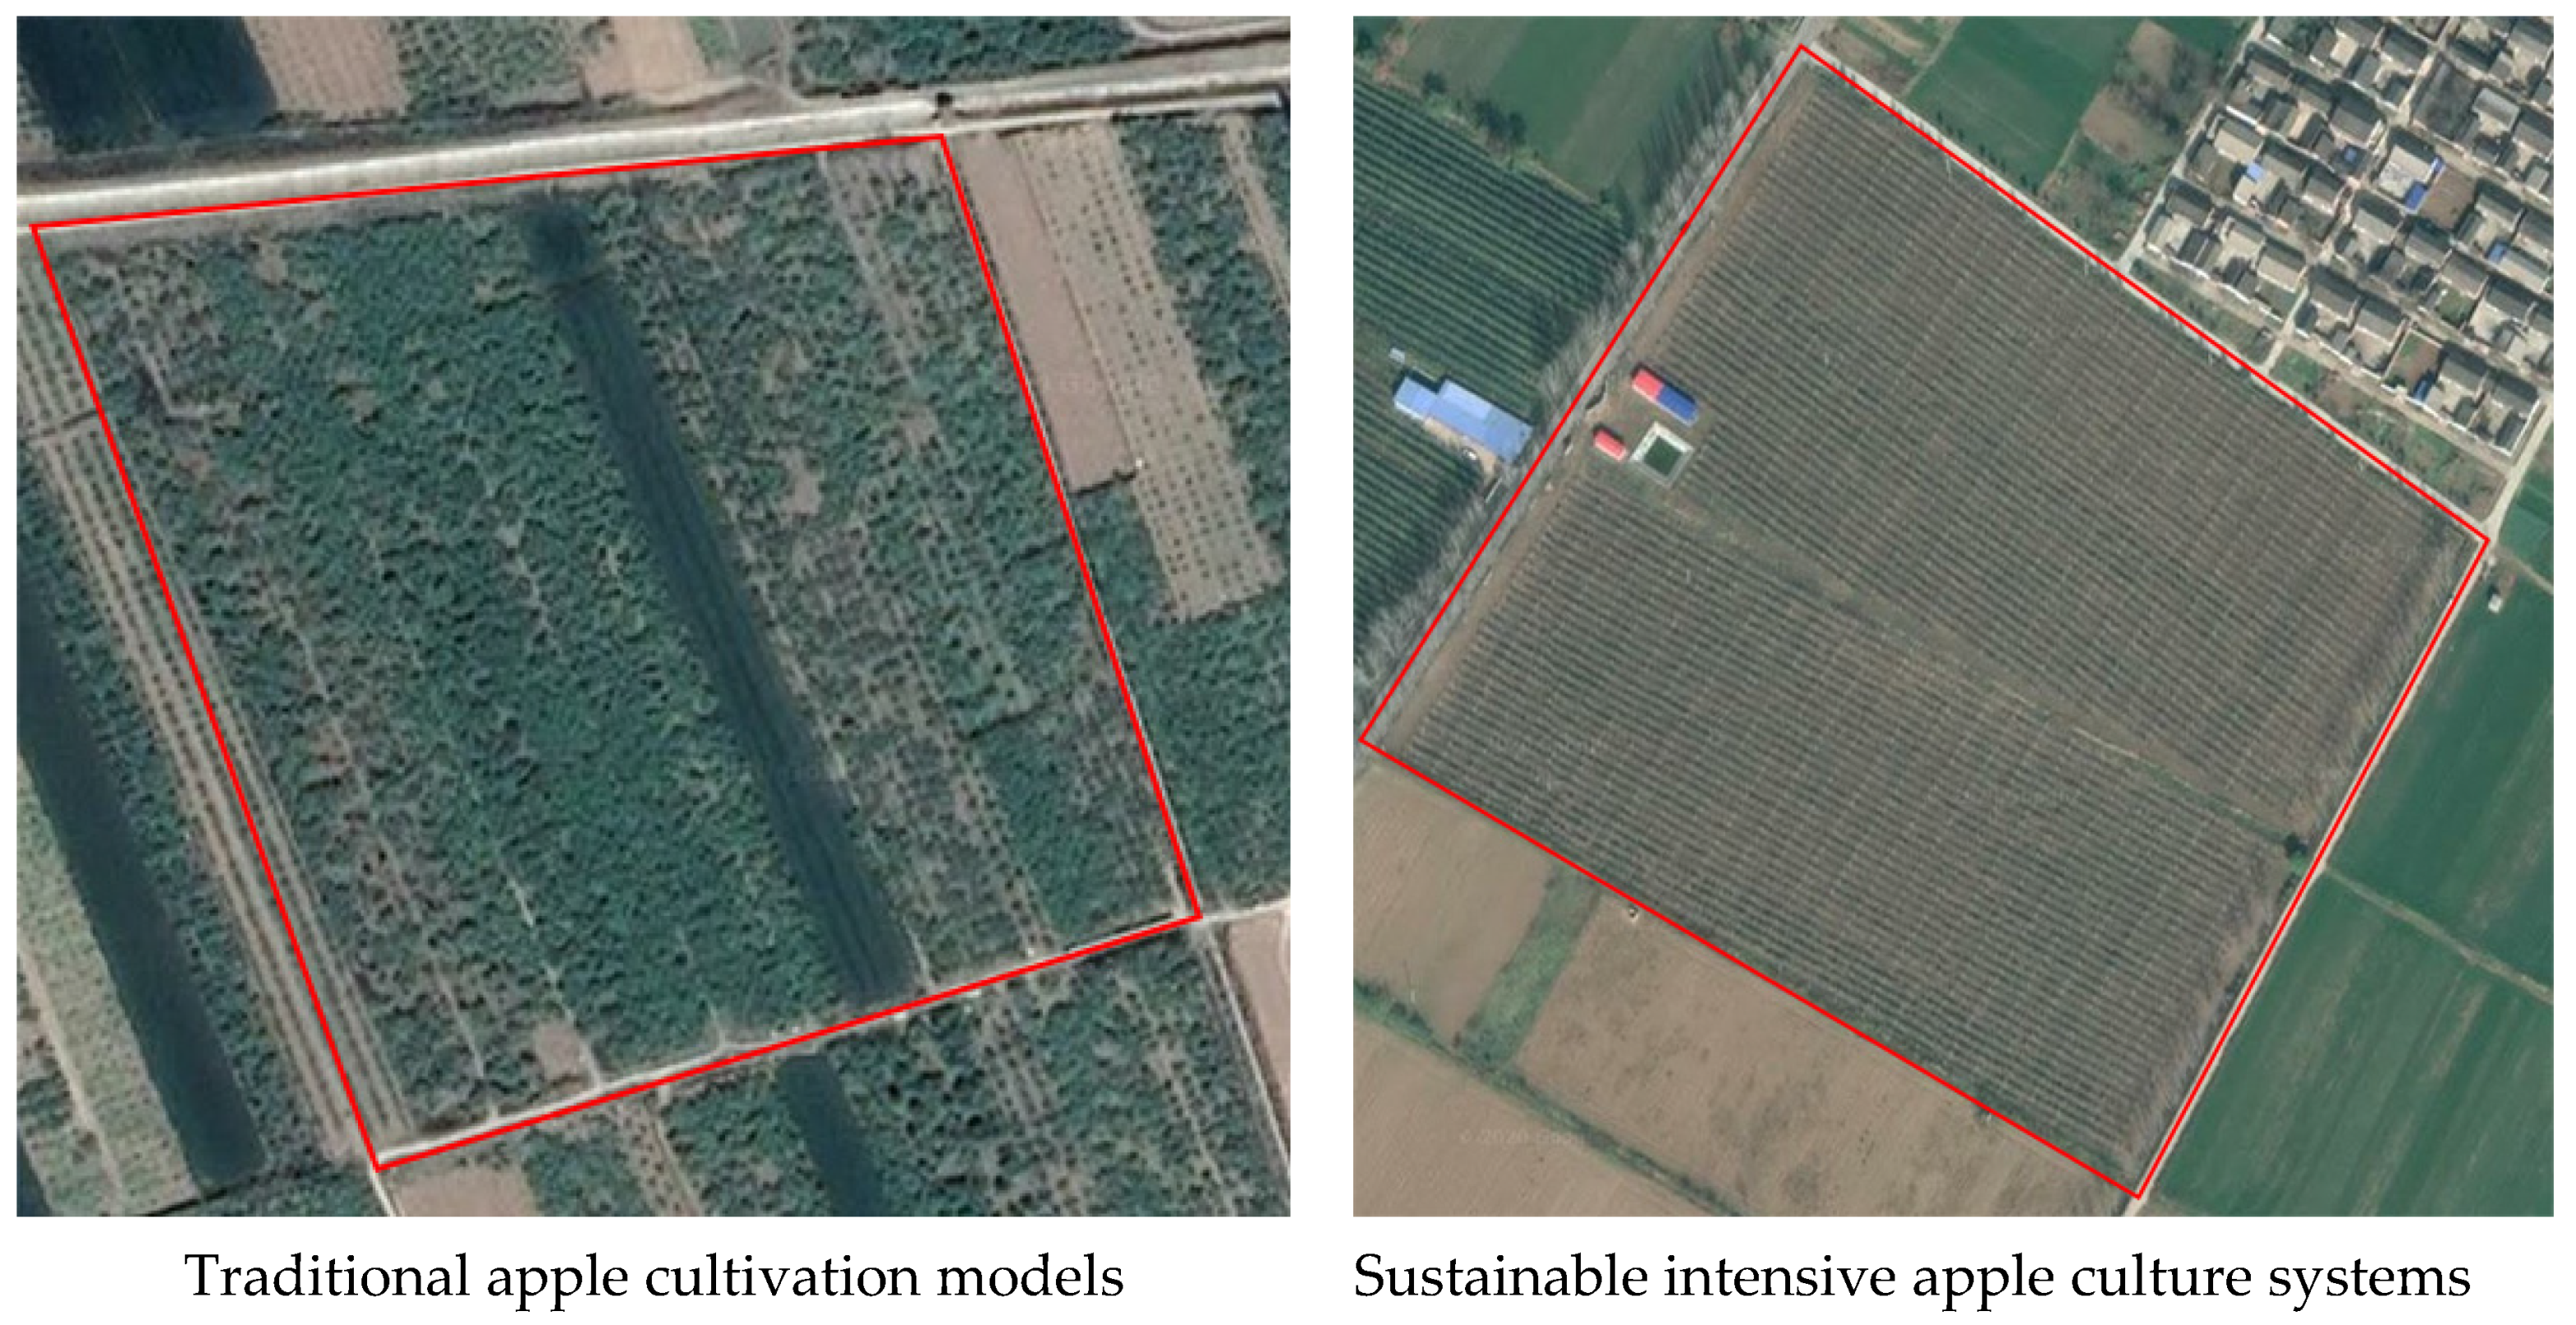
  81. Sheng, L. Reach for good apple—Intensive cultivation mode and key technology of apple dwarf stock in Loess Plateau. China Rural Sci. Technol. 2017, 09, 10–11. [Google Scholar] [CrossRef]
  82. Schumacker, R.E.; Lomax, R.G. A Beginner’s Guide to Structural Equation Modeling; Psychology Press: New York, NY, USA, 2004. [Google Scholar]
  83. Hu, L.; Bentler, P.M. Evaluating model fit. In Structural Equation Modeling: Concepts, Issues, and Applications; Hoyle, R.H., Ed.; Sage: Thousand Oaks, CA, USA, 1995; pp. 76–99. [Google Scholar]
  84. Shevlin, M.; Miles, J. Effects of sample size, model specification and factor loadings on the GFI in confirmatory factor analysis. Pers. Individ. Differ. 1998, 25, 85–90. [Google Scholar] [CrossRef]
  85. Fornell, C.; Bookstein, F.L. Two Structural Equation Models: LISREL and PLS Applied to Consumer Exit-Voice Theory. J. Mark. Res. 1982, 19, 440. [Google Scholar] [CrossRef] [Green Version]
  86. Bagozzi, R.P.; Yi, Y. On the evaluation of structural equation models. J. Acad. Mark. Sci. 1988, 16, 74–94. [Google Scholar] [CrossRef]
  87. Fornell, C.; Larcker, D.F. Evaluating Structural Equation Models with Unobservable Variables and Measurement Error. J. Mark. Res. 1981, 18, 39–50. [Google Scholar] [CrossRef]
  88. Arbuckle, J.G.; Roesch-McNally, G. Cover crop adoption in Iowa: The role of perceived practice characteristics. J. Soil Water Conserv. 2015, 70, 418–429. [Google Scholar] [CrossRef] [Green Version]
  89. Batz, F. The influence of technology characteristics on the rate and speed of adoption. Agric. Econ. 1999, 21, 121–130. [Google Scholar] [CrossRef]
  90. Gardial, S.F.; Clemons, D.S.; Woodruff, R.B.; Schumann, D.W.; Burns, M.J. Comparing Consumers’ Recall of Prepurchase and Postpurchase Product Evaluation Experiences. J. Consum. Res. 1994, 20, 548–560. [Google Scholar] [CrossRef]
  91. Thompson, D.V.; Hamilton, R.W.; Rust, R.T. Feature Fatigue: When Product Capabilities Become Too Much of a Good Thing. J. Mark. Res. 2005, 42, 431–442. [Google Scholar] [CrossRef]
  92. Daberkow, S.G.; McBride, W.D. Farm and Operator Characteristics Affecting the Awareness and Adoption of Precision Agriculture Technologies in the US. Precis. Agric. 2003, 4, 163–177. [Google Scholar] [CrossRef]
  93. Ribaudo, M.O.; Johansson, R.C. Nutrient Management Use at the Rural–Urban Fringe: Does Demand for Environmental Quality Play a Role? Rev. Agric. Econ. 2007, 29, 689–699. [Google Scholar] [CrossRef]
  94. Paustian, M.; Theuvsen, L. Adoption of precision agriculture technologies by German crop farmers. Precis. Agric. 2016, 18, 701–716. [Google Scholar] [CrossRef]
  95. Doss, C.; Mwangi, W.; Verkuijl, H.; de Groote, H. Adoption of Maize and Wheat Technologies in Eastern Africa: A Synthesis of Findings of 22 Case Studies; CYMMYT Economics Working Paper 03-01; CYMMIT: Mexico, D.F., Mexico, 2003. [Google Scholar]
  96. Zhang, C.Y.; Chang, Q.; Huo, X.X. Can the Moderate scale Management Really Reduce the Production Costs of Agricultural Products: An Empirical Analysis Based on 661 Shaanxi Apple Farmers. J. Agrotech. Econ. 2018, 10, 26–35. [Google Scholar] [CrossRef]
  97. Daxini, A.; Ryan, M.; O’Donoghue, C.; Barnes, A. Understanding farmers’ intentions to follow a nutrient management plan using the theory of planned behaviour. Land Use Policy 2019, 85, 428–437. [Google Scholar] [CrossRef]
  98. Smith, R.E. Land Tenure, Fixed Investment, and Farm Productivity: Evidence from Zambia’s Southern Province. World Dev. 2004, 32, 1641–1661. [Google Scholar] [CrossRef]
  99. Trope, Y.; Liberman, N. Temporal construal. Psychol. Rev. 2003, 110, 403–421. [Google Scholar] [CrossRef] [PubMed]
  100. Adegbola, P.; Gardebroek, C. The effect of information sources on technology adoption and modification decisions. Agric. Econ. 2007, 37, 55–65. [Google Scholar] [CrossRef]
  101. Kerner, M.S.; Grossman, A.H. Attitudinal, Social, and Practical Correlates to Fitness Behavior: A Test of the Theory of Planned Behavior. Percept. Mot. Ski. 1998, 87, 1139–1154. [Google Scholar] [CrossRef] [PubMed]
  102. Conner, M.; Sheeran, P.; Norman, P.; Armitage, C.J. Temporal stability as a moderator of relationships in the Theory of Planned Behaviour. Br. J. Soc. Psychol. 2000, 39, 469–493. [Google Scholar] [CrossRef] [PubMed]
  103. Ajzen, I. Attitudes, Personality and Behavior, 2nd ed.; Open University Press: New York, NY, USA, 2005. [Google Scholar]
Figure 1. Sustainable intensive apple culture system (SIACS) adoption model.
Agronomy 11 02435 g001
Figure 2. Comparison of remote sensing images of sustainable intensive apple culture systems and traditional apple cultivation models.
Agronomy 11 02435 g002
Table 1. Definitions and summary statistics of the variables used in the analysis by types of new business entities.
Latent VariablesTwo Order Latent Variable Observed VariablesDescriptionAverage ValueStandard Deviation
SIACS adoptionAdoption intentionAI1Adoption AttitudesWe are willing to adopt SIACS: Likert scale (1 D strongly disagree; 5 D strongly agree)3.541.13
AI2Promotion intentionI would recommend SIACS to others: Likert scale (1 D strongly disagree; 5 D strongly agree)3.071.33
Adoption intensityAIE1Cultivation patternHas the dwarf anvil intensification model been adopted? categorical (yes = 1, no = 0)0.470.50
AIE2Nutrient managementBurying chemical fertilizer = 1, burying organic fertilizer = 2, burying of chemical and organic fertilizers = 3, burying of chemical fertilizers and spreading of organic fertilizers = 3, water fertilization and buried organic fertilizer = 4, water fertilization = 4, spreading of organic fertilizer = 4, water fertilization and spreading of organic fertilizer = 51.891.52
AII3IrrigationLarge flood = 1, furrow = 2, pit = 3, sprinkler = 4, drip = 51.651.44
TechnologyRelative advantageRA1Labor savingI think SIACS technology is easy to mechanize and saves labor compared to traditional techniques: Likert scale (1 D strongly disagree; 5 D strongly agree)3.281.41
RA2Increased productionI think the advantage of SIACS is that its high-density planting can dramatically increase average acre yields: Likert scale (1 D strongly disagree; 5 D strongly agree)2.671.38
Perceived barriersPB1ComplexityI find the SIACS technique easy to grasp and manipulate: Likert scale (1 D strongly disagree; 5 D strongly agree)3.191.22
PB2Perceived riskSIACS is likely to fall short of expectations and disappoint me: Likert scale (1 D strongly disagree; 5 D strongly agree)2.951.16
OrganizationOrganization sizeOS1AreaAcreage of apples: Continuous (hectares)11.8328.72
OS2Number of employeesNumber of permanent employees: Continuous (ren)10.5425.29
Management capacityMC1Formal educationLiteracy of decision makers: categorical (no education = 1, primary = 2, middle school = 3, high school = 4, college and above = 5)3.540.94
MC2Technical specializationWhether to hire a technician specializing in SIACS management: categorical (yes = 1, no = 0)0.260.44
Risk response capacityRRC1Market risk responseIf the market price for apples is low, would you choose to sell them cheaply or store them in cold storage until the price is right: categorical (store = 1, sell = 0)0.650.48
RRC3Natural risk responseWhether agricultural insurance has been purchased: categorical (yes = 1, no = 0)0.470.50
EnvironmentPublic agricultural extension servicesPAES1Government extension effortsStrong government support for SIACS adoption: Likert scale (1 D strongly disagree; 5 D strongly agree)4.171.22
PAES2Extension trainingParticipation in SIACS-related technical training events organized by the government has been very helpful to organizations: Likert scale (1 D strongly disagree; 5 D strongly agree)3.761.20
Agroecological endowmentsAE1Ecological suitabilityBased on apple climate suitability zoning criteria: apple climate suitability zoning table (1 point for each condition)3.061.65
AE2Stability of irrigation waterOrchards can be irrigated promptly when water is scarce: Likert scale (1 D strongly disagree; 5 D strongly agree)2.941.63
Table 2. Criteria for climate suitability zoning of apples.
Annual Average Temperature (°C)Annual Precipitation (mm)Average Temperature in Mid-January (°C)Annual Extreme Lowest Temperature (°C)Average Temperature in June–August (°C)Number of Days >35 °CAverage Minimum Temperature in Summer (°C)
The most suitable area9–11560–750>−14>−2719–23<615–18
Table 3. Construct reliability and convergent validity.
Range of Standardized
Path Loadings
Convergent Validity
(p-Value)
Composite ReliabilityAverage Variance
Extracted
PB0.805–0.866All < 0.010.7650.699
RA0.826–0.862All < 0.010.7790.713
MC0.861–0.893All < 0.010.8370.769
OS0.531–0.894All < 0.010.8530.541
RRC0.778–0.889All < 0.010.7630.698
AE0.811–0.949All < 0.010.8460.779
PAES0.701–0.995All < 0.010.8090.741
AI0.775–0.897All < 0.010.7690.703
AIE0.786–0.820All < 0.010.6930.569
Table 4. Measurement models’ discriminant validity test results.
PBRAMCOSRRCAEPAESWTASIACSA
PB0.836
RA−0.3590.844
MC−0.520.3950.877
OS−0.4030.2940.6000.735
RRC−0.4130.1960.4820.3030.835
AE−0.4180.4650.4580.3790.2530.883
PAES−0.280.4640.2640.2780.3020.3440.861
AI−0.5110.5240.3760.3110.1920.5420.3440.838
AIE−0.6310.6720.6550.4820.5520.6880.550.4580.754
Table 5. Model fit indices for the structural model.
Indexx2dfx2/dfCFIGFIAGFIRMSEA
Fitted values229.8051231.8680.8970.9430.8420.065
Recommended valuesThe smaller the betterThe bigger the better<3>0.8>0.9>0.8<0.08
Table 6. Results of the estimation structural model.
HypothesisPath FromPath toR2Standard Error S.E.Critical Ratio C.R.pPath CoefficientSupported
H1aPerceived barriersSIACS adoption intention0.3640.066−4.041***−0.344Yes
H2aRelative advantage0.0473.484***0.285Yes
H3aManagement capacity0.2190.2530.8000.026No
H4aOrganizational size0.0060.4030.6870.038No
H5aRisk response capacity0.172−0.8260.4090.071No
H6aAgroecological endowments0.0434.456***0.361Yes
H7aPublic agricultural extension services0.0582.2350.0250.173Yes
H1bPerceived barriersSIACS adoption decision0.8710.068−3.795***−0.382Yes
H2bRelative advantage0.0523.895***0.409Yes
H3bManagement capacity0.1942.2570.0240.242Yes
H4bOrganizational size0.0050.6310.5280.058No
H5bRisk response capabilities0.1593.0110.0030.278Yes
H6bAgroecological endowments0.0565.696***0.699Yes
H7bPublic agricultural extension services0.0593.545***0.324Yes
H8Adoption intention0.099−3.1640.0020.363Yes
Note: The C.R. value is a quotient of the non-standardized factor loading divided by the standard error. When |C.R.| > 1.96, the test result is significant at a level of 5%. When |C.R.| > 2.58, the test result is significant at a level of 1%. If the probability of the significance value is <0.001 then the p-value is indicated by “***”.
Publisher’s Note: MDPI stays neutral with regard to jurisdictional claims in published maps and institutional affiliations.

