Article

Comparative Efficiency of Mineral, Chelated and Nano Forms of Zinc and Iron for Improvement of Zinc and Iron in Chickpea (Cicer arietinum L.) through Biofortification

1
Department of Soil Science, Punjab Agricultural University, Ludhiana 141004, India
2
Indian Institute of Soil Science, Bhopal 462038, India
3
Department of Biotechnology, College of Science, Taif University, P.O. Box 11099, Taif 21944, Saudi Arabia
4
Department of Biology, College of Science, Taif University, P.O. Box 11099, Taif 21944, Saudi Arabia
5
Department of Agronomy, Bangladesh Wheat and Maize Research Institute, Dinajpur 5200, Bangladesh
*
Authors to whom correspondence should be addressed.
Agronomy 2021, 11(12), 2436; https://doi.org/10.3390/agronomy11122436
Submission received: 13 October 2021 / Revised: 6 November 2021 / Accepted: 27 November 2021 / Published: 29 November 2021
(This article belongs to the Special Issue Development and Efficiency of New Micronutrient Fertilizers)

Abstract

:
Nanoparticles (NPs), due to their tailored properties, serve as potential sources of nutrients for the biofortification of edible grains. Chickpeas are a valued legume crop, widely consumed in developing countries. Thus, to improve the Zn and Fe content in chickpeas, a two-year study was conducted to examine the potential of the foliar application of mineral (0.5% Zn and Fe), chelated (0.3% Zn and Fe) and nanoforms (0.5% ZFN) of fertilizers to enhance Zn and Fe content in chickpea. The foliar application of 0.5% ZnO NPs + 0.5% Fe2O3 NPs (ZFN) at the pre-flowering stage showed the highest potential to increase grain yield, Zn and Fe content and their uptake as a single foliar application of nano-fertilizers showed comparable results to two foliar applications of mineral and chelated forms. The grain and straw yield (14.07 and 33.04 q ha−1, respectively) under ZFN treatment was significantly higher over the control (9.20 and 27.49 q ha−1, respectively). A similar trend was observed for Zn and Fe content in grain (42.29 and 86.51 mg kg−1, respectively). For nutrient uptake, ZFN treatment showed the highest uptake of Zn and Fe in grain (604.49 and 1226.22 g ha−1, respectively) and straw (729.55 and 9184.67 g ha−1, respectively). Thus, nano-fertilizers, due to their altered structural properties, demonstrated higher translocation over the mineral and chelated forms of nutrient fertilizers and thus improved yield and nutrient content to a greater extent. Thus, the foliar application of 0.5% ZnO NPs + 0.5% Fe2O3 NPs may prove to be a feasible option for the enrichment of chickpeas with Zn and Fe to ameliorate malnutrition in burgeoning human populations.

1. Introduction

Chickpea (Cicer arietinum L.) is considered an important legume crop widely used for food and fodder globally. It serves as a primary source of dietary protein for the majority of people in developing countries among all pulse crops. Apart from protein, chickpea contains a considerable amount of carbohydrates [1]. Chickpea has consistently maintained a highly significant status, ranking second in area (15.3% of total) and third in production (15.4%) globally [2]. The global consumption of chickpea has shown an increase of 14.2% in area and 27.3% in quantity of production since 2010 [2]. The cultivation of chickpea offers various advantages such as adaptability in a wide range of climatic conditions, low cultivation cost, and the enhancement of nitrogen fixation, thus improving soil fertility [3]. Micronutrient deficiency of zinc (Zn) and iron (Fe) is currently a major problem in developing countries due to the use of high-yielding varieties, intensive cropping systems, inadequate supplies of micronutrients and losses of organic matter content caused by erosion and pollution. Micronutrients are needed in small amounts for plant growth and development and their deficiency may lead to disruption in physiological and metabolism pathways in the plant [4]. Using micronutrients in fertilizers mixed with common chemical fertilizers may not be useful for growing the crop and increasing productivity [4,5].
Zinc deficiency is most prevalent in developing countries, where the majority of the population consume cereals as a staple food [6,7]. There is sufficient evidence of Zn deficiency in chickpea-growing regions of the world. The main soil factors affecting the availability of Zn are low total Zn contents, high pH, high calcite, and low organic matter contents. Zinc acts as an essential structural entity of numerous enzymes that participates in the metabolism of auxin and carbohydrates, in protein synthesis and in the structural integrity of the cell wall [8,9]. Furthermore, it has critical roles in pollen development, fertilization and chlorophyll synthesis [7,10]. Zinc application improves water use efficiency [11], root structure and nitrogen fixation. Thus, Zn is an essential element for overall improvements in plant growth and nutrition status [12]. Iron (Fe) is also known to be an essential micronutrient for plants due to its participation in several metabolic processes such as photosynthesis and respiration [13,14]. Although Fe exists in abundance in the earth’s crust, its lower solubility in soils reduces Fe uptake in plants and lead to Fe deficiency in human populations. Although the Fe requirement of plants is small, it plays a crucial role in plant growth and productivity. The insufficient availability of Fe leads to a deterioration in plant growth and the quality parameters of the crop and needs to be corrected through appropriate approaches [15,16]. Most frequently, the amounts of Zn and Fe in the soil exceed the plants’ needs but cannot readily be absorbed by plants due to their presence in non-available forms or leaching losses. The best alternative is to apply these micronutrients in the form of a foliar spray.
The term ‘biofortification’ refers to the phenomenon of nutrient enrichment in the edible parts of crops through the exogenous supply of nutrients in the form of fertilizers or through conventional breeding approaches to develop micronutrient-enhanced crop varieties. The progress in conventional breeding approaches has been slow and uncertain. Thus, agronomic methods provide economical and effective ways to overcome nutrient deficiencies in humans. Recent studies have indicated the effectiveness and sustainability of fertilization approaches to enhance micronutrient concentrations in crops [17]. To date, numerous Zn fertilizers have been used to ameliorate Zn deficiencies in plants, such as Zn inorganic compounds, including carbonates, oxides, chlorides, nitrates or sulfates. The use of synthetic chelates such as ethylenediamine tetra-acetic acid (EDTA) has also been undertaken for Zn enrichment in crops [18]. The response of a particular crop varies with the variations in the Zn source due to differences in absorption and transportation efficiency in the plant body [19], and with variations in fertilization methods, such as soil, foliar or seed treatments [20]. Since the 1950s, the effectiveness of synthetic chelates to enhance the bioavailability and plant uptake of micronutrients in calcareous soils has been examined in various crops under different environmental conditions [21]. Synthetic Fe chelates such as Fe-EDTA and Fe-EDDHA are also known to mitigate Fe deficiency and to improve the Fe status in plants [22]. Fe chelates have been employed through soil, foliar or seed treatments to increase the Fe availability, crop yield and nutritional quality of plants [23]. Among these, foliar applications are well known to enhance the nutrient content in plants. Foliar application of Zn through Zn-EDTA have increased the nutrient status in rice grains [24]. In wheat, the efficiency of a foliar application of Zn-EDTA was greater than that of ZnSO4 in increasing Zn content [25]. Another report stated that in triticale, the application of Zn-EDTA was proved to be effective in increasing the agricultural output under drought stress [26]. In chickpeas, Zn-EDTA has been shown to increase the Zn concentration in grains [27].
The use of nanomaterials as fertilizers has emerged as a suitable alternative to conventional fertilizers due to their unique structural characteristics and high efficiency. The size of nanomaterials ranges between 1 and 100 nm. In the past few years, nano-fertilizers have attracted intense attention in agricultural management [28]. New-generation fertilizers based on nanotechnology have been proposed as viable alternatives to avoid fundamental agricultural issues associated with the application of conventional fertilizers [29]. Nanoparticles possess a high surface-to-volume ratio, thus providing more active sites for absorption/adsorption than bulk materials [30,31]. The major problem associated with chickpea is the lack of micronutrients, which results in malnutrition in humans as well as animals. Thus, there is a need to prepare micronutrient-rich fertilizers, which would reduce nutrient deficiencies in soil, enhance crop production and alleviate micronutrient malnutrition in humans and animals. Therefore, the present study aimed to investigate the effect of the foliar application of mineral, EDTA and nanoforms of Zn and Fe on grain yield, as well as yield components in chickpeas, so as to determine the best treatment for enhancing Zn and Fe levels in this crop.

2. Materials and Methods

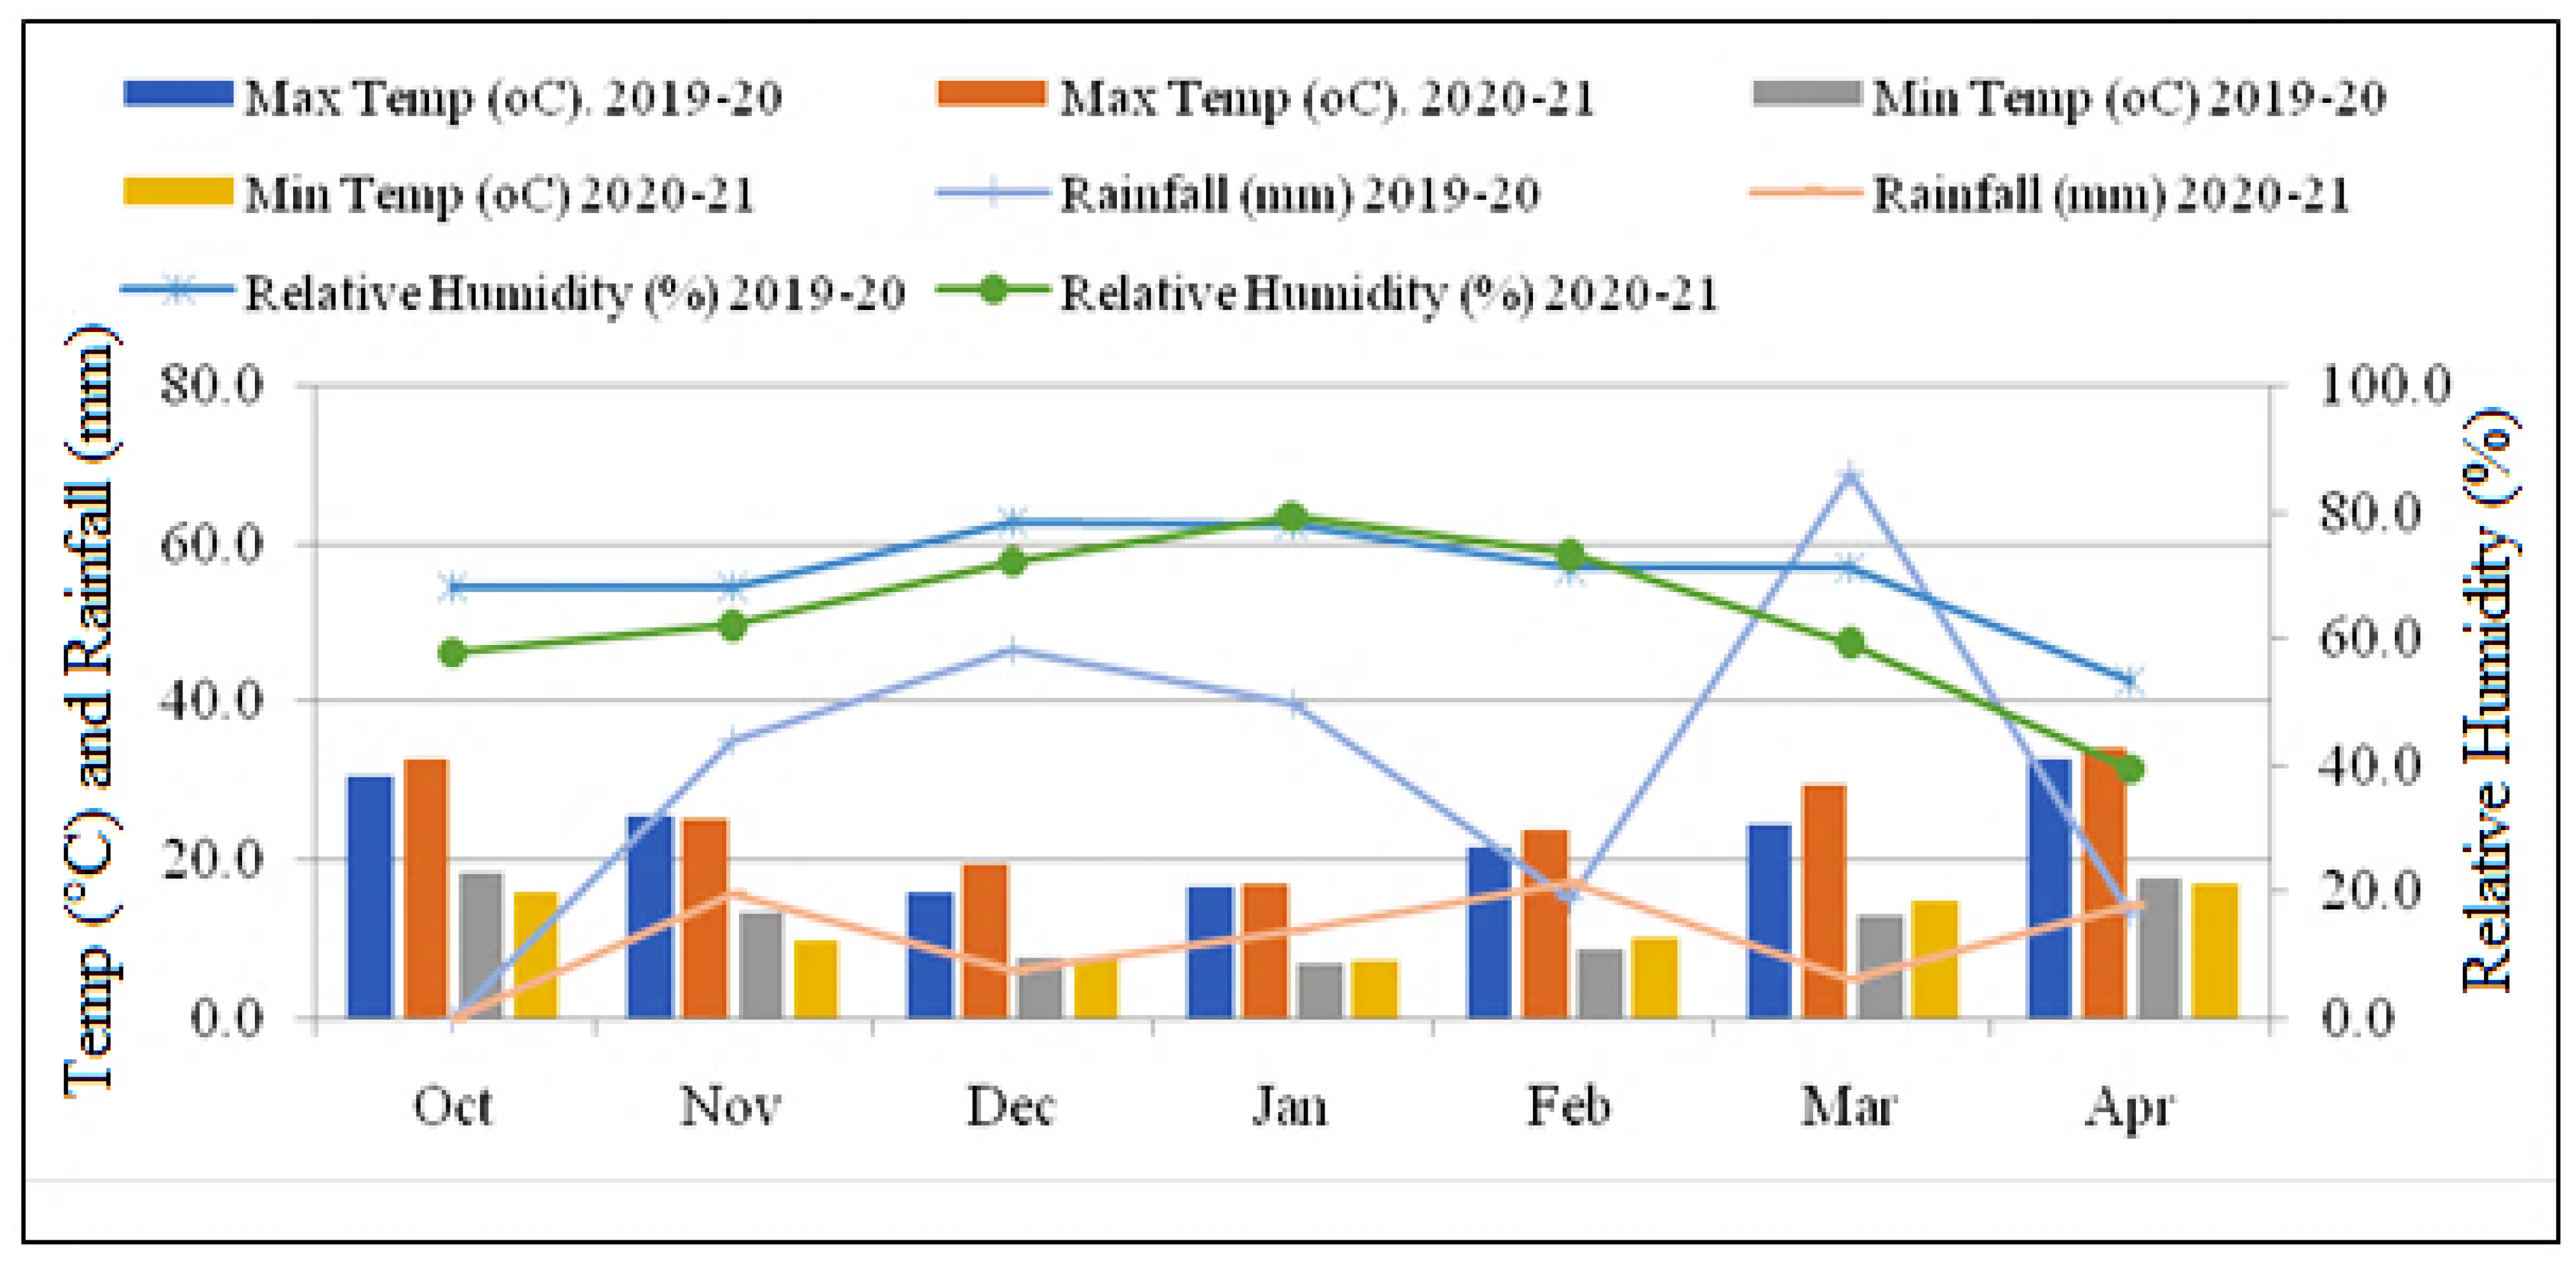
2.1. Site Specification

The experiment was initiated in Rabi season of 2019 and 2020 (November to April) at the Research Farm Area, Department of Soil Science, Punjab Agricultural University, Ludhiana, Punjab, in the Indo-Gangetic planes in north-western India (30° 56′ N, 75° 52′ E and 247 m above mean sea level) at the same GPS location as mentioned above. The rainfall during the crop season from October to April was 219 and 68.9 mm during 2019–20 and 2020–21, respectively. The average monthly maximum temperature of the study area varied from 15.9 °C to 32.8 °C during 2019–20 and 16.4 °C to 34.2 °C during 2020–21, however, the minimum temperature varied from 6.7 °C to 18.4 °C during 2019–20 and 7.1 °C to 17.0 °C during 2020–21 growing season (Figure 1). These data were obtained from the Department of Climate Change and Agricultural Meteorology, Punjab Agricultural University, Ludhiana. In the present study, the experiment comprised 16 treatments with three replications in a completely randomized block design.
The soil of the experimental area was sandy loam with a pH of 7.23, EC = 0.33 dS m−1, and the soil organic carbon content was 0.34%. The initial levels of micronutrients, viz. Zn, Cu, Fe and Mn, in the soil were 1.19, 0.62, 5.12 and 3.90 mg kg−1 [32]. The variety of chickpea used for the experiment was PBG 7. This variety is recommended by the Pulse Section, Department of Plant Breeding and Genetics, Punjab Agricultural University, Ludhiana. The seed inoculation of chickpeas involved the moistening of the seed with the minimum amount of water. Each of the Mesorhizobium (LCR-33) and Rhizobacterium (RB-1) biofertilizers were mixed with the above seeds. These biofertilizers are available from Punjab Agricultural University, Ludhiana seed shop at Gate No. 1 and Krishi Vigyan Kendra/Farm Advisory Service Centers, located in different districts of the state. The inoculated seeds were dried in shade and sown within one hour of inoculation. The sowing was carried out during the first week of November using the drill method and row-to-row spacing was kept at 30 cm and the plot size was 14.4 m2 (4.8 m × 3.0 m). Foliar applications of different sources of Zn and Fe were used, i.e., mineral, chelated and nanoforms, to compare their potential as micronutrient fertilizers. Analytical-grade chemicals of Zn and Fe, i.e., ZnSO4.7H2O (0.5%) and FeSO4.7H2O (0.5%), were used, respectively. Chelated forms of Zn and Fe as EDTA-Zn (0.3%) and EDTA-Fe (0.3%) were used as foliar sprays, respectively. However, for nano-ZnO (0.5%) and nano-Fe2O3 (0.5%), their suspensions were prepared using the ultra-sonication method for two hours, so as to obtain a homogeneous mixture in the case of nano-fertilizers. The treatment details are given in Table 1. For the analysis of Zn and Fe, the DTPA method was used [33] and the concentrations of Zn and Fe were determined with an atomic absorption spectrophotometer (Varian AAS-FS 240 Model).

2.2. Synthesis of Nanoparticles

The appropriate levels of 0.5% ZnO and 0.5% Fe2O3 NPs (ZFN) were synthesized using the sol-gel method [34] for their application on different growth stages of chickpea plants. In brief, metal nitrates (M = Zn, Fe) and citric acid were dissolved in de-ionized water. The reaction mixture was stirred at temperatures ranging from 70 °C to 80 °C and the pH was adjusted to 8.0 using NH4OH solution. After 2 h, sol was converted into gel, which was dried at 100 °C in an oven for 8 h. The dried gel was calcined for 3 h in a muffle furnace at a temperature of 300 °C to obtain metal oxide as the final product.

2.3. Plant Analysis for the Estimation of DTPA-Zn and Fe

The grain and straw samples were collected after harvesting of the crop during the second week of April. The samples were dried in air, followed by oven drying at 60 °C. Grain yield and straw yield were recorded from the net plot, omitting the border rows, and were later converted to q ha−1. A representative grounded straw sample (1.0 g) and grain sample (0.5 g) were taken for digestion and digested in a di-acid mixture containing HNO3 and HClO4 acid (3:1) on an electric hot plate [35]. The micronutrient (Zn and Fe) concentrations in the digested plant extracts were determined using an atomic absorption spectrophotometer (Varian AAS FS 240 Model). Micronutrient uptakes in the grain and straw were calculated by multiplying concentrations with the respective yield [36].

2.4. Economic Analysis

The cost of fertilizer (United State Dollar (USD) ha−1) for various treatments in the experiment was worked out separately, considering the prevailing prices of fertilizers in USD at the time of their use [37]. Gross return (value of additional yield) was calculated based on the MSP (price for minimum support) of chickpeas by the Indian government during the years of study. Net return (USD ha−1) was calculated by subtracting the fertilizer cost from the gross return, as given below.
Net   Return   ( USD   ha 1 ) = Gross   return   ( USD   ha 1 ) Cos t   of   cultivation   ( USD   ha 1 )
The B:C ratio was worked out as follows:
B : C   ratio = Gross   return   ( USD   ha 1 ) Cos t   of   cultivation   ( USD   ha 1 )

2.5. Statistical Analysis

The data were analyzed using statistical analysis software (SPSS software, 19.0; SPSS Institution Ltd., Chicago, IL, USA). One-way analysis of variance (ANOVA), followed by Duncan’s multiple range test, were performed to determine the treatment effects at the 0.05 level of probability.

3. Results

3.1. Impact of Foliar Application of Zn and Fe on Grain and Straw Yield of Chickpeas

In both study years, the foliar application of Zn and Fe at pre-flowering + pod formation stages showed a significant impact on the grain and straw yield of chickpeas, irrespective of the sources used (Table 2). However, no significant effect of foliar application was observed on straw yield in the second year.
On the contrary, the application of nutrients only at the pre-flowering stage did not significantly enhance the grain yield. The highest grain yield in the two years was recorded in treatment T13 (14.10 q ha−1) over the control treatment T1 (9.20 q ha−1), where the foliar application of 0.3% Zn-EDTA + 0.3% Fe-EDTA was carried out, along with RDF applied at the pre-flowering stage + pod formation. The result of treatment T13 was statistically on par with treatments T7 (RDF + 0.5% (12.50 q ha−1 for one spray) ZnSO4.7H2O + 0.5% FeSO4.7H2O spray pre-flowering stage + pod formation) and T16 (RDF+ of 0.5% ZnO NPs + 0.5% Fe2O3 NPs spray at pre-flowering stage), in which 13.90 q ha−1 and 14.07 q ha-1 grain yield were recorded, respectively. Thus, the single application of nanoforms of Zn and Fe showed equivalent results as compared to two applications of their mineral and chelated forms. Moreover, foliar spraying of the mineral forms of Zn and Fe only at the pre-flowering stage did not significantly increase the grain yield of chickpeas. However, in the second year, there was no significant impact on straw yield. Moreover, the mean of two years of data indicated that the foliar application of Zn and Fe did not significantly increase the chickpea straw yield, irrespective of the source and time of application.

3.2. Impact of Foliar Application of Zn and Fe on Grain Zn and Fe Concentration of Chickpeas

The data obtained over two years for the response of grain Zn concentration in chickpeas to the sole and combined foliar application of Zn and Fe through different sources and at different growth stages are presented in Table 3.
The mean values demonstrated that sole Zn or combined Zn+Fe application significantly improved the Zn concentration in chickpeas over the control (37.52 mg kg−1), irrespective of the source used. The maximum Zn concentration was recorded in treatment T13 (42.92 mg kg−1) in which chickpeas were treated with RDF + 0.5% ZnO NPs + 0.5% Fe2O3 NPs at the pre-flowering stage. Thus, single spraying of the NP suspension resulted in a greater enrichment of Zn in chickpea grain as compared to two sprayings of the chelated forms of the fertilizers. These results were statistically on par with those obtained under treatments T10 (41.68 mg kg−1), T11 (41.99 mg kg−1), T13 (42.92 mg kg−1) and T15 (42.26 mg kg−1).
The data obtained over two years for grain Fe concentrations in chickpeas as affected by the sole and combined foliar applications of Zn and Fe through different sources and at different growth stages are presented in Table 3. The mean values suggested that sole Fe or combined Zn + Fe applications significantly improved the Fe concentration in chickpeas over the control (66.74 mg kg−1), irrespective of the source used. The maximum Fe concentration was recorded in treatment T16 (86.51 mg kg−1), in which chickpeas were treated with RDF+ 0.5% ZnO NPs + 0.5% Fe2O3 NPs at the pre-flowering stage. The results were statistically on par with treatments T3 (86.13 mg kg−1), T6 (85.31 mg kg−1) and T7 (84.33 mg kg−1). Thus, a single spraying of the combination of nanoparticle suspensions resulted in a greater enrichment of Fe in chickpea grain as compared to two sprayings of single Fe or the combined Zn +Fe mineral forms of fertilizers.

3.3. Impact of Foliar Application of Zn and Fe on Straw Zn and Fe Concentration of Chickpea

The data obtained over two years for straw Zn concentrations in chickpeas in relation to separate and combined foliar applications of Zn and Fe through three different sources and at different growth stages are presented in Table 4.
The mean data indicated that both sole Zn and combined Zn + Fe application significantly improved the straw Zn concentration in chickpeas over the control (14.11 mg kg−1), irrespective of the source used. The maximum straw Zn concentration was observed in treatment T16 (20.70 mg kg−1), in which chickpeas were treated with RDF + 0.5% ZnO NPs + 0.5% Fe2O3 NPs at the pre-flowering stage. The results were statistically on par with treatments T2 (19.73 mg kg−1), T5 (18.68 mg kg−1), T7 (19.34 mg kg−1), T8 (19.69 mg kg−1), T10 (20.63 mg kg−1), T11 (19.26 mg kg−1), T13 (18.79 mg kg−1) and T15 (20.66 mg kg−1).
The effect of isolated and combined foliar applications of Zn and Fe on chickpeas through different sources on straw Fe concentrations is shown in Table 4. The data recorded over two years suggested that sole Fe or combined Zn + Fe applications significantly improved the Fe concentration in straw over the control (167.89 mg kg−1) irrespective of the source used. Among the different forms of sources, the sole use of the Fe2O3 NP suspension recorded the highest Fe concentration, as the highest results were obtained in treatment T14 (269.52 mg kg−1). Thus, Fe2O3 NPs applied at the pre-flowering stage were found to be more effective to increase straw Fe concentrations as compared to the single or double application of mineral or chelated sources.

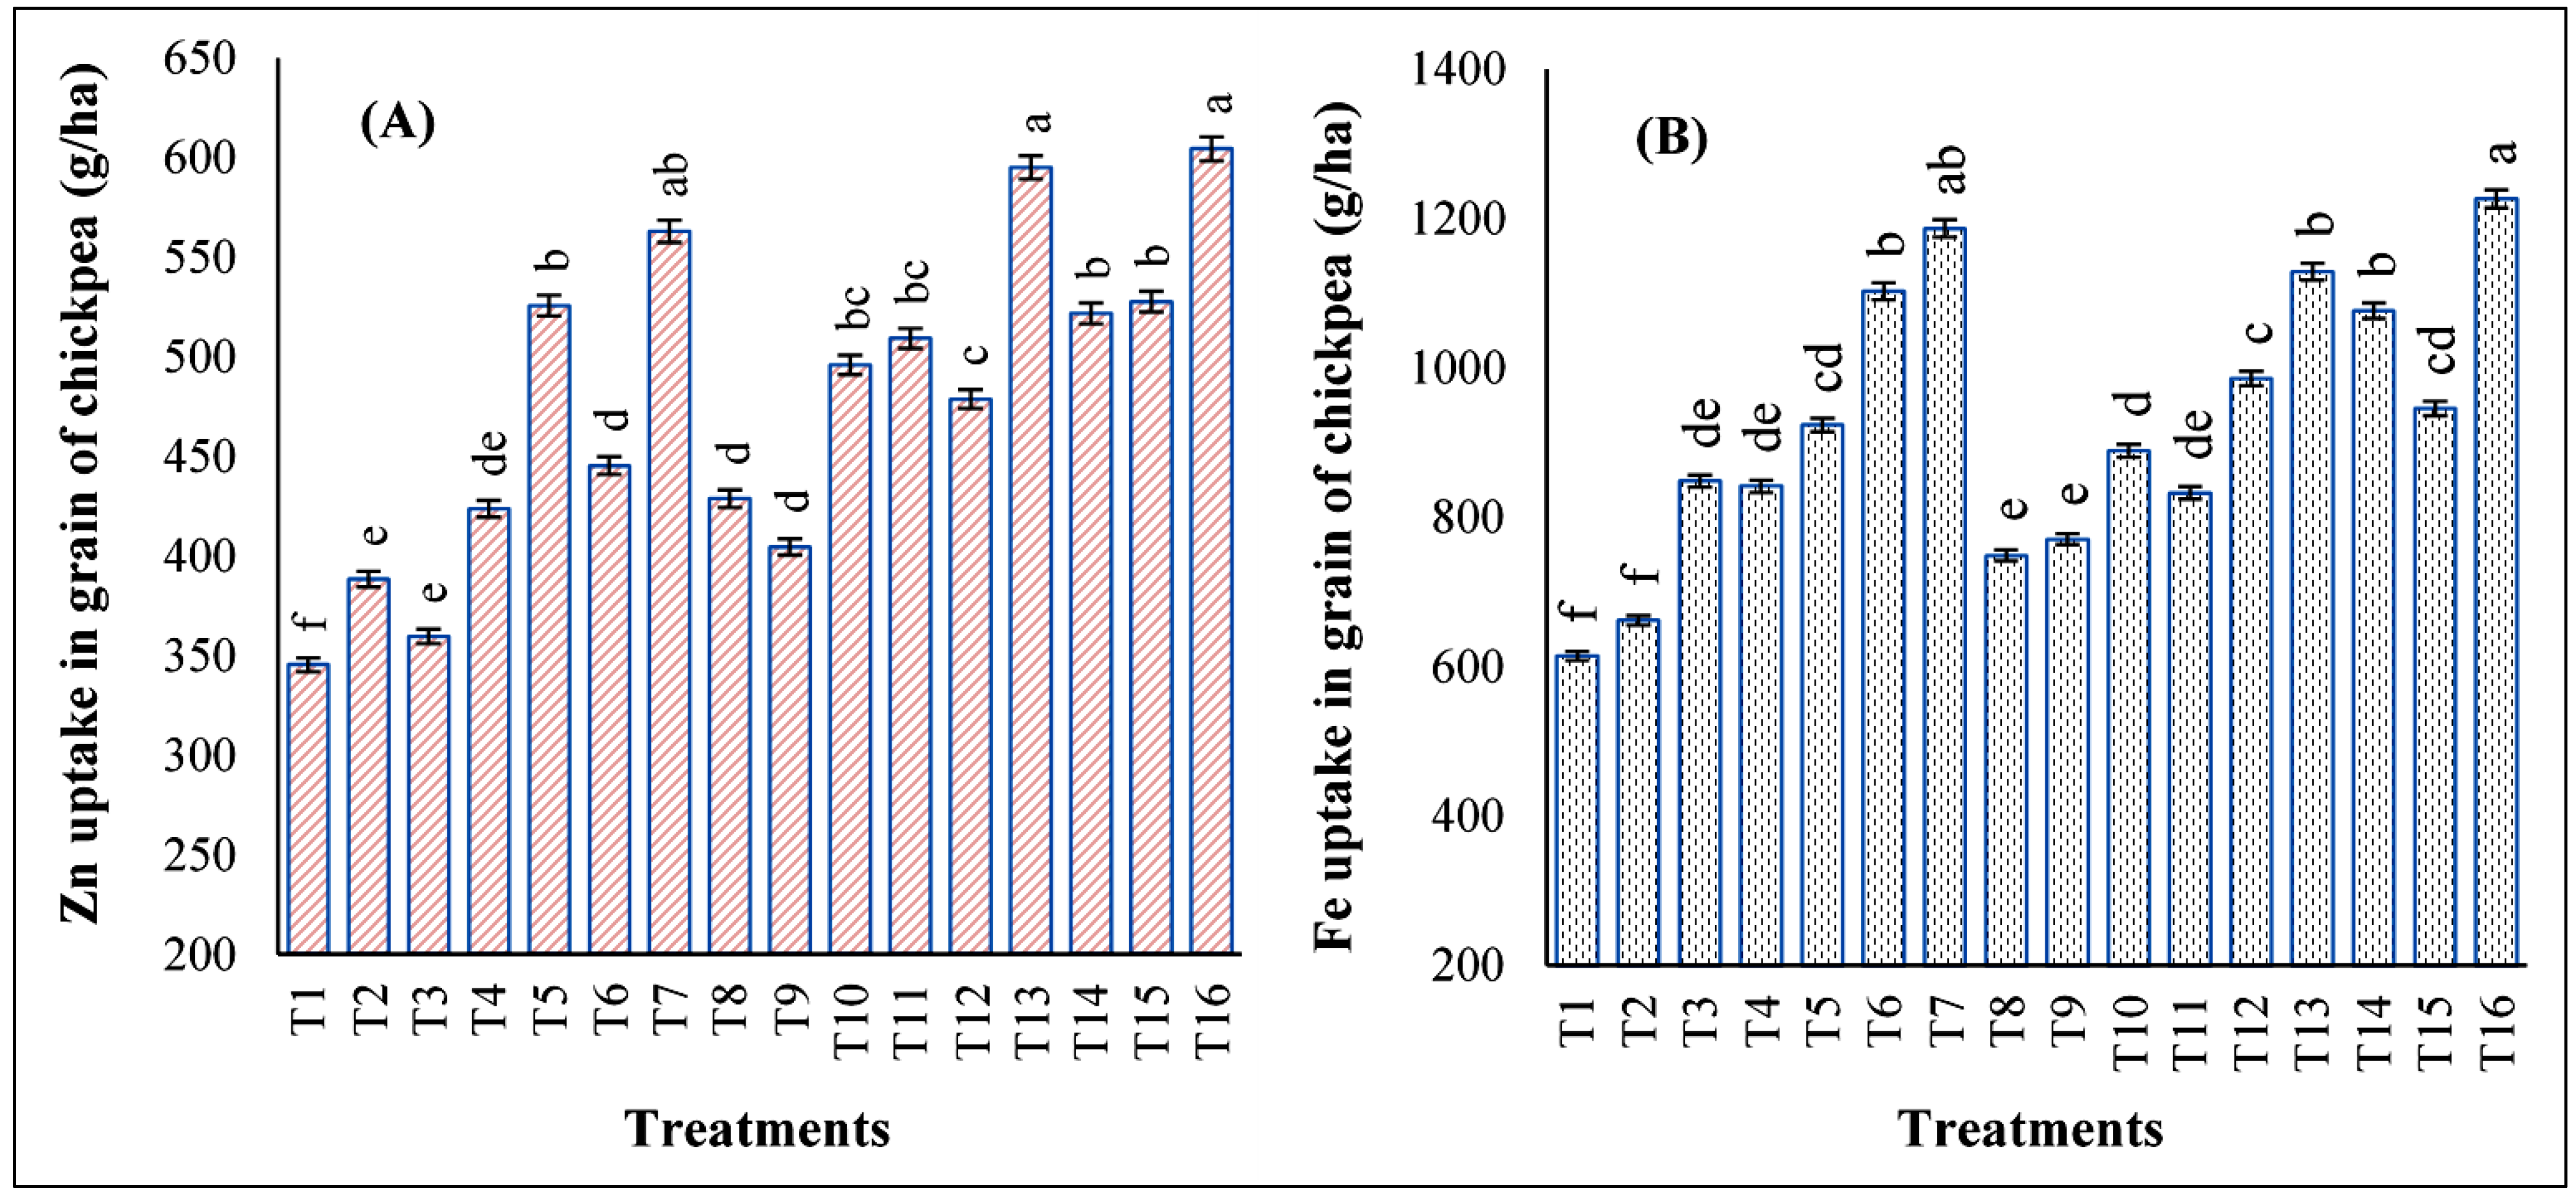
3.4. Impact of Foliar Application of Zn and Fe on Grain Zn and Fe Uptake of Chickpeas

The Zn uptake by chickpea grain significantly increased with the sole and combined application of Zn and Fe through mineral, chelated and NP sources and at different growth stages. These results, along with the vertical error bars depicting the standard deviation for triplicates, are presented in Figure 2.
The maximum Zn uptake was recorded in treatment T16 (604.49 g ha−1), in which chickpeas were treated with RDF + 0.5% ZnO NPs + 0.5% Fe2O3 NPs at the pre-flowering stage. The results were statistically on par with treatments T7 (563.06 g ha−1) and T13 (595.10 g ha−1). The least Zn uptake by chickpea grains was observed in treatment T1 (345.51 g ha−1), which was used as a control. The two years’ worth of data on Fe uptake by chickpea grains as affected by sole and combined foliar application of Zn and Fe through different sources and at different growth stages are shown in Figure 2. The mean values suggested that sole Fe or combined Zn + Fe application significantly improved the Fe uptake by grains over the control (613.91 g ha−1), irrespective of the source used. Maximum Fe uptake was recorded in treatment T16 (1226.22 g ha−1) in which chickpeas were treated with RDF + 0.5% ZnO NPs + 0.5% Fe2O3 NPs at the pre-flowering stage. The results were statistically on par with treatment T7 (1186.29 g ha−1), in which fertilizers were applied as RDF+ 0.5% ZnSO4.7H2O + 0.5% FeSO4.7H2O spray in the pre-flowering stage + pod formation. Thus, the combination of ZnO + Fe2O3 NP suspension resulted in more Fe uptake in chickpeas as compared to two sprayings of single Fe or combined Zn +Fe mineral forms of fertilizers.

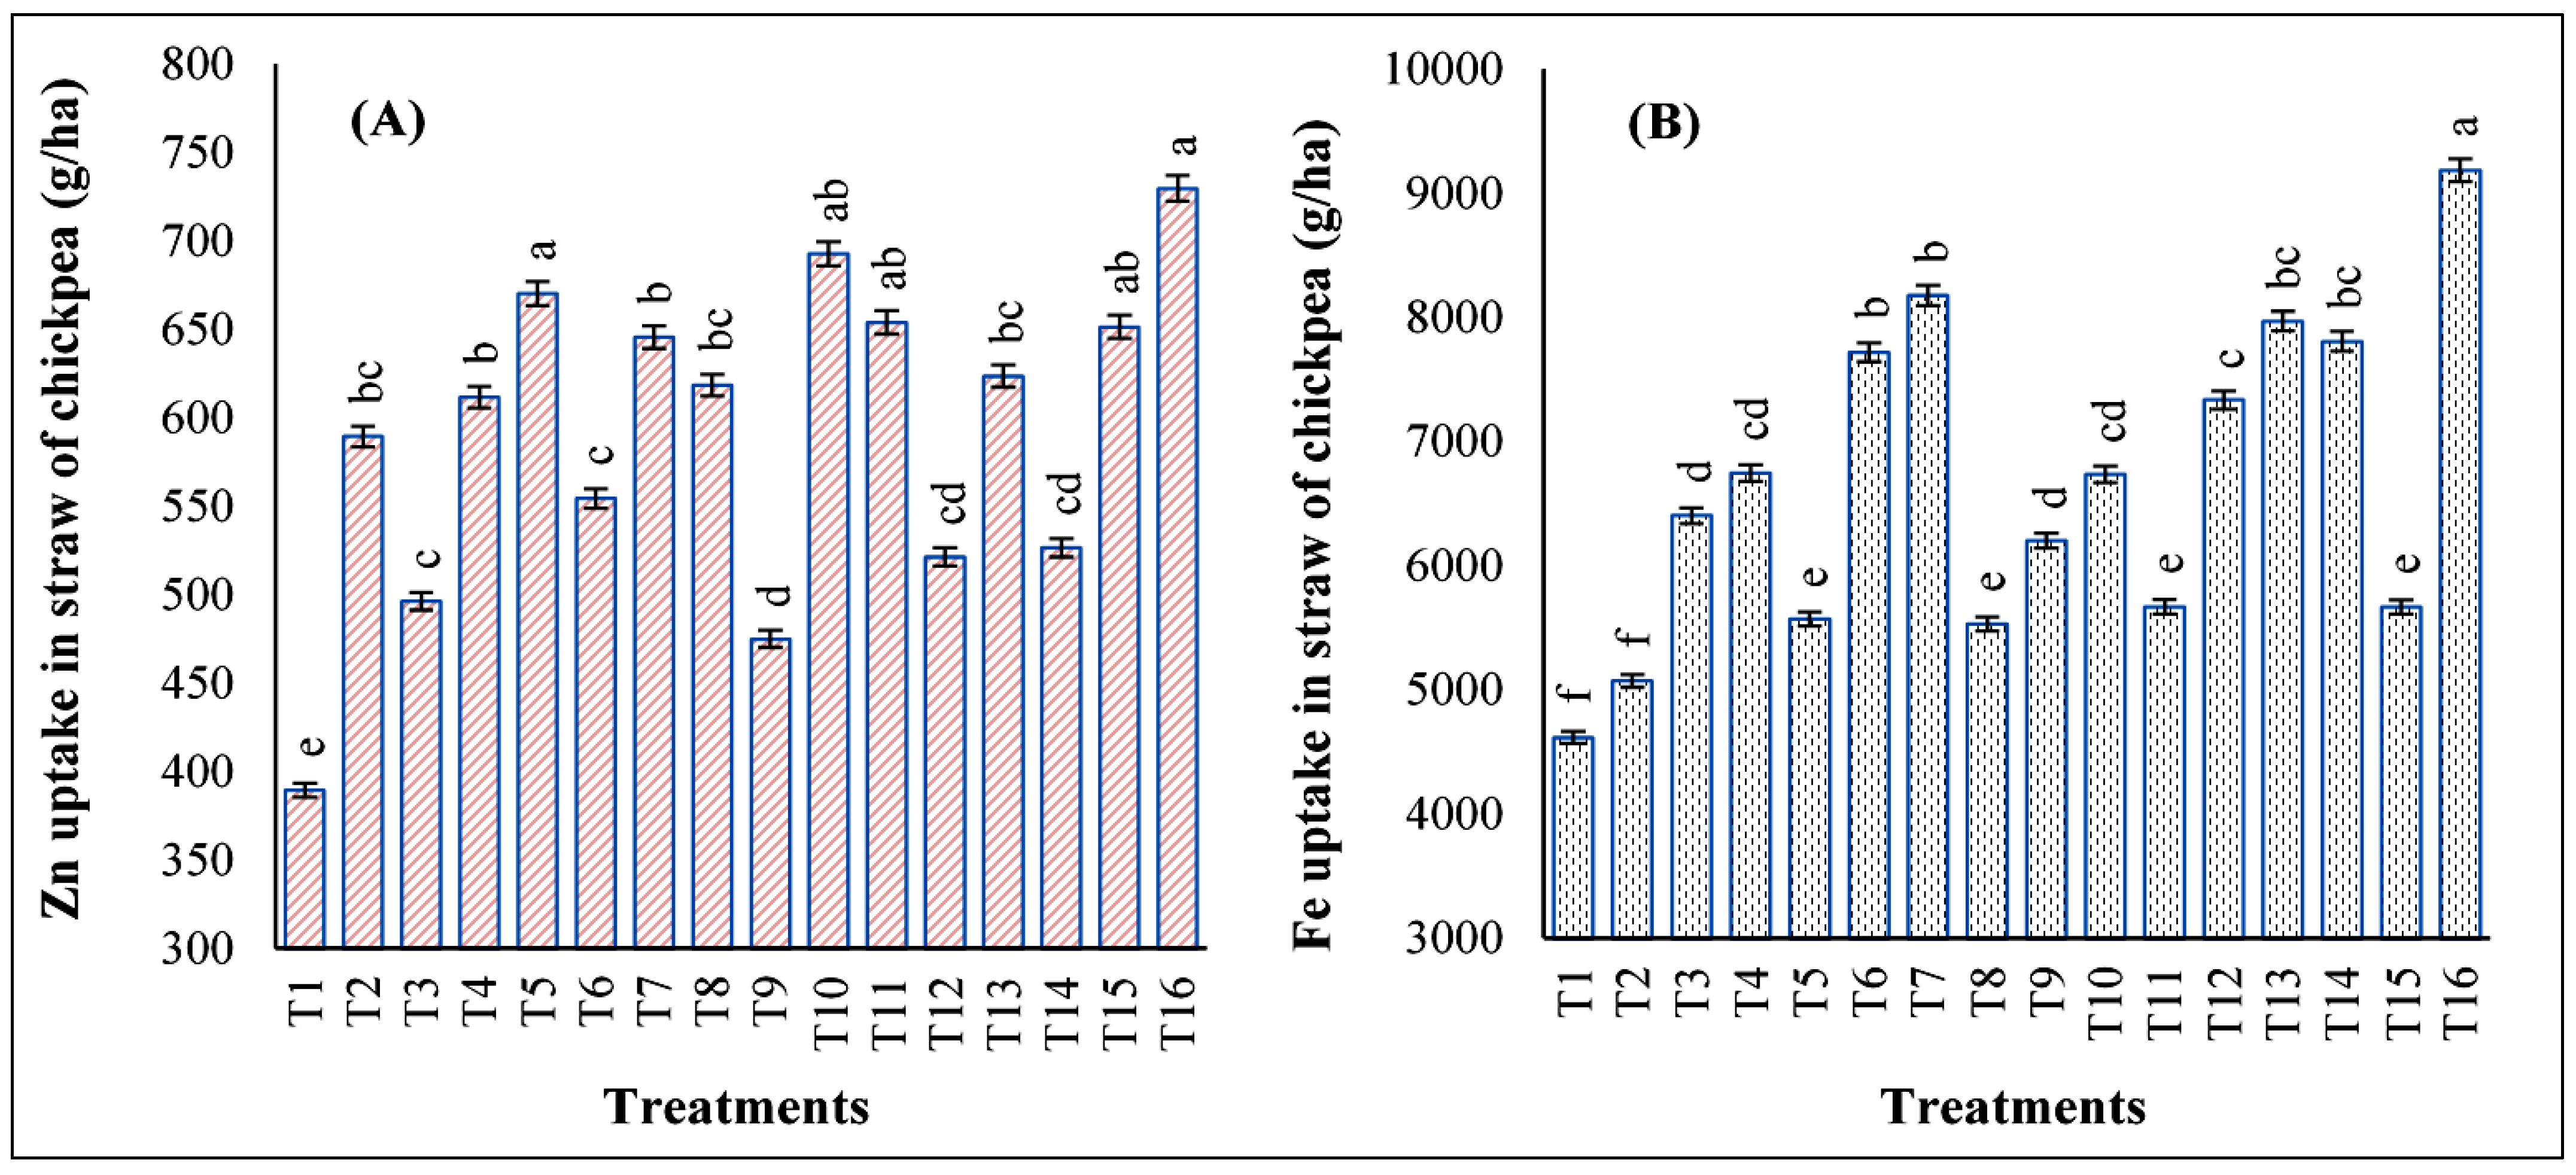
3.5. Impact of Foliar Application of Zn and Fe on Straw Zn and Fe Uptake of Chickpeas

The data obtained over two years of the Zn uptake by straw in chickpeas as affected by separate and combined foliar applications of Zn and Fe through three different sources and at different growth stages are presented in Figure 3.
The mean data indicated that both sole Zn and combined Zn + Fe application significantly enhanced the Zn uptake in straw over the control (389.47 g ha−1), irrespective of the source used. Maximum Zn uptake by straw was observed in treatment T16 (729.55 g ha−1), in which chickpea was treated with RDF + 0.5% ZnO NPs + 0.5% Fe2O3 NPs at the pre-flowering stage. The results were statistically on par with treatments T5 (670.13 g ha−1), T10 (692.57 g ha−1), T11 (653.76 g ha−1) and T15 (651.28 g ha−1). The results also suggested that sole Fe application recorded significantly lower Zn uptake as compared to the treatments in which Zn was present in the foliar mixture. Furthermore, the application of NPs at the pre-flowering stage showed more potential results as compared to the double application of mineral or chelated forms.
The effect of isolated and combined foliar applications of Zn and Fe on chickpea through different sources on Fe uptake by straw is illustrated in Figure 3. The recorded data for two years suggested that sole Fe or combined Zn + Fe application significantly increased the Fe uptake by straw over the control (4614.27 g ha−1) irrespective of the source used. Among different forms of sources, the maximum Fe uptake was observed when with the suspension of 0.5% ZnO NPs + 0.5% Fe2O3 NPs was applied at the pre-flowering stage. Thus, the highest results were obtained in treatment T16 (9184.67 g ha−1). Thus, the single application of NPs having Zn and Fe were found to be more effective to increase Fe uptake as compared to the single or twofold application of mineral or chelated sources. Furthermore, the treatments which involved sole Zn application showed significantly lower Fe uptake as compared to the treatments in which Fe was present in the foliar mixture.

3.6. Economic Analysis

The economic analysis demonstrated that the cultivation cost was the highest for treatment T16 (US$ 532.8), followed by treatments T15 and T14 with the costs of cultivation of US$475.7 and US$458.3, respectively. Similarly, the highest net return was noted for treatment T13 (US$886.2), followed by T7 (US$882.2) and T6 (US$813.7). Whereas, the B:C ratio was highest in treatment T7 (3.11) followed by T13 (3.05), as presented in Table 5.

4. Discussion

4.1. Impact of Zn and Fe on Grain and Straw Yield of Chickpeas

The results of the present study indicated that the grain and straw yield of chickpeas increased significantly over the two years in comparison to controls, irrespective of the sources used. These results might be associated with the higher Zn availability due to the Zn supply, which furthers the chlorophyll synthesis and photosynthetic apparatus of the plant, which lead to higher dry mass accumulation and yield. Similar results, showing increased yields with Zn and Fe application, have been also reported in maize and wheat, respectively [38,39]. Grain yield also improved with foliar Fe application, which might be attributed to the improved carbohydrate and protein synthesis, as well as the photosynthesis rate. Additionally, Fe plays a crucial role in the synthesis of growth promoters such as auxins, seed maturation, nucleic acid metabolism and chlorophyll synthesis [13,14]. Thus, improvements in these parameters resulted in higher grain yields. Two applications of Zn and Fe increased the grain yield to a higher extent over single applications due to the higher supply of Zn and Fe as compared to the single application. Moreover, the suspension of 0.5% ZnO NPs + 0.5% Fe2O3 NPs was found to be more effective as compared to the bulk mineral and chelated forms. The NPs demonstrated higher uptake and translocation efficiency than the bulk forms [40]. The present results are in concordance with the previous studies, where the application of ZnO in sorghum resulted in a higher yield over its bulk counterparts [40].

4.2. Impact of Zn and Fe on their Grain and Straw Concentrations in Chickpeas

The foliar application of Zn and Fe, separately and combined, resulted in significantly higher Zn and Fe contents in the grain and straw of chickpeas, compared to controls. The results were associated with the immediate availability of the nutrients, as in foliar application the nutrients are directed toward the leaves. Similar results, showing an increase in Zn concentrations in wheat and rice, have been reported using exogenous Zn supplies [41,42]. Two applications of nutrients increased the nutrient content to a greater extent as compared to single applications, which was due to the higher nutrient availability when nutrient sources were applied twice. Combined Zn and Fe application had a positive impact on the Zn and Fe content of chickpea grain and straw; thus, it can be inferred that Zn and Fe possess similar mechanisms for translocation to grains [43]. Nanoparticles showed superior results in the context of Zn and Fe concentrations in grain and straw, as a single application of 0.5% ZnO NPs + 0.5% Fe2O3 NPs was equally effective compared to the double application of bulk sources. These results were probably due to the higher translocation of nano-fertilizers as compared to their bulk counterparts [44]. Similar results showing the higher effectiveness of nano-fertilizers as compared to the bulk forms have been reported earlier [40].

4.3. Impact of Zn and Fe on their Grain and Straw Uptake in Chickpeas and Economic Analysis

Foliar fertilization of Zn and Fe resulted in higher Zn and Fe uptake in chickpea grain and straw. These results were associated with the nutrients’ availability and their translocation within plant parts. The exogenous supply of nutrients through different fertilizers resulted in higher nutrient availability as compared to the control. Similar results, showing an increase in micronutrient uptake in oats, have been reported with the use of exogenous Zn supplies [45]. Two applications of nutrients at different growth stages showed higher nutrient availability for uptake and translocation in plant parts as compared to the single application. The nano-fertilizers showed more potential in increasing the Zn and Fe uptake as compared to the bulk forms, as the single application of nano-fertilizers was equally effective compared to two applications using bulk sources. These results might be due to the higher translocation of nano-fertilizers as compared to their bulk counterparts [46]. Similar results, showing higher effectiveness in terms of the nutrient uptake of nano-fertilizers as compared to bulk forms, have been reported in coffee plants [47]. The cost of cultivation in treatment T16 was the highest due to the higher cost of ZnO and Fe2O3 NPs used in the treatment. However, the net return was the highest in treatment T13, which was statistically at par with treatment T7. The B:C ratio demonstrated the highest value for treatments T7 and T13 due to the lower cost of mineral and EDTA fertilizers.

5. Conclusions

The results of the present study suggest that Zn and Fe nanomaterials (NPs)—due to their distinctive structural features—can be employed as potential sources of nutrients over their mineral and chelated counterparts for the mineral enrichment of chickpeas. The combined application of 0.5% ZnO NPs + 0.5% Fe2O3 NPs (ZFN) at the pre-flowering stage resulted in a significant increase in yield, nutrient content and nutrient uptake and the results were comparable to two applications of the mineral and chelated forms. The results also demonstrated the significant role of Zn and Fe in the improvement of grain and straw yield, as the foliar application of Zn and Fe increased the chickpea yield due to higher nutrient availability, irrespective of the source used. However, the B:C ratio was the highest for treatments T7 and T13, but treatment T16 (involving NPs) can be used as an alternative over other forms of fertilizers. Thus, the use of multi-nutrient mixtures of nano-fertilizers deserves special attention regarding to enhance the productivity and nutrient content of chickpeas to combat micronutrient malnutrition.

Author Contributions

Conceptualization, S.S.D., V.S., A.K.S., V.V., S.K.B. and P.S.; methodology, S.S.D., V.S., A.K.S., V.V., S.K.B. and P.S.; software, S.S.D. and A.H.; validation, S.S.D., V.S., A.K.S., V.V., S.K.B. and P.S.; formal analysis, S.S.D. and A.H.; investigation, S.S.D., V.S., A.K.S., V.V., S.K.B. and P.S.; resources, S.S.D. and A.H.; data collection, S.S.D. and A.H.; writing—original draft preparation, S.S.D., V.S., A.K.S., V.V., S.K.B. and P.S.; writing—review and editing, S.S.A., A.G. and A.H.; visualization, S.S.D., V.S., A.K.S., V.V., S.K.B. and P.S.; supervision, S.S.D.; project administration, S.S.D., S.S.A., A.G. and A.H.; funding acquisition, S.S.A., A.G. and A.H. All authors have read and agreed to the published version of the manuscript.

Funding

This research was funded by the Taif University Researchers with Supporting Project number (TURSP-2020/38), Taif University, Taif, Saudi Arabia.

Data Availability Statement

All data are available in the manuscript.

Acknowledgments

The authors thank Taif University Researches Supporting Project number (TURSP-2020/38), Taif University, Taif, Saudi Arabia for supporting this study.

Conflicts of Interest

The authors would hereby like to declare that there is no conflict of interest for the article.

References

  1. Yegrem, L. Nutritional composition, antinutritional factors, and utilization trends of Ethiopian Chickpea Cicer Arietinum L. Int. J. Food Sci. 2021, 2021, 5570753. [Google Scholar] [CrossRef] [PubMed]
  2. Merga, B.; Haji, J. Economic importance of chickpea: Production, value, and world trade. Cogent Food Agric. 2019, 5, 1615718. [Google Scholar] [CrossRef]
  3. Pegoraro, R.F.; AlmeidaNeta, M.; Costa, C.; Sampaio, R.A.; Fernandes, L.A.; Neves Rodrigues, M. Chickpea production and soil chemical attributes after phosphorus and molybdenum fertilization. Ciênciae Agrotecnol. 2018, 42, 474–483. [Google Scholar] [CrossRef]
  4. Nadi, E.; Aynehband, A.; Mojaddam, M. Effect of nano-iron chelate fertilizer on grain yield, protein percent and chlorophyll content of faba bean Vicia faba L. Int. J. Biosci. 2013, 3, 267–272. [Google Scholar]
  5. Bozorgi, H.R. Study effects of nitrogen fertilizer management under nano iron chelate foliar spraying on yield and yield components of Eggplant. J. Agric. Biol. Sci. 2012, 7, 233–237. [Google Scholar]
  6. Cakmak, I. Enrichment of cereal grains with zinc: Agronomic or genetic biofortification? Plant Soil 2008, 302, 1–17. [Google Scholar] [CrossRef]
  7. Hacisalihoglu, G. Zinc: The last nutrient in the alphabet and shedding light on Zn efficiency for the future of crop production under suboptimal Zn. Plants 2020, 9, 1471. [Google Scholar] [CrossRef]
  8. Tsonev, T.; Cebola Lidon, F.J. Zinc in plants-an overview. Emirates J. Food Agric. 2012, 24, 322–333. [Google Scholar]
  9. Umair Hassan, M.; Aamer, M.; Umer Chattha, M.; Haiying, T.; Shahzad, B.; Barbanti, L.; Nawaz, M.; Rasheed, A.; Afzal, A.; Liu, Y.; et al. The critical role of zinc in plants facing the drought stress. Agriculture 2020, 10, 396. [Google Scholar] [CrossRef]
  10. Karim, M.; Zhang, Y.Q.; Zhao, R.R.; Chen, X.; Zhang, F.; Zou, C. Alleviation of drought stress in winter wheat by late foliar application of zinc, boron, and manganese. J. Plant Nutr. Soil Sci. 2012, 175, 142–151. [Google Scholar] [CrossRef]
  11. Khan, H.R.; McDonald, G.K.; Rengel, Z. Zinc fertilization and water stress affects plant water relations, stomatal conductance and osmotic adjustment in chickpea Cicer arietinum L. Plant Soil 2004, 267, 271–284. [Google Scholar] [CrossRef]
  12. Vadlamudi, K.; Upadhyay, H.; Singh, A.; Reddy, M. Influence of zinc application in plant growth: An overview. Eur. J. Mol. Clin. Med. 2020, 7, 2321–2327. [Google Scholar]
  13. Pal, V.; Singh, G.; Dhaliwal, S. Yield enhancement and biofortification of chickpea Cicer arietinum L. grain with iron and zinc through foliar application of ferrous sulfate and urea. J. Plant Nutr. 2019, 42, 1789–1802. [Google Scholar] [CrossRef]
  14. Schmidt, W.; Thomine, S.; Buckhout, T.J. Iron nutrition and interactions in plants. Front. Plant Sci. 2020, 10, 1670. [Google Scholar] [CrossRef] [Green Version]
  15. Alvarez-Fernandez, A.; Garcıa-Lavina, P.; Fidalgo, C.; Abadıa, J.; Abadıa, A. Foliar fertilization to control iron chlorosis in pear Pyrus communis L. trees. Plant Soil 2004, 263, 271–284. [Google Scholar] [CrossRef]
  16. Cakmak, I. Enrichment of fertilizers with zinc: An excellent investment for humanity and crop production in India. J. Trace Elem. Med. Biol. 2009, 23, 281–289. [Google Scholar] [CrossRef]
  17. de Valenca, A.W.; Bake, A.; Brouwer, I.D.; Giller, K.E. Agronomic biofortification of crops to fight hidden hunger in sub-Saharan Africa. Glob. Food Sec. 2017, 12, 8–14. [Google Scholar] [CrossRef]
  18. Almendros, P.; Gonzalez, D.; Alvarez, J.M. Long-term bioavailability effects of synthesized zinc chelates fertilizers on the yield and quality of a flax (Linum usitatissimum L.) crop. Plant Soil 2013, 368, 251–265. [Google Scholar] [CrossRef]
  19. Slaton, N.A.; Norman, R.J.; Wilson, C.E. Effect of zinc source and application time on zinc uptake and grain yield of flood-irrigated rice. Agron. J. 2005, 97, 272–278. [Google Scholar] [CrossRef]
  20. Cakmak, I. Biofortification of cereals with zinc and iron through fertilization strategy. In Proceedings of the 19th World Congress of Soil Science, Brisbane, Australia, 1–6 August 2010. [Google Scholar]
  21. Rahman, A.M.; Hasegawa, H.; Kadohashi, K.; Maki, T.; Ueda, K. Hydroxyiminodisuccinic acid: A novel biodegradable chelating ligand for the increase of iron bioavailability and arsenic phytoextraction. Chemosphere 2009, 77, 207–213. [Google Scholar] [CrossRef] [Green Version]
  22. López-Rayo, S.; Sanchis-Pérez, I.; Ferreira, C.M.H.; Lucena, J.J. [S,S]-EDDS/Fe: A new chelate for the environmentally sustainable correction of iron chlorosis in calcareous soil. Sci. Total Environ. 2019, 647, 1508–1517. [Google Scholar] [CrossRef]
  23. Mahender, A.; Swamy, B.P.M.; Anandan, A.; Ali, J. Tolerance of iron deficient and -toxic soil conditions in rice. Plants 2019, 8, 31. [Google Scholar] [CrossRef] [Green Version]
  24. Wei, Y.; Shohag, M.J.I.; Yang, X.; Yibin, Z. Effects of foliar iron application on iron concentration in polished rice grain and its bioavailability. J. Agric. Food Chem. 2012, 60, 11433–11439. [Google Scholar] [CrossRef] [PubMed]
  25. Brennan, R.F. Effectiveness of different sources of manganese foliar sprays in alleviating manganese deficiency of Lupinus angustifolius L. grown on manganese deficient soils in western Australia. J. Plant Nutr. 1996, 19, 293–304. [Google Scholar] [CrossRef]
  26. Kinaci, E.; Gulmezoglu, N. Grain yield and yield components of triticale upon application of different foliar fertilizers. Interciencia 2007, 32, 624–628. [Google Scholar]
  27. Kayan, N.; Gulmezoglu, N.; Kaya, M.D. The optimum foliar zinc source and level for improving Zn content in grain of chickpea. Legume Res. 2015, 38, 826–831. [Google Scholar]
  28. Fatima, M.; Hashim, A.; Anees, S. Efficacy of nanoparticles as nanofertilizer production: A review. Environ. Sci. Pollut. Res. 2020, 28, 1292–1303. [Google Scholar] [CrossRef]
  29. Zulfidar, F.; Navarro, M.; Ashraf, M.; Akram, N.A.; Munne-Bosch, S. Nanofertilizer use for sustainable agriculture: Advantages and limitations. Plant Sci. 2019, 289, 110270. [Google Scholar] [CrossRef]
  30. Sadak, M.; Bakry, B.A. Zinc-oxide and nano ZnO oxide effects on growth, some biochemical aspects, yield quantity, and quality of flax (Linum uitatissimum L.) in absence and presence of compost under sandy soil. Bull. Nat. Res. Cent. 2020, 44, 98. [Google Scholar] [CrossRef]
  31. Kaur, M.; Kaur, N.; Vibha, V. Ferrites: Synthesis and applications for environmental remediation. In Ferrites and Ferrates: Chemistry and Applications in Sustainable Energy and Environmental Remediation; Sharma, V.S., Doong, R., Kim, H., Varma, R.S., Dionysiou, D.D., Eds.; ACS Symposium Series; American Chemical Society: Washington, DC, USA, 2016; pp. 113–136. [Google Scholar]
  32. Jackson, M.L. Soil Chemical Analysis; Prentice Hall of India Pvt Ltd.: New Delhi, India, 1973. [Google Scholar]
  33. Lindsay, W.L.; Norvell, W.A. Development of a DTPA soil test for zinc, iron, manganese, and copper. Soil Sci. Soc. Am. J. 1978, 42, 421–428. [Google Scholar] [CrossRef]
  34. Verma, V.; Kaur, M.; Greneche, J.M. Tailored structural, optical and magnetic properties of ternary nanohybrid Mn0.4Co0.6-xCuxFe2O4 (x= 0, 0.2, 0.4, 0.6) spinel ferrites. Ceramics Int. 2019, 45, 10865–10875. [Google Scholar] [CrossRef]
  35. Piper, C.S. Soil and Plant Analysis; Hans Publishers: Bombay, India, 1966. [Google Scholar]
  36. Dhaliwal, S.S.; Sharma, V.; Taneja, P.K.; Shukla, A.K.; Kaur, L.; Verma, G.; Verma, V.; Singh, J. Effect of cadmium and ethylenediamine tetraacetic acid supplementation on cadmium accumulation by roots of Brassica species in Cd spiked soil. Environ. Sci Pollut. Res. 2021. [Google Scholar] [CrossRef]
  37. Singh, V.K.; Gautam, P.; Nanda, G.; Dhaliwal, S.S.; Pramanick, B.; Meena, S.S.; Alsanie, W.F.; Gaber, A.; Sayed, S.; Hossain, A. Soil test based fertilizer application imrpoves productivity, profitability and nutrient use efficiency of rice Oryza sativa L. under direct seeded condition. Agronomy 2021, 11, 1756. [Google Scholar] [CrossRef]
  38. Dhaliwal, S.S.; Sadana, U.S.; Manchanda, J.S.; Dhadli, H.S. Biofortification of wheat grains with zinc and iron in typic Ustochrept soils of Punjab. Indian J. Fert. 2009, 5, 13–16. [Google Scholar]
  39. Dhaliwal, S.S.; Sadana, U.S.; Manchanda, J.S.; Kumar, D. Differential response of maize cultivars to zinc in relation to food security and alleviation of Zn malnutrition. Indian J. Fert. 2013, 9, 24–30. [Google Scholar]
  40. Poornima, R.; Koti, R.V. Effect of nano zinc oxide on growth, yield and grain zinc content of sorghum Sorghum Bicolor. J Pharmacogn. Phytochem. 2019, 8, 727–731. [Google Scholar]
  41. Dhaliwal, S.S.; Sadana, U.S.; Khurana, M.P.; Sidhu, S.S. Enrichment of rice grains with zinc and iron through ferti-fortification. Indian J. Fert. 2010, 6, 28–35. [Google Scholar]
  42. Dhaliwal, S.S.; Sadana, U.S.; Khurana, M.P.; Sidhu, S.S. Enrichment of wheat grains with Zn through ferti-fortification. Indian J. Fert. 2012, 8, 48–55. [Google Scholar]
  43. Kawakami, Y.; Bhullar, N.K. Molecular processes in iron and zinc homeostasis and their modulation for biofortification in rice. J. Integr. Plant Biol. 2018, 60, 1181–1198. [Google Scholar] [CrossRef]
  44. Faraz, A.; Faizan, M.; Sami, F.; Siddiqui, H.; Pichtel, J.; Hayat, S. Nanoparticles: Biosynthesis, translocation and role in plant metabolism. IET Nanobiotechnol. 2019, 1, 345–352. [Google Scholar] [CrossRef]
  45. Dhaliwal, S.S.; Sandhu, A.S.; Shukla, A.K.; Sharma, V.; Kumar, B.; Singh, R. Bio-fortification of oats fodder through zinc enrichment to reduce animal malnutrition. J. Agric. Sci. Technol. A 2020, 10, 98–108. [Google Scholar]
  46. Elemike, E.E.; Uzoh, I.M.; Onwudiwe, D.C.; Babalola, O.O. The role of nanotechnology in the fortification of plant nutrients and improvement of crop production. Appl. Sci. 2019, 9, 499. [Google Scholar] [CrossRef] [Green Version]
  47. Rossi, L.; Fedenia, L.N.; Sharifan, H.; Ma, X.; Lombardini, L. Effects of foliar application of zinc sulfate and zinc nanoparticles in coffee Coffea arabica L. plants. Plant Physiol. Biochem. 2019, 135, 160–166. [Google Scholar] [CrossRef] [PubMed]
Figure 1. Monthly average maximum and minimum temperature, relative humidity and rainfall of the experimental area.
Agronomy 11 02436 g001
Figure 2. Effect of mineral, chelated and nanoforms of (A) Zn and (B) Fe on the uptake of Zn and Fe in grains of chickpeas. In each bar, means with a similar or dissimilar letter(s) were evaluated with the least significant difference (LSD) multiple range test, using a probability level of p ≤ 0.05.
Agronomy 11 02436 g002
Figure 3. Effect of mineral, chelated and nanoforms of (A) Zn and (B) Fe on uptake of Zn and Fe in the straw of chickpea. In each bar, means with a similar or dissimilar letter(s) were evaluated with the least significant difference (LSD) multiple range test, using a probability level of p ≤ 0.05.
Agronomy 11 02436 g003
Table 1. Treatment details of the field experiment.
TreatmentsTreatments
T1RDF control
T2RDF + 0.5% ZnSO4.7H2O spray pre-flowering stage
T3RDF + 0.5% FeSO4.7H2O spray pre-flowering stage
T4RDF + 0.5% ZnSO4.7H2O+ 0.5% FeSO4.7H2O spray pre-flowering stage
T5RDF + 0.5% ZnSO4.7H2O spray pre-flowering stage + pod formation
T6RDF + 0.5% FeSO4.7H2O spray pre-flowering stage + pod formation
T7RDF + 0.5% ZnSO4.7H2O + 0.5% FeSO4.7H2O spray pre-flowering stage + pod formation
T8RDF + 0.3% Zn-EDTA spray pre-flowering stage
T9RDF + 0.3% Fe-EDTA spray pre-flowering stage
T10RDF + 0.3% Zn-EDTA+ 0.3% Fe-EDTA spray pre-flowering stage
T11RDF + 0.3% Zn-EDTA spray pre-flowering stage + pod formation
T12RDF + 0.3% Fe-EDTA spray pre-flowering stage + pod formation
T13RDF + 0.3% Zn-EDTA+ 0.3% Fe-EDTA spray pre-flowering stage + pod formation
T14RDF + 0.5% Fe2O3 NPs spray pre-flowering stage
T15RDF + 0.5% ZnO NPs spray pre-flowering stage
T16RDF + 0.5% ZnO NPs + 0.5% Fe2O3 NPs spray pre-flowering stage
Treatments detailed in Table 1; RDF, recommended dose of fertilizer.
Table 2. Effect of mineral, chelated and nanoforms of Zn and Fe on grain and straw yield of chickpeas.
TreatmentsGrain Yield (q ha−1)Straw Yield (q ha−1)
1st Year2nd YearMean1st Year2nd YearMean
T1 9.12   e   ±   0.17 9.28   c   ±   0.41 9.20   e   ±   0.11 26.78   e   ±   1.32 28.19   ±   2.77 27.49   ±   0.99
T2 9.82   e   ±   0.14 9.59   c   ±   0.91 9.71   e   ±   0.16 28.79   d   ±   0.55 30.64   ±   2.16 29.72   ±   1.30
T3 9.72   e   ±   0.19 9.98   c   ±   0.47 9.85   e   ±   0.18 28.88   d   ±   0.28 30.94   ±   0.35 29.91   ±   1.45
T4 10.40   de   ±   0.40 11.28   b   ±   1.16 10.84   d   ±   0.63 31.76   b   ±   0.65 32.44   ±   3.50 32.10   ±   0.48
T5 12.24   b   ±   0.09 13.82   a   ±   0.42 13.03   b   ±   1.12 30.34   c   ±   0.27 31.39   ±   0.96 30.87   ±   0.74
T6 12.92   b   ±   0.33 13.36   a   ±   1.54 13.14   bc   ±   0.31 31.54   b   ±   1.60 32.72   ±   2.66 32.13   ±   0.83
T7 13.65   ab   ±   0.24 14.16   a   ±   1.42 13.90   ab   ±   0.36 33.85   a   ±   1.24 32.33   ±   3.97 33.09   ±   1.07
T8 10.82   d   ±   0.14 10.60   c   ±   0.06 10.71   d   ±   0.16 30.34   c   ±   0.84 31.26   ±   2.05 30.80   ±   0.65
T9 10.85   d   ±   0.08 10.19   c   ±   0.67 10.52   de   ±   0.46 30.59   c   ±   0.24 31.13   ±   2.37 30.86   ±   0.38
T10 11.38   cd   ±   1.29 11.85   bc   ±   1.03 11.61   cd   ±   0.34 31.05   c   ±   0.24 32.78   ±   3.94 31.92   ±   1.22
T11 11.93   c   ±   0.34 11.59   bc   ±   1.88 11.76   c   ±   0.24 32.78   b   ±   0.58 32.85   ±   4.26 32.82   ±   0.04
T12 12.03   c   ±   1.06 12.44   b   ±   . 1.05 12.24   c   ±   0.29 31.94   b   ±   1.03 32.88   ±   1.79 32.41   ±   0.66
T13 13.58   ab   ±   0.46 14.62   a   ±   1.09 14.10   a   ±   0.74 33.61   a   ±   0.96 32.89   ±   2.48 33.25   ±   0.51
T14 12.98   b   ±   0.51 13.31   ab   ±   0.57 13.15   b   ±   0.24 33.47   a   ±   0.63 31.69   ±   . 0.67 32.58   ±   1.25
T15 13.07   b   ±   0.12 13.24   ab   ±   0.50 13.16   b   ±   0.12 33.52   a   ±   0.52 31.81   ±   1.67 32.67   ±   1.21
T16 13.99   a   ±   0.11 14.16   a   ±   0.41 14.07   a   ±   0.12 33.95   a   ±   0.38 32.13   ±   2.10 33.04   ±   1.29
LSD (p ≤ 0.05)0.841.630.851.29NSNS
Treatments are detailed in Table 1. In columns, means with a similar or dissimilar letter(s) were evaluated with the least significant difference (LSD) multiple range tests, using a probability level of p ≤ 0.05, along with standard deviation.
Table 3. Effect of mineral, chelated and nanoforms of Zn and Fe on the concentration of Zn and Fe in grains of chickpeas.
TreatmentsZn Concentration in Grains (mg kg−1)Fe Concentration in Grains (mg kg−1)
1st Year2nd YearMean1st Year2nd YearMean
T1 37.78   c   ±   3.62 37.26   c   ±   3.12 37.52   c   ±   0.37 68.30   e   ±   0.36 65.18   c   ±   1.57 66.74   e   ±   2.21
T2 40.62   b   ±   1.12 39.38   c   ±   0.11 40.00   b   ±   0.87 68.33   e   ±   0.19 68.03   c   ±   3.62 68.18   e   ±   0.21
T3 35.45   c   ±   2.21 37.51   c   ±   0.19 36.48   c   ±   1.45 84.52   a   ±   2.73 87.75   a   ±   3.19 86.13   a   ±   2.29
T4 40.12   b   ±   1.38 38.16   c   ±   2.01 39.14   bc   ±   1.38 78.00   b   ±   1.90 77.26   b   ±   3.92 77.63   c   ±   0.52
T5 41.88   b   ±   0.88 38.96   c   ±   0.12 40.42   b   ±   2.06 67.62   e   ±   . 0.38 74.10   b   ±   3.31 70.86   d   ±   4.58
34.12   d   ±   0.13 37.82   d   ±   1.16 35.97   c   ±   0.21 85.21   a   ±   0.70 85.40   a   ±   4.55 85.31   a   ±   0.13
T7 40.38   b   ±   2.38 40.44   a   ±   0.17 40.41   b   ±   0.04 84.89   b   ±   1.51 83.78   b   ±   2.59 84.33   ab   ±   0.60
T8 40.77   b   ±   1.00 39.29   b   ±   0.15 40.03   b   ±   1.04 69.77   e   ±   1.95 70.05   c   ±   3.23 69.91   e   ±   0.20
T9 38.12   b   ±   3.37 38.94   b   ±   3.22 38.53   bc   ±   0.59 72.38   d   ±   2.18 74.10   b   ±   4.43 73.24   d   ±   1.21
T10 43.38   a   ±   0.13 39.98   a   ±   0.15 41.68   ab   ±   2.41 77.44   b   ±   1.66 75.61   b   ±   2.17 76.53   c   ±   1.29
T11 43.77   a   ±   2.50 40.21   a   ±   1.10 41.99   ab   ±   2.52 69.68   e   ±   2.01 71.88   b   ±   3.80 70.78   d   ±   . 1.55
T12 38.77   b   ±   0.25 39.41   b   ±   0.22 39.09   bc   ±   0.45 74.60   c   ±   1.00 86.49   a   ±   1.41 80.55   b   ±   8.41
T13 43.77   a   ±   1.50 42.07   a   ±   0.21 42.92   a   ±   1.20 74.63   c   ±   0.54 85.42   a   ±   2.90 80.02   b   ±   7.63
T14 38.30   b   ±   1.34 36.86   a   ±   1.56 37.58   c   ±   1.01 80.19   b   ±   4.06 84.86   a   ±   8.16 82.53   b   ±   4.71
T15 43.46   a   ±   0.42 41.06   c   ±   1.34 42.26   ab   ±   1.70 68.43   e   ±   0.46 75.33   b   ±   2.85 71.88   d   ±   4.88
T16 43.99   a   ±   0.74 40.59   b   ±   0.19 42.29   ab   ±   2.40 86.93   a   ±   1.83 86.08   a   ±   9.36 86.51   a   ±   0.78
LSD (p ≤ 0.05)3.083.752.012.489.092.77
Treatments detailed in Table 1. In columns, means with a similar or dissimilar letter(s) were evaluated with the least significant difference (LSD) multiple range tests, using a probability level of p ≤ 0.05, along with standard deviation.
Table 4. Effect of mineral, chelated and nanoforms of Zn and Fe on concentrations of Zn and Fe in the straw of chickpeas.
TreatmentsZn Concentration in Straw (mg kg−1)Fe Concentration in Straw (mg kg−1)
1st Year2nd YearMean1st Year2nd YearMean
T1 11.75   e   ±   0.91 16.47   c   ±   0.54 14.11   c   ±   3.33 161.98   d   ±   7.38 173.80   c   ±   5.40 167.89   d   ±   8.35
T2 16.47   bc   ±   1.05 22.99   a   ±   2.24 19.73   a   ±   4.61 166.55   d   ±   11.73 174.73   c   ±   10.28 170.64   d   ±   5.79
T3 14.90   cd   ±   1.54 17.61   c   ±   2.45 16.25   bc   ±   1.91 203.57   c   ±   14.87 217.58   b   ±   9.18 210.57   c   ±   9.90
T4 14.32   cd   ±   1.53 21.08   a   ±   3.50 17.70   b   ±   4.78 178.10   d   ±   15.50 217.44   b   ±   9.97 197.77   cd   ±   7.81
T5 18.27   ab   ±   0.72 19.09   b   ±   2.60 18.68   ab   ±   4.21 176.95   d   ±   9.83 183.83   c   ±   6.31 180.39   d   ±   4.86
T6 14.21   cd   ±   0.37 20.19   b   ±   1.53 17.20   bc   ±   4.23 229.67   b   ±   9.38 250.69   a   ±   3.13 240.18   b   ±   14.90
T7 17.94   ab   ±   1.74 20.75   b   ±   0.79 19.34   ab   ±   3.77 194.23   c   ±   7.64 271.82   a   ±   8.88 233.03   b   ±   54.85
T8 17.45   b   ±   0.81 21.92   a   ±   5.05 19.69   a   ±   3.16 166.82   d   ±   4.95 186.53   c   ±   17.04 176.68   d   ±   13.94
T9 12.46   de   ±   0.32 18.27   b   ±   2.23 15.36   c   ±   4.11 192.78   c   ±   17.32 209.01   b   ±   2.48 200.90   c   ±   11.47
T10 19.13   a   ±   1.03 22.14   a   ±   1.05 20.63   a   ±   3.55 202.85   c   ±   16.40 219.14   b   ±   13.93 211.00   c   ±   11.52
T11 16.99   bc   ±   1.12 21.53   a   ±   0.54 19.26   ab   ±   3.21 160.12   d   ±   10.92 175.10   c   ±   10.46 167.61   d   ±   10.59
T12 13.48   d   ±   0.69 18.62   b   ±   0.97 16.05   bc   ±   3.63 224.27   b   ±   21.55 228.28   b   ±   17.23 226.28   bc   ±   2.84
T13 15.63   c   ±   0.05 21.94   a   ±   0.52 18.79   ab   ±   4.46 226.13   b   ±   8.49 253.19   a   ±   15.02 239.66   b   ±   19.13
T14 12.14   de   ±   0.25 18.64   b   ±   1.76 15.39   c   ±   4.60 261.85   a   ±   13.87 277.18   a   ±   11.34 269.52   a   ±   10.84
T15 18.68   ab   ±   0.55 22.64   a   ±   2.55 20.66   a   ±   1.99 160.90   d   ±   7.03 175.79   c   ±   15.80 168.35   d   ±   10.53
T16 18.03   ab   ±   0.30 23.36   a   ±   2.56 20.70   a   ±   0.58 241.13   a   ±   15.33 210.90   b   ±   15.79 226.01   b   ±   21.37
LSD (p ≤ 0.05)1.623.822.1021.6529.4518.58
Treatments are detailed in Table 1. In columns, means with a similar or dissimilar letter(s) were evaluated with the least significant difference (LSD) multiple range tests, using a probability level of p ≤ 0.05, along with standard deviation.
Table 5. Effect of mineral, chelated and nanoforms of Zn and Fe on the economics of chickpeas.
Treatments Cost of Cultivation (US$)Net Return (US$)B:C Ratio
T1US$401.2 dUS$459.0 j2.14
T2US$409.0 cdUS$499.0 i2.22
T3US$409.8 cdUS$511.2 i2.25
T4US$417.6 cdUS$596.1 h2.43
T5US$414.1 cdUS$804.3 bc2.94
T6US$415.0 cdUS$813.7 b2.96
T7US$417.6 cdUS$882.2 a3.11
T8US$416.8 cdUS$584.7 h2.40
T9US$416.8 cdUS$566.9 h2.36
T10US$432.3 cUS$653.3 g2.51
T11US$421.9 cUS$677.8 g2.61
T12US$421.9 cUS$722.6 f2.71
T13US$432.3 cUS$886.2 a3.05
T14US$458.3 bUS$771.3 cde2.68
T15US$475.7 bUS$754.9 ef2.59
T16US$532.8 aUS$782.9 bcd2.47
LSD (p ≤ 0.05)25.136.6
Treatments are detailed in Table 1. In columns, the cost of cultivation, net return and B:C ratio with a similar or dissimilar letter(s) were evaluated with the least significant difference (LSD) multiple range test, using a probability level of p ≤ 0.05.
Publisher’s Note: MDPI stays neutral with regard to jurisdictional claims in published maps and institutional affiliations.

