Article

Microalgae and Biochar Agro-Fertilization of the Palestinian Rehan Barley Cultivar under Salinity Stress

by
Ashwaq A. Najjar
1,2,*,
Arnd J. Kuhn
2,
Sharaf M. Al-Tardeh
1,* and
Christina M. Kuchendorf
2,*
1
Applied Biology, Palestine Polytechnic University, Hebron P.O. Box 198, Palestine
2
Institute of Bio-and Geosciences Plant Sciences (IBG-2), Forschungszentrum Jülich GmbH, Wilhelm-Johnen-Str., 52428 Jülich, Germany
*
Authors to whom correspondence should be addressed.
Agronomy 2021, 11(11), 2309; https://doi.org/10.3390/agronomy11112309
Submission received: 15 October 2021 / Revised: 10 November 2021 / Accepted: 12 November 2021 / Published: 15 November 2021

Abstract

:
The efficient transfer of nutrients to plants in the form of biofertilizers on poor substrate was investigated. Biochar and dried algae biomass as well as mineral fertilizer were used to test the growth of the Palestinian ‘Rehan’ barley cultivar under salinity stress (4, 8, and 16 mS/cm EC). Rehan cultivar showed resilience to moderate levels of salinity and could still grow under high salinity stress (16 mS/cm EC). Rehan barley possessed better growth at early growth stage under the applied biofertilizers such as dried freshwater algal biomass (Chlorella vulgaris) and nutrient-laden biochar. It showed better growth than wheat (ssp. scirocco) under the same conditions. Its growth was highly improved by biochar treatment in low and moderate salinity conditions. Moreover, the combined effect between biochar and dried algae biomass could improve Rehan barley growth, but less than the effect of each biofertilizer separately. The biofertilizers affected most plant growth parameters under the salinity level of 4 and 8 mS/cm EC positively, while the growth declined again at 16 mS/cm EC. Overall, the biochar treatment showed the same effect as the mineral fertilizer on most of the parameters. The dried algae biomass and biochar also affected soil conditions. The highest soil water content (15.09%) was found in algae biomass treatments with 16 mS/cm EC. Biochar with 8 and 16 mS/cm EC had the highest pH value (8.63) near the rhizospheres. The nitrogen level was highest in the bottom soil sample (0.28 g N/kg soil) for biochar with 0 and 4 mS/cm EC. Meanwhile, the phosphate concentration was the highest (3.3 mg PO3−2/kg soil) in algae fertilizer treatments with 0 mS/cm EC in the bottom soil sample and lowest (4.14 mg PO3−2/kg soil) for the biochar with 8 mS/cm EC. The dried algae biomass and the biochar treatments can subsequently be viewed as conditioner substrates for improving the quality and fertility of the soil. Where possible, they should be considered as complement or replacement of mineral and manure fertilization to improve the impact on soil and environment.

1. Introduction

Agriculture in Palestine is suffering from severe reduction in agricultural land due to population explosion, Israeli settlements, bypass roads, military bases, and quarries [1,2]. In addition, factors such as decreasing freshwater availability and increasing soil stresses such as drought, salinity, and alkalinity are major limitations for crop production [3].
There are two kinds of stress factors affecting agriculture. Biotic stresses are defined as the damage in plants due to the negative effect of living organisms such as bacteria, viruses, fungi, parasites, beneficial and harmful insects, and weeds. Abiotic stresses include all the environmental conditions that decrease plant growth and yield to a certain level [4]. Abiotic stresses can cause around 65% crop loss, while the biotic stresses cause around of 10% crop yield loss, e.g., in Palestinian tomato crop [5]. Salinity is one of the major abiotic stress factors in arid and semi-arid areas which are prevalent in Palestine. Soil salinity stress results in a significant loss of crop yield around the world [6,7]. Moreover, soil contamination by xenobiotic (human-made) chemicals is one of the main challenges to agriculture worldwide. Recently, quarries and their landfills have been recognized as source of soil contaminants [2,8], for example, causing high alkalinity in the soil [9]. It is desired to reclaim quarry land for agriculture, which generates a need to replenish or ameliorate those substrates. Another important contaminant there is salt.
Salinity effects on plants include reduced soil water availability, nutrient imbalance, nutrient limitation, membrane dysfunction, inhibition of basic metabolic pathways such as photosynthesis and oxidative stress [10]. Na+ and Cl- are the ions that cause most nutritional imbalances in soil [11], most apparent in the Palestinian agricultural water resources [12,13]. Around 50% of agricultural lands around the world, which produce more than 30% of the world’s food, are affected by salinity stress [14]. Salinity stress is becoming a major abiotic stress in Palestine due to climate change factors, e.g., low annual precipitation, high temperature, salt-laden irrigation water [5]. The most affected areas in Palestine are the Gaza strip, Jericho and the southern of West Bank [12].
Generally, salinity stress levels pose direct and detrimental effects on plant growth and production [11]. High salinity can delay seed germination and cause growth rate reduction in the plant. Furthermore, at very high salt concentration, it can cause plant death [5]. For multi-stem plants such as wheat or barley, salinity can cause reduction in the number of their tillers and lower overall yield [15]. Salt-resilient crops or mitigating soil treatments are necessary in affected areas.
In general, Palestinian soil is fertilized by organic fertilizer (manure), which can have side effects on the agricultural land such as the accumulation of excessive nutrients, pathogens, and salinity [16]. Nevertheless, the use of chemical or inorganic fertilizers is not a sustainable approach due to its excessive accumulation of salts that may result in degradation of the soil biological environment [17]. The application of biochar in the soil as a technique for improving soil quality, e.g., structure and water holding capacity, and fertility is recommended for such substrates. It improves the soil greenhouse gas (GHG) retention, organic carbon content, and water retention capacity [18,19]. Moreover, it can increase microbial activity, biomass accumulation, and nutrient availability and soil ventilation [20,21].
More recently, other new biofertilizers have been introduced to agriculture. The micro-algal biomass of Chlorella vulgaris was produced successfully on a large scale in a limited light area of Western Germany [22]. The dried and powdered biomass of the micro-algae was used as biofertilizer and soil conditioner to improve wheat (Triticum aestivum L.) production on sandy poor soil [23]. Algae can be a valuable addition to a plant production process aimed at nutrient cycling. They grow very quickly when their environment is full of nutrients, as in wastewater [24]. The most important characteristics of algae in wastewater treatment are their high degree of absorption of nitrogen and phosphorus and their production of oxygen through photosynthesis, which helps bacteria to break down organic compounds [25]. When added to a soil substrate, the algae biomass is broken down, releasing the formerly remediated nutrients which become gradually available to plants and adding to the soil carbon content.
The use of such abovementioned fertilizers on crop plants has not yet been widely examined. However, it is of significant interest when applied to a lacking substrate combined with a resilient crop. One such plant is barley (Hordeum vulgare L.) which is a more salt-tolerant crop plant than cultivated wheat (Triticum aestivum L.) as reported in [6]. In this context, barley cultivars withstand salt concentrations up to 250 mM NaCl (equivalent to 50% seawater); meanwhile, wheat stops growing at around 100 mM NaCl [15]. Generally, the recommended soil pH for barley production is 6.3–7, with respect to cultivar variations. Therefore, the Rehan cultivar reveals 50% germination at 120 mM CaCO3 (unpublished study). Pertaining to nutritional needs, the average quantities of nutrients removed per ton of grain and straw for barley are around 26 and 3.5 kg/ha for nitrogen and phosphorus, respectively [26].
Barley is the most important crop after wheat, maize, and rice around the world [27]. It is an important crop for animal feed, food, and medical uses [15], for example in the treatment of cancer and geriatric diseases [25]. Barley water (seed extract) is used as a cough remedy and diuretic. The plant itself is used as a biological control to protect crops from frost [28]. Plants, such as a resilient barley species, combined with an appropriate soil amelioration method will help reclaim areas such as quarries for agriculture.
In this research study, the Palestinian barley ‘Rehan’ was used as model plant to resist salinity stress (abiotic) under the effect of biofertilizers. The main goal of this research work was to improve and determine the barley production under soil salinity stress when treated by biochar and freshwater-grown dried algae biomass. The ultimate objectives were to measure the growth parameters and determine the level of nutrients in the plant as an indicator for plant salt stress resilient mechanisms and gain insight into how to transfer this result to agricultural applications.

2. Materials and Methods

2.1. Experimental Conditions

Most of the experimental work was conducted in a greenhouse (50°54′35.1″ N 6°24′47.4″ E) at Forschungszentrum Jülich GmbH, 52,428 Jülich, Germany. The greenhouse climate was kept at a minimum temperature of 20 °C during the day and 16 °C at night, which resulted in summer conditions in a minimum temperature of 25 °C, with additional lighting of 20 kLux from 6–22:00 and regular air moisturization to 64%, which can to as low as 46%. The average daily light integral DLI on the plant level was 14.35 mol/m2d in August, declining to 8.8 mol/m2d in October (outdoor DLI 41 and 14 mol/m2d, respectively). The preliminary experimental work was conducted at Applied Biology Labs/Palestine Polytechnic University, Hebron, Palestine.

2.2. Plant Seeds

Ten certified Palestinian barley cultivars seeds were kindly provided by the seed bank of the Palestinian Agricultural Research Center (NARC), North Palestine. NARC produces barley seeds in the center’s experimental stations using the same method as the multiplication in the Union of Agricultural Work Committee (UAWC). In addition, a wheat cultivar (Triticum aestivum L. var. scirocco) was kindly provided by FZJ seed storage department.

2.3. Methods

2.3.1. Fertilizers

Biochar, mineral fertilizer, and biofertilizer (freshwater dried algae biomass) [22] amounts were standardized to an application of 45 kg P/ha.

2.3.2. Mineral Fertilizer ‘Hoagland Solution’ Preparation

Hoagland stock solution (100 times concentrated) [29] of 2 L of 1 M KNO3, 2 L of 1 M Ca(NO3)2, 1 L of 1 M MgSO4, and 1 L of 1 M KH2PO4; 1 L of trace elements; and 1 L of Fe EDTA (0.0896 mol/L Fe) was prepared and diluted to 40 times concentration. Then, 100 mL distilled water, 100 mL 40 times concentrated Hoagland, and 4 mL KH2PO4 were added to each pot (see Table S2).

2.3.3. Comparative Effects of the Fertilizers under Saline Conditions

Palestinian barley ‘Rehan’ seeds were germinated for 7 days on wet paper. Next, 120 seedlings were planted from July 2019 to August 2019 for 7 weeks in 3 l plastic pots containing 3.2 kg sand as poor nutrient soil (its characteristics are described in [23]) with 64 g biochar, 14 g dried algae biomass corresponding to 115 mg (P) as contained within the biomass, and Hoagland solution (mineral fertilizer which was added to deliver 120 mg P per pot), respectively, in 10 replicates for each fertilizer treatments. For each fertilizer treatment, 10 replicates were watered at the start of the experiment with saline solutions to meet (0, 4, 8, 16 mS/cm EC) salinity concentration, which approximately equals 0, 44, 87, and 175 mM, respectively. The amount of added fertilizer correspond to the standardized p value of ~45 kg P/ha. Further, 10 pots containing 2.53 kg ‘SoMi513 substrate’ (Industrie-Erdenwerk Archut, Lauterbach, Germany, a ‘luxury’ substrate, comprising 20% crushed pumice, 50% furnace bottom ash, and 30% quality peat, with 375 mg/LNO3-N, 99 mg/L P2O5, 348 mg/L K2O and 285 mg/L Mg) were prepared as a reference for maximum growth. Barley plants (10 replicates) in pots containing biochar (no nutrients) with sand were prepared as control for biochar with mineral treatment. Those and the ‘SoMi’ treatment pots were not photographed by the automated system (capacity reached) but documented by hand. All other plants were watered, randomized on every measurement day, and photographed automatically by ‘Screen House’ (Visser Crane). The watering was done to reach 60% of the respective water holding capacity of substrate water content by an automated watering balance (compare [23]) to ensure comparable water treatment of all pots.

2.3.4. Biofertilizer (Dried Algae Harvested from Freshwater)

Twelve seedlings of Rehan Palestinian barley cultivar and wheat (ssp. scirocco) were planted after 7-day germination and cultivated from August 2019 to October 2019 (7 weeks) in 3 l plastic pots containing 3.2 kg sand with 14 g dried algae biomass. As discussed in Section 3.1, dried algae biomass fertilizer did not support the growth of barley as expected according to the results of [23]. This section explores the real effect of dried algae biomass fertilization by comparing its effect on the growth of ‘Rehan’ cultivar. Wheat was used as a control to test if the effect is due to barley not being able to utilize algae biomass like wheat did in earlier experiments that aimed to determine the effect of fertilizers (biochar, dried algae biomass from freshwater) on ‘Rehan’ barley during the early growth stage.

2.3.5. Comparison of Biochar and Dried Algae (Freshwater) Fertilizing Wheat and Barley ‘Rehan Cultivar’

In order to investigate possible differences of nutrient availability for barley versus wheat under the effect of the aforementioned fertilizers, eight pots were filled with 3.2 kg sand, 14 g dried algae, and 64 g biochar. Four replicates of both wheat (ssp. scirocco) and Rehan Palestinian barley cultivar seedlings (7 days after germination) were planted form September 2019 to November 2019 (7 weeks). An overview about all experimental setups is shown in Table 1.

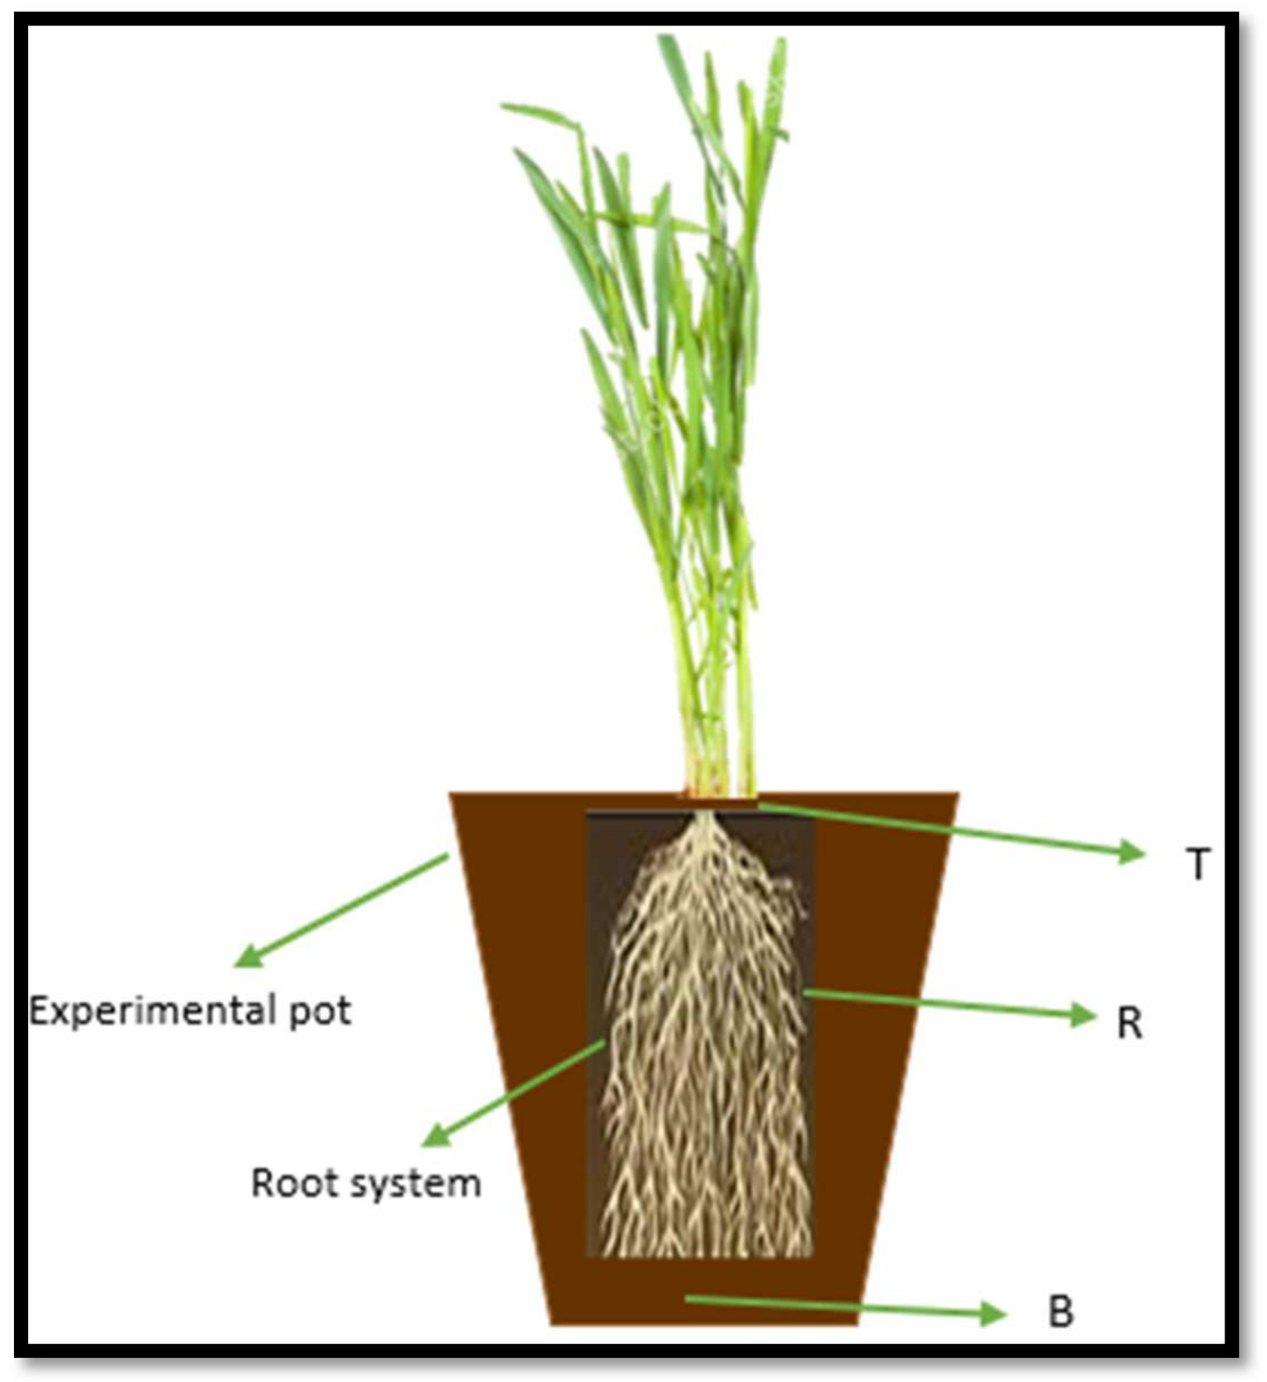
2.3.6. Plant Harvesting and Soil Analysis

At the end of the experiment (7 weeks of cultivation), roots and leaves were collected separately. Tillers and number of ears were counted. Three shoot samples of each treatment were analyzed for leaf area (via a LI-3100 area meter, LI.COR, Inc., Lincoln, NE, USA). Three root samples each were analyzed using a WinRhizo scanner and software (Regent instruments Inc., Québec, QC, Canada). All shoots and roots were place into paper bags and dried in the oven at 60 °C for 72 h. For measuring nutrient concentration in our soil, a weighted amount of soil was collected from top soil (T), bottom soil (B), and soil near the rhizosphere (R) as well as mixed (MIX) samples from all places (Figure 1). The collected samples were placed in 100 mL PE bottles. Samples were analyzed for soil moisture, PO43−, total N concentrations, and EC. The samples were dried in the oven at 40 °C for 72 h prior to extraction, and dry weight was determined. The vials/PE bottles were then mixed with 25 mL of distilled water and shaken for 1 h. Then the samples were centrifuged at 4100 rpm for 10 min. pH and EC were determined from the supernatant using a MettlerToledo 7Go pH conductivity meter. Total nitrogen (N) content was measured from the supernatant using Hach-Lange tests (Laton). Phosphate (PO43−) content was measured for the supernatant using PiBlue (BioAssaySystems, Hayward, CA, USA) test and LCK138 Hach-Lange tests.

2.3.7. Statistical Analysis

IBM SPSS Statistics V22.0 provided the parametric and nonparametric statistical tools which were used to test the hypothesis. An independent sample t-test was used to test the differences between two means with normal distributions and equal variance in two groups. The Mann–Whitney U Test was utilized to examine the differences between means with non-normal distributions or non-equal variance in two groups. A one-way analysis of variance (one-way ANOVA) test was applied to examine the differences of means when the variable distributions in all groups were not significantly different from a normal distribution and had a homogenous variance. The Kruskal–Wallis test was utilized to test the non-parametric alternative of variance test (one way-ANOVA). The respective tools are indicated at the end of each result table.

3. Results

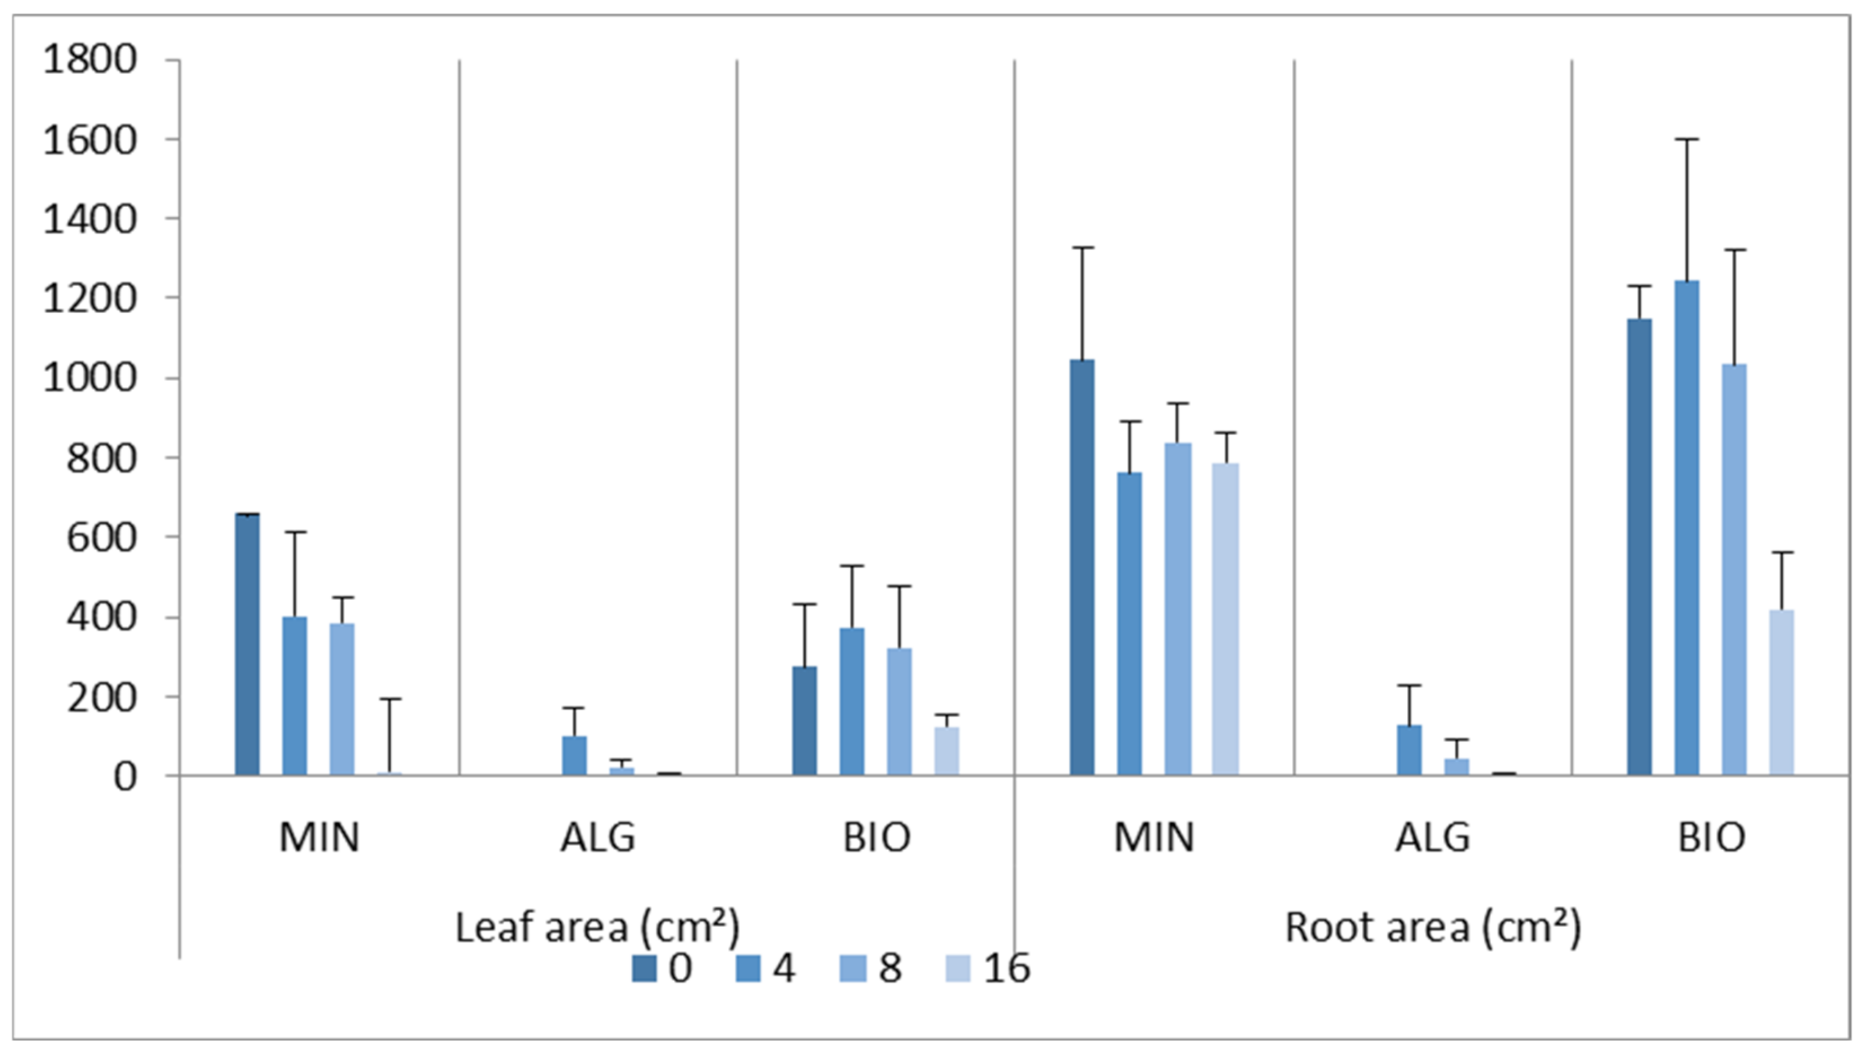
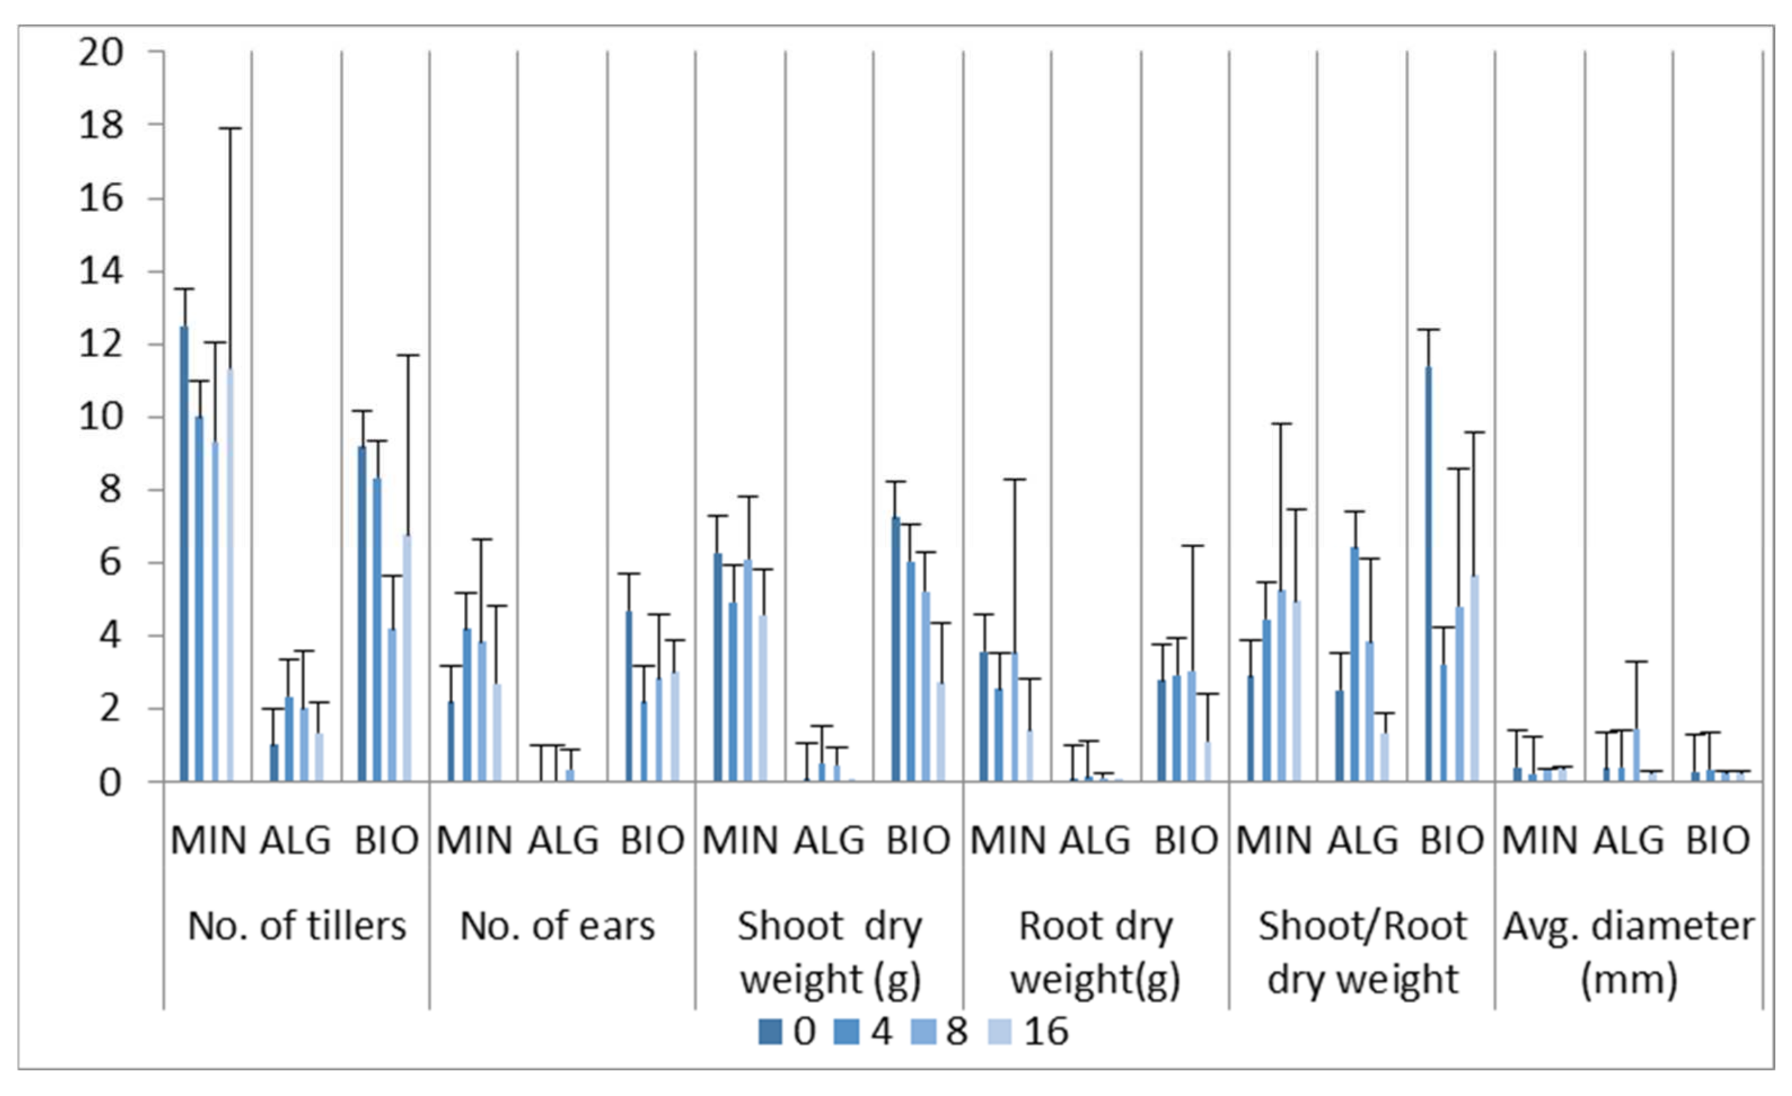
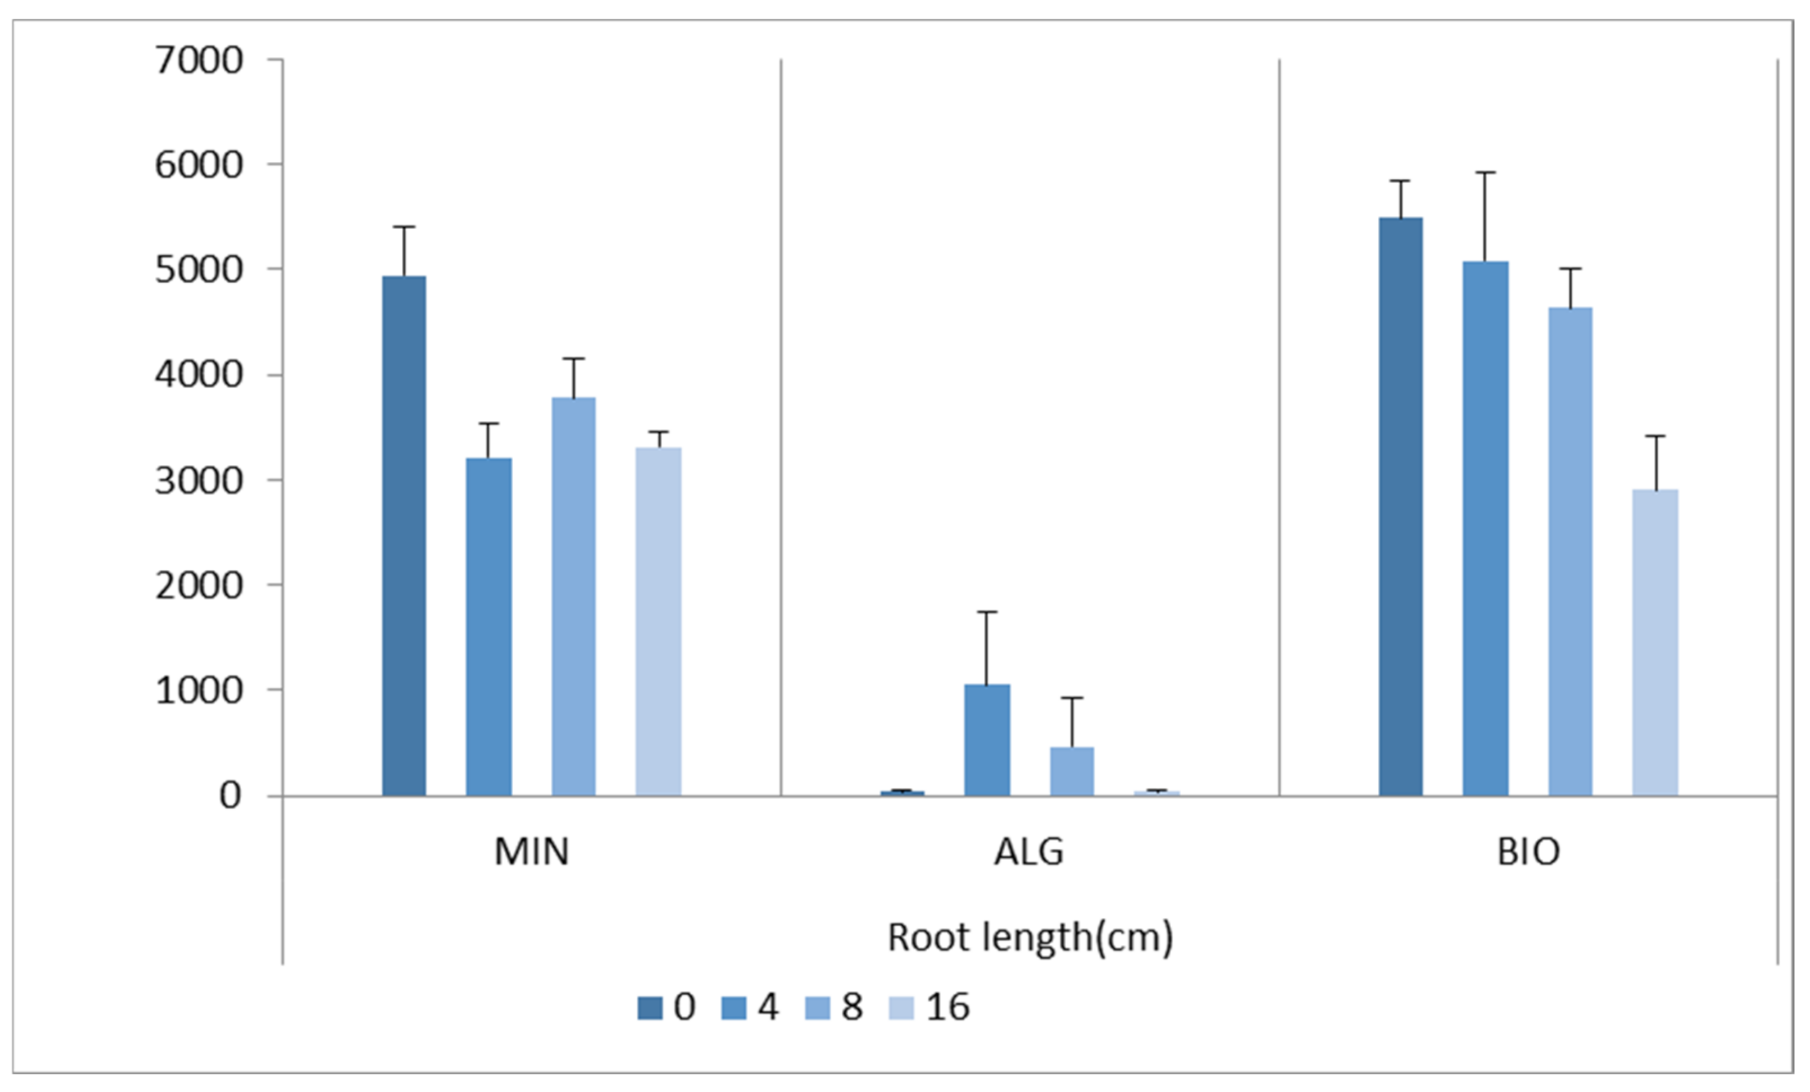
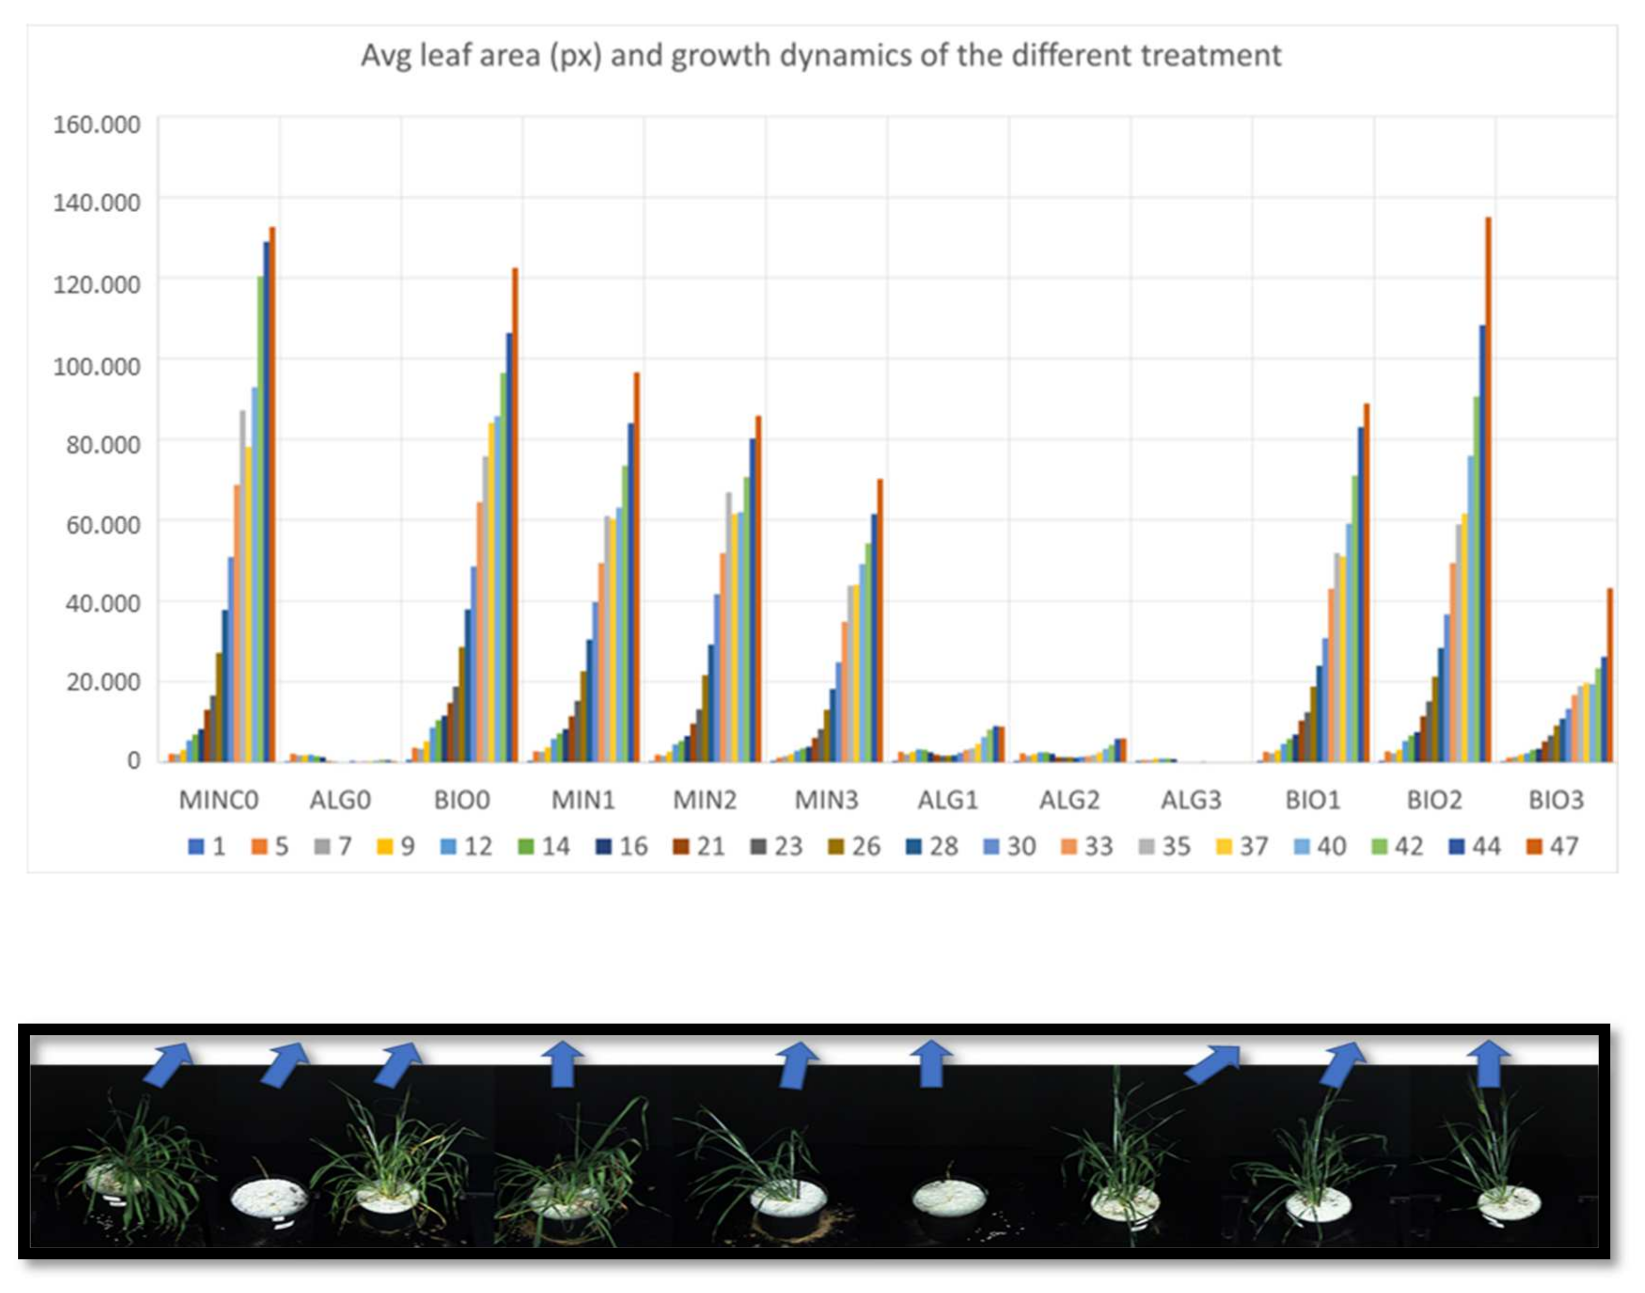
3.1. Effects of Organic Fertilizers on ‘Rehan’ Barley under Salinity Stress

The effects of different combinations of salinity levels and fertilizer types on the early growth stage of the Rehan barley cultivar are presented in Figure 2, Figure 3 and Figure 4. The results reveal that the highest shoot growth appears in the mineral fertilizer treatment at 4 and 8 mS/cm EC. Biochar treatment shows the highest value for number of ears, followed by mineral fertilizer at EC 4 and 8 mS/cm (Figure 2). There was almost no growth in both shoot and root systems in algae fertilization treatment for 0 and 16 mS/cm EC (Figure 3). The root system shows the highest root length for biochar at 0 mS/cm EC, followed by biochar at 4 mS/cm EC (Figure 4). However, dry algae treatment shows the highest root diameter at 8 mS/cm EC, followed by biochar at 0 mS/cm EC (Figure 2). For more detailed information see Table S1.
The growth dynamics (plant leaf area, Figure 5) reveal that the highest leaf area growth rate is obtained under the fertilization with biochar at 8 mS/cm EC and mineral fertilizer at 0 mS/cm EC. However, leaf area declines with increased salinity levels under mineral fertilizer. In contrast, algae fertilizer shows slow growth at 4 and 8 mS/cm EC while no growth at all in its control. Algae fertilizer with 16 mS/cm EC shows significantly declined growth. Finally, biochar shows a decrease in the leaf area from 0 to 4 mS/cm EC treatment, then a significantly higher value at 8 mS/cm EC followed by strong decline at 16 mS/cm EC.

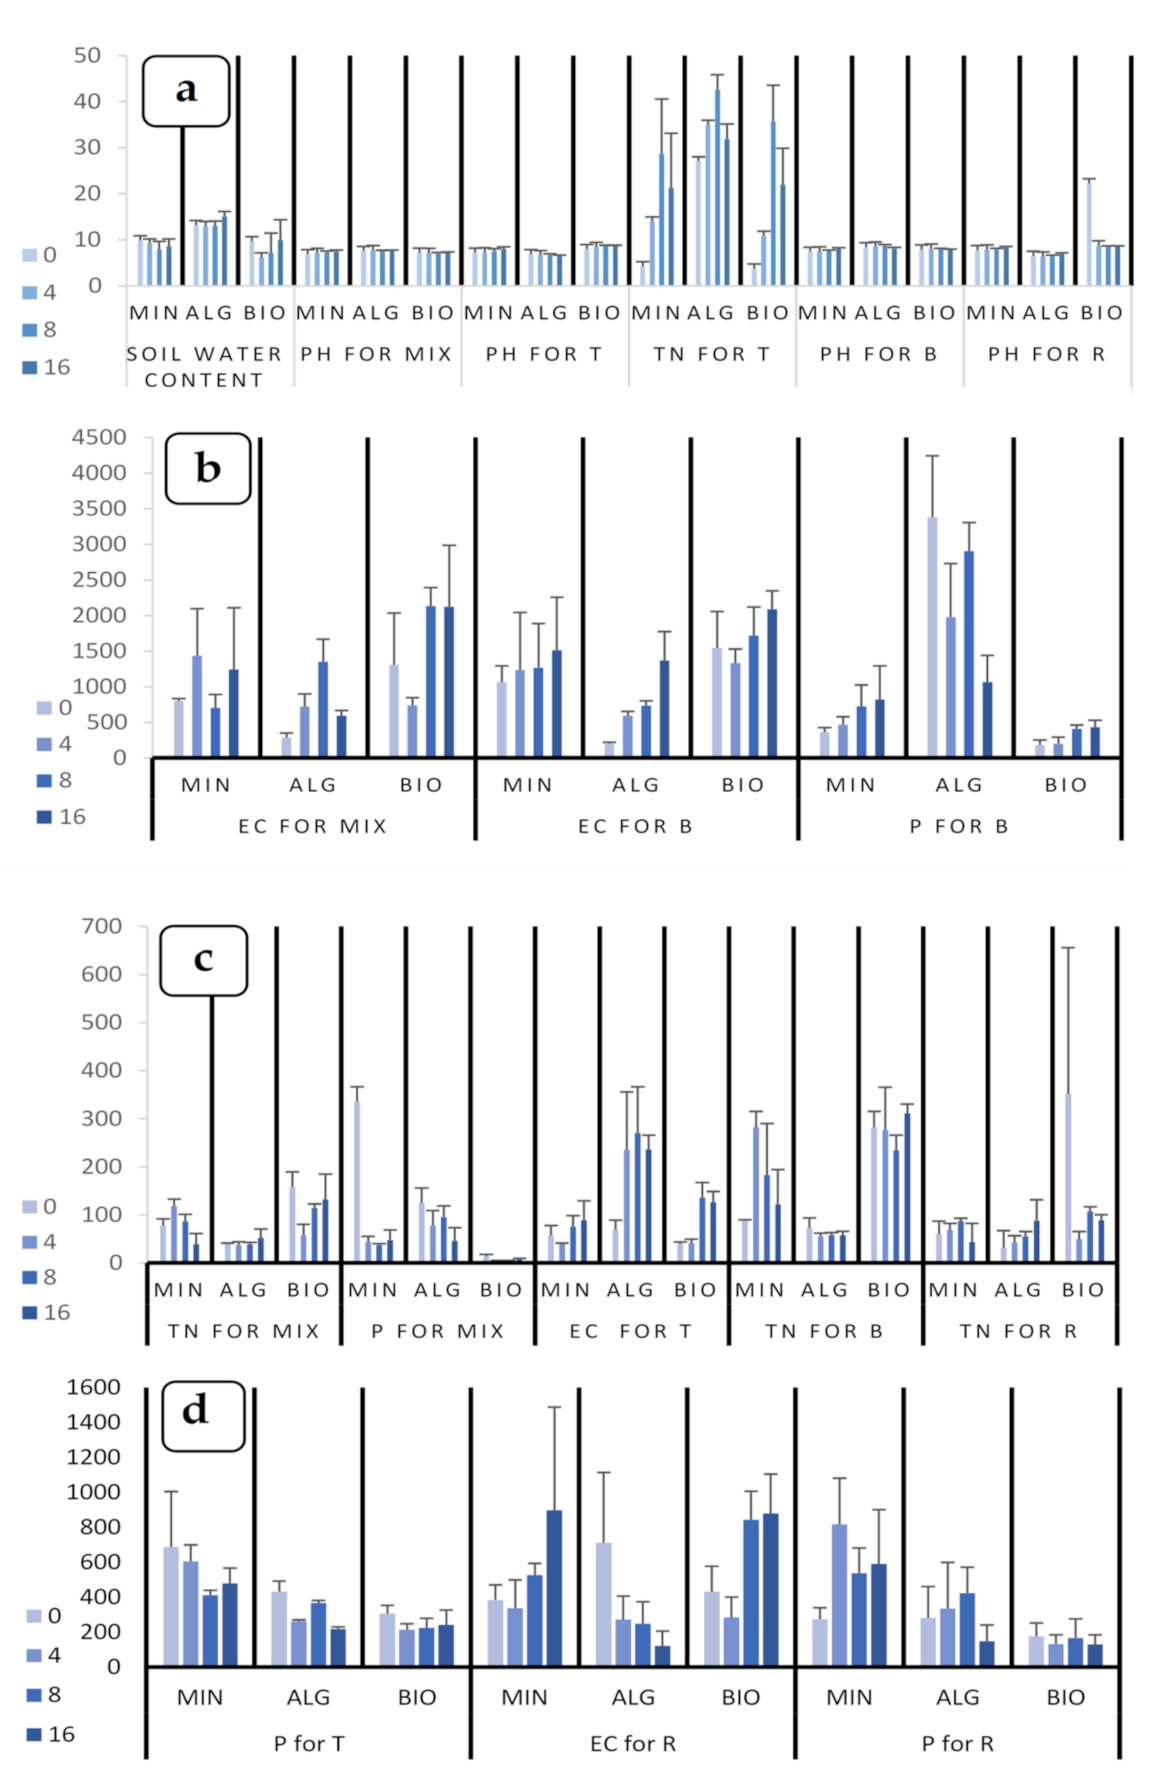
3.2. Comparative Effects of Organic Fertilizers on Soil Parameters during the Early Growth Stage of Palestinian Barley Rehan Grown in Saline Soil

As shown in Figure 6a, the highest soil water content appeared in the algae biomass treatment at 16 mS/cm EC, followed by algae biomass treatment at 8 mS/cm EC, while the lowest value appeared for biochar at 4 mS/cm EC.
The highest pH value (8.53, 8.67) was detected in the bottom of the experimental pot in algae and 4 and 8 mS/cm EC. Biochar at 4 and 8 mS/cm EC have the highest pH value near the rhizosphere. In general, pH was between 6 and 8.80.
According to EC changes in Figure 6b, the highest values (898.9 µS/cm) were found near roots at 16 mS/cm EC for biochar and mineral fertilizer. Moreover, the highest values at the top soil is in algae biomass at 8 and 16 mS/cm EC, while the lowest values are in algae biomass and mineral fertilizer with 4 mS/cm EC. The nitrogen level for biochar with 4 and 8 mS/cm EC was the highest in most of the pot positions but not in the top soil of the experiment. It shows the highest value in algae with 8 mS/cm EC. The lowest values are in algae biomass at 4 and 8 mS/cm EC.
The phosphate concentration has the highest values in mineral fertilizer at 4 mS/cm EC in most of the pot positions but not in bottom soil. For mixed samples, the highest value (336 µg PO3−2/g soil) is found in mineral fertilizer at 0 mS/cm EC, while the lowest value (4.14 µg PO3−2/g soil (mg/kg)) is in the biochar treatment at 8 EC (Figure 6). Regarding the nutrients leaching into the soil, the total nitrogen level had the highest value at the bottom at all salinity levels in mineral treatments. However, the phosphate concentration was the highest between top soil and rhizosphere areas in 0 and 4 EC, respectively, and the highest at the bottom of the soil at salinity levels 8 and 16 EC.
For biochar treatments, the total nitrogen level had the highest value at the bottom at all salinity levels, as observed in mineral treatments but not at 0 salinity where it was highest in the rhizosphere area. For phosphate level, the highest values were at the bottom of the soil for 8 and 16 EC.
For algae treatments, the total nitrogen level had the highest value at the bottom at all salinity levels, as observed in mineral treatments, but lower in comparison with mineral treatments. For phosphate level, the highest values were at the top in 0 and 4 EC, and at the bottom of the soil for 8 and 16 EC.

3.3. The Effect of Biochar (Alone) on the Early Growth Stage for Rehan Barley Cultivar

The results show that the shoot and root growth in biochar with mineral treatments is significantly higher and faster during the growth period of 7 weeks. According to soil parameters, the addition of minerals did not affect soil water content, while pH decreased with the addition of minerals to biochar. The nutrient concentration was greater in biochar with minerals than biochar alone (Table 2).

3.4. The Effect of Dried Algae Biomass (Freshwater-Grown) Biofertilizer on the Early Growth Stage of ‘Rehan’ Barley Cultivar

Rehan barley growth is faster than wheat in all plant parts, except for the appearance of tillers, which is the same (Table 3). Pertaining to soil parameters, soil water content is higher in wheat soil due to less water uptake by the plants. However, the pH in wheat soil is lower than barley soil in all pot positions. Moreover, the nutrient concentrations are higher in wheat soil than barley ones.

3.5. Comparison of the Combined Effects of Biochar and Dried Algae Biomass Grown in Freshwater on Wheat and Barley ‘Rehan Cultivar’

The growth under the fertilization by biochar and dried algae biomass is faster in wheat than barley for both shoot and root systems, with little difference (Table 4). In addition, there is no ear growth during the 7-week period. On the other hand, soil water content is higher in barley soil than in wheat soil. However, there are no differences in pH and nutrient content, except for phosphate in the bottom of the experimental pot.

4. Discussion

Plants that are able to cope with high salinity are important in an agricultural world where increasing soil salinity is one of the main challenges. Furthermore, fertilizers that can mitigate salt effects and that may even be able to help close the nutrient cycle are highly needed. After the described treatments, Rehan barley, which was proposed as a resilient crop species, coped better than wheat under the given conditions and proved its ability to face harsh highly saline environment.

4.1. The Maximum Growth of Barley in SoMi513 (Luxury Substrate)

SoMi513 substrate was applied in the experiment that aimed to determine the effect of fertilizers (biochar, dried algae biomass from freshwater) on Rehan barley during the early growth stage as a positive control for the maximum growth of the used plant (see Table S5). The growth of biochar treatments is slightly lower than SoMi treatments. The growth of algae was also less than SoMi treatments. This is the same finding as with wheat growth under the effect of dried algae biomass [23]. Therefore, the abovementioned biofertilizers are a successful sustainable soil conditioner for the improvement of plant growth and yield.

4.2. Salinity Effect

Seed germination faces a lot of limitations such as environmental conditions, differences in soil mineral concentrations, and diseases. The present study reveals that the salinity stress delayed the seed germination especially at 175 mM NaCl (see Table S5). This finding coincides with sunflower [31], and Palestinian tomato cultivars that showed strong development speed decrease at 100 mM level [5]. Rehan cultivar in our experiments could compromise with up to 4 mS/cm EC during the early growth stage, then its performance declined with 8 and 16 mS/cm EC, proving that Palestinian barley is indeed a moderately salt-tolerant plant [6].
Root morphology is one of the best parameters to describe the ability of the plant to find the needed water and dissolved nutrients [32]. The increase in salinity level leads to an increase in root thickness, due to the increase in cortex thickness as an effect of compartmentalization of toxic ions. Salinity increase also causes reduction in root length and reduces both root and shoot systems [5] and subsequently productivity. The presented results correspond with the aforementioned facts, as here (Figure 2) root length was also reduced, and overall biomass was less than in the controls.
On a highly saline substrate, high sodium accumulation in the cells causes osmotic imbalance and ion toxicity [14,30]. Moreover, the stomata close, as a defense mechanism of salinity stress, to prevent loss of the limited amount of water [33]. This leads to photosynthesis reduction because of the reduction in the CO2 supply. Then, cell metabolic processes suffer from low to no water [15]. Accordingly, this metabolic imbalance causes high oxidative stress.
Stress responses could also be observed in other parameters. Wheat showed decline and delay in ear appearance and numbers under the effects of 100–175 mM NaCl [34]. In our results, barley showed delay at 4 mS/cm EC but not at 16 mS/cm EC, which proves that barley has tolerance to salinity stress. In this context, sunflower grown under 50–200 mM NaCl concentrations possesses a significant reduction in shoot length. In addition, it was also reported that the fresh and dry weight for both shoot and root systems was reduced at high salinity levels [31]. Similar results are also evident in our study.
Salinity stress affects the physical and chemical properties of the soil in addition to the directly visible effect on the plant growth. Soil salinity causes phosphorus deficiency for the plant because of phosphorus precipitation and subsequently lowered availability [33]. The transpiration rate declines as defense mechanism to prevent the high salt uptake, and to save more water in plant tissue. As a result, the nitrogen uptake process from root to shoot system slows down [14]. The water content for high saline soil is higher, since it is not well absorbed by the plant. In general, it is postulated that EC for wheat and barley should not exceed 4–5 mS/cm EC [35].
In present study, the soil water content increased with the increase in salinity level. This is due to the low consumption of water by the plant. PH changes in soil are more affected by the type of fertilizer rather than by the degree of salinity, which coincides with earlier findings [11]. In our study, the nutrient concentration decreased with salinity increase. This may be because of chemical reaction processes, which lessen the ratio of elements from a beneficial to a less beneficial chemical composition available to the plant, an effect of chemical antagonistic effect between supplementary elements and salt particles. These processes decrease elemental absorption by the plant and decrease its dry weight [11]. Plants that are able to cope with these effects are needed, and barley has proved to be a promising candidate.

4.3. Fertilization Effect of Biochar Treatment

The addition of biochar can create a high moisture nutritionally favorable environment for plant growth. It improves soil physical, chemical, and biological properties, which in addition improves plant growth and development [36]. It increases the soil ability in water and nutrient absorption, especially in sandy soil [36,37]. Biochar can increase the water holding capacity, plant growth, and soil workability [38,39].
In this study, there was an improvement of shoot and root growth in comparison to mineral fertilizer. Biochar growth treatments were higher in root system growth than in the shoot system. According to salinity treatments, the higher growth dynamics in the leaf area was in biochar with 8 mS/cm EC, while it decreased with salinity increasing from 0–16 EC. This agrees with the findings in the greenhouse experiment in FZJ-Germany which aimed to determine the effect of biochar on improving carrot quality and yield [40] and Ohrem et al. (under preparation). Here, the effect of biochar with compost highly increases the dry biomass weight and plant height but less than the effect of compost alone. Moreover, the effect of biochar with mineral fertilizers had higher growth than each of the fertilizers separately [41].
Our results in the present study correspond with the abovementioned findings. Biochar treatments did not show a significant change in water content when compared with mineral treatments, which disagrees with [40] and Ohrem et al. (under preparation), who reported an increase in water holding capacity. Treatments here, however, were never watered to full water capacity to keep water availability in the different fertilizations relatively similar; otherwise, we would expect a similar effect. pH showed an increase in biochar fertilized soil. This is an expected effect of adding biochar to soil [36].
Nitrogen is higher in biochar treatments, while the opposite is the case for phosphorus concentration. It is believed that biochar addition affects the transformation of nitrogen in soil, while it increases phosphorus uptake by the plant [37]. Furthermore, phosphate is less abundant in the raw materials of biochar producers [42]. The application of biochar has led to a 50% and 80% reduction in N2O emissions in soybean farms and pasture systems [36,43].
In the present study, salinity affected soil properties which agreed with [34,35]. However, the pH, water content, and EC increased with increased salinity; meanwhile, nutrient concentration decreased. All soil parameters showed decrease in the nutrient concentration values at 4 and 8 mS/cm EC salinity levels, likely caused by high plant growth rate in these treatments.
It is clear that biochar alone does not improve poor soil since biochar does not support the needed minerals for favorable growth [37]. Our findings present that biochar loaded with mineral fertilizer has high and significant growth for all plant parts, and high water and nutrient availability. In contrast, very low growth and weak plants were apparent in biochar treatment without any nutrient supply, as to be expected. The improved water efficiency and soil structure is not enough to make the sand a favorable substrate without nutrient addition. Currently, mixtures of biochar with different organic nutrient sources such as manure are being tested with promising results [44].
Dried algae biomass in addition with biochar can improve soil productivity, but its effect is still weak compared to biochar with minerals and algae without biochar (see Table S4). There are no recorded studies of the synergic effect of dried algae and biochar biofertilization yet. One available study explains the production of algae biochar form algae biomass as a fertilizer and soil conditioner [45]. Maybe mineral fertilizer can be easily released by water from biochar, but algae combined with it are not as easily broken down as ‘free’ algae. This means the structural effect of biochar is important here for the positive combined effect, and the algae express a not immediate availability of their whole nutrient content; this may be unsuitable for short-term fertilization of a high-demand crop but could be a very desirable effect of nutrient-release delay for soil amelioration on a longer time scale.

4.4. Fertilization Effect of Freshwater-Grown Algae

Algae can be used as soil conductor to improve both positive soil characteristics and plant productivity [45]. The results of this study did not show an improvement in Rehan Palestinian barley cultivar in the first experimentation (see Table S6). This was due to circumstances during early germination, since the same experiment was repeated on the same barley and wheat with the expected outcome. The difference between the two experiments is very likely the different environmental temperatures in a crucial growth phase, when the nutrients from the seed were depleted and the seedling had to exploit the substrate (35 °C when barley was negatively affected, 24 °C during high yield with the same setup). High temperature may have prevented soil microorganisms from properly decomposing the high rigid cell wall of Chlorella cells, in addition to more rapid water loss and higher stress for the seedling to successfully reach the nutrients. The results of the repeated study ‘Section 2.3.4’ show successful growth for wheat and highly improved performance of barley compared to the first experiment ‘Section 2.3.3’. This proves that phosphorus can be well released from algae cells to plant roots and improve its growth which coincides with [23], but there are critical phases which need to be considered during application. Furthermore, the loss of nitrogen at pot bottom was lowest in the algae treatment due to plant insufficient growth.

5. Conclusions

The results of this study emphasize the ability of biochar as a fertilizer carrier and dried algae biomass from freshwater cultivation to improve the growth and performance of Rehan barley. These kinds of fertilization processes can be used as soil conditioners to improve quality and fertility. Accordingly, we recommend biochar addition in low and medium saline levels, since it had the highest supporting effect to our barley’s growth compared to the control. Therefore, we recommend using this substrate with barley (moderately resistant) for the highest effect, especially in a saline environment. This can replace or be combined with chemical and manure fertilization to reduce negative impacts of the pure resources, e.g., on Palestinian quarries and wastewater sludges, and improve efficiency and nutrient transfer as a step towards a circular economy.
The performance of the abovementioned biofertilizers can be affected by different salinity concentrations. The Palestinian Rehan barley cultivar is able to grow productively even in high salinity concentration conditions (16 mS/cm EC). Salinity-tolerant plants such as Rehan cultivars are recommended for cultivation in moderately saline and sandy marginal soils in Palestine and should be explored again in regard to yield and productivity in a full-time field experiment or agricultural application.
Regarding the nutrients leaching into the soil, the total nitrogen level had the highest value (282.45 µg N/g soil (mg/kg)) at the bottom at all salinity levels in mineral treatments. For phosphate the highest concentration (3381.42 µg PO3−2/g soil (mg/kg) was at the bottom of the soil with increasing salinity. The nitrogen loss effect at pot bottom was lowest in the algae treatment with ~80 mg/g concentration, as compared to more than ~100/300 mg/g in mineral and biochar treatment, respectively.
Plants were capable of sufficient growth in the later algae treatments, where soil water content was also lower than in the other treatments (9% vs. 10%) and grew comparably to mineral fertilizer in the biochar treatment. Therefore, algae are also recommended as a beneficial fertilizing option under non-optimum saline conditions.
Further research is needed to understand the mechanisms of nutrient cycling between biomass or organic fertilizers and plants, especially the involved microbial community and the fate of the nutrients from biofertilizer substrate in soil to plant. In addition, to detect the best combination between these techniques, volume (waste and fertilizer need) and a method of scaling up to a cost-efficient agricultural management option to compromise with both agriculture and economy needs more exploration. All of the aforementioned aspects are essential to develop bio-economic and independent sustainable agriculture.

Supplementary Materials

The following are available online at https://www.mdpi.com/article/10.3390/agronomy11112309/s1, Table S1. The effects of different combinations of salinity levels and fertilizer types on early growth stage (7 weeks) for Rehan barley cultivar; Table S2. Hoagland solution recipe with trace elements; Table S3. The effects of different combinations of different fertilizers (mineral fertilizer MIN, dried algae biomass ALG, and biochar BIO) and salinity levels on the soil parameters during the early growth stage (7 weeks) of “Rehan” cultivar. ECµS/cm= electric conductivity, TN (µg N/g soil [mg/kg] = total nitrogen, P (µg PO3−2/g soil [mg/kg] = phosphate, T = top soil sample, B = bottom soil sample, R = rhizosphere soil sample, mix = mixture soil sample, sig. = significance of the test. Table S4. The comparative effect between algae fertilization from (August–October 2019), the synergic effect for dried algae and biochar (September–November 2019), and biochar with mineral fertilization effect (July–September 2019) on the plant parameters during the early growth stage (7 weeks) of “Rehan” cultivar. Table S5. Germination percentage of ten barely cultivars growing in Palestine under the effect of 0, 50, 85 and 175 mM NaCl ([46], unpublished work). Table S6. The comparative effect between dried algae fertilization from 1st treatment (July–September 2019) and dried algae fertilization from 2nd treatment (August–October 2019) on the plant parameters during the early growth stage (7 weeks) of “Rehan” cultivar.

Author Contributions

Conceptualization, A.A.N., C.M.K., A.J.K., S.M.A.-T.; methodology, C.M.K., A.J.K., A.A.N.; validation, A.A.N.; investigation, A.A.N.; resources, C.M.K.; writing—original draft preparation, A.A.N.; writing—review and editing, C.M.K., A.J.K., S.M.A.-T.; visualization, A.A.N.; supervision, A.J.K., C.M.K.; project administration, C.M.K.; funding acquisition, C.M.K., S.M.A.-T. All authors have read and agreed to the published version of the manuscript.

Funding

This research was funded by the German Federal Ministry of Education and Research (BMBF) in the program PalGer, project ‘COMPASSES’, FKZ 01DH19007, and supported by the BMBF program Palestinian-German Science Bridge (PGSB), FKZ 01DH16027.

Institutional Review Board Statement

Not applicable.

Informed Consent Statement

Not applicable.

Acknowledgments

The authors would like to acknowledge the Palestinian-German Science Bridge (PGSB) for expenses that were allocated for this master’s thesis research project. Deep gratitude is expressed to the Palestinian German cooperation (PalGer Project) and the Union of Agricultural Work Committee (UAWC) for their partial funding to support this research work. Special thanks and gratitude for Maryam Fasfous for support with the statistical analysis. Special thanks to Fang He for help with the editing and proofreading of this manuscript.

Conflicts of Interest

The authors declare no conflict of interest.

Abbreviations

SymbolAbbreviation
ACSADArab Center for the Studies of Arid Zones and Dry Lands
ALGAlgae dried biomass powder produced in freshwater
BSoil sample from the bottom of pot
BIOBiochar with mineral fertilization
ECElectric conductivity
FZJForschungszentrum Jülich
ICARDAInternational Center for Agricultural Research in the Dry Areas
MINMineral fertilization
mMMillimolar
NaClSodium chloride
PPhosphorus
RSoil sample from the rhizosphere area
SoMiFull nutrient soil
Synergic effectCombined effect of two factors ‘fertilizer + salinity’
TSoil sample from the top of pot
TNTotal nitrogen
Px.Pixels

References

  1. Raddad, S.; Salleh, A.G.; Samat, N. Determinants of agriculture land use change in Palestinian urban environment: Urban planners at local governments perspective. Am.-Eurasian J. Sustain. Agric. 2010, 4, 30–38. [Google Scholar]
  2. Al-Tardeh, S.; Al-Tardeh, M. Impact of quarries emissions on the leaf morpho-anatomy of three olive (Olea europea L) cultivars grown in Palestine. Afr. J. Plant Sci. 2019, 13, 255–263. [Google Scholar] [CrossRef]
  3. Arias-Baldrich, C.; Bosch, N.; Begines, D.; Feria, A.B.; Monreal, J.A.; García-Mauriño, S. Proline synthesis in barley under iron deficiency and salinity. J. Plant Physiol. 2015, 183, 121–129. [Google Scholar] [CrossRef]
  4. Anami, B.S.; Malvade, N.N.; Palaiah, S. Classification of yield affecting biotic and abiotic paddy crop stresses using field images. Inf. Process. Agric. 2019, 7, 272–285. [Google Scholar] [CrossRef]
  5. Al-Tardeh, S.; Iraki, N. Morphological and anatomical responses of two Palestinian tomato (Solanum lycopersicon L.) cultivars to salinity during seed germination and early growth stages. Afr. J. Biotechnol. 2013, 12, 4788–4797. [Google Scholar] [CrossRef] [Green Version]
  6. Darko, E.; Gierczik, K.; Hudák, O.; Forgó, P.; Pál, M.; Türkösi, E.; Kovács, V.; Dulai, S.; Majláth, I.; Molnár, I.; et al. Differing metabolic responses to salt stress in wheat-barley addition lines containing different 7H chromosomal fragments. PLoS ONE 2017, 12, e0174170. [Google Scholar] [CrossRef] [Green Version]
  7. Isayenkov, S.V.; Maathuis, F.J.M. Plant Salinity Stress: Many Unanswered Questions Remain. Front. Plant Sci. 2019, 10, 80. [Google Scholar] [CrossRef] [Green Version]
  8. Oshunsanya, S.O.; Aliku, O. Biochar Technology for Sustainable Organic Farming. Org. Farming-A Promis. Way Food Prod. 2016, 1, 111–129. [Google Scholar] [CrossRef] [Green Version]
  9. Khalilia, W.M. Assessment of Lead, Zinc and Cadmium Contamination in the Fruit of Palestinian Date Palm Cultivars Growing at Jericho Governorate. J. Biol. Agric. Health 2020, 10, 7–14. [Google Scholar] [CrossRef]
  10. Monreal, J.A.; Arias-Baldrich, C.; Tossi, V.; Feria, A.B.; Rubio-Casal, A.; García-Mata, C.; Lamattina, L.; García-Mauriño, S. Nitric oxide regulation of leaf phosphoenolpyruvate carboxylase-kinase activity: Implication in sorghum responses to salinity. Planta 2013, 238, 859–869. [Google Scholar] [CrossRef] [PubMed]
  11. Esmaili, E.; Kapourchal, S.; Malakouti, M.; Homaee, M. Interactive effect of salinity and two nitrogen fertilizers on growth and composition of sorghum. Plant Soil Environ. 2008, 54, 537–546. [Google Scholar] [CrossRef] [Green Version]
  12. Abu-Alnaeem, M.F.; Yusoff, I.; Ng, T.F.; Alias, Y.; Raksmey, M. Assessment of groundwater salinity and quality in Gaza coastal aquifer, Gaza Strip, Palestine: An integrated statistical, geostatistical and hydrogeochemical approaches study. Sci. Total. Environ. 2018, 615, 972–989. [Google Scholar] [CrossRef]
  13. Alkhouri, S. Soil Fertility in Jericho and Al-Auja, West Bank, Palestine. Soil Fertil. Jericho Al-Auja 2015. [Google Scholar] [CrossRef]
  14. Hu, Y.; Schmidhalter, U. Drought and salinity: A comparison of their effects on mineral nutrition of plants. J. Plant Nutr. Soil Sci. 2005, 168, 541–549. [Google Scholar] [CrossRef]
  15. Munns, R.; James, R.A.; Läuchli, A. Approaches to increasing the salt tolerance of wheat and other cereals. J. Exp. Bot. 2006, 57, 1025–1043. [Google Scholar] [CrossRef] [PubMed] [Green Version]
  16. Aguilera, E.; Díaz-Gaona, C.; García-Laureano, R.; Reyes-Palomo, C.; Guzmán, G.I.; Ortolani, L.; Sánchez-Rodríguez, M.; Rodríguez-Estévez, V. Agroecology for adaptation to climate change and resource depletion in the Mediterranean region. A review. Agric. Syst. 2020, 181, 102809. [Google Scholar] [CrossRef]
  17. Akram, M.S.; Cheema, M.A.; Waqas, M.; Bilal, M.; Saeed, M. Role of Bio-Fertilizers in Sustainable Agriculture. Mediterr. J. Basic Appl. Sci. 2020. [Google Scholar] [CrossRef]
  18. Mona, S.; Malyan, S.K.; Saini, N.; Deepak, B.; Pugazhendhi, A.; Kumar, S.S. Towards sustainable agriculture with carbon sequestration, and greenhouse gas mitigation using algal biochar. Chemosphere 2021, 275, 129856. [Google Scholar] [CrossRef]
  19. Malyan, S.K.; Kumar, S.S.; Fagodiya, R.K.; Ghosh, P.; Kumar, A.; Singh, R.; Singh, L. Biochar for environmental sustainability in the energy-water-agroecosystem nexus. Renew. Sustain. Energy Rev. 2021, 149, 111379. [Google Scholar] [CrossRef]
  20. Rehman, H.A.; Razzaq, R. Benefits of Biochar on the Agriculture and Environment—A Review. J. Environ. Anal. Chem. 2017, 4, 3–5. [Google Scholar] [CrossRef]
  21. Chew, J.; Zhu, L.; Nielsen, S.; Graber, E.; Mitchell, D.R.; Horvat, J.; Mohammed, M.; Liu, M.; Van Zwieten, L.; Donne, S.; et al. Biochar-based fertilizer: Supercharging root membrane potential and biomass yield of rice. Sci. Total Environ. 2020, 713, 136431. [Google Scholar] [CrossRef]
  22. Schreiber, C.; Behrendt, D.; Huber, G.; Pfaff, C.; Widzgowski, J.; Ackermann, B.; Müller, A.; Zachleder, V.; Moudříková, Š.; Mojzeš, P.; et al. Growth of algal biomass in laboratory and in large-scale algal photobioreactors in the temperate climate of western Germany. Bioresour. Technol. 2017, 234, 140–149. [Google Scholar] [CrossRef]
  23. Schreiber, C.; Schiedung, H.; Harrison, L.; Briese, C.; Ackermann, B.; Kant, J.; Schrey, S.D.; Hofmann, D.; Singh, D.; Ebenhöh, O.; et al. Evaluating potential of green alga Chlorella vulgaris to accumulate phosphorus and to fertilise nutrient-poor soil substrates for crop plants. J. Appl. Phycol. 2018, 30, 2827–2836. [Google Scholar] [CrossRef]
  24. Adamczyk, M.; Lasek, J.; Skawińska, A. CO2 Biofixation and Growth Kinetics of Chlorella vulgaris and Nannochloropsis gaditana. Appl. Biochem. Biotechnol. 2016, 179, 1248–1261. [Google Scholar] [CrossRef] [PubMed] [Green Version]
  25. Rumana, R. Fundamentals of Wastewater Treatment and Engineering Rumana Riffat; Taylor & Francis Group: London, UK, 2013; Volume 13. [Google Scholar]
  26. Easton, J. Nutrition and fertilizer. In Barley; Grains and Research & Development Corporation: Kingston, Australia, 2018. [Google Scholar]
  27. Australian Government. The Biology of Hordeum vulgare L. (barley). Off. Gene Technol. Regul. 2008, 44. Available online: https://www1.health.gov.au/internet/ogtr/publishing.nsf/Content/5DCF28AD2F3779C4CA257D4E001819B9/$File/Biology%20of%20Hordeum%20vulgare%20L.%20(barley)%20April%202017.pdf (accessed on 14 November 2021).
  28. Ghani, A.J.; Salamn, K.A. Barley from planting to harvest. In Public Authority for Agricultural Research; Iraq, Baghdad, 2011; Available online: https://agriculturresearch.blogspot.com/2013/05/blog-post.html (accessed on 14 November 2021).
  29. Hoagland, D.R.; Arnon, D.I. The Water-Culture Method for Growing Plants without Soil; California Agricultural Experiment Station, University of California: Berkeley, CA, USA, 1950; Volume 347. [Google Scholar]
  30. Nakhforoosh, A.; Bodewein, T.; Fiorani, F.; Bodner, G. Identification of Water Use Strategies at Early Growth Stages in Durum Wheat from Shoot Phenotyping and Physiological Measurements. Front. Plant Sci. 2016, 7, 1155. [Google Scholar] [CrossRef] [PubMed] [Green Version]
  31. Wu, G.Q.; Jiao, Q.; Shui, Q.Z. Effect of salinity on seed germination, seedling growth, and inorganic and organic solutes accumulation in sunflower (Helianthus annuus L.). Plant Soil Environ. 2016, 61, 220–226. [Google Scholar] [CrossRef] [Green Version]
  32. Lupini, A.; Araniti, F.; Mauceri, A.; Princi, M.; Di Iorio, A.; Sorgonà, A.; Abenavoli, M.R. Root morphology. In Advances in Plant Ecophysiology Techniques; Springer: Berlin/Heidelberg, Germany, 2018; pp. 15–28. [Google Scholar] [CrossRef]
  33. Vysotskaya, L.; Hedley, P.E.; Sharipova, G.; Veselov, D.; Kudoyarova, G.; Morris, J.; Jones, H.G. Effect of salinity on water relations of wild barley plants differing in salt tolerance. AoB Plants 2010, 2010, plq006. [Google Scholar] [CrossRef]
  34. Shrivastava, P.; Kumar, R. Soil salinity: A serious environmental issue and plant growth promoting bacteria as one of the tools for its alleviation. Saudi J. Biol. Sci. 2014, 22, 123–131. [Google Scholar] [CrossRef] [Green Version]
  35. Warrence, B.N.J.; Bauder, J.W.; Pearson, K.E. Basics of Salinity and Sodicity Effects on Soil Physical Properties; Departement of Land Resources and Environmental Sciences, Montana State University: Bozeman, MT, USA, 2002; Volume 129, pp. 1–29. [Google Scholar]
  36. Rajakumar, J.; Sankar. Biochar for Sustainable Agriculture. Biochar Sustain. Agric. Rev. 2016, 211–224. [Google Scholar] [CrossRef]
  37. Downie, A.C. Biochar for Environmental Management: Science and Technology; Earthscan in the UK and USA, 2015. [Google Scholar] [CrossRef]
  38. Liao, W.; Thomas, S.C. Biochar Particle Size and Post-Pyrolysis Mechanical Processing Affect Soil pH, Water Retention Capacity, and Plant Performance. Soil Syst. 2019, 3, 14. [Google Scholar] [CrossRef] [Green Version]
  39. Mao, J.; Zhang, K.; Chen, B. Linking hydrophobicity of biochar to the water repellency and water holding capacity of biochar-amended soil. Environ. Pollut. 2019, 253, 779–789. [Google Scholar] [CrossRef]
  40. Hamudan, N. Einfluss Verschiedener Biokohlen als Bodenzuschlagstoff auf Physikochemische Eigenschaften von Böden. Bachelor’s Thesis, Fachhochschule Aachen, Campus Jülich, Jülich, Germany, 2019. [Google Scholar]
  41. Fischer, D.; Glaser, B. Synergisms between Compost and Biochar for Sustainable Soil Amelioration. Manag. Org. Waste 2012. [Google Scholar] [CrossRef] [Green Version]
  42. Maguire, R.O.; Agblevor, F.A. Biochar in Agricultural Systems What Is Biochar and How Is It Will Biochar Always Increase Soil Feedstock Material for Biochar; Virginia Cooperative Extension: Blacksburg, VA, USA, 2010; pp. 1–2. [Google Scholar]
  43. Bertola, M.; Mattarozzi, M.; Sanangelantoni, A.M.; Careri, M.; Visioli, G. PGPB Colonizing Three-Year Biochar-Amended Soil: Towards Biochar-Mediated Biofertilization. J. Soil Sci. Plant Nutr. 2019, 19, 841–850. [Google Scholar] [CrossRef]
  44. Sánchez-Monedero, M.A.; Cayuela, M.L.; Sánchez-García, M.; Vandecasteele, B.; D’Hose, T.; López, G.; Martínez-Gaitán, C.; Kuikman, P.J.; Sinicco, T.; Mondini, C. Agronomic Evaluation of Biochar, Compost and Biochar-Blended Compost across Different Cropping Systems: Perspective from the European. Agronomy 2019, 9, 225. [Google Scholar] [CrossRef] [Green Version]
  45. Palanisamy, M.; Mukund, S.; Sivakumar, U.; Karthikeyan; Sivasubramanian, V. Bio-char production from micro algal biomass of Chlorella vulgaris. Phykos 2017, 47, 99–104. [Google Scholar]
  46. Sameer, A.G.; Alqam, H.N.; Abu-Warda, W.A.; Al-Tardeh, S.M.; Kuhn, A.J.; Kuchendorf, C.M. Effects of Salinity Stress on Palestinian Barley Cultivars During Seed Germination and Growth Stages. Bachelor’s Thesis, Palestine Polytechnic University, Hebron, Palestine, 2021. [Google Scholar]
Figure 1. Soil sampling locations (T: top soil sample, B: bottom soil sample, R: rhizosphere soil sample).
Agronomy 11 02309 g001
Figure 2. The effects of salinity stress and fertilizer types on five measured plant parameters during the early growth stage (7 weeks) for Rehan barley cultivar (MIN: mineral fertilization, BIO: biochar with mineral fertilization, ALG: dried algae biomass powder from freshwater (0, 4, 8, 16 mS/cm EC: the salinity concentrations in soil). No. = number, Avg. = average. The mean value and standard deviation are shown.
Agronomy 11 02309 g002
Figure 3. The effects of salinity stress and fertilizer types on leaf area and root area during the early growth stage (7 weeks) for Rehan barley cultivar (MIN: mineral fertilization, BIO: biochar with mineral fertilization, ALG: dried algae biomass powder from freshwater (0, 4, 8, 16 mS/cm EC are the salinity concentrations in soil). The mean value and standard deviation are shown.
Agronomy 11 02309 g003
Figure 4. The effects of salinity stress and fertilizer types on root length during the early growth stage (7 weeks) for Rehan barley cultivar (MIN: mineral fertilization, BIO: biochar with mineral fertilization, ALG: dried algae biomass powder from freshwater, 0, 4, 8, 16 mS/cm EC are the salinity concentrations in soil). The mean value and standard deviation are shown.
Agronomy 11 02309 g004
Figure 5. Average leaf area (pixels, px) and growth dynamics of Rehan under three fertilizers and four salinity levels analyzed by ScreenHouse system [30] (MIN: mineral fertilization, BIO: biochar with mineral fertilization, AlG: dried algae biomass powder from freshwater (0, 1, 2, 3: 0, 4, 8, 16 mS/cm EC, respectively). x-axis: measurement day during the growth period.
Agronomy 11 02309 g005
Figure 6. The effects of salinity stress and fertilizer types on soil parameters during the early growth stage (7 weeks) for Rehan barley cultivar. MIN: mineral fertilization, BIO: biochar with mineral fertilization, ALG: dried algae biomass powder from freshwater; 0, 4, 8, 16 mS/cm EC are the salinity concentrations in soil. EC = electric conductivity, TN = total nitrogen (mg/kg), P = phosphate (mg/kg), T = top soil sample, B = bottom soil sample, R = rhizosphere soil sample, mix = mixed soil sample. The mean value and standard deviation are shown. The data have been arranged to put as many parameters as possible on a readable scale. To provide an option for different sorting, the data are also available in Supplementary Material (Table S3). Subfigures (ad): (a). The effects of salinity stress and fertilizer types on soil water content (%), pH for mixed sample, pH for top soil sample, total nitrogen (TN) concentration (µg N/g soil (mg/kg) for top soil sample, pH for bottom soil sample, and pH for rhizosphere soil sample during the early growth stage (7 weeks) for Rehan barley cultivar. (b). The effects of salinity stress and fertilizer types at harvest on EC (µS/cm) for mixed samples, EC (µS/cm) for bottom soil samples, and phosphate (P) concentration (µg PO3−2/g soil mg/kg) for bottom soil samples during the early growth stage (7 weeks) for Rehan barley cultivar. (c). The effects of salinity stress and fertilizer types on total nitrogen (TN) (µg N/g soil (mg/kg) for mixed samples and phosphate (P) concentration (µg PO3−2/g soil mg/kg) for mixed samples, EC (µS/cm)for top soil sample, total nitrogen (TN) concentration (µg N/g soil (mg/kg) for bottom soil sample, and total nitrogen (TN) concentration (µg PO3−2/g soil mg/kg) for rhizosphere soil sample during the early growth stage (7 weeks) for Rehan barley cultivar. (d). The effects of salinity stress and fertilizer types on phosphate (P) concentration (µg PO3−2/g soil mg/kg) for top soil sample, EC (µS/cm) for rhizosphere soil sample, and phosphate (P) concentration (µg PO3−2/g soil mg/kg) for rhizosphere soil sample during the early growth stage (7 weeks) for Rehan barley cultivar.
Agronomy 11 02309 g006
Table 1. Summary of the experimental design of pots.
Section No.Fertilizers UsedUsed PlantHarvesting DifferencesComments
2.3.3 Comparative effects of the fertilizersBiochar, mineral fertilizer (Hoagland solution), dried algae (Chlorella from greenhouse cultivation) SoMi (full nutrient soil)Rehan Palestinian barley cultivarThree Soil samples for each pot (T, B, R)Automated system for shoot imaging and analysis
2.3.4 Biofertilizer (dried algae harvested from freshwater)Dried algae (Chlorella from greenhouse cultivation)Rehan Palestinian barley cultivar+ wheat (Triticum aestivum L. ssp. scirocco)Three soil samples for each pot (T, B, R)Target: effect differences of algae biomass for wheat and barley
2.3.5 Comparison of biochar and dried algae fertilizing wheat and barley ‘Rehan cultivar’Biochar +dried AlgaeRehan Palestinian barley cultivar+ wheat (Triticum aestivum L. ssp. scirocco)Three Soil samples for each pot (T, B, R)Target: synergic effect of both biochar and dried algae together.
Table 2. Comparative effects of biochar alone and biochar with minerals on Rehan cultivar during the early growth stage (7 weeks). No. = number, Avg. = average, EC = electric conductivity (µS/cm), TN = total nitrogen (mg/kg), P = phosphorus (mg/kg), mix = mixed soil sample, sig. = significance of the test.
Fertilizer typeBiochar + MineralsBiochar AloneSig.
Plant Parameters
No. of tillers9.17 ± 3.431.00 ± 0.000.000a
No. of ears4.67 ± 1.210.67 ± 0.520.003b
Leaf area (cm2)275.5 ± 157.987.78 ± 0.780.009a
Shoot dry weight (g)7.23 ± 1.410.05 ± 0.020.000a
Root dry weight (g)2.76 ± 2.860.06 ± 0.040.044a
Shoot/root dry weight11.36 ± 16.321.25 ± 1.050.055b
Root length (cm)5496.62 ± 341.37277.03 ± 38.430.000a
Root area (cm2)1149.49 ± 83.7021.20 ± 2.640.000a
Avg. diameter (mm)0.33 ± 0.000.24 ± 0.010.003b
Soil Parameters
Soil water content (%)9.67 ± 2.778.34 ± 3.110.450b
pH for mix7.18 ±.147.93 ± 0.030.000b
EC (µS/cm) for mix1308.33 ± 726.2275.77 ± 1.090.009b
TN (total N in soil in µg/g soil (mg/kg)for mix157.85 ± 32.078.91 ± 1.940.000b
P(PO3−2 in soil in µg/g soil (mg/kg) for mix13.58 ± 3.993.21 ± 0.640.001b
Note: p-values are displayed in bold script when p ≤ 0.05. Different letters in significance column indicate (a) independent sample t-test, (b) Mann–Whitney U Test. Values in categories column represent mean ± standard deviation.
Table 3. The effect of dried algae biomass on the early growth stage (7 weeks) of wheat and barley biomass (7 weeks). No. = number, Avg. = average, TN = total nitrogen, P = phosphorus, T = top soil sample, B = bottom soil sample, R = rhizosphere soil sample, mix = mixed soil sample sig. = significance of the test.
WheatBarleySig.
Plant Parameters
No. of tillers4.83 ± 1.456.83 ± 3.500.02b
No. of ears0.17 ± 0.300.17 ± 0.301.00b
Leaf area (cm2)248.33 ± 99.70577.40 ± 314.110.002a
Shoot dry weight (g)1.69 ± 0.632.62 ± 1.490.062a
Root dry weight (g)0.26 ± 0.070.61 ± 0.380.01b
Shoot/root dry weight6.90 ± 2.594.53 ± 0.930.00b
Root length (cm)1819.95 ± 719.412151.95 ± 1098.660.77b
Root area (cm2)224.52 ±88.79956.16 ± 600.820.01b
Avg. diameter (mm)0.40 ± 0.030.50 ± 0.080.00b
Soil Parameters
Soil water content (%)12.61 ± 1.678.45 ± 4.890.02b
pH for mix6.93 ± 0.047.01 ± 0.060.00b
TN for mix (total N in soil in µg/g soil (mg/kg))37.31 ± 7.6821.65 ± 4.510.000a
P for mix (PO3−2 in soil in µg/g soil (mg/kg))3.96 ± 1.653.15 ± 0.480.82b
pH for T6.97 ± 0.097.14 ± 0.080.000a
TN for T (total N in soil in µg/g soil (mg/kg))33.00 ± 13.0136.72 ± 3.560.56b
P for T (PO3−2 in soil in µg/g soil (mg/kg))5.39 ± 2.965.13 ± 1.910.42b
pH for B6.82 ± 0.087.00 ± 0.100.00b
TN for B (total N in soil in µg/g soil (mg/kg))60.56 ± 6.2434.26 ± 10.000.00b
P for B (PO3−2 in soil in µg/g soil (mg/kg))4.57 ± 3.373.41 ± 2.200.331a
pH for R6.89 ± 0.107.12 ± 0.120.00b
TN for R (total N in soil in µg/g soil (mg/kg))45.94 ± 12.1526.17 ± 12.870.02b
P for R (PO3−2 in soil in µg/g soil (mg/kg))4.95 ± 3.313.28 ± 1.370.121a
Note: p-values are displayed in bold script when p ≤ 0.05. Different letters in significant column indicate (a) independent sample t-test, (b) Mann–Whitney U Test. Values in categories column represent mean ± standard deviation.
Table 4. The synergic effect of biochar and dried algae biomass on early growth stage (7 weeks) of wheat and barley.
FertilizerAlgae + BiocharSig.
Plant TypeWheatBarley
Plant Parameters
No. of tillers3.67 ± 0.731.67 ± 0.730.001a
No. of ears0.00 ± 0.000.00 ± 0.00-
Leaf area (cm2)106.21 ± 48.1276.20 ± 66.350.393a
Shoot dry weight (g)0.57 ± 0.280.47 ± 0.430.642a
Root dry weight (g)0.23 ± 0.030.07 ± 0.050.000a
Shoot/root dry weight2.37 ± 0.904.30 ± 2.380.110a
Root length (cm)757.54 ± 126.47654.10 ± 559.820.676a
Root area (cm2)102.04 ± 20.1889.73 ± 78.690.724a
Avg. diameter (mm)0.43 ± 0.030.37 ± 0.070.103b
Soil Parameters
Soil water content (%)16.89 ± 0.5418.21 ± 0.720.006a
pH for mix7.54 ± 0.037.54 ± 0.081.000a
TN for mix (total N in soil in µg/g soil (mg/kg))39.13 ± 5.5437.01 ± 3.130.439a
P for mix (PO3−2 in soil in µg/g soil (mg/kg))5.55 ± 0.705.94 ± 2.120.685a
pH for T7.69 ± 0.028.06 ± 0.320.037a
TN for T (total N in soil in µg/g soil (mg/kg))27.38 ± 15.3922.82 ± 12.130.582a
P for T (PO3−2 in soil in µg/g soil (mg/kg))7.16 ± 1.518.99 ± 1.920.098a
pH for B7.69 ± 0.107.94 ± 0.130.117a
TN for B (total N in soil in µg/g soil (mg/kg))49.82 ± 16.3846.82 ± 11.180.719a
P for B (PO3−2 in soil in µg/g soil (mg/kg))4.46 ± 0.066.74 ± 0.390.000a
pH for R7.75 ± 0.047.85 ± 0.150.168a
TN for R (total N in soil in µg/g soil (mg/kg))55.76 ± 18.7540.22 ± 8.880.108a
P for R (PO3−2 in soil in µg/g soil (mg/kg))7.09 ± 1.707.68 ± 0.380.439a
Note: p-values are displayed in bold script when p ≤ 0.05. Different letters in significant column indicate (a) independent sample t-test, (b) Mann–Whitney U Test. Values in categories column represent mean ± standard deviation.
Publisher’s Note: MDPI stays neutral with regard to jurisdictional claims in published maps and institutional affiliations.

