Article

Effects of Phosphorus Supply on the Leaf Photosynthesis, and Biomass and Phosphorus Accumulation and Partitioning of Canola (Brassica napus L.) in Saline Environment

1
Jiangsu Key Laboratory of Crop Genetics and Physiology, Yangzhou University, Yangzhou 225009, China
2
Jiangsu Co-Innovation Center for Modern Production Technology of Grain Crops, Yangzhou University, Yangzhou 225009, China
*
Author to whom correspondence should be addressed.
Agronomy 2021, 11(10), 1918; https://doi.org/10.3390/agronomy11101918
Submission received: 13 September 2021 / Revised: 17 September 2021 / Accepted: 17 September 2021 / Published: 24 September 2021
(This article belongs to the Special Issue Improving Mineral Nutrition to Obtain Stress Tolerant Crops)

Abstract

:
Salt stress is a major negative factor affecting the sustainable development of agriculture. Phosphorus (P) deficiency often occurs in saline soil, and their interaction inhibits plant growth and seed yield for canola (Brassica napus L.). P supply is considered an effective way to alleviate the damage of salt stress. However, the knowledge of how P supply can promote plant growth in saline environment was limited. A field experiment was conducted to explore the effects of P rate on accumulation, and partitioning, of biomass and P, leaf photosynthesis traits, and yield performance in saline soil in the coastal area of Yancheng City, Jiangsu Province, China, during the 2018–2019 and 2019–2020 growing seasons. P supply increased biomass and P accumulation in all organs, and root had the most increments among different organs. At flowering stage, P supply increased the biomass and P partitioning in root and leaf, but it decreased the partitioning in stem. At maturity stage, P supply facilitated the biomass and P partitioning in seed, but it decreased the partitioning in stem and shell, and it increased the reproductive-vegetative ratio, suggesting that P supply can improve the nutrients transporting from vegetative organs to reproductive organs. Besides, P supply improved the leaf area index and photosynthetic rate at the flowering stage. As a result, the seed yield and oil yield were increased. In conclusion, P supply can improve the canola plant growth and seed yield in a saline environment. P fertilizer at the rate of 120 kg P2O5 ha−1 was recommended in this saline soil.

1. Introduction

Canola (Brassica napus L.) is an important oil crop, providing rich edible oil for human consumption and a source of protein for animal feed [1]. As one of the largest canola producers, China accounts for more than 20% of the total planting area around the world [2]. Most of its planting area, located in the Yangtze River mid- and low-basin, was estimated at 7 million hectares [3]. In China, canola seed offers about 50% of domestic vegetable oil. Ensuring the sustainable development of canola production is of great significance for the domestic edible oil market.
Salt stress is a negative factor limiting plant growth and crop yield. It is estimated that about 1.5 billion hectares of irrigated land, and 1–2% of arid land, are becoming unsuitable for cultivation due to being salinized [4]. If the salinization continually proceeds in this trend by 2050, 50% of the arable land around the world will be salinized [5]. Soil salinization has become a severe problem impeding the sustainable development of agriculture in the future. The damages induced by salt stress to plants often occur in two ways: inhibits the capacity of root to absorb water from soil, due to osmotic stress induced by high salt ion concentration in soil; then, disrupts the bio-physiological processes, such as nutrient uptake and transport, photosynthesis, and reactive oxygen species balance [6,7,8]. Finally, these detrimental effects of salt stress results in reduced crop yield. Under the background of dramatic human population growth, reduced crop yield due to salinity has been a great challenge of meeting the food needs for such a large population.
Fertilizer management is considered an effective strategy to alleviate the adverse influences of salt stress, mainly in terms of improving nitrogen (N), phosphorus (P), and potassium (K) availability in soils. In the previous studies about fertilizer management in saline soil, attention was mainly focused on N fertilizer [9,10]. However, according to our field study and previous reports, compared with N, P deficiency was more common in saline soil. P is an important factor affecting plants growth and is involved in many physiological processes including photosynthesis, energy transfer, and synthesis of antioxidants [11]. Unfortunately, P deficiency often occurs with salt stress in a natural environment [12]. Plants grown in saline soil are usually subjected to combined effects of salt stress and P deficiency, and P deficiency can increase the severity of salt stress. Although the total P content is not deficient for plant nutrient requirements, the available P concentration was reduced due to P fixation in saline soil characterized by alkaline and a calcareous nature [13,14]. For example, P is largely adsorbed in the surface of Na and Ca to form the P-Na and P-Ca precipitation [15]. Moreover, salinity affects the activity and diversity of soil microbes, where the microbes responsible for P mobilizing can be suppressed by salinity [16]. Therefore, the available P in saline soil was limited for the nutrient requirement of plants.
Canola plants are extremely sensitive to P deficiency under both non-saline and saline environments. P is always seen as an important nutritional factor associated with plant root growth. The lack of available P in soil can inhibit root growth and prevent plants from absorbing nutrient through root systems [17,18]. The performance of aboveground development is closely related to root growth. Leaf, as the main photosynthetic organ during the reproductive growth stage of canola, is an important contributor to ultimate yield. P deficiency limits leaf photosynthetic rate, which leads to reduced CO2 fixation and biomass accumulation [19]. Furthermore, P deficiency results in canola plants with few primary branches [20]. All these negative effects together lead to the decreased seed yield. However, several studies showed that adding P fertilizer to saline soil can improve plant growth and strengthen salinity tolerance. For example, the addition of P fertilizer to saline soil improved root growth in sugar beet (Beta vulgaris L.) [21]; increasing P fertilizer supply can improve photosynthetic performance in Catapodium rigidum, resulting in more CO2 assimilation and more salinity tolerance [22]. These improvements, conferred by P fertilizer supply under a saline environment in the aforementioned plants, might suggest the same positive effects exist in canola.
Manipulation of accumulation, and partitioning of biomass and nutrients through fertilizer management, plays an important role in plant growth and yield formation [23]. Previous studies revealed that salt stress prevented nutrients transporting from vegetative organs to reproductive organs and, therefore, resulted in decreased seed yield in canola [24]. In non-saline environments, P supply was demonstrated to improve biomass accumulation, increase P distribution in seeds, and increase seed yield [25]. However, there was little information available for how P supply can optimize nutrient and biomass partitioning, in different organs, to improve plant growth and seed yield in a saline environment.
In this study, to improve the knowledge of the effects of P supply on the growth of canola plants in a saline environment, a field experiment was conducted to study the effects of P supply on biomass, P accumulation and partitioning in different organs, leaf growth, photosynthesis, and yield performance. We hypothesize that an appropriate P supply in saline soil might improve the plant growth and seed yield of canola plants through optimized biomass, P accumulation, and partitioning. We hope this study can provide strategies for sustainable development of canola production in saline environments.

2. Materials and Methods

2.1. Plant Materials, Site, Soil Properties and Experimental Set

This field experiment was conducted in the experimental field of Jiangsu Golden Agriculture Shareholding Co., Ltd., Xuzhou, China (33°24′ N, 120°35′ E) during 2018–2019 and 2019–2020 growing seasons. Ningza 1838 (cultivated by Jiangsu Academy of Agricultural Sciences, Nanjing, China), widely grown in Jiangsu province and with high seed yield, was used in this experiment. Soils of the experimental field were sampled before sowing every year to determine the soil nutrients, soil salt ions concentrations, and soil pH. The properties of experimental soil of the plough layer (0–20 cm) were presented in (Table 1). The saline soil in this study, with pH ranging from 8.06 to 8.13, was classified as alkaline soil [26]. The Na+ and Ca2+ concentration exceeded other cations, suggesting that P-Na and P-Ca precipitations were the main reason for low P availability [15].
This field experiment was arranged with a randomized block design with one factor, in three replicates. The plot size was 60 × 2 m2 (length ⅹ width). The factor was P rate (as ammonium phosphate) including six levels (0 (CK), 30, 60, 90, 120, and 150 kg P2O5 ha−1). In addition, N was supplemented as urea (46% N) to a rate of 270 kg N ha1, and K and B fertilizers as potassium sulphate (52% K2O) and borax (12% B) were applied to all plots at the rates of 75 kg K2O ha−1 and 4.5 kg B ha−1, respectively. N fertilizer was applied at the ratio of basal, seedling and bolting fertilizer (5-2-3). P, K, and B fertilizer were applied as basal fertilizer before sowing.
The seeds were manually sown on 12th October in 2018 and 2019, and seedling density was thinned to 45 × 104 plants ha−1 at fourth-leaf and fifth-leaf growth stages for all plots. Pest and weed management was performed in conformity with local recommendations.

2.2. Assessment of Seed Yield Performance and Seed Oil Content

When approximately 90% of pods were yellow, 6 m2 (3 × 2 m2) were harvested for each plot, then dried and threshed to measure the seed yield.
In addition, ten plants were sampled to measure the yield components. The number of primary branches per plant, the number of pods per plant, and 1000-seed weight were counted or measured. The number of seeds per pod was converted by seed yield per plant, the number of pods per plant, and 1000-seed weight.
The seed oil concentration was measured by Near Infrared Spectroscopy (NIRSystem 5000, FOSS Analytical A/S, Hillerod, Denmark). The oil yield was calculated by multiplying the seed oil concentration by seed yield.

2.3. Assessment of Biomass and P Accumulation

Ten canola plants were sampled from each plot at flowering stage and maturity stage. At flowering stage, the plants were separated into root, stem, and leaf. At maturity stage, the plants were separated into root, stem, shell, and seed. All organs at different growth stages were dried at 85 °C and weighed. The P concentrations of different organs were measured using the elemental analyzer (Vario MAX CN, Elementar Co., Langenselbold, Germany). The P accumulation amount of specific organs was calculated by multiplying the dry weight by the P concentration of this organ.

2.4. Assessment of Biomass and P Partitioning

The biomass partitioning in specific organs at different growth stages was calculated by dividing the biomass accumulation amount of a specific organ by whole plant biomass accumulation amount. The P partitioning in a specific organ was calculated by dividing the P accumulation amount of a specific organ by the whole plant P accumulation amount.

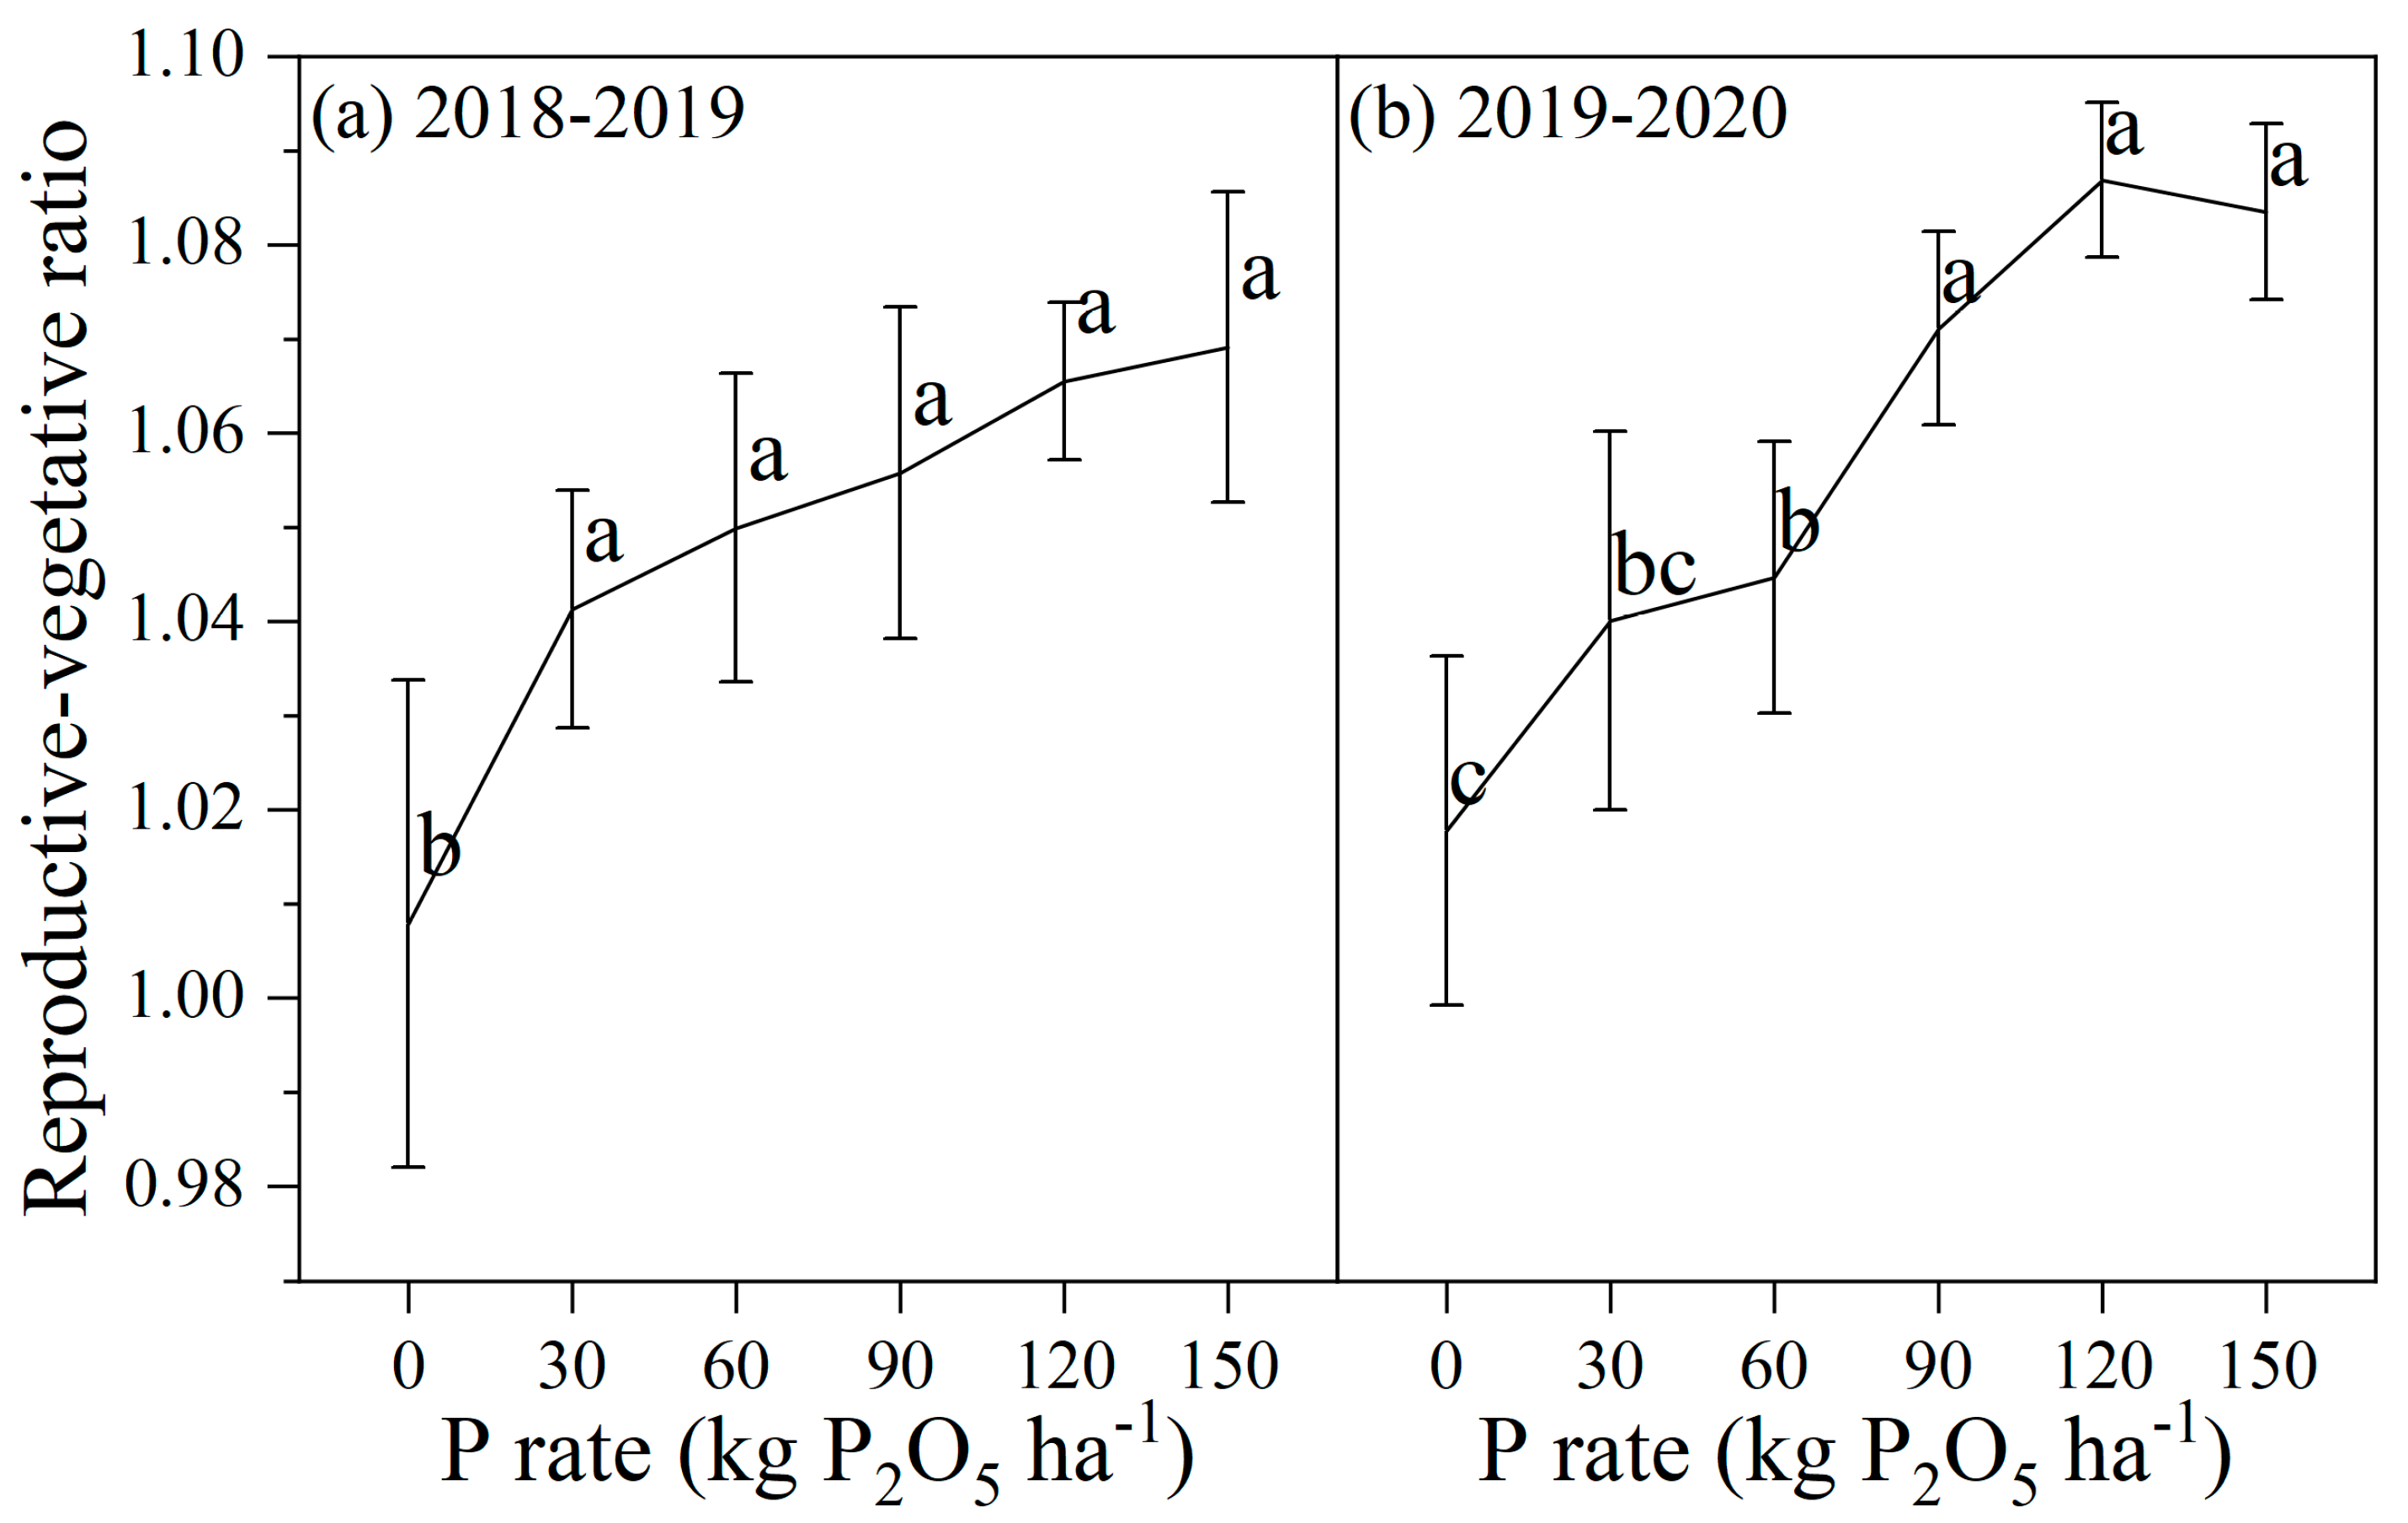
2.5. Assessment of the Reproductive-Vegetative Ratio

The reproductive to vegetative ratio was calculated by dividing the sum dry weight of shell and seed by the sum dry weight of root and stem at the maturity stage. The formula was as below
The   reproductive   to   vegetative   ratio = s h e l l   d r y   w e i g h t + s e e d   d r y   w e i g h t r o o t   d r y   w e i g h t + s t e m   d r y   w e i g h t

2.6. Assessment of Leaf Area Index and Photosynthetic Rate

Ten canola plants were sampled from each plot at flowering stage. The leaf area was measured. The formula of leaf area index was as below
Leaf   area   index = l e a f   a r e a   p e r   p l a n t × d e n s i t y p l a n t i n g   a r e a
Photosynthetic rate was measured at flowering stage using a portable photosynthetic system (LI-COR, Lincoln, NE, USA). The data was obtained from the second and third top leaf from 09:00 to 11:00 on sunny days.

2.7. Statistical Analysis

The analysis of variance (ANOVA) and correlation were performed with SPSS statistical 20 software (SPSS Inc., Chicago, IL, USA), and means were compared by Duncan’s multiple range test at the p = 0.05 level. Graphs were prepared using Origin 9.0 software (Origin Lab Corp, Northampton, MA, USA).

3. Results

3.1. Seed and Oil Yield Performance

The results of ANOVA showed that P rate and experimental year affected seed yield, seed oil concentration, oil yield, and most seed yield components except 1000-seed weight; in addition, P rate affected the number of primary branches per plant; the interaction between P rate and the experimental year did not affect any parameters in (Table 2).
P supply improved the number of primary branches per plant and seed yield. As compared with CK, the treatment of 120 kg P2O5 ha−1 increased the number of primary branches per plant and seed yield by 50.27% and 71.69% in the 2018–2019 growing season, 56.18% and 67.54% in the 2019–2020 growing season, respectively. Similarly, the seed oil concentration and oil yield were increased by 6.20% and 82.39% in the 2018–2019 growing season and 6.33% and 78.18% in the 2019–2020 growing season, respectively, with the P rate increasing from 0 to 120 kg P2O5 ha−1. These improvements, under the treatment of 120 kg P2O5 ha−1, were comparable with these under the treatment of 150 kg P2O5 ha−1.
Regarding components of seed yield, P supply increased the number of pods per plant (76.83–120.17) and the number of seeds per pod (12.9–17.7). More specifically, the treatment of 120 kg P2O5 ha−1 increased the number of pods per plant by 51.02% and 54.72% in both growing seasons, respectively, as compared with CK. The number of seeds per pod, under the treatments of 90, 120, and 150 kg P2O5 ha−1, were significantly higher than these under other treatments. The positive effects of P rate on these parameters were not significantly different between 120 and 150 kg P2O5 ha−1 treatments. However, 1000-seed weight was not affected by P rate, experimental year, and their interaction.

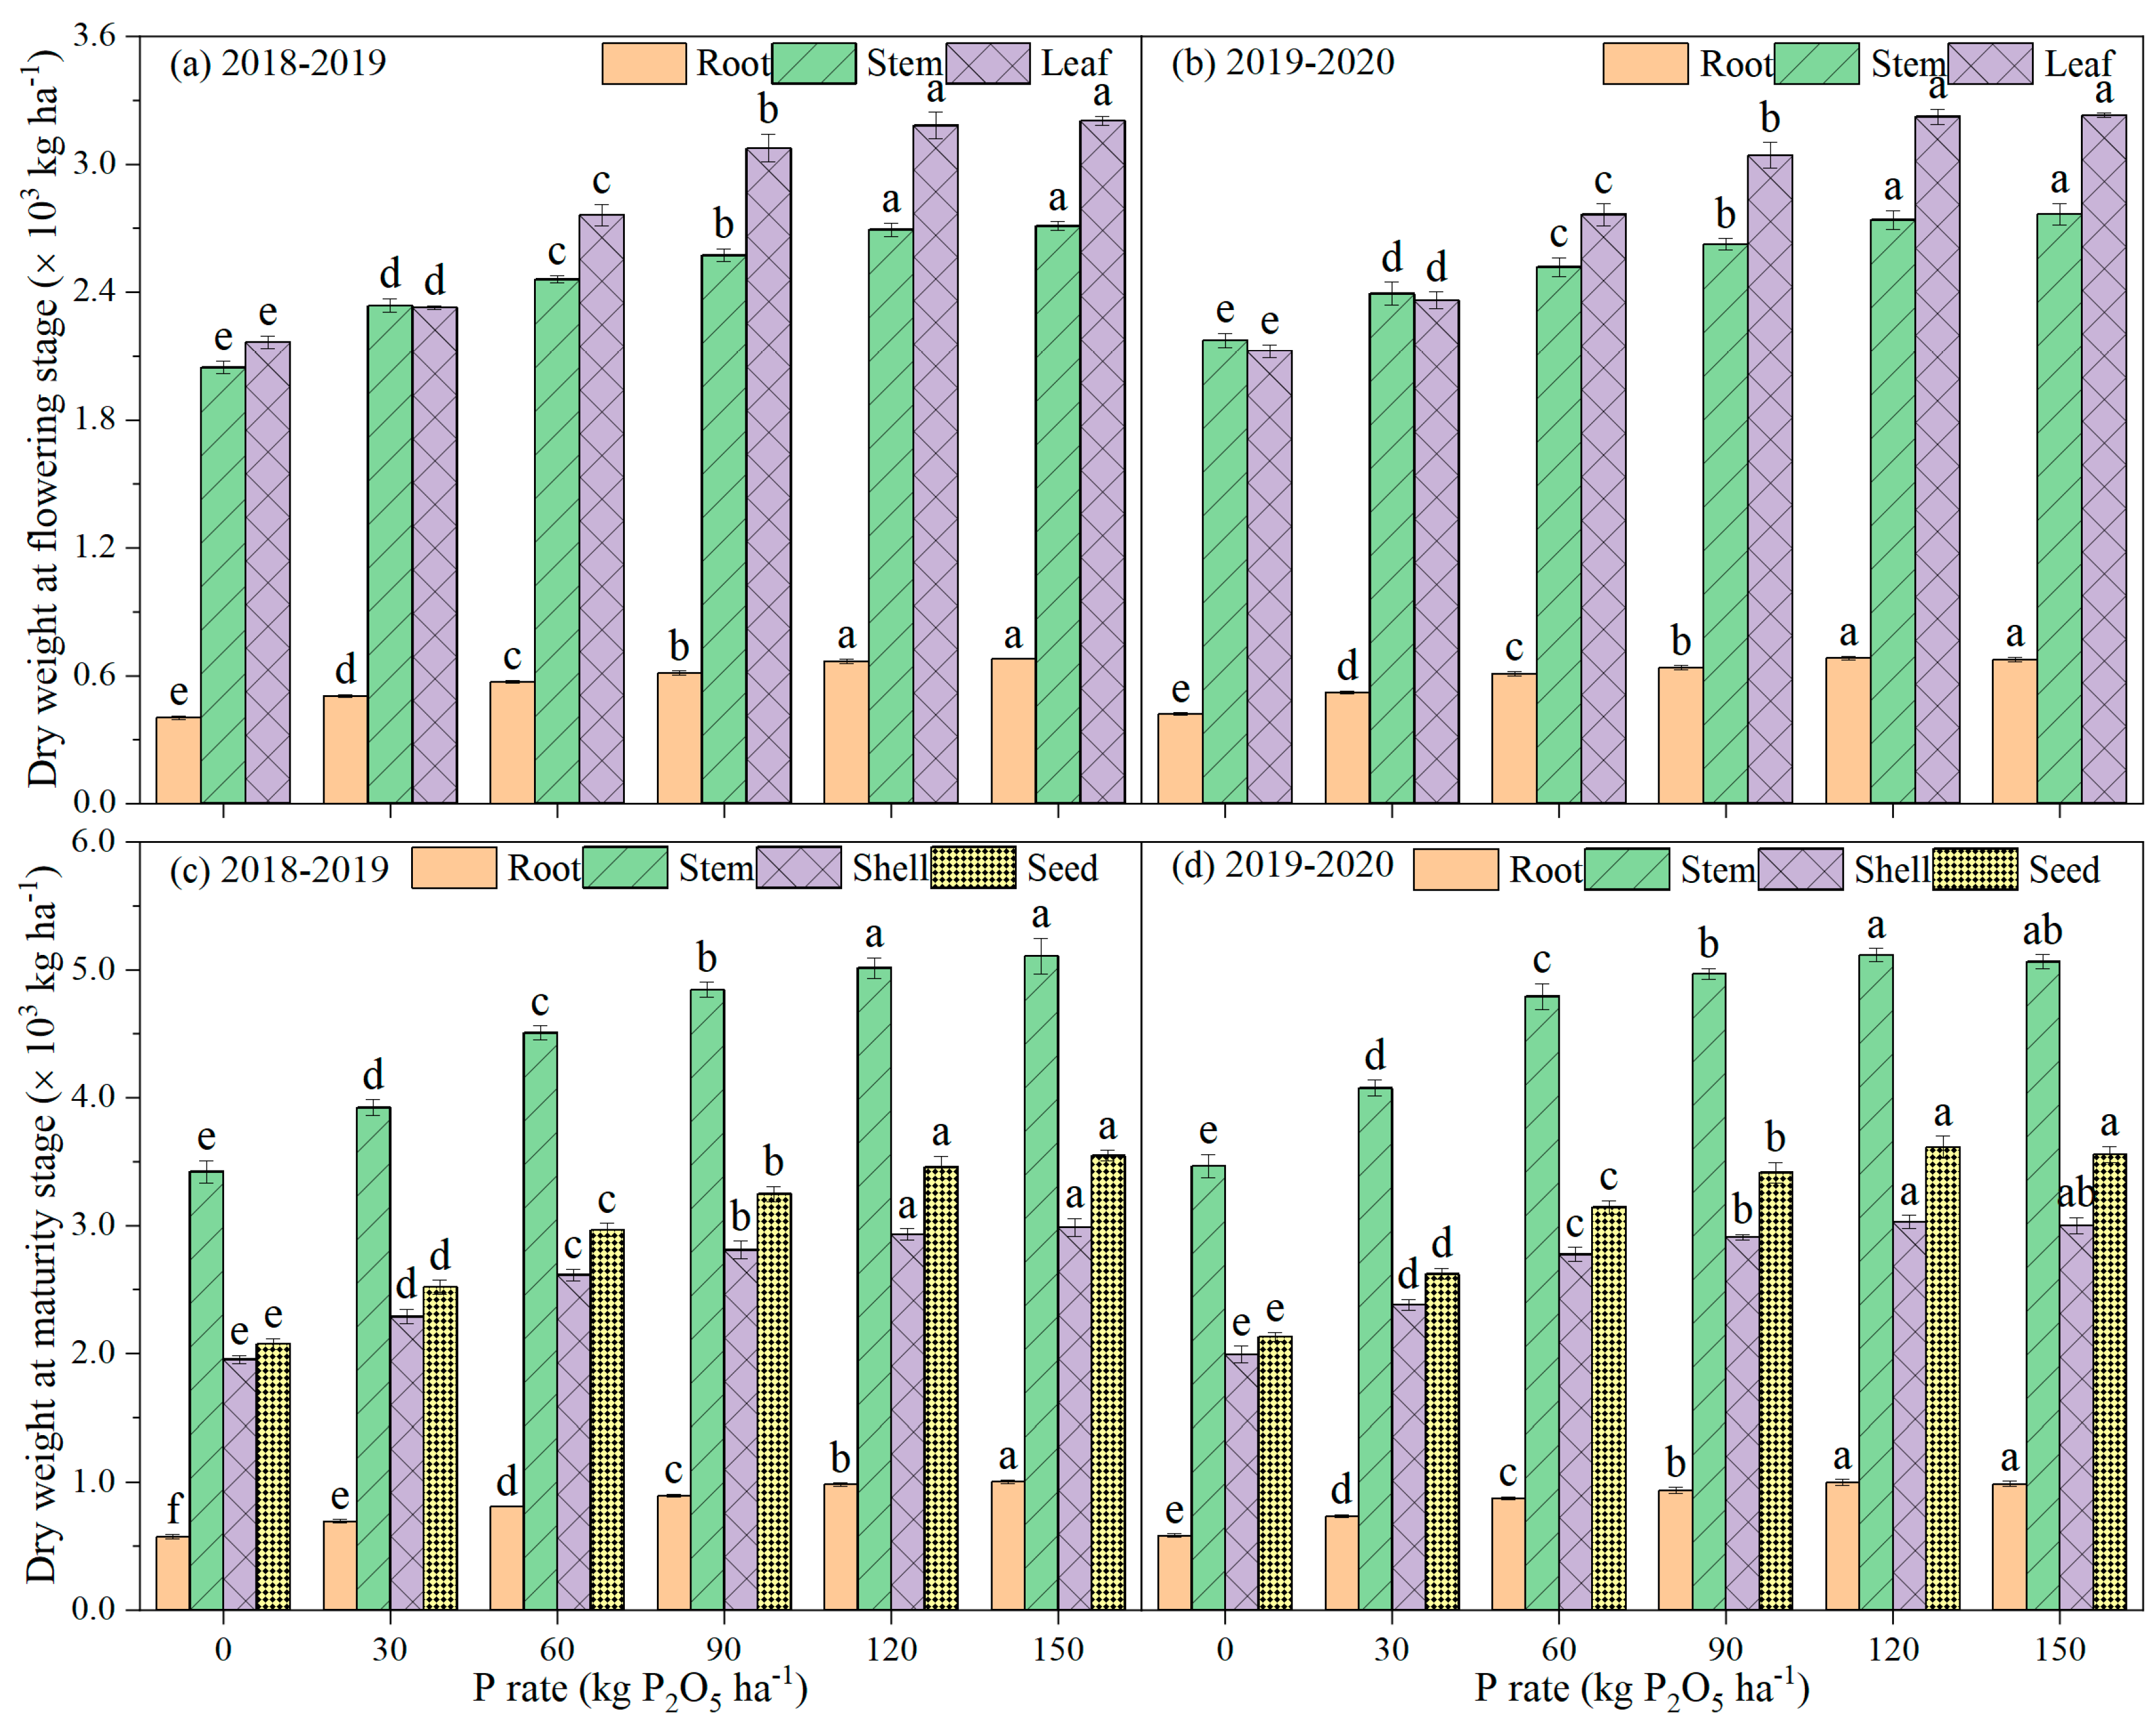
3.2. Biomass and P Accumulation

The results of ANOVA showed that P rate affected the biomass and P accumulation in different plant organs at all growth stages (Table 3).
As P rate increased, the biomass accumulation in different organs significantly increased (Figure 1). For example, at flowering stage, as compared with CK, the treatment of 120 kg P2O5 ha−1 increased the biomass accumulations of root, stem, and leaf by, on average, 63.77%, 28.83%, and 49.39% over two growing seasons. At maturity stage, these increments in the biomass accumulations, under the 120 kg P2O5 ha−1, treatment were, on average, 71.05% for root, 47.03% for stem, 51.11% for shell, and 68.24% for seed, respectively.
Similar with biomass accumulation, P supply enhanced the P accumulation in different organs at all growth stages (Figure 2). At flowering stage, as compared with CK, the treatment of 120 kg P2O5 ha−1 averagely increased the P accumulation of root, stem, and leaf by 134.95%, 72.32%, and 98.77% over two growing seasons. At maturity stage, the P accumulations of root and stem were lower than those at flowering stage. The P accumulation under 120 P2O5 kg ha−1 treatment were increased, on average, by 144.39% for root, 156.20% for stem, 102.07% for shell, and 159.88% for seed over two growing seasons, as compared with CK.
It was observed that these increments of biomass and P accumulation, under 120 kg P2O5 ha−1, treatment were significantly greater than these under 30, 60, and 90 kg P2O5 ha−1 treatments but comparable with these under 150 kg P2O5 ha−1 treatment, suggesting that 120 kg P2O5 ha−1 was the most proper rate for biomass and P accumulation of canola plants.

3.3. Biomass and P Partitioning, and the Reproductive-Vegetative Ratio

The results of ANOVA indicated that P rate affected biomass and P partitioning in different organs at most growth stages, except P partitioning in root at the maturity stage; experiment year only affected the biomass partitioning in stem at maturity stage; their interaction only affected the P partitioning at flowering stage (Table 3).
At flowering stage, the biomass partitioning in leaf (44.74–49.13%) was the most significant, followed by stem (41.10–46.07%), and the least of all was root (8.74–10.36%). P supply improved the biomass partitioning in root and leaf but inhibited that in stem. The biomass partitioning in root and leaf, under the treatment of 120 kg P2O5 ha−1, were increased, on average, by 15.88% and 5.72% as compared with CK. However, this treatment decreased the biomass partitioning in stem by 8.84%. At the maturity stage, the biomass partitioning in stem (40.11–42.68%) was the most significant, followed by seed (25.86–28.33%), shell (23.61–24.38%), and the least was root (7.13–7.94%). P supply resulted in increases of the biomass partitioning in root and seed but decreases of that in stem and shell. As compared with CK, the treatment of 120 kg P2O5 ha−1 increased the biomass partitioning in root and seed by 10.21% and 8.34%, on average, over two growing seasons. However, it decreased the biomass partitioning in stem and shell by 5.28% and 2.66% (Table 4).
In addition, P supply enhanced the reproductive-vegetative ratio at maturity stage. The reproductive-vegetative ratio was increased by 6.69%, with the P rate increasing from 0 to 120 kg P2O5 ha−1 during the 2019–2020 growing season. Although there was no significant difference among 30–150 P2O5 kg ha−1 treatments during the 2018–2019 growing season, the reproductive-vegetative ratio still showed an increasing tendency (Figure 3).
In general, the effects of P supply on P partitioning, at the flowering stage, followed the same change trends as biomass partitioning. However, these effects of P supply on P partitioning, at the maturity stage, were different from these effects on biomass partitioning. At maturity stage, the P partitioning in seed (68.99% to 71.95%) was the most significant, followed by stem (13.52% to 14.99%), shell (11.34% to 14.40%), and the least was root (2.89% to 3.05%). Among different organs, the P partitioning in root showed the least variation. P application increased the P partitioning in stem, but there was no obvious change trend. Besides, P application increased the P partitioning in seed but decreased it in shell (Table 5).

3.4. Leaf Area Index and Leaf Photosynthesis

P supply improved the leaf area index and leaf photosynthetic rate at the flowering stage. As compared with CK, the treatment of 120 kg P2O5 ha−1 increased the leaf area index by 33.18% during the 2018–2019 growing season and 30.40% during the 2019–2020 growing season (Figure 4a,b). The photosynthetic rate was consistently comparable in treatment, received 60 and more kg P2O5 ha−1 during two growing seasons, which was greater than that in CK and the low P supply of 30 kg P2O5 ha−1 (Figure 4c,d).

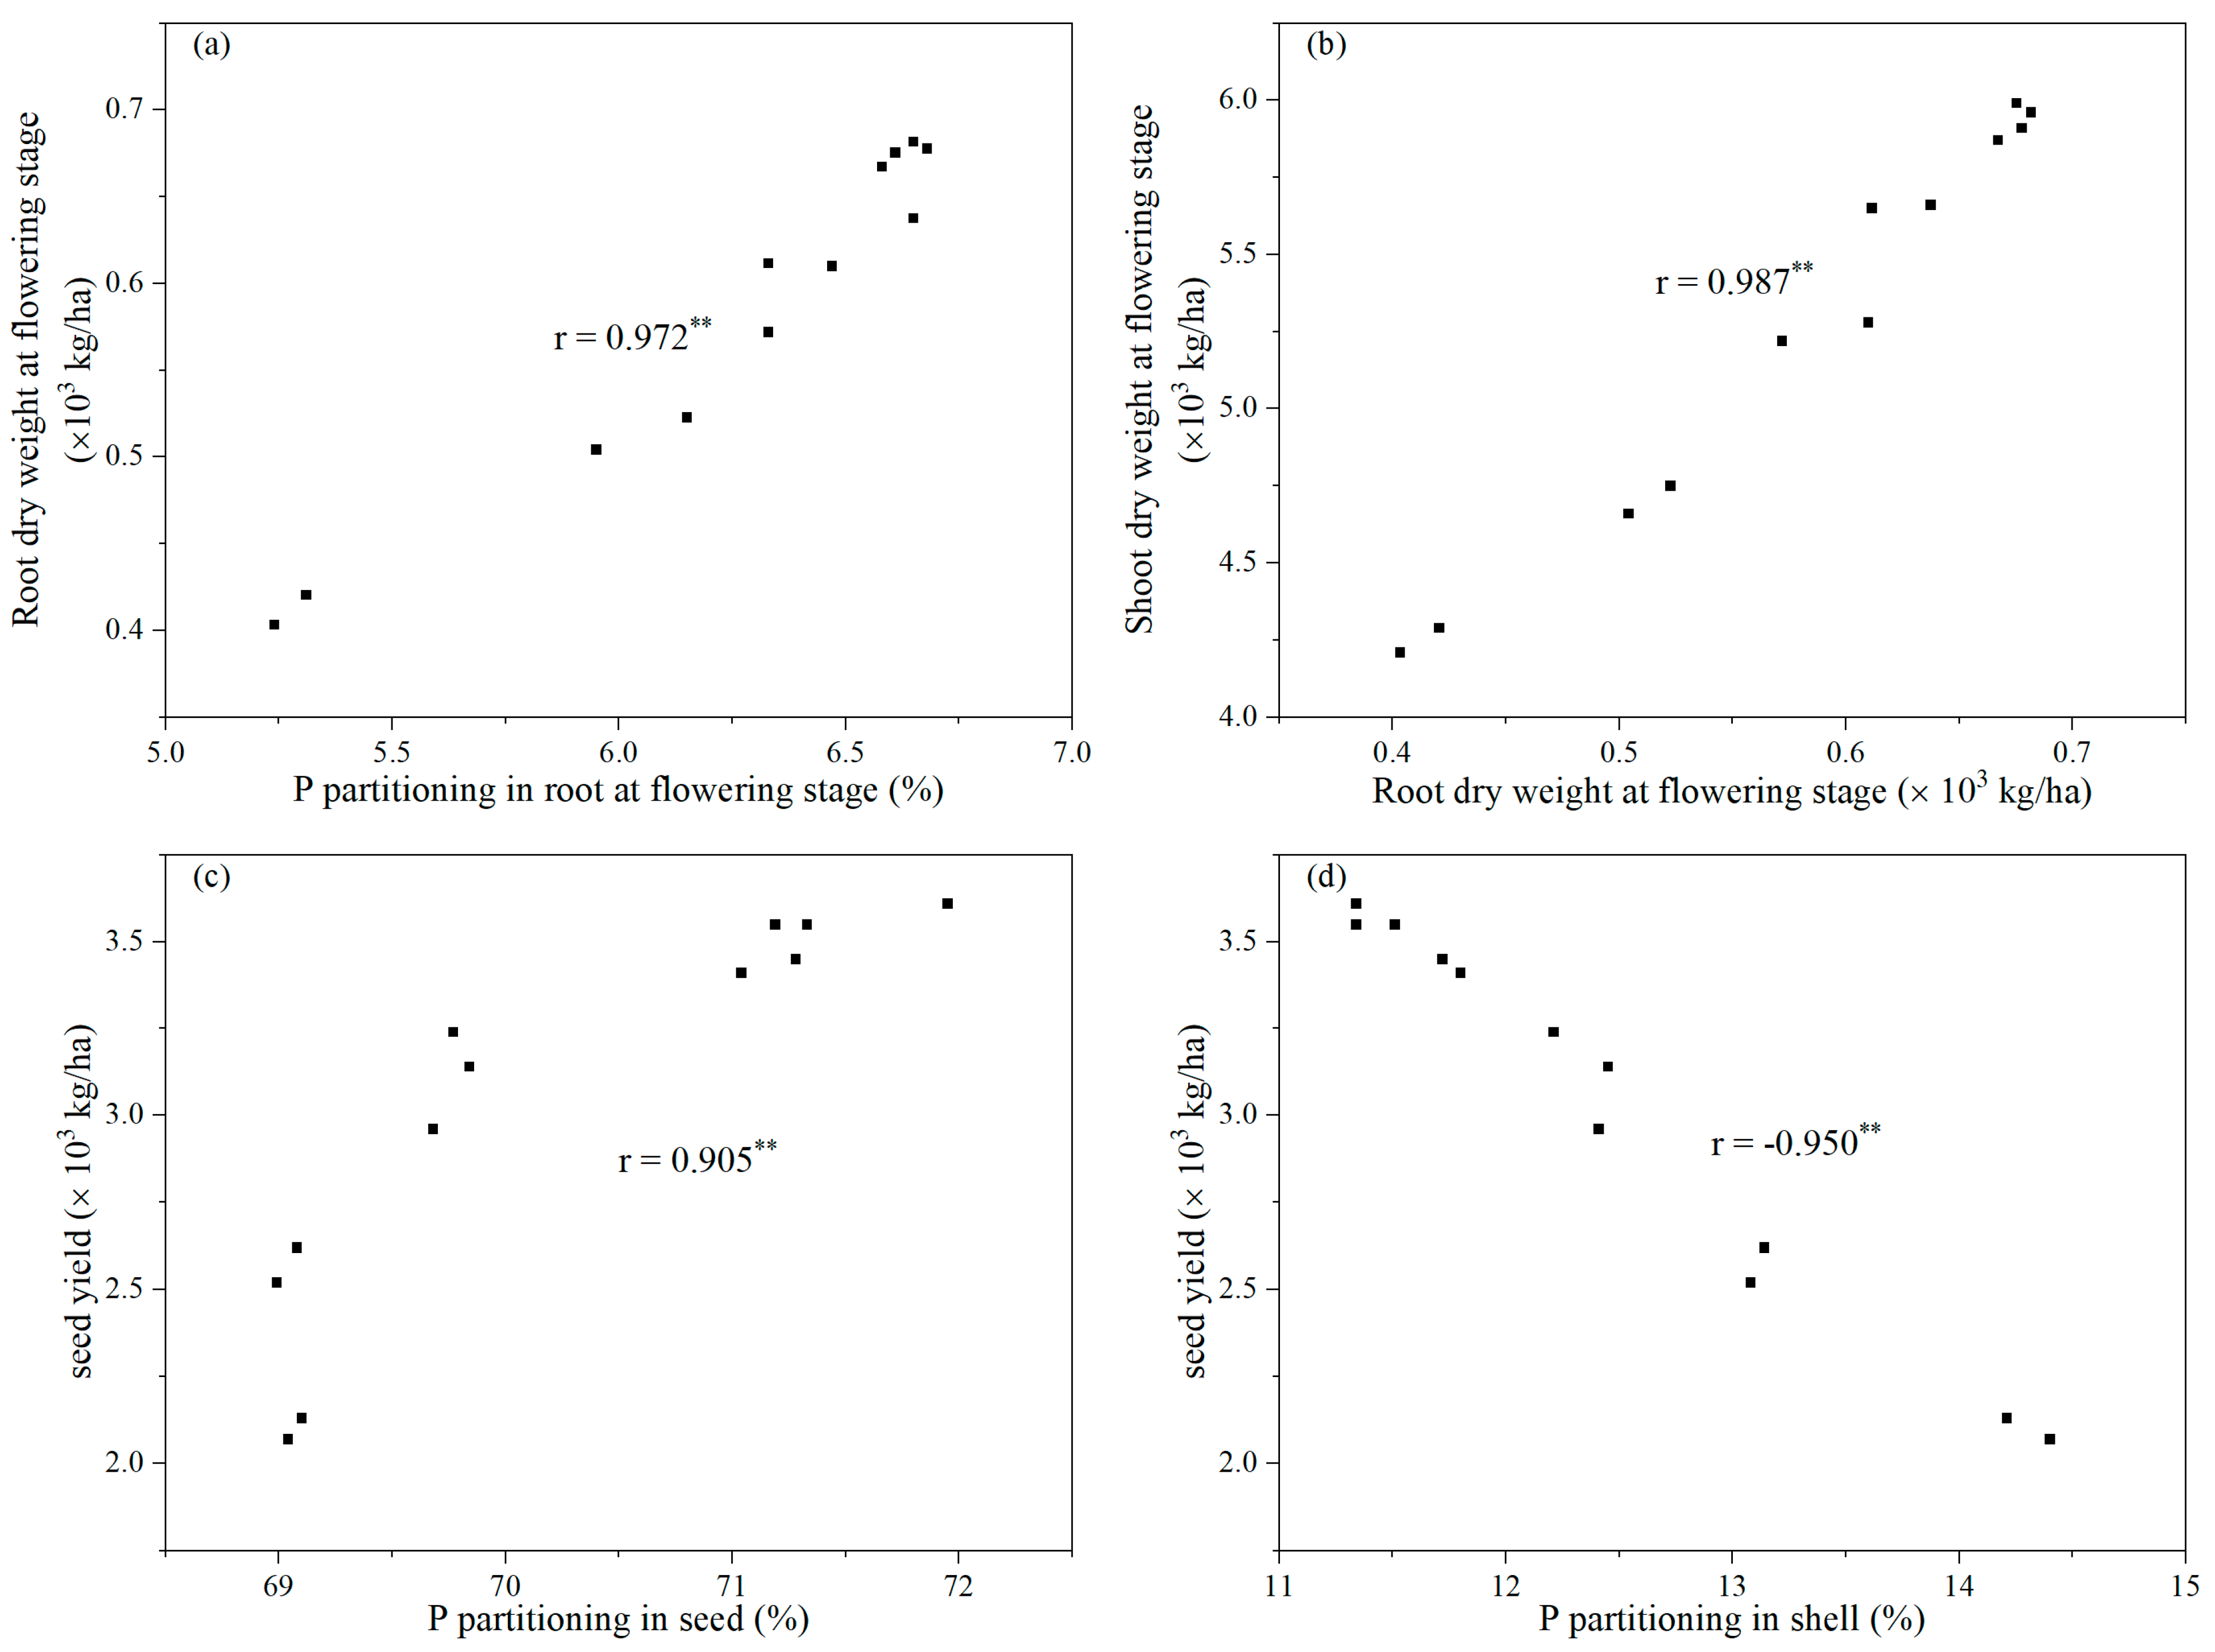
3.5. Correlation Analysis

Pearson’s correlation analysis (Figure 5) showed a positive relationship between P partitioning in root, and root dry weight, at flowering stage (r = 0.972). Besides, root dry weight was positively correlated with shoot dry weight at flowering stage (r = 0.987). At maturity stage, seed yield showed a positive relationship with P partitioning in seed (r = 0.905) but a negative relationship with P partitioning in shell (r = −0.950).

4. Discussion

In our study, we found that P supply improved canola plant growth and increased the seed yield and oil yield in the saline soil of a coastal area. From the perspective of economy, we recommend the rate of 120 kg P2O5 ha−1 for canola planting in this area.
It was widely known that salt stress and P deficiency severely inhibit seed yield of canola [27,28]. In addition to decreasing grain yield, P deficiency also reduces the oil concentration of seed in canola [29]. Optimal P supply is considered as a practical strategy to alleviate the adverse effects of P deficiency in the saline environment. In our study, increasing the rate of P supply caused increases in the seed yield and oil yield. Similar results had been reported—that higher rate of P fertilizer was associated with increased P availability in soil—and therefore led to higher seed yield and higher oil concentration [29,30]. There are three components of seed yield in canola plants: the number of pods per plant, the number of seeds per pod, and 1000-seed weight. The number of pods per plant plays the most important role in seed yield [31], and it is also the most sensitive one to environment. In our study, the increased seed yield could be mainly attributed to the greater performance of number of pods per plant in response to increasing P rate. Previous studies agreed with our results, which showed that there was a positive and significant relationship between seed yield and the number of pods per plant under different P rates, suggesting that maintaining a high quantity of pods was the key to high yield [32].
In our study, P supply caused an increase in biomass and P accumulation of all organs at all the growth stages. By contrasting with the positive effects of P supply on different organs, we found that root had the most increments among different organs.
The root growth is important for nutrient uptake and seed yield formation. Optimized root systems can increase P acquisition and thereby improve plant growth, yield formation, and P use efficiency [33,34,35]. Interestingly, we observed that the biomass accumulation and partitioning in root, at the flowering stage, was improved by increasing P rate. In previous studies, root characteristics, including root volume, root area, and root length were increased under P sufficient condition, suggesting that P supply can help canola plants develop stronger root systems [36], in spite of opposite results showed that the greater ratio of root to shoot was produced under P deficiency [17]. The improved root growth due to P supply boosted the ability of root to absorb nutrients from soils. For example, greater root contact with soil provides more absorptive area, which is beneficial for uptake of some immobile nutrients such as P [37,38]. As a result, greater root growth further promotes the shoot part development. Similar results had been reported that root morphological traits (root length and root area) were positively associated with shoot dry weight [39].
Leaf is the main organ of the shoot part at the flowering stage. It is also the photosynthetic organ of canola plants prior to anthesis. The better leaf growth means canola plants can accumulate more carbohydrates through photosynthesis [40]. In our study, the increasing P rate improved the biomass and P accumulation and partitioning in leaf and leaf area index at the flowering stage. As an important physiological index for leaf photosynthetic capacity, photosynthetic rate also increased with the increasing P rate. Previous studies had demonstrated that P supply can increase seed yield and biomass accumulation of canola plants, induced by augmented leaf stomatal conductance and leaf chlorophyll content, which are responsible for the leaf photosynthetic rate [14,41].
In our previous studies, salt stress could inhibit nutrients transporting from vegetative organs of root and stem to reproductive organs of shell and seed at the maturity stage, resulting in the decreased seed yield of canola plants in a saline environment [24]. In this study, P supply changed the biomass and P partitioning models in different organs at the maturity stage and increased the reproductive-vegetative ratio in the saline environment. These results suggested that P supply can improve the nutrient transportation from vegetative organs to reproductive organs rather than fix nutrients into vegetative organs under salt stress. Similar results had been reported in cotton [42], indicating that optimal P supply can improve assimilation and translocation to reproductive organs. It was known that the shell substitutes leaf as the main organ of photosynthesis at the maturity stage, and the photosynthates of shell were the important source of biomass for seed filling [43]. Therefore, improving the nutrient assimilation and transportation from shell to seed plays an important role in seed yield formation. In our study, the seed yield had a positive relationship with P partitioning in seed but a negative relationship with P partitioning in shell, supporting this statement. Our results also showed that an increase in P rate caused decreases in the P partitioning in shell but increases in seed, suggesting that P supply can improve the capacity of the nutrients transporting from shell to seed. Conclusively, P supply improved the nutrient accumulation and promoted the nutrients transporting to seeds, resulting in increased seed yield.
Results from this study demonstrated that 120 kg P2O5 ha−1 was recommended in this saline soil. In terms of yield formation, biomass and P accumulation, the greatest values were produced under the treatments of 120 or 150 kg P2O5 ha−1, and the 120 kg P2O5 ha−1 treatment produced similar positive effects to the 150 kg P2O5 ha−1 treatment. Regarding biomass and P partitioning, the best improvements were recorded under either 120 kg P2O5 ha−1 treatment or 150 kg P2O5 ha−1, and effects of these two treatments were comparable. Moreover, a balanced P fertilizer supply can improve plant growth and yield due to increased soil P availability, but excessive P input was reported to cause soil pollution and P fixation [44]. Therefore, to avoid over application of P fertilizer, the rate of 120 kg P2O5 ha−1 is more appropriate.

5. Conclusions

In our study, P supply enhanced the root growth due to more P partitioning in root at the flowering stage. Greater performance of root, under P supply, exerted a positive effect on shoot growth, such as leaf area index and photosynthetic rate. At the maturity stage, P supply increased the reproductive-vegetative ratio, suggesting that P supply can improve the nutrients transporting from vegetative organs (root and stem) to reproductive organs (shell and seed). On the other hand, P supply prompted P transporting from shell to seed. As a result, the seed yield and oil yield were increased. Conclusively, P fertilizer, at the rate of 120 kg P2O5 ha−1, is a promising recommendation for canola production in this saline environment. We hope that the results of this study can contribute to the sustainable and healthy development of canola production in saline soil. Further research is required to investigate the effects of P from different sources in more plant species under saline environment, providing more effective strategies to fully use the salinized soil.

Author Contributions

Conceptualization, L.W. and Q.Z.; methodology, L.W., J.Z. and J.Y.; validation, L.W., J.L. and C.Q.; formal analysis, L.W.; investigation, L.W.; resources, L.W.; data curation, L.W.; writing—original draft preparation, L.W.; writing—review and editing, Q.Z.; visualization, L.W.; supervision, S.L., G.Y. and Q.Z. All authors have read and agreed to the published version of the manuscript.

Funding

This research was funded by the National Key Research and Development Program of China (2018YFD1000900), and the Key Research and Development Program of Jiangsu Province, China (BE2020385).

Institutional Review Board Statement

Not applicable.

Informed Consent Statement

Not applicable.

Data Availability Statement

Not applicable.

Conflicts of Interest

The authors declare no conflict of interest.

References

  1. Hu, Q.; Hua, W.; Yin, Y.; Zhang, X.; Liu, L.; Shi, J.; Zhao, Y.; Qin, L.; Chen, C.; Wang, H. Rapeseed research and production in China. Crop J. 2017, 5, 127–135. [Google Scholar] [CrossRef] [Green Version]
  2. Gunstone, F.D. Production and consumption of rapeseed oil on a global scale. Eur. J. Lipid Sci. Technol. 2001, 103, 447–449. [Google Scholar] [CrossRef]
  3. Bonjean, A.P.; Dequidt, C.; Sang, T. Rapeseed in China. OCL 2016, 23, D605. [Google Scholar] [CrossRef] [Green Version]
  4. Etesami, H.; Maheshwari, D.K. Use of plant growth promoting rhizobacteria (PGPRs) with multiple plant growth promoting traits in stress agriculture: Action mechanisms and future prospects. Ecotoxicol. Environ. Saf. 2018, 156, 225–246. [Google Scholar] [CrossRef]
  5. Hasanuzzaman, M.; Nahar, K.; Alam, M.M.; Bhowmik, P.C.; Hossain, M.A.; Rahman, M.M.; Prasad, M.N.V.; Ozturk, M.; Fujita, M. Potential Use of Halophytes to Remediate Saline Soils. Biomed Res. Int. 2014, 2014. [Google Scholar] [CrossRef] [PubMed]
  6. Mittal, S.; Kumari, N.; Sharma, V. Differential response of salt stress on Brassica juncea: Photosynthetic performance, pigment, proline, D1 and antioxidant enzymes. Plant Physiol. Biochem. 2012, 54, 17–26. [Google Scholar] [CrossRef]
  7. Tanveer, M.; Shah, A.N. An insight into salt stress tolerance mechanisms of Chenopodium album. Environ. Sci. Pollut. Res. 2017, 24, 16531–16535. [Google Scholar] [CrossRef]
  8. Gupta, B.; Huang, B. Mechanism of Salinity Tolerance in Plants: Physiological, Biochemical, and Molecular Characterization. Int. J. Genom. 2014, 2014. [Google Scholar] [CrossRef] [PubMed]
  9. Bybordi, A. Effect of ammonium/nitrate nitrogen ratio on photosynthesis, respiration and some vegetative traits of canola grown under salinity stress. J. Food Agric. Environ. 2012, 10, 372–375. [Google Scholar]
  10. Gao, L.; Liu, M.; Wang, M.; Shen, Q.; Guo, S. Enhanced Salt Tolerance under Nitrate Nutrition is Associated with Apoplast Na+ Content in Canola (Brassica napus L.) and Rice (Oryza sativa L.) Plants. Plant Cell Physiol 2016, 57, 2323–2333. [Google Scholar] [CrossRef] [Green Version]
  11. Tang, H.L.; Niu, L.; Wei, J.; Chen, X.Y.; Chen, Y.L. Phosphorus Limitation Improved Salt Tolerance in Maize Through Tissue Mass Density Increase, Osmolytes Accumulation, and Na+ Uptake Inhibition. Front. Plant Sci. 2019, 10, 856. [Google Scholar] [CrossRef] [Green Version]
  12. Vance, C.P.; Uhde-Stone, C.; Allan, D.L. Phosphorus acquisition and use: Critical adaptations by plants for securing a nonrenewable resource. New Phytol. 2003, 157, 423–447. [Google Scholar] [CrossRef] [Green Version]
  13. Zribi, O.T.; Hessini, K.; Trabelsi, N.; Zribi, F.; Hamdi, A.; Ksouri, R.; Abdelly, C. Aeluropus littoralis maintains adequate gas exchange, pigment composition and phenolic contents under combined effects of salinity and phosphorus deficiency. Aust. J. Bot. 2017, 65, 453–462. [Google Scholar] [CrossRef]
  14. Sabir, M.; Sultan, T.; Yaseen, M.; Ahmad, R.; Tarar, Z.H. Comparative Effect of Different Phosphatic Fertilizers on Growth of Rapeseed (Brassica napus L.) in Alkaline Calcareous Saline-Sodic Soils. Commun. Soil Sci. Plant Anal. 2021. [Google Scholar] [CrossRef]
  15. Sharif, M.; Sarir, M.S. Biological and chemical transformation of phosphorus in some important soil series of NWFP. Sarhad J. Agric. 2000, 16, 587–592. [Google Scholar]
  16. Zhang, K.; Shi, Y.; Cui, X.; Yue, P.; Li, K.; Liu, X.; Tripathi, B.M.; Chu, H. Salinity Is a Key Determinant for Soil Microbial Communities in a Desert Ecosystem. Msystems 2019, 4, e00225-18. [Google Scholar] [CrossRef] [Green Version]
  17. Li, J.Z.; Xie, Y.; Dai, A.Y.; Liu, L.F.; Li, Z.C. Root and shoot traits responses to phosphorus deficiency and QTL analysis at seedling stage using introgression lines of rice. J. Genet. Genom. 2009, 36, 173–183. [Google Scholar] [CrossRef]
  18. Liu, H.; Hu, C.; Hu, X.; Nie, Z.; Sun, X.; Tan, Q.; Hu, H. Interaction of molybdenum and phosphorus supply on uptake and translocation of phosphorus and molybdenum by Brassica napus. J. Plant Nutr. 2010, 33, 1751–1760. [Google Scholar] [CrossRef] [Green Version]
  19. Yaryura, P.; Cordon, G.; Leon, M.; Kerber, N.; Pucheu, N.; Rubio, G.; Garcia, A.; Lagorio, M.G. Effect of Phosphorus Deficiency on Reflectance and Chlorophyll Fluorescence of Cotyledons of Oilseed Rape (Brassica napus L.). J. Agron. Crop. Sci. 2009, 195, 186–196. [Google Scholar] [CrossRef]
  20. Ding, G.; Zhao, Z.; Liao, Y.; Hu, Y.; Shi, L.; Long, Y.; Xu, F. Quantitative trait loci for seed yield and yield-related traits, and their responses to reduced phosphorus supply in Brassica napus. Ann. Bot. 2012, 109, 747–759. [Google Scholar] [CrossRef] [PubMed] [Green Version]
  21. Bouras, H.; Bouaziz, A.; Bouazzama, B.; Hirich, A.; Choukr-Allah, R. How Phosphorus Fertilization Alleviates the Effect of Salinity on Sugar Beet (Beta vulgaris L.) Productivity and Quality. Agronomy 2021, 11, 1491. [Google Scholar] [CrossRef]
  22. Zribi, O.T.; Slama, I.; Trabelsi, N.; Hamdi, A.; Smaoui, A.; Abdelly, C. Combined effects of salinity and phosphorus availability on growth, gas exchange, and nutrient status of Catapodium rigidum. Arid Land Res. Manag. 2018, 32, 277–290. [Google Scholar] [CrossRef]
  23. Lee, H.; Zaman, R.; Lee, B.-R.; Kim, T.-H. Effects of Nitrogen Level on Nitrogen Partitioning and Harvest Index in Brassica napus L. J. Korean Soc. Grassl. Sci. 2018, 38, 140–144. [Google Scholar] [CrossRef]
  24. Zuo, Q.; Liu, J.; Shan, J.; Zhou, J.; Wang, L.; Yang, G.; Leng, S.; Liu, H. Carbon and Nitrogen Assimilation and Partitioning in Canola (Brassica napus L.) In Saline Environment. Commun. Soil Sci. Plant Anal. 2019, 50, 1700–1709. [Google Scholar] [CrossRef]
  25. Zhao, Z.; Wang, S.; White, P.J.; Wang, Y.; Shi, L.; Xu, F. Boron and Phosphorus Act Synergistically to Modulate Absorption and Distribution of Phosphorus and Growth of Brassica napus. J. Agric. Food Chem. 2020, 68, 7830–7838. [Google Scholar] [CrossRef]
  26. Liu, L.; Long, X.; Shao, H.; Liu, Z.-P.; Tao, Y.; Zhou, Q.; Zong, J. Ameliorants improve saline-alkaline soils on a large scale in northern Jiangsu Province, China. Ecol. Eng. 2015, 81, 328–334. [Google Scholar] [CrossRef]
  27. Bybordi, A. The Influence of Salt Stress on Seed Germination, Growth and Yield of Canola Cultivars. Notulae Botanicae Horti Agrobotanici Cluj-Napoca 2010, 38, 128–133. [Google Scholar]
  28. Yousaf, M.; Li, J.F.; Lu, J.W.; Ren, T.; Cong, R.H.; Fahad, S.; Li, X.K. Effects of fertilization on crop production and nutrient-supplying capacity under rice-oilseed rape rotation system. Sci. Rep. 2017, 7, 1270. [Google Scholar] [CrossRef] [PubMed]
  29. Brennan, R.F.; Bolland, M.D.A. Effect of fertiliser phosphorus and nitrogen on the concentrations of oil and protein in grain and the grain yield of canola (Brassica napus L.) grown in south-western Australia. Aust. J. Exp. Agric. 2007, 47, 984–991. [Google Scholar] [CrossRef]
  30. Lickfett, T.; Matthaus, B.; Velasco, L.; Mollers, C. Seed yield, oil and phytate concentration in the seeds of two oilseed rape cultivars as affected by different phosphorus supply. Eur. J. Agron. 1999, 11, 293–299. [Google Scholar] [CrossRef]
  31. Bybordi, A.; Ebrahimian, E. Growth, Yield and Quality Components of Canola Fertilized with Urea and Zeolite. Commun. Soil Sci. Plant Anal. 2013, 44, 2896–2915. [Google Scholar] [CrossRef]
  32. Wahid, M.A.; Cheema, M.A.; Saleem, M.F.; Nadeem, M.; Sattar, A.; Zaman, M. Canola growth and phosphorus amendments. i. yield and quality response of canola to different phosphorus amendments. Pak. J. Agric. Sci. 2014, 51, 847–854. [Google Scholar]
  33. Lambers, H.; Shane, M.W.; Cramer, M.D.; Pearse, S.J.; Veneklaas, E.J. Root structure and functioning for efficient acquisition of phosphorus: Matching morphological and physiological traits. Ann. Bot. 2006, 98, 693–713. [Google Scholar] [CrossRef] [Green Version]
  34. White, P.J.; George, T.S.; Dupuy, L.X.; Karley, A.J.; Valentine, T. Root traits for infertile soils. Front. Plant Sci. 2013, 4, 193. [Google Scholar] [CrossRef] [Green Version]
  35. Wang, W.; Ding, G.-D.; White, P.J.; Wang, X.-H.; Jin, K.-M.; Xu, F.-S.; Shi, L. Mapping and cloning of quantitative trait loci for phosphorus efficiency in crops: Opportunities and challenges. Plant Soil 2019, 439, 91–112. [Google Scholar] [CrossRef]
  36. Nourgholipour, F.; Hosseini, H.M.; Tehrani, M.M.; Zadeh, B.M.; Moshiri, F. Phosphorus Efficiency of Winter Canola Cultivars and Rhizosphere Properties in Rhizobox Technique. Commun. Soil Sci. Plant Anal. 2019, 50, 35–48. [Google Scholar] [CrossRef]
  37. Elanchezhian, R.; Krishnapriya, V.; Pandey, R.; Rao, A.S.; Abrol, Y.P. Physiological and molecular approaches for improving phosphorus uptake efficiency of crops. Curr. Sci. 2015, 108, 1271–1279. [Google Scholar]
  38. Lyu, Y.; Tang, H.; Li, H.; Zhang, F.; Rengel, Z.; Whalley, W.R.; Shen, J. Major Crop Species Show Differential Balance between Root Morphological and Physiological Responses to Variable Phosphorus Supply. Front. Plant Sci. 2016, 7, 1939. [Google Scholar] [CrossRef] [PubMed]
  39. Duan, X.; Jin, K.; Ding, G.; Wang, C.; Cai, H.; Wang, S.; White, P.J.; Xu, F.; Shi, L. The impact of different morphological and biochemical root traits on phosphorus acquisition and seed yield of Brassica napus. Field Crop. Res. 2020, 258, 107960. [Google Scholar] [CrossRef]
  40. Heyneke, E.; Fernie, A.R. Metabolic regulation of photosynthesis. Biochem. Soc. Trans. 2018, 46, 321–328. [Google Scholar] [CrossRef]
  41. Zangani, E.; Afsahi, K.; Shekari, F.; Mac Sweeney, E.; Mastinu, A. Nitrogen and Phosphorus Addition to Soil Improves Seed Yield, Foliar Stomatal Conductance, and the Photosynthetic Response of Rapeseed (Brassica napus L.). Agriculture 2021, 11, 483. [Google Scholar] [CrossRef]
  42. Chen, B.; Wang, Q.; Tang, X.; Ye, Z.; Stiles, S.; Feng, G. Growth and sink-source relationship of cotton (Gossypium hirsutum L.) under mulched drip irrigation in response to phosphorus fertilization and cultivar. J. Plant Nutr. 2021. [Google Scholar] [CrossRef]
  43. Wang, C.; Hai, J.; Tian, J.; Yang, J.; Zhao, X. Influence of Silique and Leaf Photosynthesis on Yield and Quality of Seed of Oilseed Rape (Brassica napus L.) after Flowering. Xibei Zhiwu Xuebao 2014, 34, 1620–1626. [Google Scholar] [CrossRef]
  44. Mahmood, M.; Tian, Y.; Ma, Q.; Ahmed, W.; Mehmood, S.; Hui, X.; Wang, Z. Changes in Phosphorus Fractions and Its Availability Status in Relation to Long Term P Fertilization in Loess Plateau of China. Agronomy 2020, 10, 1818. [Google Scholar] [CrossRef]
Figure 1. Effects of P rate on biomass accumulation of canola plants in saline environment. (a,b): biomass accumulation at flowering stage during 2018–2019 and 2019–2020 growing seasons. (c,d): biomass accumulation at maturity stage during 2018–2019 and 2019–2020 growing seasons. Different letters indicate significant difference at p = 0.05 between P rate treatments for the same plant organ.
Agronomy 11 01918 g001
Figure 2. Effects of P rate on P accumulation of canola plants in a saline environment. (a,b): P accumulation at flowering stage during 2018–2019 and 2019–2020 growing seasons. (c,d): P accumulation at maturity stage during 2018–2019 and 2019–2020 growing seasons. Different letters indicate significant difference at p = 0.05 between P rate treatments for the same plant organ.
Agronomy 11 01918 g002
Figure 3. Effects of P rate on reproductive-vegetative ratio at maturity stage in saline environment. (a): 2018–2019 growing season; (b): 2019–2020 growing season. Different letters indicate significant difference at p = 0.05 between P rate treatments.
Agronomy 11 01918 g003
Figure 4. Effects of P rate on leaf area index and photosynthetic rate of canola plants in a saline environment. (a,b): leaf area index at flowering stage during the 2018–2019 and 2019–2020 growing seasons. (c,d): leaf photosynthetic rate at the flowering stage during the 2018–2019 and 2019–2020 growing seasons. Different letters indicate significant difference at p = 0.05 between P rate treatments.
Agronomy 11 01918 g004
Figure 5. Correlation between some parameters in this study. (a): the relationship between P partitioning in root, and root dry weight, at the flowering stage. (b): the relationship between root dry weight and shoot dry weight (stem and leaf) at the flowering stage. (c): the relationship between P partitioning in seed and seed yield. (d): the relationship between P partitioning in shell and seed yield. ** p < 0.01.
Agronomy 11 01918 g005
Table 1. The basic properties of soils (0–20 cm) in the study.
ItemsSoil PropertiesValue
20182019
Soil nutrients contentOrganic matter (g/kg)15.216.3
Total nitrogen (g/kg)0.810.83
Alkali-hydrolysable nitrogen (mg/kg)61.764.2
Available phosphorus (mg/kg)10.811.6
Available potassium (mg/kg)182.5179.6
Soil salt ion concentrationNa+ (g/kg)0.5230.507
K+ (g/kg)0.0630.061
Ca2+ (g/kg)0.2760.265
Mg2+ (g/kg)0.0610.059
Cl (g/kg)1.1121.041
HCO3 (g/kg)0.3450.346
SO42− (g/kg)0.3120.318
Total salt ion (g/kg)2.6922.597
Soil pHpH8.138.06
Table 2. Effects of P rate on yield performance of canola plants in saline environment.
YearP Rate
(kg P2O5 ha−1)
Number of Primary Branches per PlantSeed Yield
(×103 kg ha−1)
Seed Oil Concentration (%)Oil Yield (kg ha−1)Number of Pods per PlantNumber of Seeds per Pod1000-Seed Weight
2018–201906.1 e1.94 e43.73 c847.2 e76.8 e15.9 d3.77 a
306.8 d2.42 d44.35 bc1075.3 d88.5 d16.8 c3.77 a
607.4 c2.83 c45.26 ab1282.3 c101.4 c17.0 bc3.82 a
908.5 b3.09 b46.25 a1430.5 b111.1 b17.2 ab3.77 a
1209.2 a3.33 a46.44 a1545.1 a116.1 a17.2 ab3.84 a
1509.0 a3.35 a46.49 a1558.7 a118.6 a17.5 a3.80 a
2019–202005.9 e2.04 e44.02 c898.9 e77.7 e16.3 c3.74 a
306.9 d2.51 d44.53 bc1116.8 d91.2 d16.8 b3.80 a
607.5 c2.91 c45.86 ab1335.4 c106.4 c17.2 ab3.82 a
908.4 b3.22 b46.26 a1490.0 b113.8 b17.7 a3.77 a
1209.3 a3.42 a46.81 a1601.7 a120.2 a17.6 a3.79 a
1509.3 a3.40 a46.70 a1589.4 a118.2 a17.7 a3.78 a
ANOVA Results
P Rate ************NS
Year NS********NS
P Rate * YearNSNSNSNSNSNSNS
Different letters indicate significant difference at p = 0.05 between P rate treatments during the same growing season. Probability levels are performed by NS, * and ** for not significant, 0.05 and 0.01.
Table 3. The ANOVA results of effects of P rate on biomass, P accumulation, and partitioning in a saline environment.
Flowering StageMaturity Stage
RootStemLeafRootStemShellSeed
Biomass Accumulation
P Rate**************
Year***NSNSNS****
P Rate * Year*NSNS***NSNS
P Accumulation
P Rate**************
Year**NS*NS**
P Rate * Year*NSNS*****
Biomass Partitioning
P Rate**************
YearNSNSNSNS*NSNS
P Rate * YearNSNSNSNSNSNSNS
P Partitioning
P Rate******NS*****
YearNSNSNSNSNSNSNS
P Rate * Year***NSNSNSNS
Probability levels are performed by NS, * and ** for not significant, 0.05 and 0.01.
Table 4. Effects of P rate on biomass partitioning (%) of canola plants in a saline environment.
YearP Rate
(kg P2O5 ha−1)
Flowering StageMaturity Stage
RootStemLeafRootStemShellSeed
2018–201908.74 c44.34 a46.92 c7.14 c42.67 a24.33 a25.86 c
309.76 b45.21 a45.03 c7.35 bc41.64 b24.28 a26.73 b
609.87 b42.47 b47.66 b7.40 b41.38 b23.99 ab27.22 ab
909.77 b41.10 c49.13 a7.57 b41.08 bc23.82 b27.54 ab
12010.20 a41.17 c48.63 a7.92 a40.50 c23.66 b27.92 a
15010.28 a41.12 c48.60 a7.94 a40.40 c23.61 b28.06 a
2019–202008.92 c46.07 a45.01 c7.13 c42.43 a24.38 a26.06 c
309.91 b45.35 a44.74 c7.46 b41.56 b24.25 a26.73 b
6010.36 a42.74 b46.91 b7.55 b41.36 b23.95 a27.14 b
9010.12 ab41.64 c48.25 a7.64 ab40.65 c23.80 a27.92 a
12010.26 ab41.22 c48.51 a7.81 a40.11 c23.75 a28.33 a
15010.13 ab41.46 c48.42 a7.82 a40.18 c23.79 a28.21 a
Different letters indicate significant difference at p = 0.05 between P rate treatments during the same growing season.
Table 5. Effects of P rate on P partitioning (%) of canola plants in a saline environment.
YearP Rate (kg P2O5 ha−1)Flowering StageMaturity Stage
RootStemLeafRootStemShellSeed
2018–201905.24 d45.14 a49.62 b3.05 a13.52 c14.40 a69.04 b
305.95 c45.80 a48.25 c2.96 a14.98 a13.08 b68.99 b
606.33 b42.40 b51.27 a2.96 a14.94 a12.41 c69.68 b
906.33 b41.48 b52.19 a3.03 a14.99 a12.21 c69.77 b
1206.58 a42.04 b51.38 a3.00 a13.99 b11.72 d71.28 a
1506.68 a41.62 b51.70 a3.05 a14.28 b11.34 d71.33 a
2019–202005.31 d46.39 a48.30 c3.02 a13.66 d14.21 a69.10 c
306.15 c45.49 b48.37 c2.98 ab14.80 a13.14 b69.08 c
606.47 b43.42 c50.10 b2.99 ab14.71 ab12.45 c69.84 c
906.65 a42.00 d51.35 a2.99 ab14.17 bcd11.80 d71.04 b
1206.65 a41.47 d51.88 a2.89 b13.82 cd11.34 e71.95 a
1506.61 a41.86 d51.53 a3.05 a14.26 abc11.51 de71.19 b
Different letters indicate significant difference at p = 0.05 between P rate treatments during the same growing season.
Publisher’s Note: MDPI stays neutral with regard to jurisdictional claims in published maps and institutional affiliations.

