Article

Crop and Residue Management Improves Productivity and Profitability of Rice–Maize System in Salt-Affected Rainfed Lowlands of East India

1
Indian Council of Agricultural Research-Central Soil Salinity Research Institute, Regional Research Station, Canning 743329, India
2
International Rice Research Institute-South Asia Regional Centre, Varanasi 221006, India
3
Indian Council of Agricultural Research-Central Soil Salinity Research Institute, Karnal 132001, India
4
International Rice Research Institute, Los Baños 4031, Philippines
5
International Rice Research Institute-Africa, C/O ILRI, Nairobi 30709, Kenya
*
Author to whom correspondence should be addressed.
Agronomy 2020, 10(12), 2019; https://doi.org/10.3390/agronomy10122019
Submission received: 21 November 2020 / Revised: 12 December 2020 / Accepted: 16 December 2020 / Published: 21 December 2020
(This article belongs to the Special Issue Crop Mineral Nutrition: Old and Emerging Challenges and Opportunities)

Abstract

:
This study was conducted over 3 years in a salt-affected coastal rainfed lowland ecosystem. Farmers most commonly grow tall rice varieties in the wet season to cope with flash and/or stagnant floods, leading to large amounts of rice residue production. Most of the land remains fallow during the dry season because of increased salinity and scarcity of freshwater for irrigation. The study aims to provide options for increasing cropping intensity through management of crop residues (CR) and soil salinity, conservation of soil moisture, and reduction in production cost. The rice–maize rotation was assessed with rice as the main plot as (1) puddled transplanted rice (PTR) with CR of both rice and maize removed, (2) PTR and 40% CR of both crops retained, (3) dry direct-seeded rice (DSR) with CR of both crops removed, and (4) DSR with 40% CR of both crops retained. Maize in the dry season was supplied with different N levels as sub-plots—control (0 kg N ha−1), 80, 120, and 160 kg N ha−1. DSR, when combined with CR retention (DSR + R), reduced soil salinity. The increase in rice grain yield with CR retention (observed in second and third years) and crop establishment (higher in DSR versus PTR in the third year) was 16 and 24%, respectively. The cost of production increased by 17% (USD 605 ha−1) in PTR compared with DSR (USD 518 ha−1). CR retention reduced irrigation water requirement by 37% and N requirement by 40 kg ha−1 for hybrid maize. When CR was removed (−R), the N requirement for hybrid maize increased to 160 kg N ha−1 compared to when it was partially (40%) retained, where the requirement was 120 kg ha−1 with similar yields. Available N was highest under DSR + R (314 kg ha−1) and lowest under PTR − R (169 kg ha−1), and it also increased with increasing N application up to 120 kg ha−1 (+R) and 160 kg ha−1 (−R). The results of the study hold promise for increasing cropping intensity and farmers’ incomes, with broader implications for increasing productivity on about 2.95 million hectares currently under a rice–fallow system in eastern India, and in coastal areas affected by similar conditions in South and Southeast Asia.

1. Introduction

About 2.56 million ha of land in coastal areas of India are salt-affected. These areas are mostly used for one season of rice during the wet (kharif) season and most of the land remains fallow in the subsequent dry (rabi/boro) season. This is because of shortages of irrigation water and salinity build-up in the surface and sub-surface soil during the dry season, limiting opportunities for double cropping. Rice is traditionally established in these rainfed lowlands by transplanting seedlings in puddled fields with standing water after sufficient rainwater accumulates. Transplanting is commonly accomplished during the peak period of monsoon rainfall, subjecting the crop to early flooding. Abiotic and biotic stresses like complete inundation (submergence), salinity, drought, insects, diseases, and rodents are common, with adverse effects on rice productivity [1,2]. Among the abiotic stresses, submergence during vegetative stage and high soil salinity (~6 dS m−1) during the reproductive stage cause significant yield losses. Puddling also has a negative effect on subsequent dry season crops [3]. Another important constraint to crop production is the imbalanced application of nutrients, particularly the poor use of organic fertilizers and soil amendments [4].
Alternative crop establishment methods like dry direct-seeding of rice (DSR) provide better options to reduce unproductive water losses and moderate the effects of drought and submergence [5,6]. DSR allows earlier crop establishment compared with conventional puddled transplanted rice (PTR) and thus utilizes rainwater more efficiently, especially during the early monsoon season, and it also reduces the risk of submergence by ensuring that plants are taller when heavy rains begin [6]. Moreover, crops mature early, which provides an opportunity to use residual soil moisture for succeeding crops with better tolerance of waterlogging and drought due to enhanced crop establishment during the early vegetative phase.
During the dry season, only a few farmers can grow summer rice when irrigation water is available. There is an increasing interest to promote non-rice crops that require less water during the dry season to enhance food production and generate more income for local farmers, with income mostly below the poverty line. In recent years, maize (Zea mays L.) was found to be effective during the dry season when grown in rotation with the traditional wet season rice [6], because of its adaptation and higher yield compared with other crops. It is also considered a commercial crop with various industrial uses, including food processing, biofuel, and starch, in addition to serving as human food and feed for poultry, piggery, and other animals. The Government of West Bengal, India has decided to increase maize production by 33%, from the current 1.5 million metric tons per year to 2.0 million metric tons in a timeframe of two years [7].
During the dry season, night temperature prevails above 10 °C throughout the season in coastal areas, radiation is generally high, and photo-insensitive crops are usually adapted to these areas. Maize seems to meet these requirements, though it is moderately sensitive to salt stress, with a low ECe (electrical conductivity of the saturation extract) threshold of 1.7 dS m−1, beyond which grain yield decreases by 12% per unit increase in ECe [8]. Genotypic differences in tolerance of salinity stress were reported among both inbred and hybrid maize varieties [9,10]. Our previous study showed that growing maize on raised beds leads to higher benefit/cost ratios than rapeseed (1.87 versus 1.57) in coastal saline regions, but with the additional cost incurred for irrigation [6]. There is a need to explore management options that reduce irrigation water requirements and increase water productivity while mitigating the effects of salt stress.
The better and more vigorous growth of hybrid maize compared to most crops is an important trait for withstanding salinity stress in coastal regions. The high biomass can also be used as feed and/or incorporated into the soil to increase soil organic matter and carbon sequestration. Hybrid maize is considered an apt option with high yield potential, compared with inbred varieties, to help achieve a significant increase in maize production. This is to meet the increasing demand in West Bengal as well as at the national level, estimated at 45 MT by 2022 (from 26 MT in 2016–2017) [11]. However, hybrid maize requires intensive nutrient input, particularly nitrogen, which is deficient in most soils in coastal regions [12]. N application needs to be optimized using organic and inorganic sources for higher and profitable yields, to maintain soil organic carbon, and to improve N use efficiency (NUE). Higher N application in the absence of proper organic amendments could result in higher nitrous oxide (N2O) emissions, contributing to global warming [13]. Average N2O fluxes in maize are relatively low (8 g N2O-N ha−1 d−1) at 90 kg N ha−1, but triple at 225 kg N ha−1 [14]. Application of organic sources will reduce the need for higher application of inorganic N, and studies are needed to establish the optimum ratio of N sourced from crop residue versus inorganic N for these coastal saline heavy soils. Crop residues are produced in abundance in cropping systems involving cereals, such as the rice–maize system, and their effective use will reduce the cost of production and environmental footprints while increasing productivity and profits.
Cultivation of dry season rice in the saline coastal region with the use of scarce groundwater results in increased pumping costs, salinity intrusion into aquifers, and build-up of soil salinity in topsoil. Dependence on groundwater is likely to increase in the future with the expansion of irrigated agriculture to meet the increasing national food production targets [15], and together with climate change, lead to further deterioration [16]. Water productivity of maize as a C4 crop is significantly higher (1.1–2.7 kg m−3) than C3 crops like wheat (0.6–1.7 kg m−3) and rice (0.6–1.6 kg m−3) [17]. Global warming is expected to further aggravate the impacts of abiotic and biotic stresses on wheat and rice, implying the increasing importance of maize in some Indian agricultural landscapes [18]. In a rice–maize cropping system, a proportion of the crop residue can be used as fodder while retaining adequate amounts to incorporate in the soil or to provide adequate mulch. This approach is particularly important for small-scale subsistent farmers, where livestock is an important component of their livelihood [19].
This study was conducted with the following hypotheses: (1) DSR with partial retention of crop residue from preceding dry season crop is more effective than conventional puddled transplanted rice in coastal zones; and (2) partial retention of rice crop residue after the wet season will improve soil health and reduce N and irrigation requirements of dry season maize compared with complete residue removal. The study aims to (1) assess the feasibility of increasing cropping intensity in salt-affected coastal areas with improved crop management practices; (2) validate the impact of partial crop residue retention on soil properties and crop productivity; and (3) establish nitrogen requirements for hybrid maize under different residue- and crop-management scenarios.

2. Materials and Methods

2.1. Location of the Study and Soil Characteristics

The experiment was conducted over three successive years (2016−2017, 2017–2018, and 2018−2019) at the ICAR-Central Soil Salinity Research Institute (CSSRI), Regional Research Station (RRS), Canning Town (22°18′ N, 88°40′ E and 3.5 m a.s.l.), West Bengal, India. The research station is located in the delta region of the river Ganges (Sundarbans). Canning Town has a tropical climate with an annual mean (1966–2017) daily maximum and minimum temperatures of 30.9 and 21.9 °C with coefficient of variation (CV) of 1.08 and 2.16%, respectively. Annual rainfall is 1833 mm (CV = 19.08%), 90% of which is received during the rainy season (June–October), with a mean annual of 100 rainy days (CV = 11.74%) driven by the southwest monsoon, starting in early June and peaking in July–August (Figure 1a). In the Ganges delta, rainfall varies spatially as well as seasonally, with 25% of the rainy days contributing more than 70% of the annual total precipitation in the coastal rainfed environment of Sundarbans [20]. Most of the cultivated land remains flooded during the wet season, leaving no other option but growing rice. During the dry season, irrigation is required for growing crops, as there are only a few torrential showers during this period. May and June are the hottest months, whereas December and January are the coolest. Winter is short, with minimum temperatures maintained above 10 °C (Figure 1b).
The soil is heavy textured (40% clay, 12% sand, and 48% silt) and saline during the dry season and early wet season. Average initial pH of the topsoil is 6.3 (range of 6.1 to 6.6), with a bulk density of 1.47 Mg m−3 and organic carbon content of 0.4%. The soil contains 153 kg ha−1 available nitrogen, 14 kg ha−1 available phosphorus, and 287 kg ha−1 available potassium. Soil salinity of the site is dynamic, being lowest during the monsoon season due to leaching and highest during the dry season due to the capillary rise of salts from brackish groundwater and deposition on the surface soil.

2.2. Experimental Design and Treatments

The experiment was conducted over three years (2016–2017, 2017–2018, and 2018–2019) in a split-plot design with three replications. A detailed description of the main-plot treatments is summarized in Table 1. Rice–maize cropping sequence, in combination with residue management, was used as the main-plot (Table 1). The rice variety Amal-Mana (145–155 days duration, 150–160 cm tall, long slender grain, moderately salt-tolerant in the range of 4.0–6.0 dS m−1) was grown during the wet season, whereas the hybrid maize variety Asha 3501, a double-cross with medium plant type, and 115–120 days duration, was grown during the dry season. The experiment was initiated in the wet season of 2016, after incorporating maize residue from a previous crop (grown in the same site during the dry season of 2015−2016) in the treatment with residue (+R). The experimental site was used for a rice–maize/rapeseed cropping system for the last three years preceding this study. For DSR, dry rice seeds (60 kg ha−1) were sown on 30 May, 22 May, and 28 May in 2016, 2017, and 2018, respectively, in lines using a seed drill with a row spacing of 20 cm. For PTR, seeds were soaked in water on 01 June 2016, 03 June 2017, and 01 June 2018, and germinated seeds were sown in a puddled nursery bed on 04 June 2016, 05 June 2017, and 04 June 2018, respectively, using 40 kg of seeds ha−1. Seedlings were manually transplanted into puddled soil on 10 July 2016, 13 July 2017, and 10 July 2018 in lines 20 cm apart; with 15 cm between hills within rows, and 2–3 seedlings per hill. A portion (40%) of previous maize crop residue (mostly dried leaves) was incorporated before sowing the rice seeds in DSR and during the puddling operation in PTR by using a power tiller each year.
Fertilizer for rice nursery was 5-3–1.5 kg N − P2O5 − K2O + 500 kg farmyard manure (FYM) for a 1000 m2 nursery area, and in the main rice field it was 50–20–10 kg N − P2O5 − K2O + 5000 kg FYM ha−1. Rice was harvested on 05 December 2016, 30 November 2017, and 02 December 2018, respectively. Rice residue (+R treatment) of respective plots was kept in a buffer zone until used, while all biomass was removed from the plots in −R treatment. The field was ploughed with a tractor-drawn nine tine cultivator to a depth of about 20 cm, and secondary tillage was done by a power tiller. Maize in the subsequent dry season was sown on raised beds (RBS) 60 cm wide at the base and 30 cm wide at the top, with mid-furrows 60 cm apart, and a furrow depth of 20 cm. The field was prepared during the first and second weeks of January 2017, 2018, and 2019, for the three maize crops. Sowing of maize and application of rice residues as mulch (+R treatment) were completed during the second week of January each year. For maize, a seed rate of 22 kg ha−1 was used with 60 cm between rows and 30 cm between plants within rows. The residue treatments were laid as mulching using 40% straw residue of preceding rice, and nitrogen treatments were applied as sub-plots for maize during the dry season. Complete details of nitrogen doses and application time are provided in Table 2, with 80 kg P2O5 and 40 kg of K2O ha−1 applied uniformly to all plots as basal. In the +R treatment, about 6 t ha−1 of crop residue (CR) per annum (Rice + maize) was retained, whereas in −R treatment all the crop biomass was removed from respective plots. Maize was harvested on 09 May 2017, 16 May 2018, and 14 May 2019. Cobs were removed after harvesting, and the rest of the residues were either removed (−R) or part of it was left in the field (+R).

2.3. Observations

2.3.1. Crop Growth, Yield Attributes, and Yield

Plant height (cm) was measured from the base of the stem to the tip of the longest leaf or the panicle if longer, and the mean height was calculated from measurements on 12 hills in each plot. The number of tillers per m2 was computed from 12 random hills at different growth stages, and average values were multiplied by the number of hills m−2. Root length of rice was determined on 12 hills from each plot, after carefully uprooting and washing roots by the spraying of water until the attached soil was removed. Root length was measured from the junction of the stem and root to the longest root tip for each hill and then averaged to determine the mean per plot.
Soil samples from the nursery and DSR plots were collected, and salt stress symptoms of rice seedlings in the nursery bed and under DSR − R and DSR + R treatments were evaluated at 25 days after sowing (DAS) following the modified standard evaluation scores system (SES) of IRRI [21], in which 1 corresponds to normal growth with no leaf symptoms and 9 when most plants are dead or dying. Yield components (panicles m−2, number of grains panicle−1, spikelet fertility, and 1000-grain weight) were determined. The number of panicles was counted in three randomly-selected areas of 1 m2 in each plot, and the average was used for statistical analysis. Ten panicles were randomly-selected from each plot to count the number of spikelets after hand-threshing. Filled spikelets (grains) and empty spikelets (chaff) were separated by submersion in water (floating spikelets considered empty), and then the number of grains and empty spikelets were counted. Fertility was calculated as the percentage of filled grains relative to the total number of spikelets. Grain and straw yields were determined at harvest on an area of 5 m × 2 m in the middle of each plot. Grains were sun-dried and weighed to determine grain yields (t ha−1) and 1000-grain weight, with both adjusted to 14% moisture content.
During the dry season, observations on yield components of maize (number of cobs plant−1, kernels cob−1, and 1000-kernel weight) were recorded at harvest. The number of cobs plant−1 was counted from 10 randomly-selected plants in each plot and averaged for analysis. The same cobs were used for determining the number of kernels cob−1 and 1000-kernel weight. Kernel and stover yields were determined by harvesting a net plot area of 10.0 m2, and kernel yield was expressed in t ha−1 at 12% moisture content.

2.3.2. Weed Biomass (g m−2)

Observations on weeds in the dry season maize crop were recorded at 60 DAS using a quadrate of 0.5 m × 0.5 m placed randomly at 3 spots in each plot. The data on weeds were square-root transformed (x + 0.5)1/2 for normal distribution before analyses.

2.3.3. Normalized Difference Vegetation Index (NDVI) and Photosynthesis Rate

The normalized difference vegetation index (NDVI) values of the crop canopy were recorded with a Trimble® GreenSeeker® handheld crop-sensing system. Net photosynthesis rate (Pn; μmol m−2 s−1) was measured with a CI-340 Ultra-Light Portable Photosynthesis System (CID BioScience Inc., 4901 NW Camas Meadows Drive, Camas, WA, USA) and was calculated using the equation Pn = W ⋅ (Co − Ci), where W = mass flow rate per unit leaf area (mol m−2 s−1), and Co (Ci) = outlet (inlet) CO2 concentrations (μmol mol−1). The NDVI and Pn were measured at monthly intervals from July to November each year. Pn was measured on the 3rd leaf from the top, on bright sunny days. The mean of two measurements taken from each plot was used for analysis.

2.3.4. Soil Salinity, Moisture Content, Bulk Density, Organic Carbon, and N Status

Initial soil samples were collected from the top 0–15 cm layer before the experiment, to determine soil texture [22], pH (1:2 soil water suspension using a digital pH meter), bulk density (BD), organic carbon (OC), and available N, P, and K. BD was determined by dividing dry soil weight with core volume [23]. Soil OC was determined following the Walkley and Black method [24], available N was determined by the alkaline potassium permanganate method [25], available P by sodium bicarbonate method following the procedure of Olsen et al., 1954 [26], and available K by the flame photometric method [24]. Soil samples were collected at monthly intervals for salinity assessment during both seasons, determined as the electrical conductivity of the saturation extract (ECe) [27] using a digital electrical conductivity meter (Systronics India Ltd., Ahmadabad, Gujarat, India). Immediately after harvest of rice in the third year (wet season, 2018), soil samples were collected from two soil depths (0–15 and 15–30 cm) for determination of soil moisture and BD following the core sampler method. Soil moisture was determined on a dry weight basis by recording fresh (wet) soil weight and after oven drying at 110 °C until constant weight. After harvesting maize in the third year (dry season, 2019), soil samples were collected from 0–15 cm soil depth to determine BD, OC, and available N using the same procedures followed for initial samples.

2.3.5. Soil Enzymes

Soil enzymes (dehydrogenase (µg TPF g−1 soil 24 h−1), alkaline phosphatase (µg p-NP g−1 soil h−1), urease (µg urea g−1 soil h−1), neutral phosphatase (µg p-NP g−1 soil h−1), acidic phosphatase (µg p-NP g−1 soil h−1)) and microbial biomass carbon (MBC) were determined at maturity for maize in the third-year. Fresh soil samples were collected on 1 May 2019 for analysis of soil enzymes and MBC. Sampling was done at appropriate soil moisture from 0 to 15 cm soil depth between two rows. For treatments with surface residue, the cover was removed before collecting soil samples. For each treatment, samples were collected from 5 to 7 sites, and a composite sample (1.0–1.5 kg soil) was made. Soil samples were kept in the fridge until laboratory analysis. Dehydrogenase (DHA) activity was determined by measuring triphenyl formazan produced during the reduction of 2,3,5-triphenyl tetrazolium chloride [28]. Phosphatase (acid, neutral, and alkaline) activity was assessed using the p-nitrophenyl phosphate [29]. The chloroform (CHCl3) fumigation–extraction method was used for the determination of MBC [30]. Soil urease activity was determined using the remaining urea method [31].

2.3.6. Irrigation Scheduling and Water Productivity (kg m−3)

Irrigation of maize was scheduled using a Chameleon soil water sensor, a resistance-type sensor that monitors soil water tension or suction with data reflected in colors: blue light in the suction range of 0–20 kPa (wet), green from 20–50 kPa (moist), and red when suction is >50 kPa (dry). A soil matric pressure of −33 kPa for field capacity and −1500 kPa (15 atm) for wilting point are commonly used, with field capacity of 10 kPa (0.10 atm) for sandy soil, and 33 kPa (0.33 atm) for clay soil [32].
For installation of the Chameleon soil water sensor, a small diameter (2.5 cm) auger, a tarpaulin (1 m length), a 1 m in length wooden dowel (<2.5 cm diameter), and a 60 cm long marked half-cut tube were used. This instrument has three sensors, each to be installed at one of 3 soil depths, namely 15, 30, and 60 cm. A hole was made with an auger keeping separately the soil collected from each depth. The sensor at each soil depth was pushed gently by the dowel, and soil of the respective depth was replaced. A portable handheld reader was connected to the sensor array that displays the soil moisture as colored lights, as described above [33]. Irrigation water was applied when the red light was displayed from the topsoil (15 cm) sensor and stopped when the waterfront reached the tail end of the plot. The time required for irrigating each plot was recorded, and the irrigation water (IW) applied (cm) was calculated based on the discharge rate of the pump. Irrigation water productivity (IWp), expressed as kg m−3, was calculated by dividing the maize kernel yield (kg) by the volume of irrigation water (m3).

2.4. Economics of Different Treatments

For each treatment, the total cost of operations and input was determined and used to calculate gross return (GR), net income (NI), and benefit/cost ratio (BCR) during each of the three years, both for rice and maize. The costs of inputs such as seed, mechanization, labor, fertilizer and organic manures, irrigation, pesticides, and interest on working capital were included as part of the cost of operations. The cost of labor for each year was based on the rates fixed by the Ministry of Labor and Employment, Government of India. Prices of seeds, fertilizers, and pesticides were determined using prevailing market prices. Gross returns were calculated based on grain yields as well as that of straw/stover. The minimum support prices of grains for rice and maize for the respective years were considered for GR. NI was obtained by subtracting the cost of operations and inputs from GR and BCR, calculated as the ratio of GR to the total cost. Values were computed in Indian rupees (INR) and converted into US dollars (1 USD = INR 71).

2.5. Statistical Analysis

Data were subjected to analysis of variance (ANOVA) with F-tests, and the least significant difference (LSD) at P = 0.05 was used for comparing differences between treatments [34]. The data were analyzed separately for each year using a split-plot design model, with the wet season rice crop establishment and residue management combination as the main plot, and dry season maize and N doses as the subplot. The analysis was performed using Statistical Tool for Agricultural Research (STAR) software, developed by the International Rice Research Institute (IRRI), using Eclipse Rich Client Platform and R language for crop scientists [35]. The data on weed biomass were square-root transformed before analyses [36].

3. Results

3.1. Performance of Rice in the Wet Season

In general, higher rice grain yield during the third year was observed as the rainfall was too low in the 2018 wet season during the initial growth stages (July–September) to cause any flooding/submergence stress (Figure 1a). Partial retention of maize crop residue (+R) in rice resulted in 13.5–16.7% and 15.4–17.1% increases in grain yield of rice under PTR and DSR, respectively, during the wet season of 2017 and 2018 (Table 3). In general, CR retention enhanced grain yield irrespective of the crop establishment method. In the third year, DSR + R increased grain yield by 17.1, 24.7, and 45.5% over that under DSR − R, PTR + R, and PTR − R, respectively. Variations in N application from 80 to 160 kg ha−1 in maize during the dry season did not depict any significant effect on the succeeding rice crop grain yields for the first two years. However, in the third year (2018 wet season), a significant effect was observed with 14.8, 24.9, and 30.7% higher rice grain yield over control (0 kg N ha−1) with applications of 80, 120, and 160 kg N ha−1 to maize, respectively (Table 3).

3.2. Soil Salinity and Soil Moisture during the Wet Season

At the beginning of the experiment (May–June, 2016), soil salinity was similarly high under both crop establishment methods, irrespective of residue management. From the next cropping season, plots with partial retention of crop residues (+R) showed lower soil salinity than −R plots, which was more pronounced during the third year, with 33.8% and 32.1% reduction in soil salinity due to +R over the −R treatments in DSR and PTR, respectively, averaged across seasons (Figure 2). Mean soil salinity during the third year was 2.15, 2.47, 3.25, and 3.64 dS m−1 for DSR + R, PTR + R, DSR − R, and PTR − R, respectively.
At the initial crop establishment period (germination to seedling establishment) in the nursery for PTR and in the main field for DSR, higher soil salinity seriously impacted seedling growth (Supplementary Photos S1 and S2) because of the high soil salinity at the beginning of the wet season in these coastal areas. Based on SES scores, salinity stress was the highest (SES 4.5–5.5) in the nursery bed, followed by DSR − R (SES 4.0–4.5), and the lowest in DSR + R (1.0–3.0). Salinity stress then progressively declined over the years in DSR + R (Figure 3). When crop residue was retained under DSR (DSR + R), soil salinity in May and June 2018 decreased to 3.8 and 2.8 dS m−1, respectively, compared to 6.3 dS m−1 under DSR − R. However, as the wet season progressed, salinity gradually declined through to September with increasing rainfall, then started to build up again starting in October, but to varying extents based on crop establishment and residue management (Figure 4).
After harvest of wet season rice in 2018, gravimetric soil moisture content (%) and soil bulk density (BD; g cm−3) were determined for 0–15 and 15–30 cm soil depths (Table 4). Soil moisture was higher in the upper soil layer (0–15 cm) under PTR treatment and higher in the deeper soil layer (15–30 cm) under DSR. This suggests that sowing of subsequent dry season maize could be started earlier after DSR. The crop establishment method had no effect on soil BD when crop residue was retained; however, upon removal of crop residue, soil BD was significantly higher under PTR than DSR in the third year.

3.3. Economics of the Wet Season Rice Crop

Irrespective of the residue management practices, DSR resulted in lower production costs and higher BCR than the conventional PTR method during the three years. Except for the cost of crop establishment, the remaining economic parameters were statistically at par during the first year. However, during the second and third years, significant differences were observed between different treatments, where net income and BCR were significantly higher under DSR + R in the second year, and similarly higher under both DSR − R and DSR + R in the third year (Table 5).
The higher cost of production in the treatment without residue (−R), in comparison with residue retention (+R), was due to the extra cost incurred in the management of algae and weeds in the former treatment. Different N levels applied during the dry season in maize did not affect the economics of wet season rice during the first two years; however, in the third year, the net income and BCR increased progressively with increasing N doses, with 120, and 160 kg N ha−1 showing similar effects.

3.4. Performance of Maize Crop during the Dry Season

Kernel and stover yields of dry season maize were influenced by crop establishment method, residue, and N management. The highest kernel yield (3.71–5.98 t ha−1) was observed under DSR + R − RBS + R treatment when crop residues were retained during both seasons, which was at par with PTR + R − RBS + R during the first two years but significantly higher in the third year. Residue retention in the third year resulted in a 16.7–17.1% increase in rice yield (Table 3) and a 13.2–21.4% increase in maize kernel yield (Table 6). The lowest kernel yield (3.06–4.68 t ha−1) was observed when crop residues were removed in both wet and dry seasons (PTR − R; RBS − R). Maize responded positively to increasing N application in all years, as both kernel and stover yields increased progressively with increasing N, up to 120 kg N ha−1 with a kernel yield of 3.93–6.18 t ha−1. Beyond 120 kg N ha−1, kernel yield response varied over the years (Table 6). The stover yield only increased up to 120 kg N ha−1 and remained at par with 160 kg N ha−1 in all years (Table 6).
Both main plot treatment (the wet season rice establishment and residue management) and sub-plot treatment (N) significantly affected yield attributes and yield of maize in the third year (Table 7). Yield attributes were higher under RBS + R (DSR + R) compared to other main plot treatments. However, kernels per cob and 1000-kernel weight were at par with those under RBS − R (DSR − R). The highest kernel yield of 5.07–5.98 t ha−1 was observed under RBS + R (DSR + R); however, the stover yield (7.95–8.95 t ha−1) was at par for RBS − R (DSR − R) and RBS + R (DSR + R). Maize kernel and stover yields increased significantly with increasing N up to 120 kg N ha−1 when residues were retained, with similar yields at 120, and 160 kg N ha−1.
Interaction of crop establishment method with crop residue management was significant for kernels cob−1, 1000-kernel weight, and kernel and stover yields in the second and third years (Table 7). When residue was removed, maize responded to N up to 160 kg ha−1, but when retained, the kernel yield at 120 kg N ha−1 was statistically at par with that at 160 kg N ha−1 (Table 7), suggesting a significant reduction in N requirement when crop residue was added.

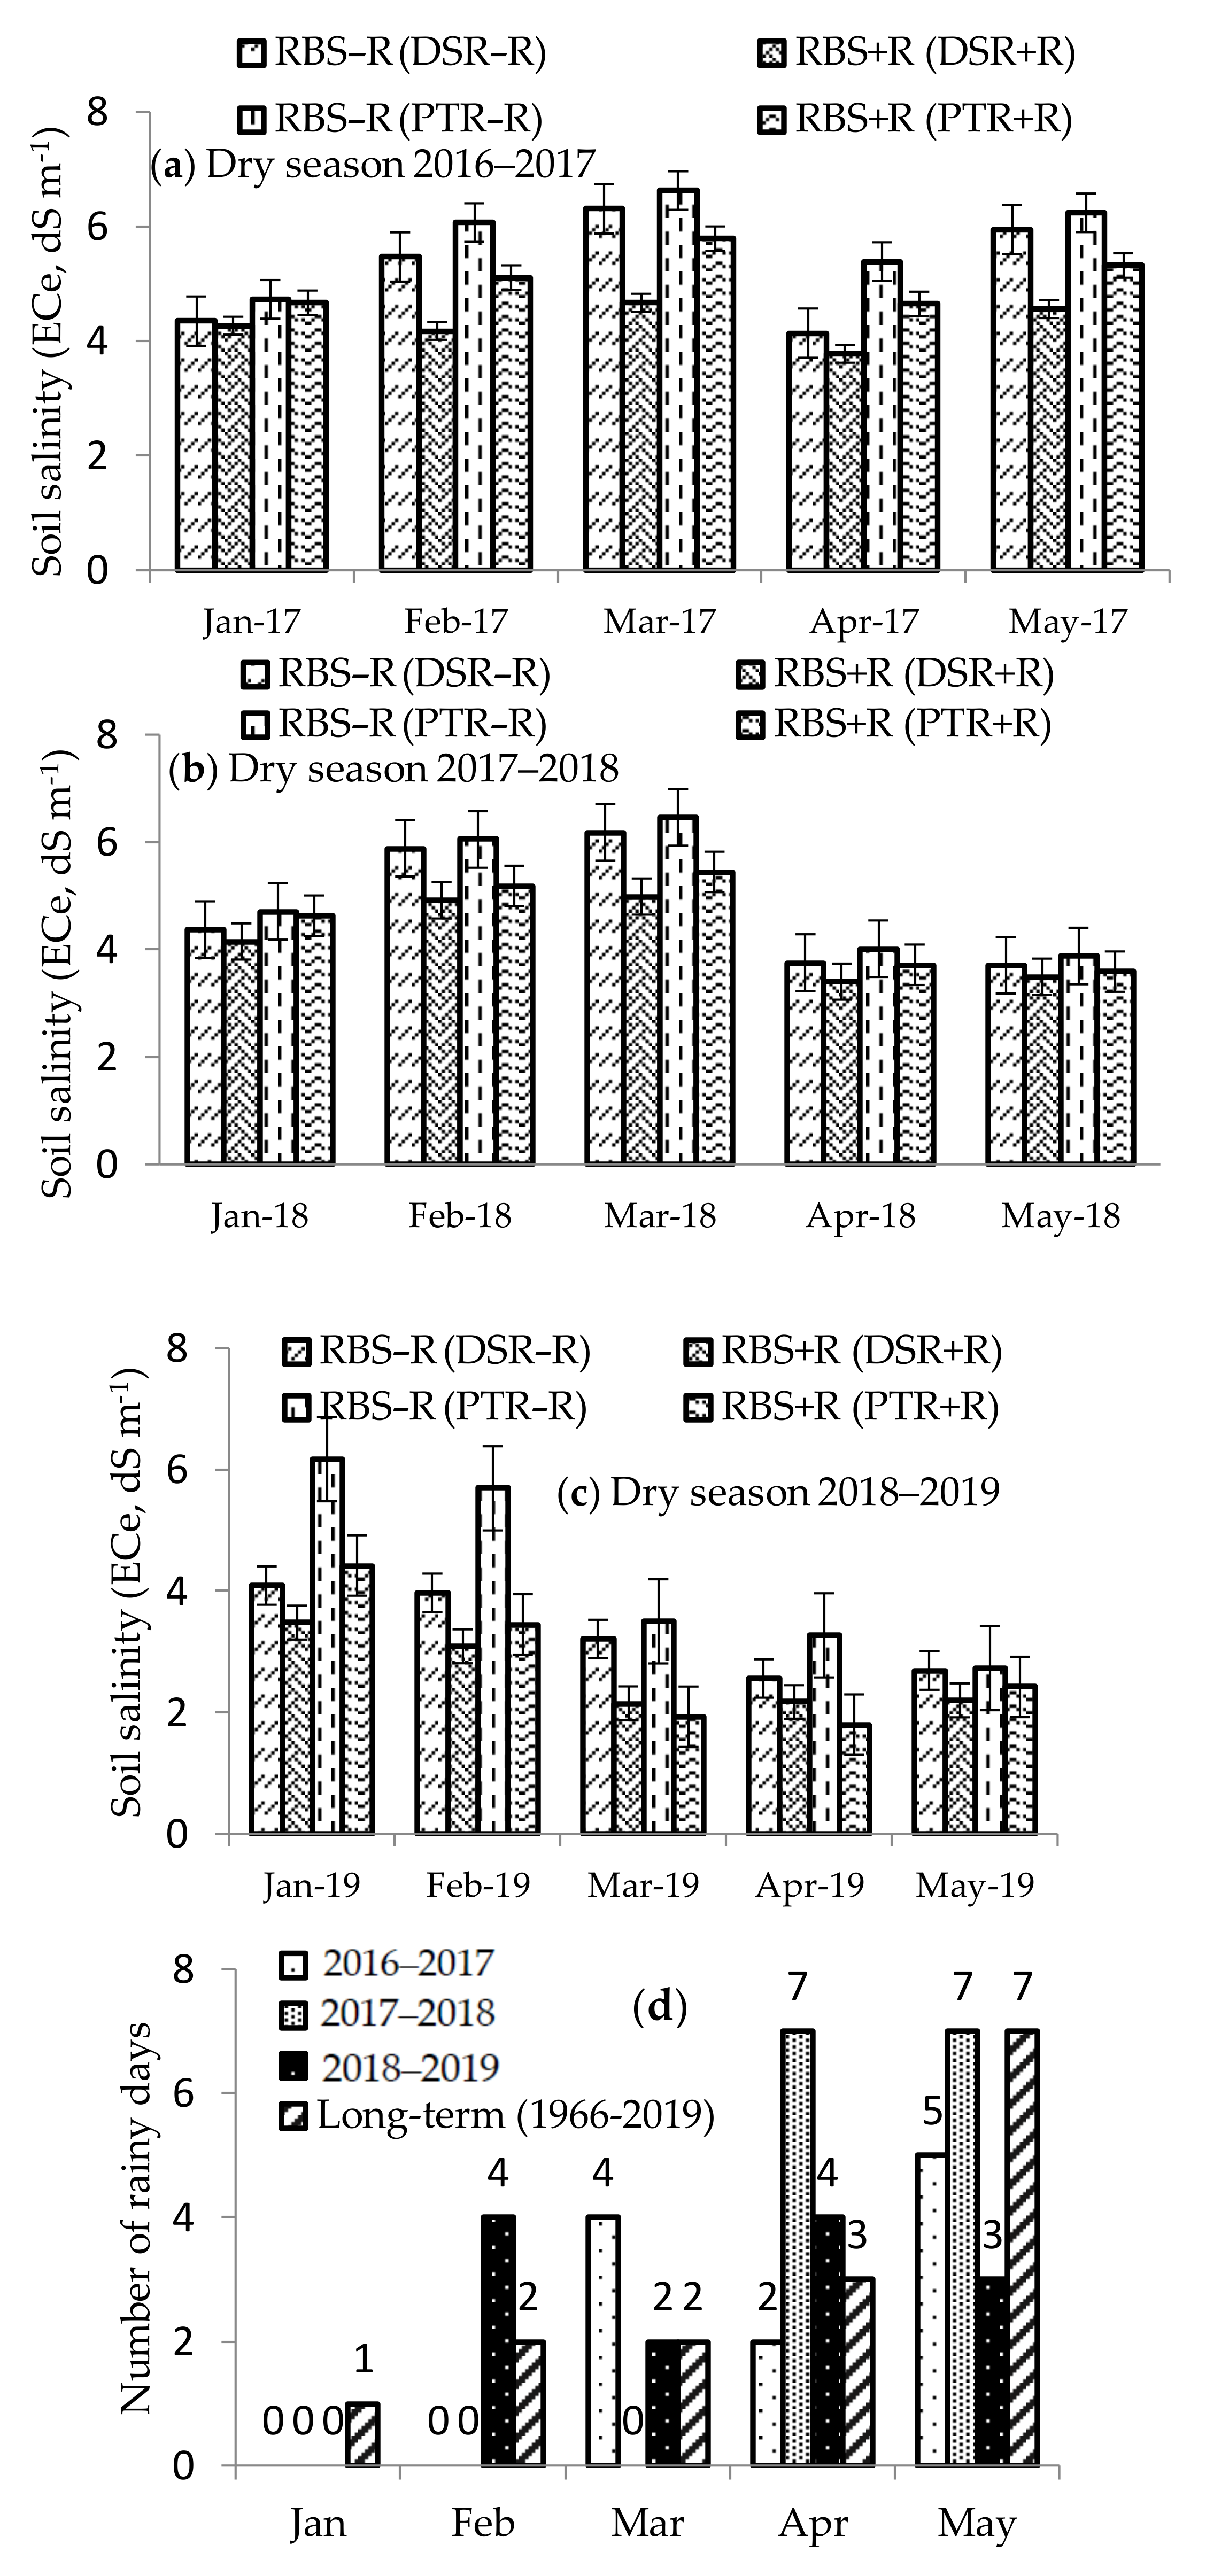
3.5. Soil Salinity during the Dry Season

Soil salinity was assessed at monthly intervals. Across the three years, salinity was lowest (4.29 dS m−1) under RBS + R (DSR + R) and highest (5.81 dS m−1) under RBS − R (PTR − R). Soil salinity in February 2017 varied from 4.18 dS m−1 under RBS + R (DSR + R) to 6.07 dS m−1 under RBS − R (PTR − R) (Figure 4a), and a similar trend was observed in March 2017. In 2017, rainfall (49 mm) during March and April (Figure 1a) reduced soil salinity during April. Soil salinity then increased during May, reaching 5.95, 4.56, 6.24, and 5.32 dS m−1 in the respective treatments of RBS − R (DSR − R), RBS + R (DSR + R), RBS − R (PTR − R), and RBS + R (PTR + R).
During the 2017–2018 season, the lowest mean soil salinity (4.2 dS m−1) was observed under RBS + R (DSR + R) treatment and the highest (5.1 dS m−1) under RBS − R (PTR − R). In 2018, soil salinity increased from February to March, but due to rainfall in April and May 2018 (each with 7 rainy days with 67.4 and 141.0 mm, respectively), it declined towards the end of the growing season (Figure 4b).
In the third maize crop (2018–2019), soil salinity in January 2019 decreased to 3.5 dS m−1 under RBS + R (DSR + R) compared to 6.2 dS m−1 under RBS − R (PTR − R) (Figure 4c). Even when all crop residues were removed from the system (−R), soil salinity decreased when the preceding rice crop was established by DSR rather than PTR; however, these differences were not significant when residues were partially retained. Similar trends in soil salinity variation were observed in February, March, and April 2019. However, due to high rainfall (187.6 mm) during 25–28 February 2019, soil salinity decreased during March 2019. Soil salinity was subsequently maintained at lower levels due to recurrent rainfall events in March (66.6 mm), April (99.2 mm), and May (83.8 mm) 2019, narrowing the differences between treatments. The number of rainy days in February and April 2019 was more than the long-term (1966–2019) average rainy days (Figure 4d).

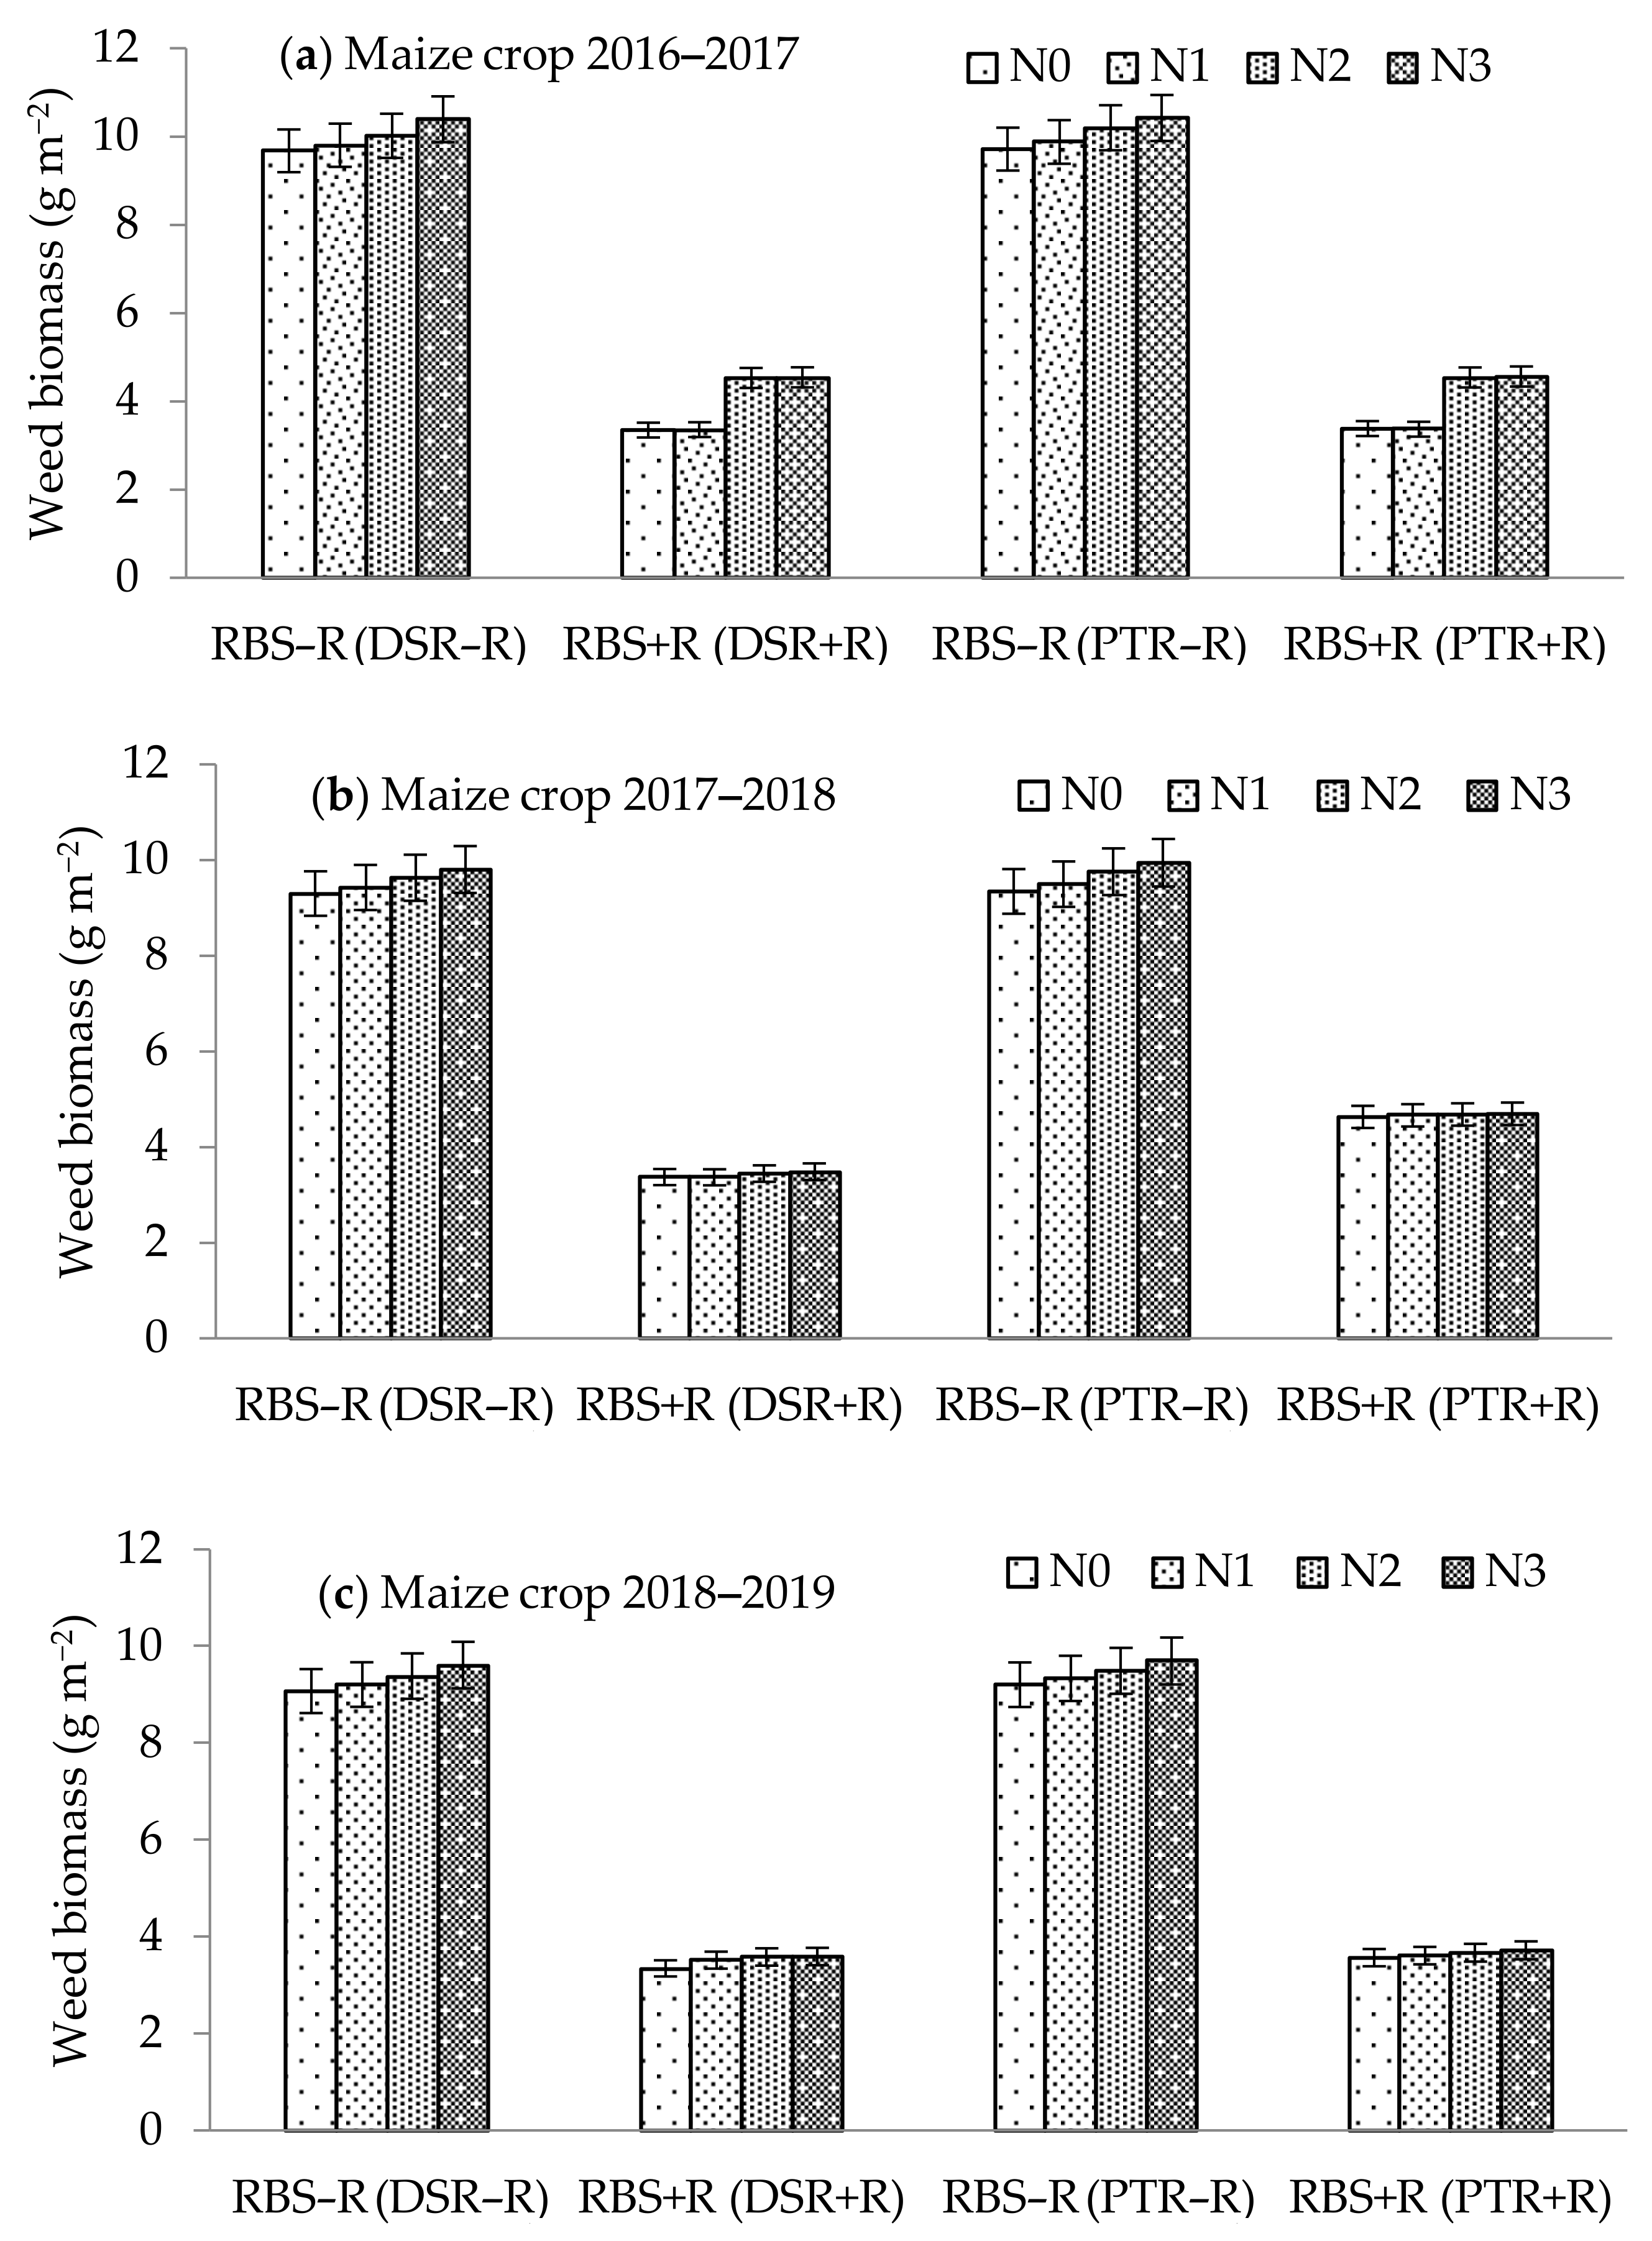
3.6. Effects on Irrigation Water Requirement and Weed Biomass in Maize during the Dry Season

The mean irrigation requirements of maize were 32, 41, 44, and 51 cm under RBS + R (DSR + R), RBS + R (PTR + R), RBS − R (DSR − R), and RBS − R (PTR − R), respectively, reflecting significant effects of both wet seasons’ rice crop establishment and residue management practices on water requirement of dry season maize. Water requirement was significantly lower (32 cm) following DSR, with residues partially retained in the soil during both seasons and was the highest (51 cm) following transplanted rice with no residue retained. Irrespective of the crop establishment method, partial retention of crop residues saved about 10–13 cm of irrigation water (Table 8).
When averaged over the years, the highest irrigation water productivity (kg m−3) was under the treatment combination RBS + R (DSR + R) and 120 or 160 kg N ha−1 (Table 9). Among the main plot treatments, DSR + R resulted in the highest water productivity (0.96–2.06 kg m−3), while PTR − R resulted in the lowest water productivity (0.51–0.96 kg m−3). The irrigation water productivity was the lowest when N was not applied (0.39–0.90 kg m−3) and then progressively increased with increasing N up to 120 kg ha−1.
Weed biomass assessed at 60 DAS, was the highest when residues were removed (−R) and increased further with increasing N application. Mulching significantly reduced weed biomass, with no significant effect of variation in N, especially in the last two seasons (Figure 5).

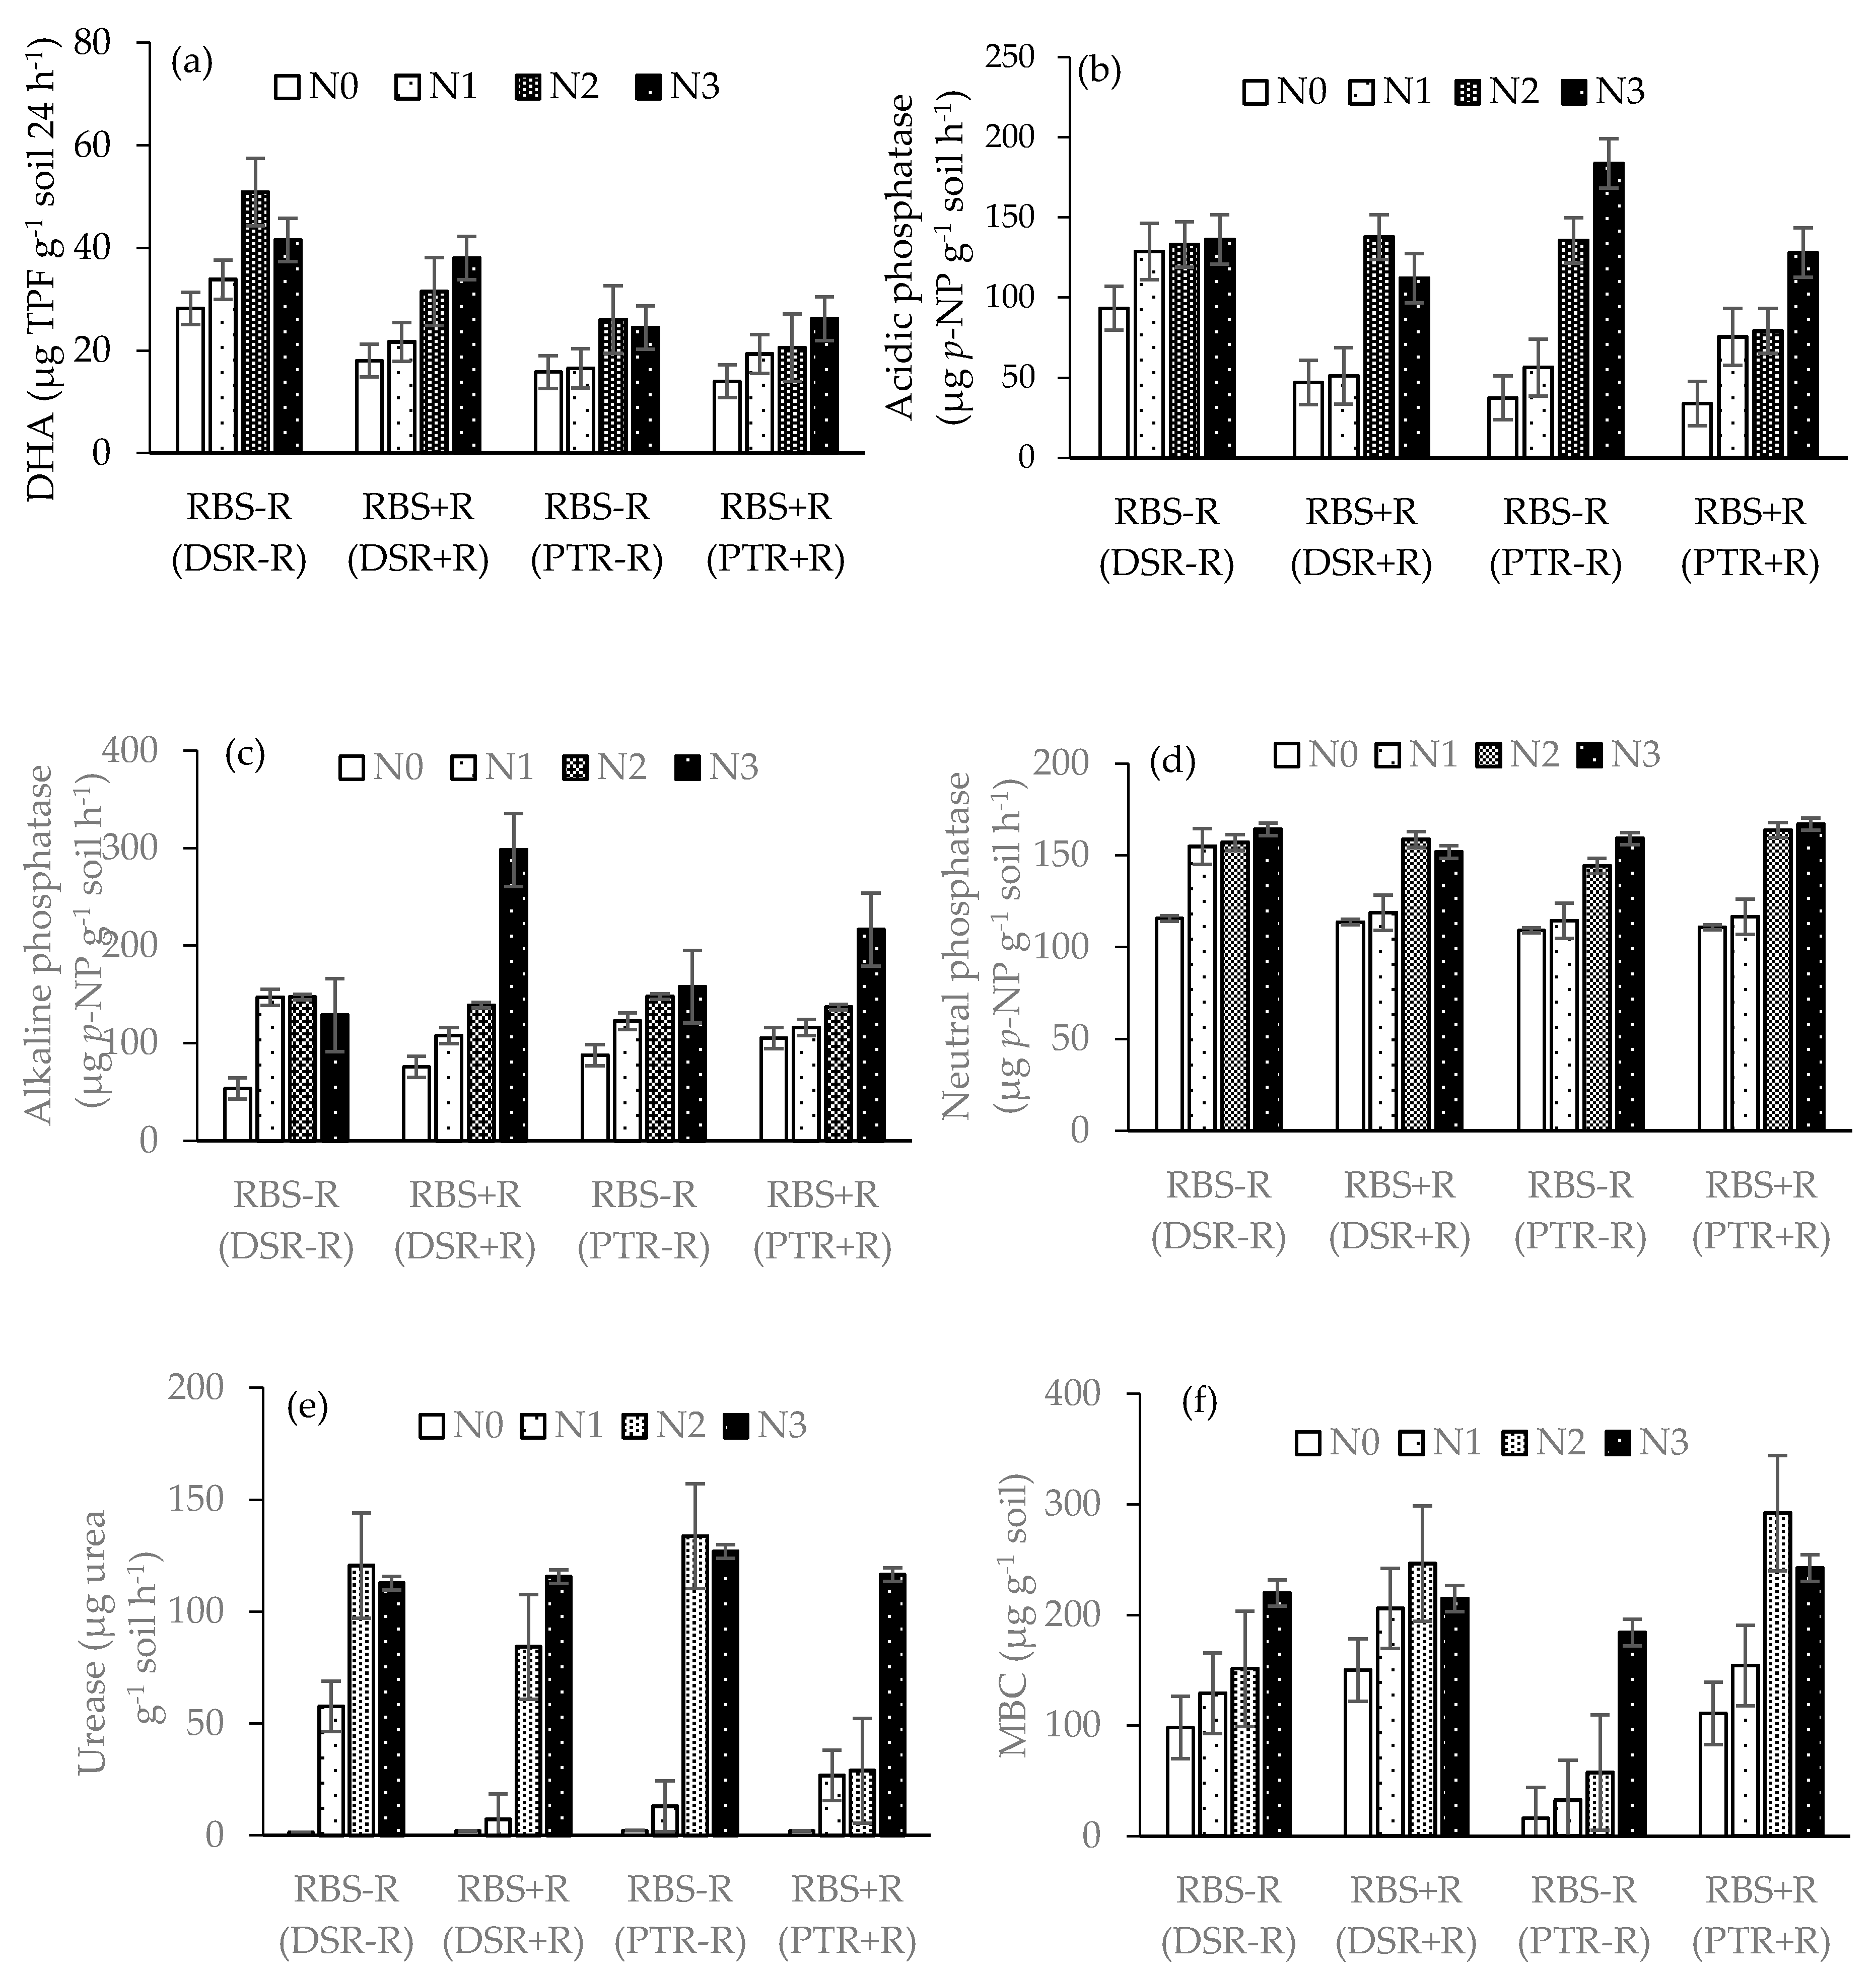
3.7. Soil Enzymes and Microbial Biomass Carbon in Maize as Affected by Crop Establishment, Residue Management Strategies, and N Levels during the Dry Season

Soil microbial enzymes (dehydrogenase (DHA), acid phosphatase, alkaline phosphatase, neutral phosphatase, and urease) and microbial biomass carbon (MBC) were determined at the end of the three-year rice–maize cropping sequence experiment. DHA activity was highest (38.0–41.5 µg TPF g−1 soil 24 h−1) in DSR compared to PTR (15.8–19.6 µg TPF g−1 soil 24 h−1). When the residue was retained (+R), soil DHA increased with increasing N, both under DSR and PTR (Figure 6a). When no N was applied to maize, acid phosphatase activity was highest (93.4 µg p-NP g−1 h−1) under RBS − R (DSR − R) and lowest (33.8 µg p-NP g−1 h−1) under RBS + R (PTR + R). With the application of 160 kg N ha−1, acid phosphatase activity was highest (183.8 µg p-NP g−1 h−1) under RBS − R (PTR − R) (Figure 6b). The highest activity of alkaline phosphatase (298.2 µg p-NP g−1 h−1) was under RBS + R (DSR + R) and 160 kg N ha−1 (Figure 6c). Under 0 N, neutral phosphatase activity was significantly high under DSR, irrespective of whether crop residue was retained or removed (Figure 6d). However, when using 160 kg N ha−1, the activity of neutral phosphatase was higher under PTR compared to DSR.
Soil urease activity was significantly affected by crop establishment, residues, and nitrogen management, as well as their interaction. Averaged over N treatments, soil urease activity was significantly higher under both DSR and PTR, when residues were removed, but when residues were retained, its activity was significantly higher under DSR (49.2 µg urea g−1 soil h−1) compared to PTR (39.9 µg urea g−1 soil h−1). With a progressive increase in N, there was a consistent increase in urease activity when averaged over crop establishment (DSR, PTR) and residue management (TR) treatments. When residues were removed (−R), the peak activity of urease was attained at 120 kg N ha−1, but when partially retained, the urease activity significantly increased up to 160 kg N ha−1 (Figure 6e). MBC was significantly higher (292 µg g−1) with the application of 120 kg N ha−1 to maize following PTR when residues were retained in both crops (RBS + R (PTR + R). At 160 kg N ha−1, MBC was highest under RBS + R (PTR + R) followed by RBS − R (DSR − R) (Figure 6f).

3.8. Effect of Crop Establishment, Residue Management, and N on Soil Bulk Density, Organic Carbon, and Available N during Maize Dry Season

Soil BD was significantly high (1.52 g cm−3) under the PTR − R treatment and decreased significantly where residues were retained (Table 10). Soil organic carbon (OC) was the lowest (0.38%) under PTR − R and increased significantly with the application of crop residues. Available N was highest under DSR + R (314 kg ha−1) and lowest under PTR − R (169 kg ha−1). Besides crop residues, the application of N to maize also increased available N, with significant effects up to 160 kg N ha−1 when residues were removed.

3.9. Economics of the Maize Crop Grown during the Dry Season with Different Management Options

The production cost of maize decreased significantly (USD 560 ha−1) when the preceding rice crop was sown through DSR, and the residue was partially retained in the system (DSR + R) (Table 11).
The net income (NI) and BCR were highest for RBS + R (DSR + R) compared to other treatments during all years. Although the production cost of maize increased with the increase in N application, the profit (NI and BCR) increased with the application of N up to 120 kg ha−1. The interaction of crop establishment–residue management and N on the NI and BCR was significant during the second and third years (Supplementary Table S4). With residue removal (−R), particularly under PTR during the wet season, the profit from dry season maize could only be increased with higher N (160 kg ha−1), but when residues were partially retained in the system (+R), maximum profit was with 120 kg N ha−1.

3.10. Economics of the Rice–Maize Cropping System in the Coastal Rainfed Environment

The economics of the rice–maize cropping system were studied from the wet season 2016 to the dry season 2018–19 (Table 12). The wet season crop establishment method with residue management and the dry season residue mulch and N had significant impacts on the cultivation cost, NI, and BCR in all years, with significant interactions during the second and third years. The cost of cultivation was lower when DSR was followed for wet season rice compared with PTR, irrespective of residue management in all years. NI was the lowest (USD 193.8–311.0 ha−1) in PTR − R and highest (USD 460–1206.4 ha−1) in DSR + R. A similar pattern was observed for BCR. Despite the increase in cost of production with increasing N application, the overall gross return, net income, and BCR were higher with higher N application because of increases in yield.
In the first year, NI and BCR were statistically at par for 120, and 160 kg N ha−1, whereas in the succeeding two years, though the direct effect on NI was the highest with 160 kg N ha−1, the interaction between crop establishment method (DSR vs. PTR) and residue management with N was significant, suggesting differential N requirements of maize, based on crop management method in the previous rice season and residue management. Irrespective of rice establishment method during the second year, the response was up to 160 kg N ha−1 in plots where residues were removed (−R). Economic returns of maize in the third year also increased with increasing N up to 160 kg N ha−1 when the previous rice crop was transplanted and residues were removed (PTR − R); otherwise, the responses were at par for 120, and 160 kg N ha−1 (Supplementary Table S5).

4. Discussion

Rice-based cropping system is the predominant agricultural production system in the coastal regions of India because rice is better adapted to the wet season conditions, with high rainfall and low-lying topographies, besides being the most preferred food of the majority of the inhabitants. Cropping intensity in this region is low (~125%) because of very few to no crops grown in the dry season when the soil and water become saline and fresh water is scarce. Hybrid maize provides an opportunity as a dry season crop in rotation with wet season rice [6]. Soil health is an important consideration, as soils in this region are inherently low in organic carbon and nitrogen, making it necessary to develop options that improve soil health and fertility in order to enhance and sustain productivity. This study assessed several management strategies under the rice–maize system in coastal saline regions of West Bengal.

4.1. Crop Establishment Practices for Rice during the Wet Season

Plant height was similar under PTR and DSR in the first year, but in the subsequent two years, plants established using DSR were taller than those using PTR (Supplementary Table S1). Taller plants during the wet season are desirable for waterlogging tolerance where rainfall is usually high in these rainfed coastal areas. Roots were also longer under DSR during the first two years but not in the third-year when rainfall was higher during June, saturating the soil for longer period and leading to slower root growth similar to that under PTR (Supplementary Table S1).
Puddling has been the dominant practice before transplanting in coastal regions to help in weed control and in ponding of water by creating an impervious subsurface layer. However, PTR elicits higher costs for seedling nurseries, puddling of the field, and transplanting. Transplanting requires large labor costs of about 300–350 man-h ha−1 (50–60 man-days ha−1), which is usually scarce and more expensive at peak periods of the season. Labor shortages for agricultural activities, particularly for rice transplanting, are being felt even more due to assured working days offered by the Indian Government under the Mahatma Gandhi National Rural Employment Guarantee Act (MGNREGA), 2005 [37]. In recent years, with incidences of higher rainfall events during transplanting, farmers had to practice re-transplanting for gap filling, incurring additional costs. DSR could provide an alternative crop establishment option to minimize the risk of submergence just after transplanting, especially when using varieties that are tolerant of flooding during germination [38,39]. One additional benefit of DSR in coastal areas is the reduction in production cost [6]. In this study, we observed a 17% increase in cost when using PTR (USD 605 ha−1) compared to DSR (USD 518 ha−1). Similarly, about 19% reduction in production cost was reported in a rice–wheat system by switching from the conventional practice of PTR–wheat to DSR–zero tillage wheat [40].

4.2. Crop Residue Management in Rice–Maize Cropping System Affects Yield, Soil Salinity, and Soil Physical Properties

Soil mulching with paddy straw in dry season maize and incorporation of maize stover in wet season rice showed several benefits. Grain yield of wet season rice increased by 14.6% with retention of 40% maize residues from the preceding season. It also resulted in higher NDVI values and net photosynthesis rate (Supplementary Figure S1), and a 41% reduction in soil salinity (from 3.64 to 2.15 dS m−1) (Figure 2, Figure 3 and Figure 4). More panicles (m−2) is the main trait associated with higher grain yield in rice under DSR + R (Supplementary Table S2). Panicles per m2 and grains per panicle were also higher during the third year in the plots when more N (>80 kg N ha−1) was applied to maize. Mulching is known to reduce evaporation, consequently reducing irrigation water requirements. It keeps the soil cooler during the summer and acts as an insulator through the cold winter months, minimizing the effects of fluctuating temperatures on plant roots. It also increases organic matter in the soil after breakdown of the mulch [41].
High soil salinity is a major constraint for dry season crops in coastal areas. In this study, the use of paddy straw as mulch for maize during the dry season reduced soil salinity from 5.81 dS m−1 (without mulching) to 4.29 dS m−1, and it suppressed weed growth (Figure 5), improved soil enzyme activity and MBC content (Figure 6), and enhanced soil properties (Table 11). The effect of paddy straw mulching in maize in reducing soil salinity was observed in all years. With the same initial date of irrigation, the mulched plots had higher soil moisture for a longer period (monitored by Chameleon sensors), whereas the non-mulched plots dry faster due to rapid evaporation. Kernel yield of maize significantly increased under RBS + R (DSR + R), mainly because of better soil moisture retention and reduced soil salinity. Kernels per cob were also affected by the wet season rice crop establishment methods and mulching, with the highest numbers of kernels (282–359) recorded under RBS + R − DSR + R treatment, whereas the lowest numbers (224–286) were under RBS − R − PTR − R treatment (Supplementary Table S3). Crop residue retention adds carbon and nutrients to soil and reduces evaporation, thereby curtailing the upward flow of salts and deposition in upper soil layers. The use of rice straw (more than 7 t ha−1) as a mulch in subsequent dry season crops has been advocated to improve yields and conserve soil moisture, with a positive impact on the environment [37,41]. Conserving soil moisture through mulching also improves water use through transpiration and water productivity [42]. An average yield of eight maize cultivars decreased by about 28% under salinity stress of 6–8 dS m−1, from 6.9 t ha−1 under control conditions to 4.9 t ha−1 under salt stress [43]. Retention of 40% crop residues in the system also improved soil fertility by increasing soil organic carbon from 0.4% to about 0.5% in the third year. This will have a positive long-term effect on soil health as well as crop input requirements. A significant positive correlation (R2 = 0.91, p < 0.001) between soil organic matter concentration and irrigation water productivity of maize crop was previously reported [44].

4.3. Nitrogen Requirements for Hybrid Maize in the Dry Season

Nitrogen is one of the most important yield-limiting nutrients for dry season crops in the coastal regions, because soils are inherently deficient in N. Optimum use of N is necessary to increase yield and improve N use efficiency to reduce impacts on groundwater and the environment, and to enhance profit for the mostly resource-poor farming communities living off coastal areas. This study showed that N requirements could be reduced and yields enhanced and sustained with retention of previous season crop residues. Nitrogen applied at 120 kg ha−1 is optimum for maize with retention of crop residue; otherwise, a higher rate of 160 kg ha−1 will be required for the same yield when crop residues are removed. N significantly improved several major yield components of maize hybrid, including cobs per plant, kernels per cob, and 1000-kernel weight (Supplementary Table S3). The interaction of crop establishment-cum-residue management with nitrogen on yield attributes was significant in the second and third years, indicating potential long-term cumulative positive effects of this treatment combination, especially in reducing N requirements. Developing a suitable rice-based cropping system together with the use of eco-friendly straw management practices will simultaneously improve productivity and economic benefits to farmers while reducing GHG emissions and other environmental impacts [45]. Improper N management, on the other hand, reduces growth and lowers kernel yield, because 60–70% of the total above-ground N uptake accumulates in maize grains [46,47]. In a nutrient omission trial, grain yield was lowest in the N-zero treatment, while the omission of P and K resulted in less losses, with yields closer to those achieved under N–P–K treatment, indicating a higher response to added N compared with P and K [48].
Nitrogen is, therefore, one of the main components of production costs for maize in coastal areas [49]. A recent study [50] showed that grain yield of maize substantially declined to only 1.62 t ha−1 when no N was applied, while higher yields of 4.72 to 4.88 t ha−1 were obtained with 120 to 180 kg N ha−1. With N and K deficiencies being common in salt-affected soils, application of both fertilizers is necessary to improve and maintain productivity in these coastal areas [51]. N requirements of maize varies with the application method and genotype [52]. Rice residue adds 35–45 kg N ha−1 and is a key consideration when attempting to optimize N fertility in conservation tillage systems [53], and its rate adjustment is essential when crop residues are incorporated. In degraded soils such as those in coastal areas with low OC, low N, and high salinity, using higher amounts of mineral fertilizers without organic amendments may only slightly improve or even worsen soil quality by hastening carbon loss and decreasing the C:N ratio [54].
Appropriate N management in saline soils is particularly important for maize yield, as under salinity stress, the antagonistic effects of chloride ions with nitrate ions reduced N uptake, leading to N deficiency [55]. For a sustainable rice–maize cropping system, appropriate conservation agriculture practices are required for higher input use efficiencies to improve soil health and profit to farmers [56,57,58]. The residual effect of N application to maize on subsequent rice crop was realized during the third year of the study, leading to taller plants, more tillers, more panicles per unit area, and more grains per panicle, when 120–160 kg N ha−1 was applied to maize, suggesting that application of N to any crop in the rotation will likely have a bearing on the system and should be considered when designing N management strategies for a sustainable cropping system.

4.4. Irrigation Requirement of Maize during the Dry Season

Irrigation water is scarce during the dry season in coastal areas, causing soil salinity to build up and making it difficult to grow dry season crops. On average, maize requires 877 L of water to produce 1 kg of grain (water productivity (WP) of 1.14 kg m−3), with the lowest requirement of 736 L kg−1 when rice straw is used as mulch, and the highest at 1176 L kg−1 without residue mulch (Table 9). Producing more grain yield with less water improves water productivity and overall agricultural sustainability [59]. Rice straw mulch significantly reduced weed biomass, irrespective of rice crop establishment method and N dose used with maize (Figure 5), especially during the early stages of growth, where weed biomass decreased from 13.2 g m−2 in the absence of mulching to 9.85 g m−2 with straw mulch [60].
Frequent irrigation during the dry season is necessary to leach the salts accumulating on the soil surface beyond the root zone. Use of improved salt-tolerant rice varieties developed recently [61] will be effective to sustain productivity but requires large quantities of irrigation water—about 21.6 cm of water is needed for land preparation, including puddling, and 107 cm of water from transplanting to harvest [15]. Far less water is required for maize (850 L kg−1 grain) compared to winter rice (3000 L kg−1 grain) and wheat (1000 L kg−1 grain). Apart from conservation of soil moisture, weed suppression also contributes towards a lower irrigation water requirement of dry season crops. Common annual weeds growing with crops transpire about four times more water than a crop plant and utilize up to three times as much water as do the crops to produce a pound of dry matter [62]. Application of N also had a significant effect on irrigation water productivity of maize, where it increased by about 68% with application of 80 kg N ha−1, compared to when no N was applied. An additional 40 kg N (total 120 kg N ha−1) resulted in another 18% increase in WP, with no further increase beyond this level. Crop water use efficiency had a positive quadratic relationship with the amount of applied N; however, there can be several response relationships between these two factors, and further studies are required under various climatic, soil, and crop management conditions with smaller increments in applied N [63].
In coastal areas, occasional rainfall during the dry season positively affects soil salinity and crop performance. During the three years of the dry season experiment, rainfall during April and May decreased soil salinity compared with March. This rain caused waterlogging in the experimental field; however, growing maize on raised beds (RBS) reduced the effect of waterlogging and even improved the crop growth, suggesting that maize RBS should be practiced in coastal areas when rainfall is uncertain.

4.5. Economics of the Rice–Maize Cropping System in Coastal Rainfed Areas

Partial application of residues of the preceding crop reduced the cost of production at the system level, irrespective of crop establishment methods, except for the cumulative positive effect of DSR that become significant in the third year. The reduction in the cost of weed control in both crops, algae in rice, irrigation water in maize, and labor to remove all crop residues before next season substantially reduced the total production cost of the rice–maize system. Direct-seeding of rice together with residue treatment reduced the total cost by 8.1% across the two seasons and increased net income by 64.5% compared to PTR with residue removed, with a net return of about USD 266 per ha per year. In a rice–wheat rotation, skipping soil puddling in rice added USD 200 to the net return ha−1 year−1 over conventional tillage-based rice–wheat rotation, primarily because of increased wheat yield; and retention of crop residue provided an additional net return of USD 146 ha−1 year−1 [64].
Nitrogen fertilizer is an important component of total production cost in maize and a yield-determining factor in these N-deficient coastal soils. Without its application, the system is not profitable, with very low BCR (1.1–1.2). BCR increased to 1.3–1.5 with the application of 80 kg N ha−1 and further to 1.4–1.7 with 120 kg N ha−1. In a rice–wheat system studied in eight locations covering five agro-climatic zones of six north Indian states, the mean marginal returns were higher (INR 836 per 100 kg N applied) with the application of N alone compared to combined application of N − P, N − K, N − P − K, N − P − K + Zn, and local farmers’ fertilizer management practices [65]. The analysis further revealed that farmers earned an additional INR 29,500 ha−1 across locations by investing INR 4800 ha−1 in N fertilizer [63]. Our results showed that beyond 120 kg N ha−1, the system economics is governed by residue management, particularly during the last two years of the study, suggesting cumulative benefits over the years. When crop residue is removed, the net income and BCR of the system became equivalent to that obtained under 120 kg N ha−1 plus residue only when N is increased to 180 kg ha−1. This suggests considerable savings on N with the use of 40% CR in both seasons.

5. Conclusions

About 19 cm of irrigation water was saved in dry season maize by switching from the present practice of puddled transplanted rice to dry seeded rice during the wet season, combined with partial (40%) crop residue retention in the rice–maize cropping system. Irrigation water productivity also increased from 0.74 kg m−3 to 1.66 kg m−3. Moreover, soil salinity decreased, and soil health improved with crop residue retention. The mean soil salinity in maize during the dry season decreased from 5.03 dS m−1 when residue was removed and rice was established by puddled transplanting (RBS − R (PTR − R)) to 3.70 dS m−1 when crop residue was partially retained and rice was directly seeded (RBS + R (DSR + R)).
The highest activity of soil alkaline phosphatase was observed under RBS + R (DSR + R) treatment with 160 kg N ha−1 applied to maize. Higher microbial biomass carbon (MBC) was also observed when residues were retained, both under DSR and PTR. Maize hybrid responded positively to increasing N application up to 160 kg N ha−1 when crop residues were removed; however, when the crop residues were partially retained, the optimum N requirement decreased to only 120 kg N ha−1. Combining the use of crop residues, proper N management, and crop establishment (direct dry seeding of rice and raised bed sowing of maize) will therefore enhance and sustain productivity of the rice–maize system in saline coastal areas. Adoption of these strategies will also reduce the vast areas currently left fallow and boost food security and income of the most impoverished farming communities living in these coastal saline zones.

Supplementary Materials

The following are available online at https://www.mdpi.com/2073-4395/10/12/2019/s1, Supplementary Table S1. Shoot and root length (cm) and tillers per m2 of rice; Supplementary Table S2. Yield attributes of rice crop; Supplementary Table S3. Yield attributes of dry season maize; Supplementary Table S4. Interactive effects of mulching and N on the economics of dry season maize production; Supplementary Table S5. Interactive effects on the economics of the rice–maize system; Supplementary Figure S1. Normalized difference vegetation index and net photosynthesis rate of wet season rice; Supplementary Photo S1. Effect of salinity on rice seedlings in the nursery; Supplementary Photo S2. Effect of salinity on rice seedlings in DSR plots.

Author Contributions

Conceptualization, S.K.S.; methodology, S.K.S., U.K.M., T.D.L., and K.K.M.; software, A.K.S.; validation, V.K. and A.K.S.; formal analysis, S.K.S., M.C., and A.M.I.; investigation, S.K.S., P.C.S., U.K.M., T.D.L., and K.K.M.; resources, S.K.S.; data curation, S.K.S., M.C., S.S., V.K., A.K.S., and A.M.I.; writing—original draft preparation, S.K.S. and S.S.; writing—review and editing, A.M.I. and V.K.; visualization, S.K.S.; supervision, P.C.S., A.M.I., and S.S.; project administration, P.C.S. and S.K.S.; funding acquisition, P.C.S. and S.K.S. All authors have read and agreed to the published version of the manuscript.

Funding

This work was funded under the institute (ICAR-CSSRI) research project entitled “Conservation Agriculture for Rice–Maize Cropping System in Coastal Saline Region” (Project code NRMACSSRISIL201600500903), with scientific and technical support from the International Rice Research Institute. PME Cell Reference No. Research Article/146/2020.

Conflicts of Interest

The authors declare no conflict of interest

Abbreviations

ANOVAanalysis of variance
BCRbenefit/cost ratio
BDbulk density
C:N ratiocarbon:nitrogen ratio
CRcrop residues
CSSRICentral Soil Salinity Research Institute
CVcoefficient of variation
DASdays after sowing
DHAdehydrogenase
DSRdirect-seeded rice
dSdeci Siemens
ECeelectrical conductivity of the saturation extract
FYMfarmyard manure
GHGgreenhouse gas
GRgross return
hahectare
ICARIndian Council of Agricultural Research
INRIndian rupees
IRRIInternational Rice Research Institute
IWirrigation water
IWpirrigation water productivity
kPakilopascal
LSDleast significant difference
MBCmicrobial biomass carbon
Mmeter
MGmegagrams
MGNREGAThe Mahatma Gandhi National Rural Employment Guarantee Act 2005
MTmillion tones
Nnitrogen
NDVInormalized difference vegetation index
NInet income
NSnot significant
NUEnitrogen use efficiency
OCorganic carbon
Pphosphorus
Pnnet photosynthesis rate
p-NPpara-nitrophenol
PTRpuddled transplanted rice
RBSraised bed sowing
RRSRegional Research Station
SESstandard evaluation score
SOCsoil organic carbon
STARStatistical Tool for Agricultural Research
TPFtriphenyl formazan
µgmicrogram

References

  1. Patra, B.C.; Ray, S.; Nagangham, U.; Mohapatra, T. Rice. In Genetic and Genomic Resources for Grain Cereals Improvement; Singh, M., Upadhyaya, H.D., Eds.; Academic Press: Cambridge, MA, USA, 2016; pp. 1–80. [Google Scholar]
  2. Singleton, G. Impacts of Rodents on Rice Production in Asia; IRRI Discussion Paper 45; International Rice Research Institute: Manila, Philippines, 2003; pp. 1–30. Available online: http://books.irri.org/971220183X_content.pdf (accessed on 7 October 2020).
  3. Gathala, M.K.; Ladha, J.K.; Saharawat, Y.S.; Kumar, V.; Kumar, V.; Sharma, P.K. Effect of tillage and crop establishment methods on physical properties of a medium-textured soil under a seven-year rice-wheat rotation. Soil Sci. Soc. Am. J. 2011, 75, 1851–1862. [Google Scholar] [CrossRef]
  4. Srinivasarao, C.; Kundu, S.; Lakshmi, C.S.; Rani, Y.S.; Nataraj, K.C.; Gangaiah, B.; Laxmi, M.J.; Babu, M.V.S.; Rani, U.; Nagalakshmi, S.; et al. Soil health issues for sustainability of South Asian agriculture. EC Agric. 2019, 5, 310–326. [Google Scholar]
  5. Serraj, R.; McNally, K.L.; Slamet-Loedin, I.; Kohli, A.; Haefele, S.M.; Atlin, G.; Kumar, A. Drought resistance improvement in rice: An integrated genetic and resource management strategy. Plant Prod. Sci. 2011, 14, 1–14. [Google Scholar] [CrossRef] [Green Version]
  6. Sarangi, S.K.; Singh, S.; Kumar, V.; Srivastava, A.K.; Sharma, P.C.; Johnson, D.E. Tillage and crop establishment options for enhancing the productivity, profitability, and resource use efficiency of rice-rabi systems of the salt-affected coastal lowlands of eastern India. Field Crops Res. 2020, 247, 107494. [Google Scholar] [CrossRef]
  7. Available online: https://economictimes.indiatimes.com/news/economy/agriculture/west-bengal-govt-to-raise-cultivation-of-maize-by-33/articleshow/71971381.cms (accessed on 7 October 2020).
  8. Maas, E.V. Salt tolerance of plants. Appl. Agril. Res. 1986, 1, 12–26. [Google Scholar]
  9. Gao, Y.; Lu, Y.; Wu, M.; Liang, E.; Li, Y.; Zhang, D.; Yin, Z.; Ren, X.; Dai, Y.; Deng, D.; et al. Ability to remove Na+ and retain K+ correlates with salt tolerance in two maize inbred lines seedlings. Front. Plant Sci. 2016, 7, 1716. [Google Scholar] [CrossRef] [Green Version]
  10. Hema, K.; Lakshmi, G.V.; Latha, M.; Sambaiah, A.; Meena, R.L. Screening of maize (Zea mays L.) hybrids for salt tolerance under drip irrigation in Krishna zone of Andhra Pradesh. J. Soil Sal. Water Qual. 2016, 8, 45–50. [Google Scholar]
  11. Raghu, P.T.; Erenstein, O.; Bober, C.; Krishna, V.V. Adoption and outcomes of hybrid maize in the marginal areas of India. Q. J. Int. Agric. 2015, 54, 189–214. [Google Scholar]
  12. Dey, P.; Sekhon, B.S. Nitrogen fertility status of the Indian soils vis-à-vis the world soils. Indian J. Fert. 2016, 12, 36–43. [Google Scholar]
  13. Rao, P.L.; Jayasree, G.; Pratibha, G.; Prakash, T.R. Impact of soil amendments on greenhouse gas emissions in maize (Zea mays L.). Int. J. Chem. Stud. 2017, 5, 1–6. [Google Scholar]
  14. Hoben, J.P.; Gehl, R.J.; Millar, N.; Grace, P.R.; Robertson, G.P. On-farm nitrous oxide response to nitrogen fertilizer in corn cropping system. Glob. Chang. Biol. 2010. [Google Scholar] [CrossRef]
  15. Sarangi, S.K.; Burman, D.; Mandal, S.; Maji, B.; Tuong, T.P.; Humphreys, E.; Bandyopadhyay, B.K.; Sharma, D.K. Reducing irrigation water requirement of dry season rice (boro) in coastal areas using timely seeding and short duration varieties. In Proceedings of the International Conference on Revitalizing the Ganges Costal Zone: Turning Science into Policy and Practices, Dhaka, Bangladesh, 21–23 October 2014; Humphreys, E., Tuong, T.P., Buisson, M.C., Pukinskis, I., Phillips, M., Eds.; CGIAR Challenge Program on Water and Food (CPWF): Colombo, Sri Lanka, 2015; pp. 68–79. [Google Scholar]
  16. Pathak, H.; Pramanik, P.; Khanna, M.; Kumar, A. Climate change and water availability in Indian Agriculture: Impacts and adaptation. Indian J. Agric. Sci. 2014, 84, 671–679. [Google Scholar]
  17. Zwart, S.J.; Bastiaanssen, W.G.M. Review of measured crop water productivity values of irrigated wheat, rice, cotton and maize. Agric. Water Manag. 2004, 69, 115–133. [Google Scholar] [CrossRef]
  18. Erenstein, O. The evolving maize sector in Asia: Challenges and opportunities. J. New Seeds. 2010, 11, 1–15. [Google Scholar] [CrossRef]
  19. Govaerts, B.; Sayre, K.D.; Deckers, J. Stable high yields with zero tillage and permanent bed planting? Field Crops Res. 2005, 94, 33–42. [Google Scholar] [CrossRef]
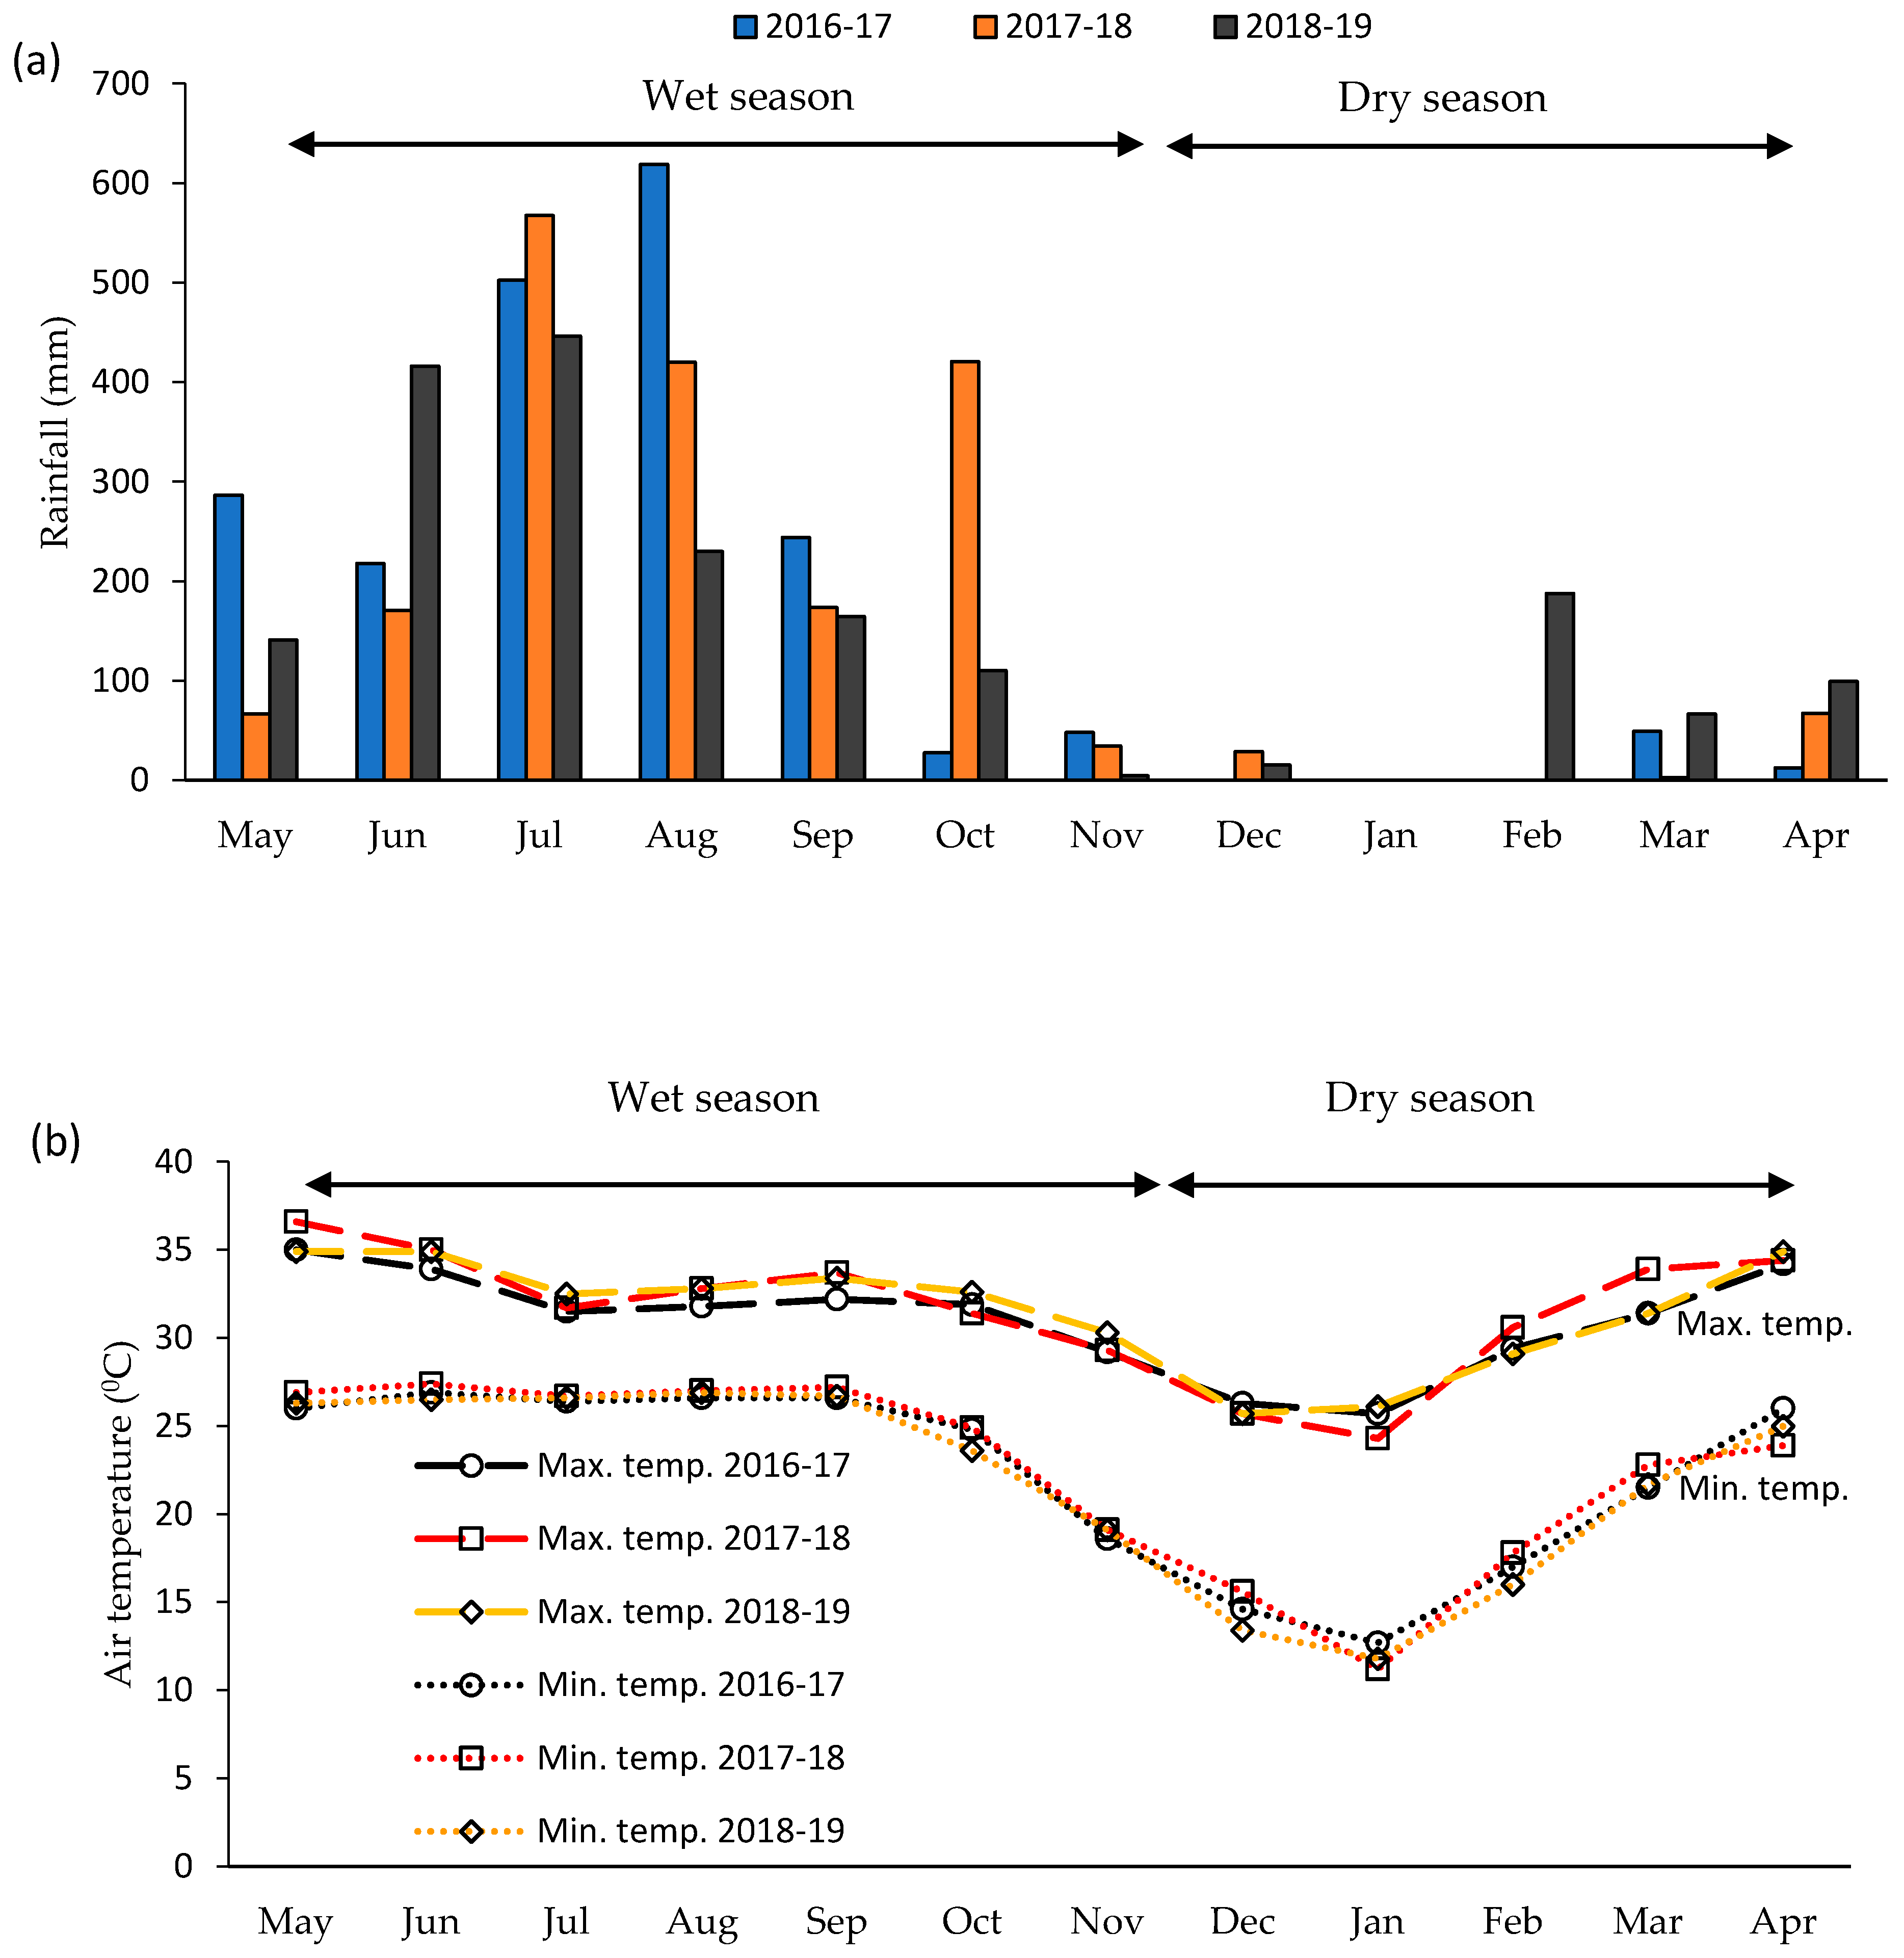
  20. Yu, Y.; Mainuddin, M.; Maniruzzaman, M.; Mandal, U.K.; Sarangi, S.K. Rainfall and temperature characteristics in the coastal zones of Bangladesh and West Bengal, India. J. Indian Soc. Coastal Agric. Res. 2019, 37, 12–23. [Google Scholar]
  21. International Rice Research Institute (IRRI). Standard Evaluation System for Rice (SES). 2002, p. 38. Available online: http://www.knowledgebank.irri.org/images/docs/rice-standard-evaluation-system.pdf (accessed on 7 October 2020).
  22. Gee, G.W.; Bauder, J.W. Particle size analysis. In Methods of Soil Analysis. Part 1. Physical and Mineralogical Methods, 2nd ed.; Agronomy Monograph, 9, Klute, A., Eds.; ASA and SSSA: Madison, WI, USA, 1986; pp. 404–408. [Google Scholar]
  23. Blake, G.R.; Hartge, K.H. Bulk density. In Methods of Soil Analysis. Part 1. Physical and Mineralogical Methods, 2nd ed.; Agronomy Monograph 9; Klute, A., Ed.; ASA and SSSA: Madison, WI, USA, 1986; pp. 364–367. [Google Scholar]
  24. Jackson, M.L. Soil Chemical Analysis; Prentice Hall of India Pvt. Ltd.: New Delhi, India, 1973; p. 183. [Google Scholar]
  25. Subbaiah, B.V.; Asija, G.I. A rapid procedure for determination of available nitrogen in soils. Curr. Sci. 1973, 28, 259–260. [Google Scholar]
  26. Olsen, S.R.; Cole, C.W.; Watanabe, F.S.; Dean, L.A. Estimation of Available Phosphorus in Soil by Extracting with NaHCO3; U.S.D.A. Circular: Washington, DC, USA, 1954; p. 939.
  27. Rhoades, J.D.; Chanduvi, F.; Lesch, S. Soil Salinity Assessment—Methods and Interpretation of Electrical Conductivity Measurements; FAO Irrigation and Drainage Paper 57; Food and Agriculture Organization of the United Nations: Rome, Italy, 1999; pp. 5–14. [Google Scholar]
  28. Casida, L.E., Jr.; Klein, D.A.; Santoro, T. Soil dehydrogenase activity. Soil Sci. 1964, 98, 371–376. [Google Scholar] [CrossRef]
  29. Dick, R.P.; Breakwell, D.P.; Turco, R.F. Soil enzyme activities and biodiversity measurements as integrative microbiological indicators. In Methods for Assessing Soil Quality; Doran, J.W., Jones, A.J., Eds.; SSSA Special Publication, 49; Soil Science Society of America: Madison, WI, USA, 1996; pp. 247–272. [Google Scholar]
  30. Vance, F.; Brookes, P.; Jenkinson, D. Microbial biomass measurements in forest soil: The use of the chloroform fumigation incubation method in strongly acid soils. Soil Biol. Biochem. 1987, 19, 697–702. [Google Scholar] [CrossRef]
  31. Douglas, L.A.; Bremner, J.M. Extraction and colorimetric determination of urea in soils. Soil Sci. Soc. Am. J. 1970, 34, 859–862. [Google Scholar] [CrossRef]
  32. Oliveira, R.A.; Ramos, M.M.; Acquino, L.A. Irrigation management. In Sugarcane: Agricultural Production, Bioenergy and Ethanol; Santos, F., Borem, A., Caldas, C., Eds.; Elsevier B.V.: Amsterdam, The Netherlands, 2015; pp. 161–183. [Google Scholar] [CrossRef]
  33. Stirzaker, R.J. A Traffic Light Soil Water Sensor for Resource Poor Farmers: Proof of Concept. 2014. Available online: https://aifsc.aciar.gov.au/projects/traffic-light-soil-water-sensor-resource-poor-farmers.html (accessed on 7 October 2020).
  34. Panse, V.G.; Sukhatme, P.V. Statistical Methods for Agricultural Workers; ICAR: New Delhi, India, 1978; pp. 145–156. [Google Scholar]
  35. Available online: http://bbi.irri.org/products (accessed on 3 July 2019).
  36. Gomez, K.A.; Gomez, A.A. Statistical Procedures for Agricultural Research, 2nd ed.; John Wiley & Sons: New York, NY, USA, 1984; pp. 304–306. [Google Scholar]
  37. Bhatt, R.; Kukal, S.S.; Busari, M.A.; Arora, S.; Yadav, M. Sustainability issues on rice-wheat cropping system. Int. Soil Water Conserv. Res. 2016, 4, 64–74. [Google Scholar] [CrossRef] [Green Version]
  38. Ismail, A.M.; Johnson, D.E.; Ella, E.S.; Vergara, G.V.; Baltazar, A.M. Adaptation to flooding during emergence and seedling growth in rice and weeds, and implications for crop establishment. AoB Plants 2012, 2012, pls019. [Google Scholar] [CrossRef]
  39. Ismail, A.M.; Ella, E.S.; Vergara, G.V.; Mackill, D.J. Mechanisms associated with tolerance of flooding during germination and early seedling growth in rice (Oryza sativa). Ann. Bot. 2009, 103, 197–209. [Google Scholar] [CrossRef] [PubMed] [Green Version]
  40. Nandan, R.; Singh, V.; Singh, S.S.; Kumar, V.; Hazra, K.K.; Nath, C.P.; Poonia, S.P.; Malik, R.K.; Singh, S.K.; Singh, P.K. Comparative assessment of different tillage-cum-crop establishment practices and crop-residue management on crop and water productivity and profitability of rice (Oryza sativa)—Wheat (Triticum aestivum) cropping system. Indian J. Agron. 2018, 63, 1–7. [Google Scholar]
  41. Sarangi, S.K.; Maji, B.; Sharma, P.C.; Digar, S.; Mahanta, K.K.; Burman, D.; Mandal, U.K.; Mandal, S.; Mainuddin, M. Potato (Solanum tuberosum L.) cultivation by zero tillage and paddy straw mulching in the saline soils of the Ganges Delta. Pot. Res. 2020. [Google Scholar] [CrossRef]
  42. Carvalho, K.S.; Vianna, M.S.; Nassif, D.S.P.; Costa, L.G.; Folegatti, M.V.; Marin, F.R. Effects of soil straw cover on evaporation, transpiration, and evapotranspiration in sugarcane cultivation. Aust. J. Crop Sci. 2019, 13, 1362–1368. [Google Scholar] [CrossRef]
  43. Molazem, D.; Azimi, J. Morpho-physiological characterization in eight varieties of maize (Zea mays L.) under soil salinity. Pol. J. Environ. Stud. 2015, 24, 2537–2542. [Google Scholar] [CrossRef] [Green Version]
  44. Fang, J.; Su, Y. Effects of soils and irrigation volume on maize yield, irrigation water productivity, and nitrogen uptake. Sci. Rep. 2019, 9, 7740. [Google Scholar] [CrossRef]
  45. Xia, L.; Xia, Y.; Li, B.; Wang, J.; Wang, S.; Zhou, W.; Yan, X. Integrating agronomic practices to reduce greenhouse gas emissions while increasing the economic return in a rice-based cropping system. Agric. Ecosyst. Environ. 2016, 231, 24–33. [Google Scholar] [CrossRef] [Green Version]
  46. Shrestha, J.; Chaudhary, A.; Pokhrel, D. Application of nitrogen fertilizer in maize in Southern Asia: A review. Peruv. J. Agron. 2018, 2, 22–26. [Google Scholar] [CrossRef]
  47. Bak, K.; Gaj, R.; Budka, A. Accumulation of nitrogen, phosphorus and potassium in mature maize under variable rates of mineral fertilization. Fragm. Agron. 2016, 33, 7–19. [Google Scholar]
  48. Timsina, J.; Jat, M.L.; Majumdar, K. Nutrient management research priorities in rice-maize systems of South Asia. Better Crop. 2010, 4, 4–6. [Google Scholar]
  49. Popin, G.V.; Santos, A.K.B.; Ferrao, E.; Lourenco, D.A.; Neto, M.S. Effect of organic N-sources on maize yield components. Aust. J. Crop. Sci. 2019, 13, 1215–1222. [Google Scholar] [CrossRef]
  50. Ahmad, S.; Khan, A.A.; Kamran, M.; Ahmad, I.; Ali, S.; Fahad, S. Response of maize cultivars to various nitrogen levels. Eur. J. Exp. Biol. 2018, 8, 1–4. [Google Scholar] [CrossRef]
  51. Farooq, M.; Hussain, M.; Wakeel, A.; Siddique, K.H.M. Salt stress in maize: Effects, resistance mechanisms and management—A review. Agron. Sustain. Dev. 2015, 35, 461–481. [Google Scholar] [CrossRef] [Green Version]
  52. Joshi, N.; Chandrashekar, C.P. Precision nutrient management in maize (Zea mays L.) under northern transition zone of Karnataka. J. Farm. Sci. 2017, 30, 343–348. [Google Scholar]
  53. Singh, Y.; Sidhu, H.S. Management of cereal crop residues for sustainable rice-wheat production system in the Indo-Gangetic plains of India. Proc. Indian Natl. Sci. Acad. 2014, 80, 95–114. [Google Scholar] [CrossRef]
  54. Ngosong, C.; Bongkisheri, V.; Tanyi, C.B.; Nanganoa, L.T.; Tening, A.S. Optimizing nitrogen fertilization regimes for sustainable maize (Zea mays L.) production on the volcanic soils of Buea Cameroon. Adv. Agric. 2019, 2019, 4681825. [Google Scholar] [CrossRef] [Green Version]
  55. Shahzad, M.; Witzel, K.; Zorb, C.; Muhling, K.H. Growth-related changes in subcellular ion patterns in maize leaves (Zea mays L.) under salt stress. J. Agron. Crop Sci. 2012, 198, 46–56. [Google Scholar] [CrossRef]
  56. Choudhary, M.; Jat, H.S.; Datta, A.; Yadav, A.K.; Sapkota, T.B.; Mondal, S.; Meena, R.P.; Sharma, P.C.; Jat, M.L. Sustainable intensification influences soil quality, biota and productivity in cereal-based agroecosystems. Appl. Soil Ecol. 2018, 126, 189–198. [Google Scholar] [CrossRef]
  57. Jat, H.S.; Datta, A.; Choudhary, M.; Sharma, P.C.; Yadav, A.K.; Choudhary, V.; Gathala, M.K.; Jat, M.L.; McDonald, A. Climate smart agriculture practice improve soil organic carbon pools, biological properties and crop productivity in cereal-based systems of North-West India. Catena 2019, 181, 104059. [Google Scholar] [CrossRef]
  58. Jat, H.S.; Choudhary, M.; Datta, A.; Yadav, A.K.; Meena, M.D.; Devi, R.; Gathala, M.K.; Jat, M.L.; McDonald, A.; Sharma, P.C. Temporal changes in soil microbial properties and nutrient dynamics under climate smart agriculture practices. Soil Till. Res. 2020, 199, 104595. [Google Scholar] [CrossRef] [PubMed]
  59. Djaman, K.; O’Neill, M.; Owen, C.K.; Smeal, D.; Koudahe, K.; West, M.; Allen, S.; Lombard, K.; Irmak, S. Crop evapotranspiration, irrigation water requirement and water productivity of maize from meteorological data under semiarid climate. Water 2018, 10, 405. [Google Scholar] [CrossRef] [Green Version]
  60. Singh, R.N.; Praharaj, C.S.; Kumar, R.; Singh, S.S.; Kumar, N.; Singh, U. Strengthening soil health under rice (Oryza sativa) fallows in Eastern Plateau of India with dwarf rice and moisture conservation practices. Indian J. Agric. Sci. 2018, 88, 61–70. [Google Scholar]
  61. Ismail, A.M.; Horie, M. Genomics, physiology, and molecular breeding approaches for improving salt tolerance. Ann. Rev. Plant Biol. 2017, 68, 405–434. [Google Scholar] [CrossRef] [Green Version]
  62. Abouziena, H.F.; El-Saeid, H.M.; Amin, A.A.E. Water loss by weeds: A review. Int. J. Chem. Tech. Res. 2014, 7, 323–336. [Google Scholar]
  63. Rudnick, D.; Irmak, S. Impact of water and nitrogen management strategies on maize yield and water productivity indices under linear-move sprinkler irrigation. Trans. ASABE 2013, 56, 1769–1783. [Google Scholar] [CrossRef] [Green Version]
  64. Jat, R.K.; Sapkota, T.B.; Singh, R.G.; Jat, M.L.; Kumar, M.; Gupta, R.K. Seven years of conservation agriculture in a rice-wheat rotation of Eastern Gangetic plains of South Asia: Yield trends and economic profitability. Field Crops Res. 2014, 164, 199–210. [Google Scholar] [CrossRef]
  65. Panwar, A.S.; Shamim, M.; Babu, S.; Ravishankar, N.; Prusty, A.S.; Alam, N.M.; Singh, D.K.; Bindhu, J.S.; Kaur, J.; Dashora, L.N.; et al. Enhancement in productivity, nutrients use efficiency, and economics of rice-wheat cropping systems in India through farmer’s participatory approach. Sustainability 2019, 11, 122. [Google Scholar] [CrossRef] [Green Version]
Figure 1. (a) Rainfall (mm) and (b) temperature (°C) recorded at ICAR-CSSRI RRS, Canning Town, during the cropping system experiment conducted in the wet and dry seasons for three consecutive years, from 2016 to 2019.
Agronomy 10 02019 g001
Figure 2. Soil salinity during the wet season rice as influenced by crop establishment and residue management during the wet season in a rice–maize cropping system trial at ICAR-CSSRI RRS, Canning Town, West Bengal, India from the wet season 2016 to the dry season 2018. Soil samples were collected at the same time for rice seedlings in the nursery for PTR and those in the main field for DSR. DSR, direct-seeded rice; −R, without residue; +R, with residue; PTR, puddled transplanted rice. Vertical error bars indicate ±SE.
Agronomy 10 02019 g002aAgronomy 10 02019 g002b
Figure 3. Visual SES scores of the salinity stress effects on rice at the seedling stage following the modified standard evaluation score (SES) of IRRI. Observations were made at the same time for seedlings in the nursery for PTR and in the main field for DSR. Vertical error bars indicate ±SE.
Agronomy 10 02019 g003
Figure 4. Soil salinity (0–15 cm depth) during the dry season (ac) as influenced by surface mulching of maize and preceding wet season rice crop establishment and residue management in a rice–maize cropping system; and (d) number of rainy days during dry season maize growing period. RBS, raised bed sowing; −R, without residue mulch during the dry season; +R, with residue mulch; DSR, direct-seeded rice; −R, without residue; +R, with residue; PTR, puddled transplanted rice during the wet season. Vertical error bars indicate ±SE.
Agronomy 10 02019 g004
Figure 5. Weed biomass in the dry season maize in (a) 2016–2017, (b) 2017–2018, and (c) 2018–2019 as affected by crop establishment, residue management, and nitrogen level (data are square-root transformed before analyses) in a cropping system experiment conducted at ICAR-CSSRI RRS, Canning Town. RBS, raised bed sowing; DSR, direct-seeded rice; −R, without residue mulch; +R, with residue mulch; PTR, puddled transplanted rice; N0, N1, N2, N3, refer to 0, 80, 120, and 160 kg N ha−1, respectively. Vertical error bars indicate ±SE.
Agronomy 10 02019 g005
Figure 6. Soil enzymes (a) DHA, (b) acid phosphatase, (c) alkaline phosphatase, (d) neutral phosphatase, and (e) urease; and (f) microbial biomass carbon (MBC) as affected by rice establishment method, residue, and nitrogen management of maize in rice–maize rotation system. DSR, direct-seeded rice; PTR, puddled transplanted rice; RBS, raised bed sowing; −R, without residue; +R, with residue, N0, N1, N2, N3, refer to 0, 80, 120, and 160 kg N ha−1, respectively. Vertical error bars indicate ±SE.
Agronomy 10 02019 g006
Table 1. Details of the crop establishment and residue management treatments followed in the rice–maize cropping system experiment conducted at ICAR-CSSRI, RRS Canning Town, from 2016 to 2019.
Treatment Abbreviation Rice * (Wet-Season)Maize # (Dry-Season)
1DSR − R followed by (RBS − R) ψDirect-seeding of rice (DSR) sown after complete removal of previous maize crop residue Raised bed sowing (RBS) without mulch
2DSR + R followed by (RBS + R) DSR with the incorporation of 40% residue of preceding maize crop RBS with mulching using 40% straw residue of preceding rice
3PTR − R followed by (RBS − R)Puddled transplanting (PTR) with complete removal of previous maize crop residueRBS without mulch
4PTR + R followed by (RBS + R) PTR with the incorporation of 40% residue of preceding maize cropRBS with mulching using 40% straw residue of preceding rice
ψ Abbreviations within parenthesis represent main-plot treatments during the dry season; * Amal-Mana (145–155 days); # Asha 3501 (115–120 days).
Table 2. Nitrogen scheduling for maize during dry seasons of 2016–2017 to 2018–2019 in a rice–maize cropping system.
TreatmentN Total
(kg ha−1)
Basal
(kg ha−1)
Four Leaf Stage
(kg ha−1)
Eight Leaf Stage
(kg ha−1)
Tasseling (kg ha−1)Grain Filling (kg ha−1)
N0000000
N180162024164
N2120243036246
N3160324048328
Table 3. Rice straw and grain yield as affected by crop establishment and residue incorporation in the wet season, and straw mulching and N management in the succeeding maize crop during the dry season in a cropping system experiment conducted at ICAR-CSSRI RRS, Canning Town, West Bengal, India from the wet season of 2016–2017 to the dry season of 2018–2019.
Treatment201620172018
Grain Yield
(t ha−1)
Straw Yield
(t ha−1)
Grain Yield
(t ha−1)
Straw Yield
(t ha−1)
Grain Yield
(t ha−1)
Straw Yield
(t ha−1)
Crop establishment method and residue management (TR) during the wet season
DSR * − R3.256.673.456.466.268.61
DSR + R3.717.323.987.167.339.72
PTR − R3.616.103.475.905.048.25
PTR + R3.915.983.946.765.888.45
LSD0.05ns #ns0.390.570.820.40
Nitrogen doses in maize (N) during the dry season
N0 $3.636.513.686.565.218.84
N1 3.656.513.716.565.988.95
N2 3.646.523.716.576.518.38
N3 3.656.523.746.576.818.86
LSD0.05nsnsnsns0.50ns
TR × Nnsnsnsnsnsns
* DSR, direct-seeded rice; −R, without residue; +R, with residue; PTR, puddled transplanted rice; $ N0, N1, N2, N3, refer to 0, 80, 120, and 160 kg N ha−1, respectively; # ns, not significant.
Table 4. Effect of crop establishment and residue management on soil moisture and soil bulk density at two soil depths in a rice–maize cropping system experiment conducted at ICAR-CSSRI RRS, Canning Town, from the wet season of 2016 to the dry season of 2018–2019.
TreatmentSoil Moisture (%)Soil Bulk Density (g cm−3)
0–15 cm Depth15–30 cm Depth0–15 cm Depth15–30 cm Depth
Crop establishment method and residue management (TR) during the wet season
DSR * − R32.3229.361.311.45
DSR + R33.9530.811.301.43
PTR − R35.6726.581.381.51
PTR + R35.9928.551.311.45
LSD0.052.402.500.030.05
Nitrogen doses in maize (N)
N0 $35.3728.501.331.48
N1 35.3028.741.301.48
N2 35.0129.021.311.45
N3 32.2529.051.371.44
LSD0.051.33ns #0.03ns
Note: Soil samples were collected after the end of the wet season 2018; * DSR, direct-seeded rice; −R, without residue; +R, with residue; PTR, puddled transplanted rice; $ N0, N1, N2, N3, refer to 0, 80, 120, and 160 kg N ha−1, respectively; # ns, not significant.
Table 5. Cost statistics of rice production (USD ha−1) as influenced by the crop establishment method and residue management during the wet season, and under different N management in succeeding maize crops during the dry season in a rice–maize cropping system experiment conducted at ICAR-CSSRI RRS, Canning Town, West Bengal, India from the wet season 2016 to the dry season 2018–2019.
Treatment201620172018
Cost of ProductionNet IncomeBCR ψCost of ProductionNet IncomeBCRCost of ProductionNet IncomeBCR
Crop establishment method and residue management (TR) during the wet season
DSR * − R461.4216.51.47484.0172.61.36602.6575.61.96
DSR + R453.1302.91.67470.9272.91.58634.3733.62.16
PTR − R550.1197.51.36578.080.31.14710.4243.51.34
PTR + R524.7201.21.38546.9189.01.35719.6378.31.52
LSD0.05 1.5ns #ns1.071.40.145.0149.30.24
Nitrogen doses in maize (N) during the dry season
N0 $497.3229.61.47519.9172.51.34666.8314.21.49
N1 497.4230.21.47519.9178.71.36664.8458.51.72
N2 497.3229.61.47520.0179.31.36667.6550.51.85
N3 497.3228.61.47520.0184.31.37667.7607.61.93
LSD0.05 nsnsnsnsnsnsns90.10.14
TR × Nnsnsnsnsnsnsnsnsns
* DSR, direct-seeded rice; −R, without residue; +R, with residue; PTR, puddled transplanted rice; $ N0, N1, N2, N3, refer to 0, 80, 120, and 160 kg N ha−1, respectively; # ns, not significant; ψ BCR, benefit/cost ratio.
Table 6. Kernel and stover yields of dry season maize as affected by preceding wet season rice crop establishment method, residue management, surface mulching, and nitrogen management during the dry season, in a rice–maize cropping system experiment conducted at ICAR-CSSRI RRS, Canning Town, from the wet season 2016 to the dry season 2018–2019.
Treatment2016–20172017–20182018–2019
Kernel Yield
(t ha−1)
Stover Yield
(t ha−1)
Kernel Yield
(t ha−1)
Stover Yield
(t ha−1)
Kernel Yield
(t ha−1)
Stover Yield
(t ha−1)
Crop establishment method and residue management (TR) during the wet season
RBS ψ − R
(DSR − R)
3.065.015.048.114.487.95
RBS + R
(DSR + R)
3.716.545.989.525.078.95
RBS − R
(PTR – R)
3.063.814.687.883.596.85
RBS + R
(PTR + R)
3.525.935.878.274.367.88
LSD0.05 0.411.040.370.890.491.32
Nitrogen doses in maize (N) during the dry season
N0 $1.932.963.447.222.535.61
N1 3.415.425.538.194.157.80
N2 3.936.216.189.015.179.01
N3 4.076.706.419.365.669.21
LSD0.05 0.370.710.190.390.530.50
TR × Nns #ns*******
ψ RBS, raised bed sowing; −R, without residue; +R, with residue; DSR, direct-seeded rice; PTR, puddled transplanted rice during wet season; $ N0, N1, N2, N3, refer to 0, 80, 120, and 160 kg N ha−1, respectively; # ns, not significant; * significant at p < 0.05; ** significant at p < 0.01.
Table 7. Kernel yield (t ha−1) of dry season maize as affected by crop establishment method and residue management of the preceding wet season rice, and by mulching and nitrogen management in the dry season, in a rice–maize cropping system experiment conducted at ICAR-CSSRI RRS, Canning Town from the wet season 2016 to the dry season 2018–2019.
Treatment (TR)N0 $N1N2N3MeanComparsonLSD0.05
2017–2018
RBS ψ − R
(DSR * − R)
3.074.456.036.615.04TR means0.37
RBS + R
(DSR + R)
4.176.446.736.585.98N means0.19
RBS − R
(PTR − R)
2.614.985.335.794.68(TR × N) *0.37
RBS + R
(PTR + R)
3.906.276.646.655.87(TR × N) **0.41
Mean3.445.536.186.41
2018–2019
RBS − R
(DSR − R)
3.064.584.795.504.48TR means0.49
RBS + R
(DSR + R)
3.285.225.815.975.07N means0.53
RBS − R
(PTR − R)
1.693.533.765.393.59(TR × N) *1.06
RBS + R
(PTR + R)
2.083.266.335.774.36(TR × N) **0.87
Mean2.534.155.175.66
* Comparison of two sub-plot means at the same main-plot treatment (TR × N); ** comparison of two main-plot means at the same or different sub-plot treatment; ψ RBS, raised bed sowing; −R, without residue mulch; +R, with residue mulch; * DSR, direct-seeded rice; −R, without residue; +R, with residue; PTR, puddled transplanted rice during the wet season; $ N0, N1, N2, N3, refer to 0, 80, 120, and 160 kg N ha−1, respectively.
Table 8. Irrigation water requirement of the dry season maize as influenced by mulching and nitrogen management, and preceding wet season rice crop establishment methods and residue management in a rice–maize cropping system experiment conducted at ICAR-CSSRI RRS, Canning Town, from the wet season of 2016 to the dry season of 2018–2019.
TreatmentIrrigation Water Requirement (cm)
2016–20172017–20182018–2019Mean
Crop establishment method and residue management (TR) during the preceding wet season rice
RBS ψ − R
(DSR * − R)
54.9840.5537.0644.20
RBS + R
(DSR + R)
39.0029.4726.1231.53
RBS − R
(PTR − R)
60.0048.7944.1050.96
RBS + R
(PTR + R)
49.4738.3234.4240.74
LSD0.051.682.051.241.59
Nitrogen doses in maize (N) during the dry season
N0 $51.6140.0936.0242.57
N1 50.5139.1135.0841.57
N2 50.5438.8835.3341.58
N3 50.7839.0535.2741.70
LSD0.05ns #nsns0.68
TR × Nnsnsnsns
ψ RBS, raised bed sowing; −R, without residue mulch; +R, with residue mulch; * DSR, direct-seeded rice; PTR, puddled transplanted rice during the wet season; $ N0, N1, N2, N3, refer to 0, 80, 120, and 160 kg N ha−1, respectively; # ns, not significant.
Table 9. Irrigation water productivity (kg m−3) of dry season maize as influenced by mulching and nitrogen management during the dry season, and preceding wet season rice crop establishment and residue management method in a rice–maize cropping system experiment conducted at ICAR-CSSRI RRS, Canning Town, from the wet season of 2016 to the dry season of 2018–2019.
Treatment (TR)N0 $N1N2N3MeanComparisonLSD0.05
2016–2017
RBS ψ − R
(DSR @ − R)
0.380.610.600.650.56TR means0.14
RBS + R
(DSR + R)
0.610.811.211.220.96N means0.07
RBS − R
(PTR − R)
0.200.590.620.610.51(TR × N) *0.13
RBS + R
(PTR + R)
0.360.750.830.890.71(TR × N) **0.15
Mean0.390.690.820.840.68
2017–2018
RBS − R
(DSR − R)
0.751.101.501.621.24TR means0.16
RBS + R
(DSR + R)
1.332.152.352.402.06N means0.09
RBS − R
(PTR − R)
0.531.031.101.180.96(TR × N) *0.18
RBS + R
(PTR + R)
1.011.661.751.731.53(TR × N) **0.19
Mean0.901.481.671.731.45
2018–2019
RBS − R
(DSR − R)
0.811.241.301.401.19TR means0.15
RBS + R
(DSR + R)
1.202.022.272.331.96N means0.17
RBS − R
(PTR − R)
0.380.810.851.000.76(TR × N) *0.34
RBS + R
(PTR + R)
0.600.961.831.471.22(TR × N) **0.27
Mean0.751.261.561.551.28
* Comparison of two sub-plot means at the same main-plot treatment (TR × N); ** comparison of two main-plot means at the same or different sub-plot treatment; ψ RBS, raised bed sowing; −R, without residue mulch; +R, with residue mulch; @ DSR, direct-seeded rice; PTR, puddled transplanted rice during the wet season; $ N0, N1, N2, N3, refer to 0, 80, 120, and 160 kg N ha−1, respectively.
Table 10. Effect of crop establishment and residue management of wet season rice, and residue and nitrogen management of dry season maize on soil bulk density, soil organic carbon, and available N in a rice–maize cropping system experiment conducted at ICAR-CSSRI RRS, Canning Town, from the wet season of 2016 to the dry season of 2018–2019.
TreatmentBD (g cm−3)OC (%)Available N (kg ha−1)
Crop establishment method and residue management (TR) during the wet season
RBS ψ − R
(DSR − R)
1.460.46184.7
RBS + R
(DSR + R)
1.420.54314.0
RBS − R
(PTR − R)
1.520.38168.7
RBS + R
(PTR + R)
1.450.49251.4
LSD0.050.050.0324.75
Nitrogen treatments in maize (N) during the dry season
N0 $1.450.46213.8
N1 1.470.46225.8
N2 1.460.47232.4
N3 1.470.48246.7
LSD0.05ns #ns10.17
TR × Nnsns**
Note: Soil samples were collected after the end of the dry season in 2019; ψ RBS, raised bed sowing; −R, without residue mulch; +R, with residue mulch; DSR, direct-seeded rice; PTR, puddled transplanted rice during the wet season; $ N0, N1, N2, N3, refer to 0, 80, 120, and 160 kg N ha−1, respectively; # ns, not significant; ** significant at p < 0.01.
Table 11. Cost statistics of maize (USD ha−1) as influenced by wet season rice establishment methods, residue management during both seasons, and nitrogen application to maize in rice–maize cropping system experiment conducted at ICAR-CSSRI RRS, Canning Town, from the wet season of 2016 to the dry season of 2018–2019.
Treatment 2016–20172017–20182018–2019
Cost of ProductionNet IncomeBCR ψCost of ProductionNet IncomeBCRCost of ProductionNet IncomeBCR
Crop establishment method and residue management (TR) during the wet season
RBS @ − R
(DSR − R)
578.816.61.02710.0312.71.43780.4304.51.38
RBS + R
(DSR + R)
560.2157.11.27683.4526.11.76748.6472.91.62
RBS − R
(PTR − R)
598.3–3.70.99735.7214.31.28802.967.51.07
RBS + R
(PTR + R)
573.2107.41.18699.7485.01.69760.0290.61.37
LSD 0.05 (TR)3.381.00.146.774.50.115.9115.50.15
Nitrogen treatment in maize (N) during the dry season
N0 $553.1–179.90.68680.817.61.03739.6–128.90.83
N1 573.787.91.15703.5416.71.60769.4232.71.31
N2 586.6175.91.30716.7534.61.75785.0464.21.60
N3 597.1193.51.33727.8569.21.79797.9567.51.71
LSD0.05 (N)2.671.40.131.8437.70.064.5126.20.16
TR × Nns #nsnsns****ns***
@ RBS, raised bed sowing; −R, without residue; +R, with residue during dry season; DSR, direct-seeded rice; PTR, puddled transplanted rice during the wet season; $ N0, N1, N2, N3, refer to 0, 80, 120, and 160 kg N ha−1, respectively; ψ BCR, benefit/cost ratio; # ns, not significant; * significant at p < 0.05; ** significant at p < 0.01.
Table 12. Economics (USD ha−1) of rice–maize cropping system as influenced by mulching and nitrogen management of the dry season maize and preceding wet season rice crop establishment–residue management, in a rice–maize cropping system experiment conducted at ICAR-CSSRI RRS, Canning Town, from the wet season of 2016 to the dry season of 2018–2019.
Treatment2016–20172017–20182018–2019
Cost of ProductionNet IncomeBCR @Cost of ProductionNet IncomeBCRCost of ProductionNet IncomeBCR
Crop establishment method and residue management (TR) during the wet season
RBS ψ − R
(DSR − R)
1040.2233.11.221194.0485.41.401383.0880.11.63
RBS + R
(DSR + R)
1013.3460.01.451154.3799.01.691382.91206.41.87
RBS − R
(PTR − R)
1148.4193.81.171313.7294.71.221513.3311.01.20
RBS + R
(PTR + R)
1097.9308.61.281246.6674.01.541479.7668.81.45
LSD0.054.4164.10.166.161.10.057.6221.50.16
Nitrogen doses in maize (N)
N0 $1050.449.81.051200.7190.11.171406.4185.31.14
N1 1071.1318.11.301223.4595.41.491434.2691.21.49
N2 1083.9405.61.381236.8713.91.581452.61014.81.71
N3 1094.4422.11.391247.7753.61.611465.61175.11.81
LSD0.052.471.30.072.138.40.039.0139.80.10
TR × Nns #nsnsns****ns***
ψ RBS, raised bed sowing; −R, without residue mulch; +R, with residue mulch; DSR, direct-seeded rice; PTR, puddled transplanted rice during the wet season; $ N0, N1, N2, N3, refer to 0, 80, 120, and 160 kg N ha−1, respectively; @ BCR, benefit/cost ratio; # ns, not significant; * significant at p < 0.05; ** significant at p < 0.01.
Publisher’s Note: MDPI stays neutral with regard to jurisdictional claims in published maps and institutional affiliations.

