Canopy Structure and Photosynthetic Performance of Irrigated Cassava Genotypes Growing in Different Seasons in a Tropical Savanna Climate


 , , and
Abstract
:1. Introduction
2. Materials and Methods
2.1. Site Description and Microclimate
2.2. Plant Materials and Cultural Practice
2.3. Canopy Structure
2.4. Light Environments inside a Canopy
2.5. Photosynthesis
2.6. Chlorophyll Content
2.7. Data and Statistical Analysis
3. Results
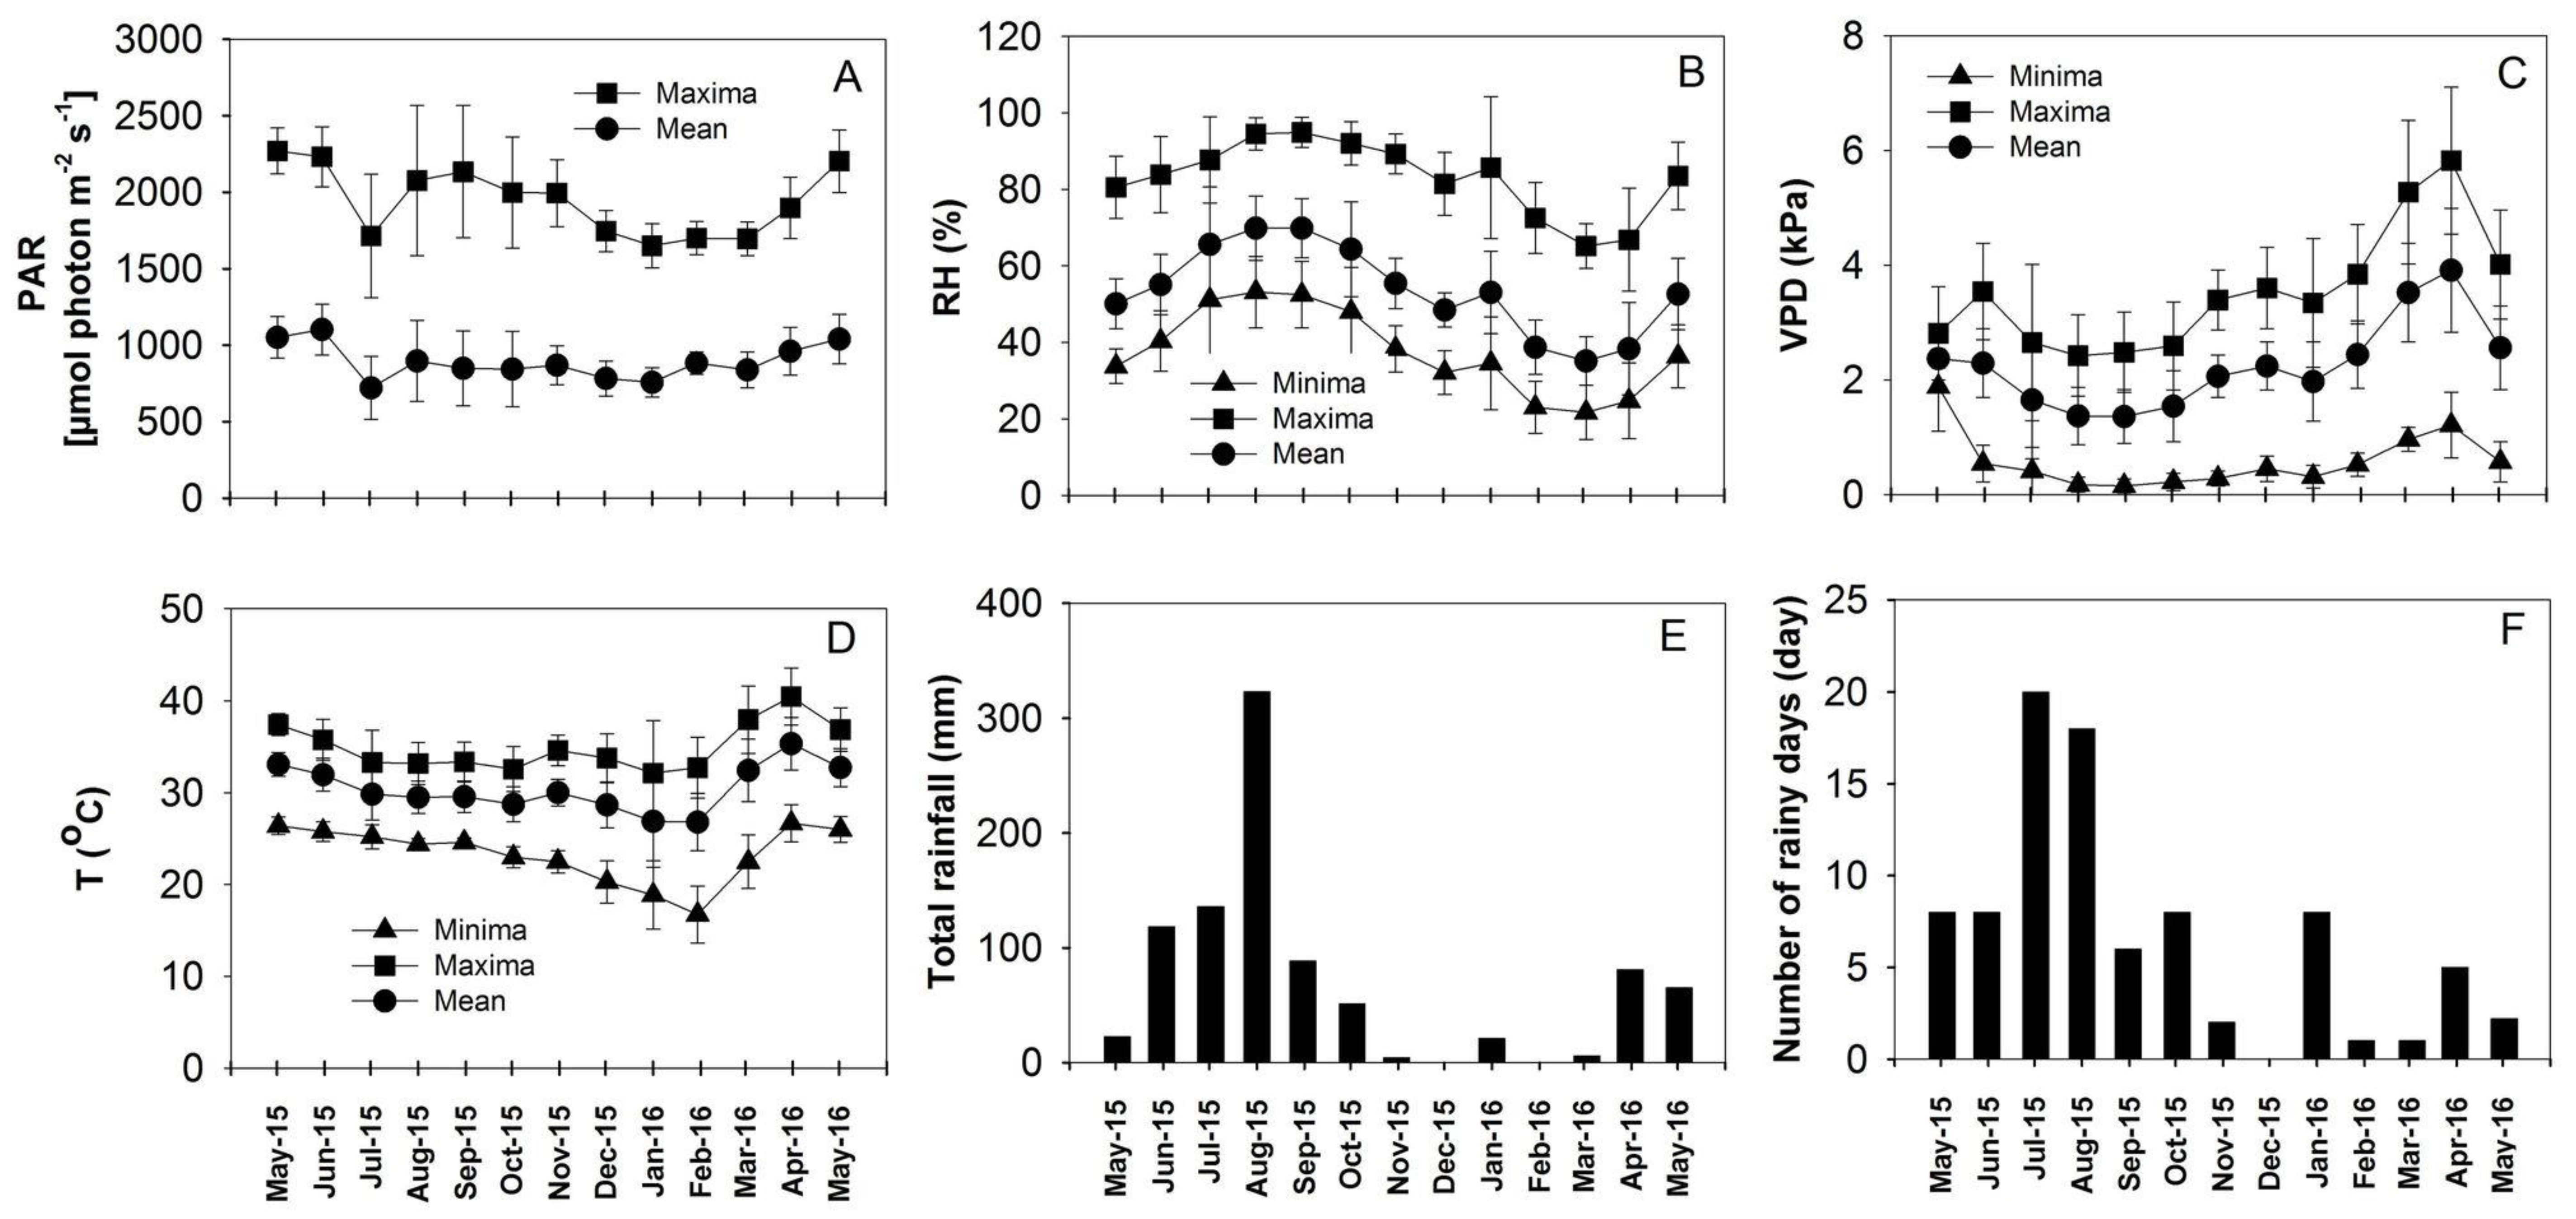
3.1. Weather Conditions at the Field Site
3.2. Canopy Characteristics
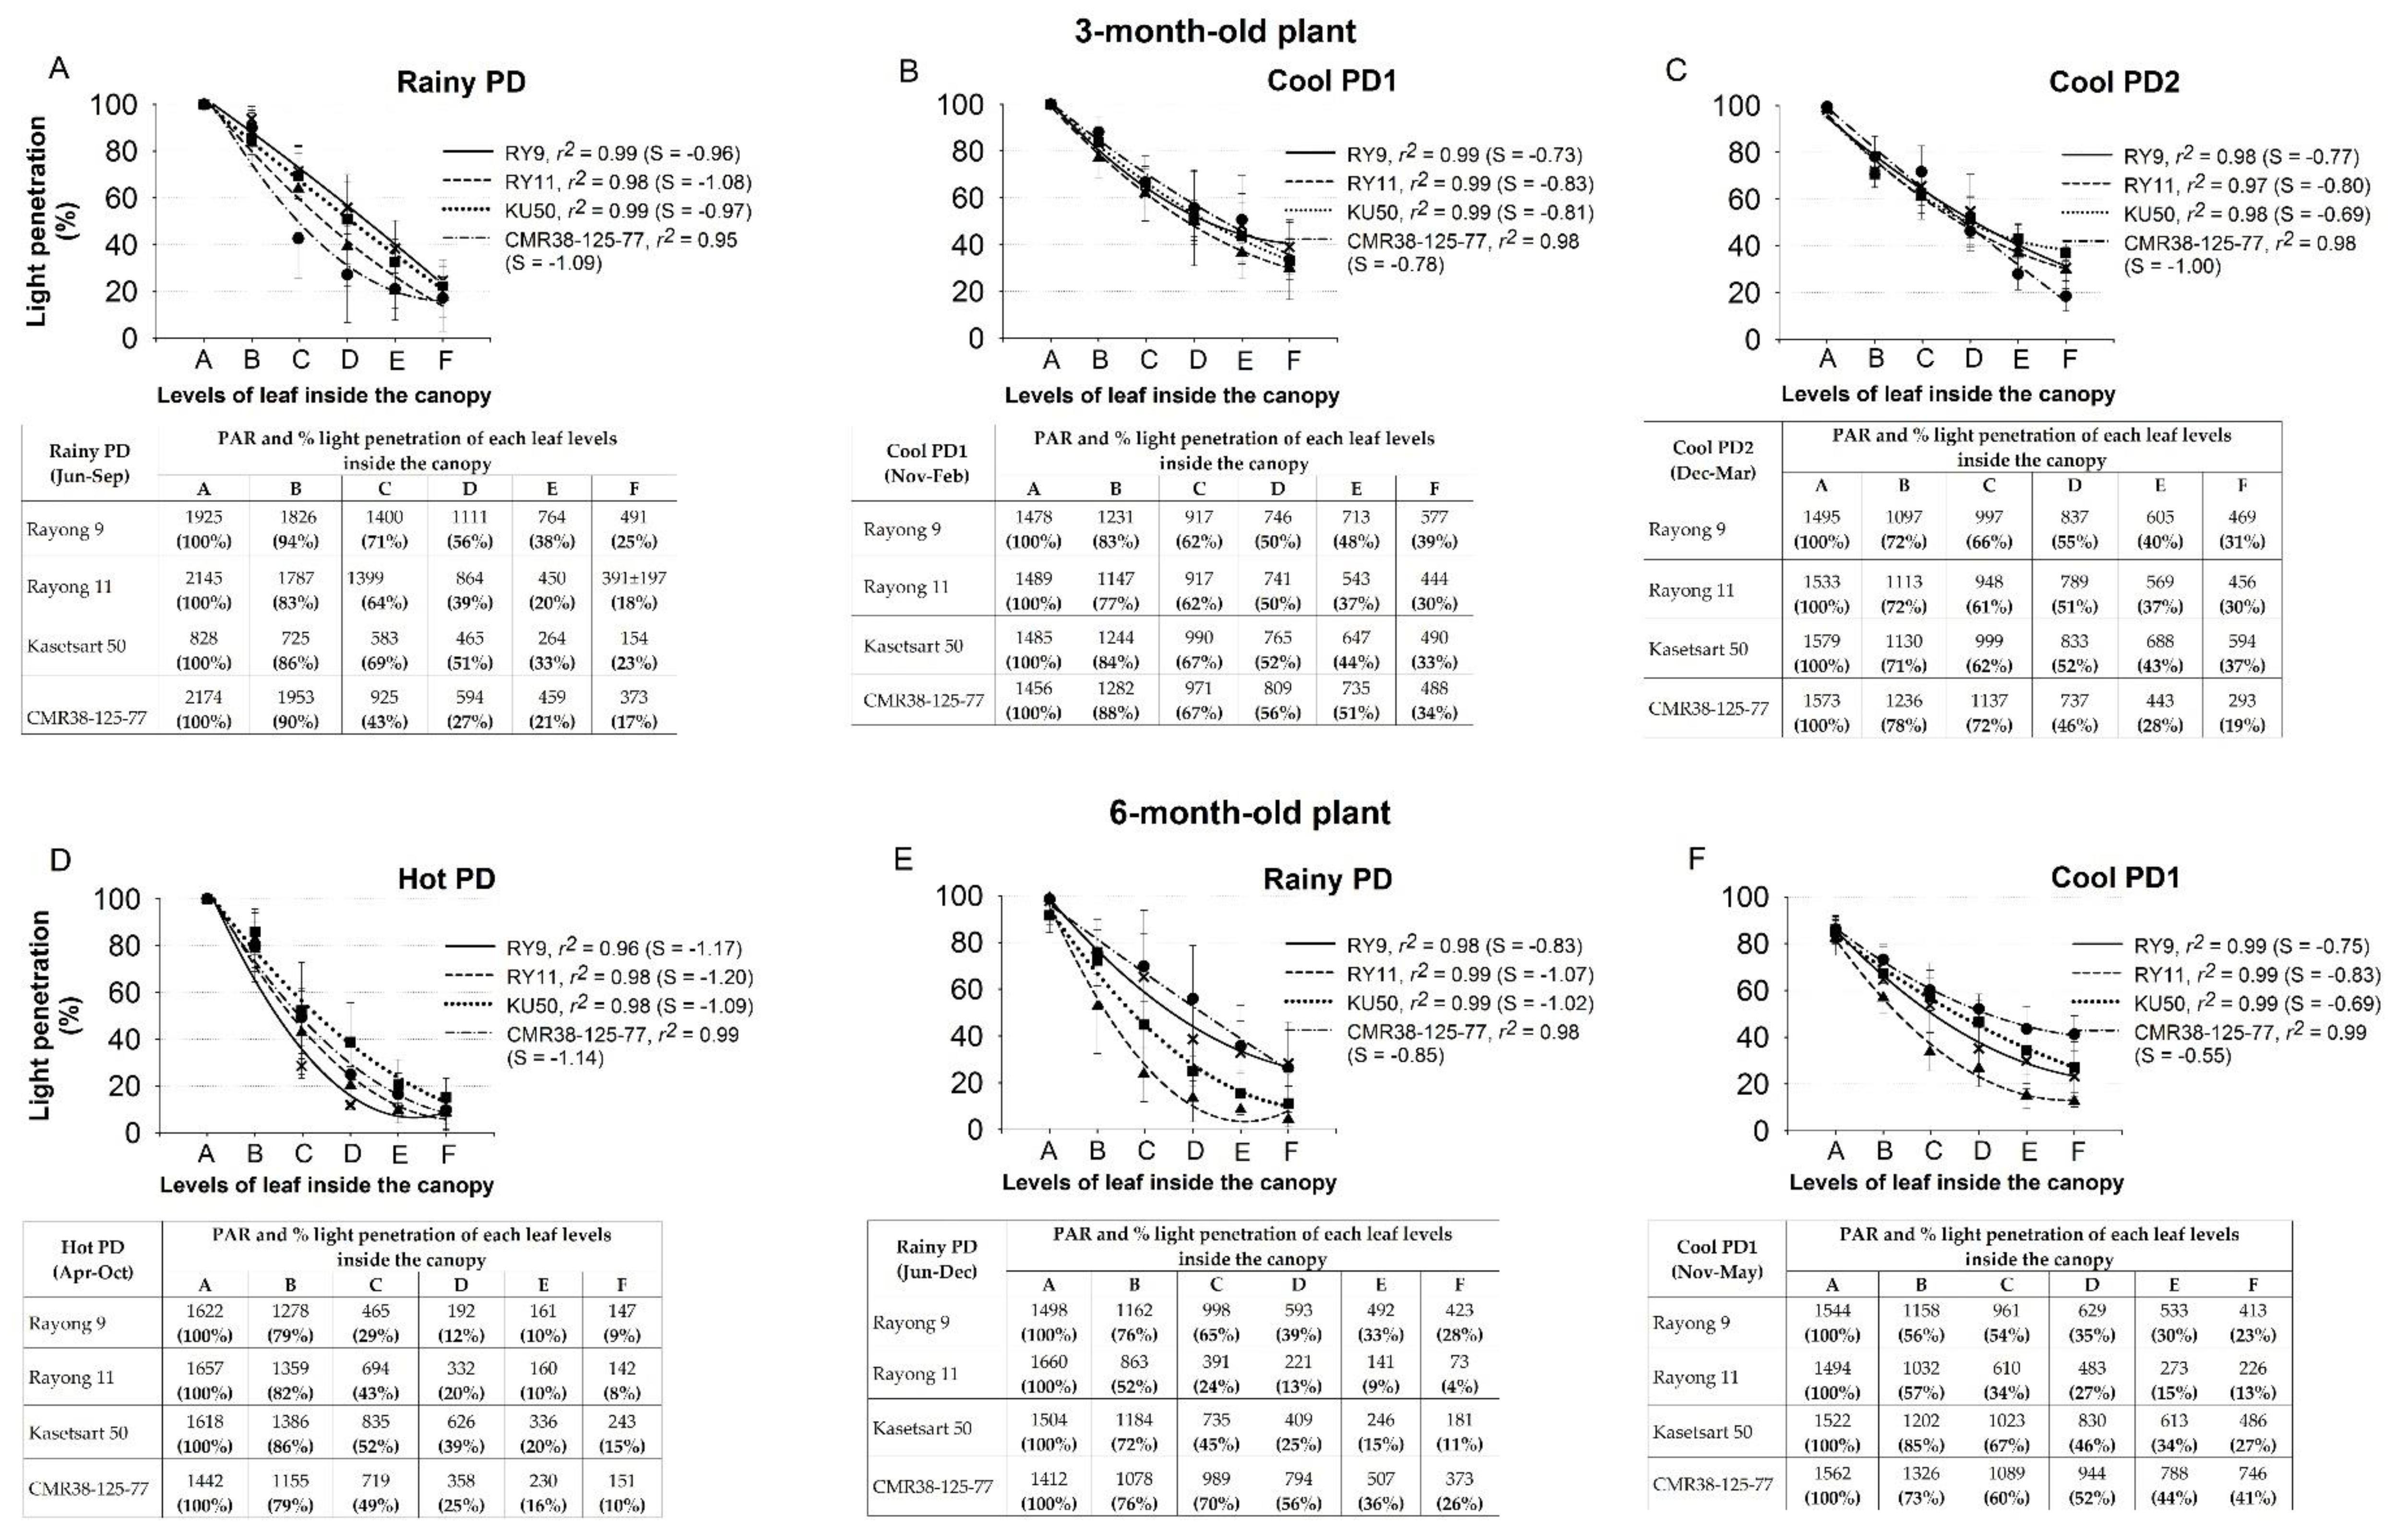
3.3. Light Penetration though Different Canopy Levels
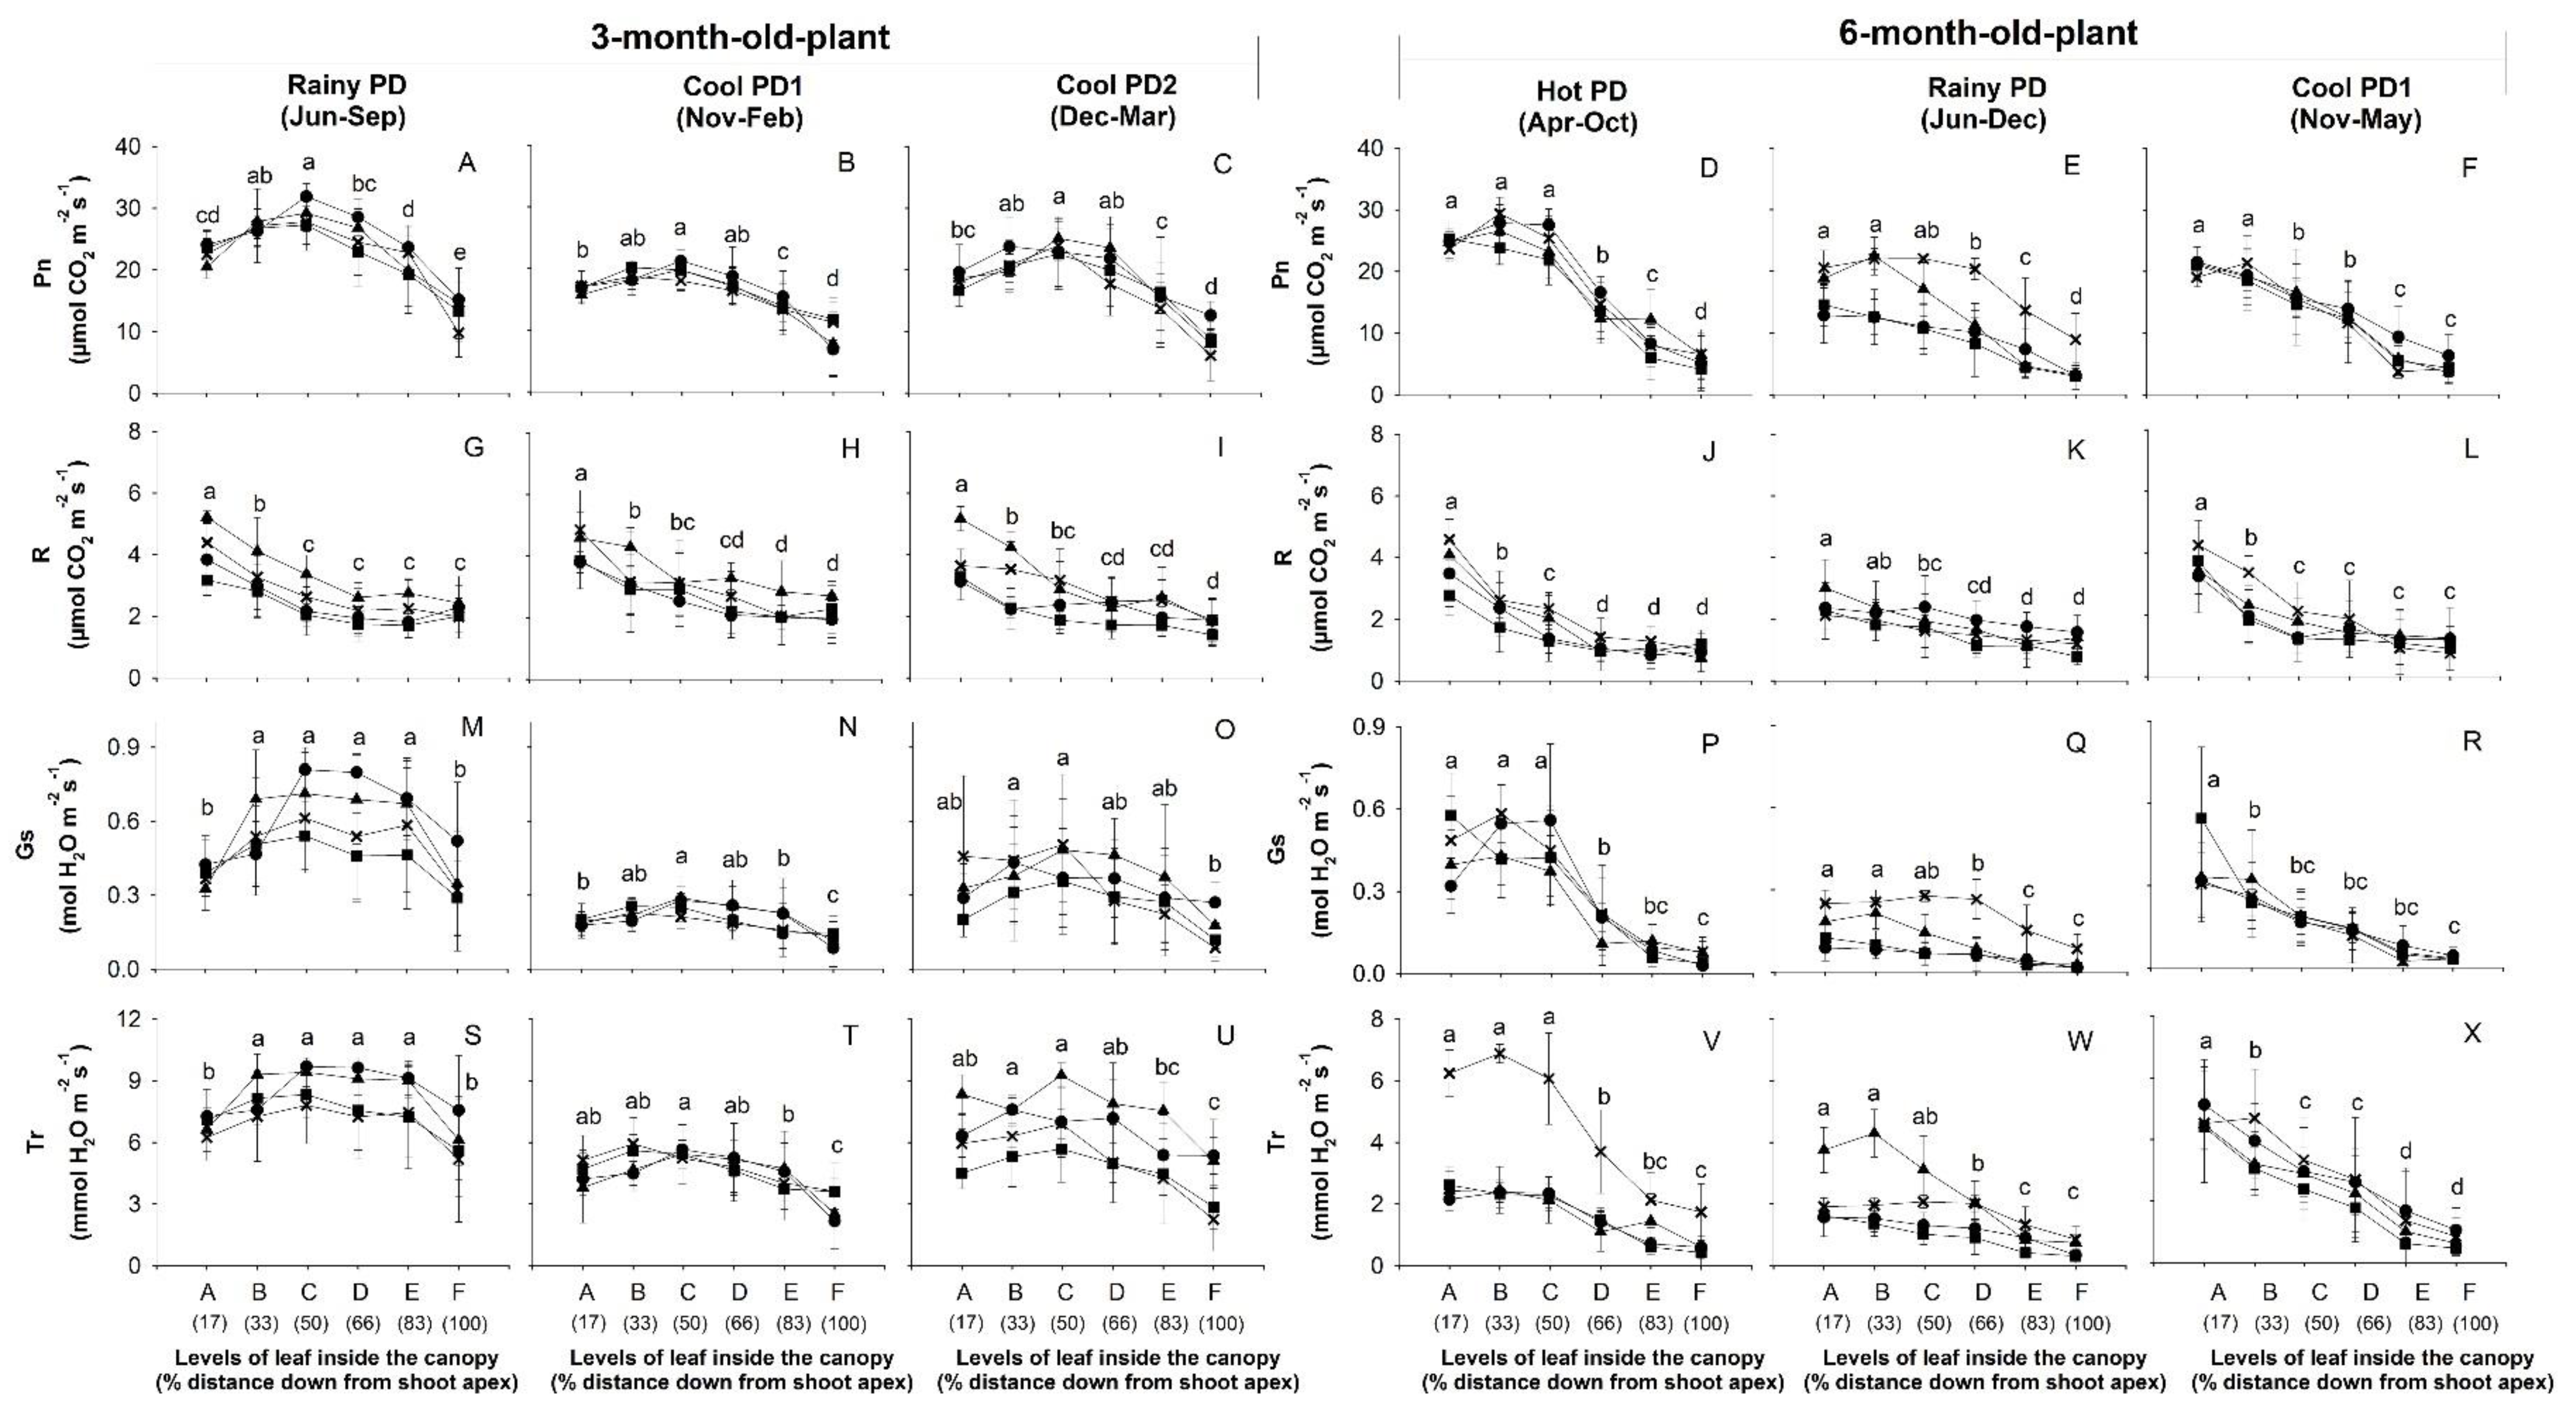
3.4. Photosynthetic Performance
3.4.1. Photosynthesis of Leaves at Different Canopy Levels
3.4.2. Light Response Curves
3.5. Chlorophyll Content
4. Discussion
4.1. Canopy Structure and Photosynthesis of Cassava Plants at 3MAP
4.2. Canopy Structure and Photosynthesis of Cassava Plants at 6MAP
4.3. Genotype Variation in Canopy Structure and Photosynthesis
5. Conclusions
Supplementary Materials
Author Contributions
Funding
Acknowledgments
Conflicts of Interest
Abbreviations
| AQE | apparent quantum yield |
| Ca | ambient CO2 concentration |
| Chl | chlorophyll |
| Ci | intercellular CO2 concentration |
| Gs | stomatal conductance |
| I | photosynthetic photon flux density |
| Icomp | light-compensation point |
| Imax | light-saturation point |
| LAI | leaf area index |
| Pgmax | maximum gross photosynthesis rate |
| PAR | photosynthetically active radiation |
| PD | planting date |
| Pn | net photosynthetic rate |
| Pn(Imax) | net photosynthesis rate at light-saturation |
| MAP | month after planting |
| T | temperature |
| Tr | transpiration rate |
| R | respiration rate |
| RD | dark respiration rate |
| r | correlation coefficient |
| RH | relative humidity |
| VPD | vapor pressure deficit |
| WUE | water-use efficiency (= Pn/Tr) |
References
- Burns, A.; Gleadow, R.; Cliff, J.; Zacarias, A.; Cavagnaro, T. Cassava: The drought, war and famine crop in a changing world. Sustainability 2010, 2, 3572–3670. [Google Scholar] [CrossRef] [Green Version]
- The Intergovernmental Panel on Climate Change (IPCC). Summary for policy makers. In Climate Change 2007: The Physical Science Basis Contribution of Working Group 1 to the Fourth Assesment Report of the Intergovernmental Panel on Climate Change; Solomon, S., Quin, D., Manning, M., Chen, Z., Marquis, M., Averyt, K.B., Tingnor, M., Miller, H.L., Eds.; Cambridge University Press: Cambridge, UK; New York, NY, USA, 2007; pp. 1–18. [Google Scholar]
- Rosenthal, D.M.; Ort, D.R. Examining cassava’s potential to enhance food security under climate change. Trop. Plant Biol. 2011, 4, 30–38. [Google Scholar] [CrossRef]
- El-Sharkawy, M.A.; De Tafur, S.M.D. Comparative photosynthesis, growth, productivity, and nutrient use efficiency among tall- and short-stemmed rain-fed cassava cultivars. Photosynthetica 2010, 48, 173–188. [Google Scholar] [CrossRef]
- Okogbenin, E.; Setter, T.L.; Ferguson, M.; Mutegi, R.; Ceballos, H.; Olasanmi, B.; Fregene, M. Phenotypic approaches to drought in cassava: Review. Front. Physiol. 2013, 4, 1–15. [Google Scholar] [CrossRef] [PubMed] [Green Version]
- El-Sharkawy, M.A. Drought-tolerant cassava for Africa, Asia, and Latin America: Breeding projects work to stabilize productivity without increasing pressures on limited natural resources. BioScience 1993, 47, 441–451. [Google Scholar] [CrossRef]
- Janket, A.; Vorasoot, N.; Toomsan, B.; Kaewpradit, W.; Banterng, P.; Kesmala, T.; Theerakulpisut, P.; Jogloy, S. Seasonal variation in Starch accumulation and starch granule size in cassava genotypes in a tropical savanna climate. Agronomy 2018, 8, 297. [Google Scholar] [CrossRef] [Green Version]
- Montagnac, J.A.; Davis, C.R.; Tanumihardjo, S.A. Nutritional value of cassava for use as a staple food and recent advances for improvement. Compr. Rev. Food Sci. Food Saf. 2009, 8, 181–194. [Google Scholar] [CrossRef]
- Khandare, V.B.; Choomsook, P. Cassava export of Thailand: Growth performance and composition. IJRAR 2019, 6, 847–857. [Google Scholar]
- Food and Agriculture Organization Corporate Statistical Database. Crops. Available online: http://www.fao.org/faostat/en/#data/QC/visualize (accessed on 17 August 2020).
- Office of Agricultural Economics. Agricultural Production Index. Available online: http://www.oae.go.th/view/1/Home/EN-US (accessed on 20 October 2020).
- Cock, J.H.; Franklin, D.; Sandoval, G.; Juri, P. The ideal cassava planting for maximum yield. Crop Sci. 1979, 19, 271–279. [Google Scholar] [CrossRef]
- El-Sharkawy, M.A. Effect of humidity and wind on leaf conductance of field growth cassava. Rev. Bras. Fisiol. Vegetal. 1990, 2, 17–22. [Google Scholar]
- Ministry of Agriculture and Cooperative, Thailand. Status of Cassava in Thailand: Implications for Future Research and Development. Available online: http://www.fao.org/3/y1177e/Y1177E04.htm (accessed on 24 October 2020).
- Thai Meteorological Department. Climate of Thailand Report. Available online: https://www.tmd.go.th/en/archive/thailand_climate.pdf (accessed on 5 September 2020).
- Phoncharoen, P.; Banterng, P.; Vorasoot, N.; Jogloy, S.; Theerakulpisut, P.; Hoogenboom, G. Growth rates and yields of cassava at different planting dates in a tropical savanna climate. Sci. Agric. 2019, 76, 376–388. [Google Scholar] [CrossRef] [Green Version]
- Wongnoi, S.; Banterng, P.; Vorasoot, N.; Jogloy, S.; Theerakulpisut, P. Physiology, growth and yield of different cassava genotypes planted in upland with dry environment during high storage root accumulation stage. Agronomy 2020, 10, 576. [Google Scholar] [CrossRef] [Green Version]
- El-Sharkawy, M.A.; Lopez, Y.; Bernal, L.M. Genotypic variations in activities of phosphoenolpyruvate carboxylase and correlations with leaf photosynthetic characteristics and crop productivity of cassava grown in low-land seasonally-dry tropics. Photosynthetica 2008, 46, 238–247. [Google Scholar] [CrossRef]
- Zhu, X.G.; Long, S.; Ort, D.R. Improving photosynthetic efficiency for greater yield. Ann. Rev. Plant Biol. 2010, 61, 235–261. [Google Scholar] [CrossRef] [Green Version]
- Mahakosee, S.; Jogloy, S.; Vorasoot, N.; Theerakulpisut, P.; Banterng, P.; Kesmala, T.; Holbrook, C.C.; Kvien, C. Seasonal variations in canopy size and yield of Rayong 9 cassava genotype under rainfed and irrigated condition. Agronomy 2019, 9, 362. [Google Scholar] [CrossRef] [Green Version]
- El-Sharkawy, M.A. International research on cassava photosynthesis, productivity, eco-physiology, and responses to enviromental stresses in the tropics. Photosynthetica 2006, 44, 481–512. [Google Scholar] [CrossRef]
- Santanoo, S.; Vongcharoen, K.; Banterng, P.; Vorasoot, N.; Jogloy, S.; Roytrakul, S.; Theerakulpisut, P. Seasonal variation in diurnal photosynthesis and chlorophyll fluorescence of four genotypes of cassava (Manihot esculenta Crantz) under irrigation conditions in tropical savanna climate. Agronomy 2019, 9, 206. [Google Scholar] [CrossRef] [Green Version]
- Lawson, T.; Blatt, M.R. Stomatal size, speed, and responsiveness impact on photosynthesis and water use efficiency. Plant Physiol. 2014, 164, 1556–1570. [Google Scholar] [CrossRef] [Green Version]
- El-Sharkawy, M.A.; De Tafur, S.M.; Lopez, Y. Eco-physiological research for breeding improved cassava cultivars in favorable and stressful environments in tropical/subtropical bio-systems. EVRJ 2012, 6, 143–211. [Google Scholar]
- Sange, R.F.; Peixoto, M.M.; Sang, T.L. Photosynthesis in sugarcane. In Sugarcane: Physiology, Biochemistry, and Fictional Biology; Moore, P.H., Botha, F.C., Eds.; John Wiley & Sons, Inc.: Hoboken, NJ, USA, 2014; pp. 121–152. [Google Scholar]
- Hikosaka, K. A model of dynamics of leaves and nitrogen in a plant canopy: An integration of canopy photosynthesis, leaf life span, and nitrogen use efficiency. Am. Nat. 2003, 162, 149–164. [Google Scholar] [CrossRef] [Green Version]
- Alves, A.A.C. Cassava Botany and Physiology. In Cassava: Biology, Production and Utilization; Hillock, R.J., Thres, J.M., Bellotti, A.C., Eds.; CABI Publishing: New York, NY, USA, 2002; pp. 67–89. [Google Scholar]
- Tan, S.L.; Cock, J.H. Branching habit as a yield determinant in cassava. Field Crop Res. 1979, 2, 281–289. [Google Scholar]
- Phoncharoen, P.; Banterng, P.; Vorasoot, N.; Jogloy, S.; Theerakulpisut, P.; Hoogenboom, G. The impact of seasonal environments in a tropical savanna climate on forking, leaf area index, and biomass of cassava genotypes. Agronomy 2019, 9, 19. [Google Scholar] [CrossRef] [Green Version]
- Mahakosee, S.; Jogloy, S.; Vorasoot, N.; Theerakulpisut, P.; Holbrook, C.C.; Kvien, C.; Banterng, P. Seasonal variations in canopy size, light penetration and photosynthesis of three cassava genotypes with different canopy architectures. Agronomy 2020, 10, 1554. [Google Scholar] [CrossRef]
- Keating, B.A.; Evanson, J.P.; Fukai, S. Environmental effects on the growth and development of cassava (Manihot esculenta Crantz). I. Crop development. Field Crop. Res. 1982, 5, 271–281. [Google Scholar] [CrossRef]
- Fukai, S.; Alcoy, A.B.; Llamelo, A.B.; Patterson, R.D. Effects of solar radiation on growth of cassava (Manihot esculenta Crantz.). I. Canopy development and dry matter growth. Field Crop. Res. 1984, 9, 347–360. [Google Scholar] [CrossRef]
- Kubiske, M.E.; Pregizer, K.S.; Mikan, C.J.; Zak, D.R.; Maziasz, J.L.; Teeri, J.A. Populus tremulodes photosynthesis and crown architecture in response to elevated CO2 and soil N availability. Oecologia 1997, 110, 328–336. [Google Scholar]
- Greer, D.H.; Weedon, M.M. The impact of high temperatures on Vitis vinifera cv. Semillon grapevine performance and berry ripening. Front. Plant Sci. 2013, 4, 491. [Google Scholar] [CrossRef] [Green Version]
- Gunasekera, H.K.L.K.; De Costa, W.A.J.M.; Nugawela, A. Canopy photosynthesis capacity and light response parameters of rubber Hevea brasiliensis with reference to exploitation. Curr. Agric. Res. J. 2013, 1, 1–12. [Google Scholar] [CrossRef]
- Keller, B.; Matsubara, S.; Rascher, U.; Pieruschka, R.; Steier, A.; Kraska, T.; Muller, O. Genotype specific photosynthesis x environment interactions captured by automated fluorescence canopy scans over two fluctuating growing seasons. Front. Plant Sci. 2019, 10, 1482. [Google Scholar] [CrossRef] [Green Version]
- Vongchareon, K.; Santanoo, S.; Banterng, P.; Jogloy, S.; Vorasoot, N.; Theerakulpisut, P. Seasonal variation in photosynthesis performance of cassava at two different growth stages under irrigated and rain-fed conditions in a tropical savanna climate. Photosynthetica 2018, 56, 1398–1413. [Google Scholar] [CrossRef]
- Vongchareon, K.; Santanoo, S.; Banterng, P.; Jogloy, S.; Vorasoot, N.; Theerakulpisut, P. Diurnal and seasonal variations in the photosynthetic performance and chlorophyll fluorescence of cassava ‘Rayong 9’ under irrigated and rainfed conditions. Photosynthetica 2019, 57, 268–285. [Google Scholar] [CrossRef] [Green Version]
- Mathur, S.; Jain, L.; Jajoo, A. Photosynthetic efficiency in sun and shade plants. Photosynthetica 2018, 56, 354–365. [Google Scholar] [CrossRef]
- Li, T.; Liu, L.; Jian, C.; Liu, Y.; Shi, L. effects of mutual shading on the regulation of photosynthesis in field-grown sorghum. J. Photochem. Photobiol. B Biol. 2014, 137, 31–38. [Google Scholar] [CrossRef] [PubMed] [Green Version]
- Li, Z.; Yang, W.; Ahammed, G.J.; Shen, C.; Yan, P.; Li, X.; Han, W. Developmental changes in carbon and nitrogen metabolism affect tea quality in different leaf position. Plant Physiol. Biochem. 2016, 106, 327–335. [Google Scholar] [CrossRef] [PubMed]
- Ding, Z.; Zhang, Y.; Xiao, Y.; Liu, F.; Wang, M.; Zhu, X.; Liu, P.; Sun, Q.; Wang, W.; Peng, M.; et al. Transcriptome response of cassava leaves under natural shade. Sci. Rep. 2016, 6, 31673. [Google Scholar] [CrossRef] [Green Version]
- Fukai, S.; Hammer, G.L. A simulation model of the growth of cassava crop and its use to estimate cassava productivity in Northern Australia. Agric. Syst. 1987, 23, 237–257. [Google Scholar] [CrossRef]
- El-Sharkawy, M.A. Cassava biology and physiology. Plant Mol. Biol. 2004, 56, 481–501. [Google Scholar] [CrossRef]
- De Souza, A.P.; Massenburg, L.N.; Jaiswal, D.; Cheng, S.; Shekar, R.; Long, S.P. Rooting for cassava: Insight into photosynthesis and associated physiology as a route to improve yield potential. New Phytol. 2017, 213, 50–65. [Google Scholar] [CrossRef]
- El-Sharkawy, M.A.; De Tafur, S.M.; Cadavid, L.F. Photosynthesis of cassava and its relation to crop productivity. Photosynthetica 1993, 28, 431–438. [Google Scholar]
- Pellet, D.; El-Sharkawy, M.A. Cassava varietal response to phosphorus fertilization. I. Yield, biomass and gas exchange. Field Crop. Res. 1993, 35, 1–11. [Google Scholar] [CrossRef]
- De Tafur, S.M.; El-Sharkawy, M.A.; Calle, F. Photosynthesis and yield performance of cassava in seasonally dry and semiarid environments. Photosynthetica 1997, 33, 249–257. [Google Scholar] [CrossRef]
- Polthanee, A.; Promkhambut, A. Impact of climate change on rice-base cropping system and farmers’ adaptation strategies in Northeast Thailand. Asian J. Crop Sci. 2014. [Google Scholar] [CrossRef] [Green Version]
- Kottek, M.; Grieser, J.; Beck, C.; Rudolf, B.; Rubel, F. World Map of the Köppen-Geiger climate classification updated. Meteorol. Z. 2006, 15, 259–263. [Google Scholar] [CrossRef]
- The Thai Tapioca Department Institute. Tapioca Varieties. Available online: https://www.tapiocathai.org/English/K1_e.html (accessed on 25 October 2020).
- Howeler, R.H. Cassava mineral nutrition and fertilization. In Cassava: Biology, Production and Utilization; Hillocks, R.J., Thresh, J.M., Bellotti, A.C., Eds.; CABI Publishing: New, York, NY, USA, 2002; pp. 149–166. [Google Scholar]
- Welles, J.M.; Cohen, S. Canopy structure measurement by gap fraction analysis using commercial instrumentation. J. Exp. Bot. 1996, 47, 1335–1342. [Google Scholar] [CrossRef]
- Prioul, J.L.; Chartier, P. Partitioning of transfer and carboxylation components of intracellular resistance to photosynthetic CO2 fixation: A critical analysis of the mtethods used. Ann. Bot. 1977, 41, 789–800. [Google Scholar] [CrossRef]
- Arnon, D.I. Copper enzymes in isolated chloroplasts polyphenoloxidase in Beta vulgaris. Plant Physiol. 1949, 24, 1–15. [Google Scholar] [CrossRef] [Green Version]
- Lichtenthaler, H.K. Chlorophylls and carotenoids, pigments of photosynthetic biomembranes. Meth. Enzymol. 1987, 148, 350–382. [Google Scholar]
- Gomez, K.A.; Gomez, A.A. Statistical Procedures for Agricultural Research; John Wiley and Sons: New York, NY, USA, 1984. [Google Scholar]
- Howell, T.A.; Member, A.S.C.E.; Dusek, D.A. Comparison of vapor-pleasure-deficit calculation method-southern high plants. J. Irrig. Drain. Eng. 1995. [Google Scholar] [CrossRef]
- Murray, F.W. On the computation of saturation vapor pressure. J. Appl. Meteorol. 1967, 6, 203–204. [Google Scholar] [CrossRef]
- Alves, A.A.C.; Setter, T.L. Response of cassava leaf area expansion to water deficit: Cell proliferation, cell expansion and delayed development. Ann. Bot. 2004, 94, 605–613. [Google Scholar] [CrossRef] [Green Version]
- Leepipatpaiboon, S.; Boonyawat, S.; Sarobol, E. Estimation of solar radiation use efficiency in paddy and cassava fields. Kasetsart J. 2019, 43, 642–649. [Google Scholar]
- June, T. The effect of light on growth of cassava and sorghum I light distribution and extinction coefficient. Agromet 1993, 4, 35–41. [Google Scholar]
- Zhi, X.; Han, Y.; Mao, S.; Wang, G.; Feng, L.; Yang, B.; Fan, Z.; Du, W.; Lu, J.; Li, Y. Light spatial distribution in the canopy and crop development in cotton. PLoS ONE 2014, 9, e113409. [Google Scholar] [CrossRef] [PubMed]
- Matloobi, M. Light Harvesting and Photosynthesis by the Canopy. In Advances in Photosynthesis—Fundamental Aspects; Najafpor, M.M., Ed.; IntechOpen: London, UK, 2012; pp. 235–256. [Google Scholar]
- Smith, N.G.; Keenan, T.F.; Prentice, I.C.; Wang, H.; Wright, I.J.; Niinemets, U.; Crous, K.Y.; Domingues, T.F.; Guerrieri, R.; Ishida, F.Y.; et al. Global photosynthetic capacity is optimized to the environment. Ecol. Lett. 2019, 22, 506–517. [Google Scholar] [CrossRef] [PubMed] [Green Version]
- Hikosaka, K.; Noguchi, K.; Terashima, I. Modeling leaf gas exchange. In Canopy Photosynthesis: From Basics to Applications; Hikosaka, K., Niinemets, U., Anten, N.P.R., Eds.; Springer: Drodrecht, The Nederland; Berlin/Heidelberg, Germany; New York, NY, USA; London, UK, 2016; pp. 60–99. [Google Scholar]
- Pignon, C.P.; Jaiswal, D.; McGrath, J.M.; Long, S.P. Loss of photosynthetic efficiency in the shade. An achillies heel for the dense modern standsof our most productive C4 crops? J. Exp. Bot. 2017, 68, 335–345. [Google Scholar] [CrossRef] [Green Version]
- Björkman, O. Response to different quantum flux densities. In Physiological Plant Ecology, I. Response to the Physical Environment; Lange, O.L., Nobel, P.S., Osmond, C.B., Zie-gler, H., Eds.; Springer: Berlin/Heidelberg, Germany, 1981; pp. 57–107. [Google Scholar]
- De Souza, A.P.; Long, S.P. Towards improving photosynthesis in cassava: Characterizing photosynthetic limitations in four current African cultivars. Food Energy Secur. 2018, 7. [Google Scholar] [CrossRef]
- Wang, R.H.; Chang, J.C.; Li, K.T.; Lin, T.S.; Chang, L.S. Leaf age and light intensity affect gas exchange parameters and photosynthesis within the developing canopy of field net-house-grown papaya trees. Sci. Hortic. 2014, 165, 365–373. [Google Scholar] [CrossRef]
- Bauerle, W.; McCullough, C.; Iversen, M.; Hazlett, M. Leaf age and position effects on quantum yield and photosynthetic capacity in hemp crowns. Plants 2020, 9, 271. [Google Scholar] [CrossRef] [Green Version]
- Niinemets, U.; Cescatti, A.; Rodeghiero, M.; Tosens, T. Complex adjustments of photosynthetic potentials and internal diffusion conductance to current and previous light availabilities and leaf age in Mediterranean evergreen species. Plant Cell Environ. 2006, 29, 1159–1178. [Google Scholar] [CrossRef] [Green Version]
- Niinemets, U.; Keenan, T.F.; Hallik, L. A worldwide analysis of within-canopy variations in leaf structural, chemical and physiological traits across plant functional types. New Phytol. 2015, 205, 973–993. [Google Scholar] [CrossRef] [Green Version]
- Niinemets, U. Leaf age dependent changes in within-canopy variation in leaf functional traits: A meta-analysis. J. Plant Res. 2016, 129. [Google Scholar] [CrossRef] [PubMed] [Green Version]
- Way, D.A.; Pearcy, R.W. Sunflecks in trees and forests: From photosynthetic physiology to global change biology. Tree Physiol. 2012, 32, 1066–1081. [Google Scholar] [CrossRef] [PubMed] [Green Version]
- Lawson, T.; Van Caemmerer, S.; Baroli, I. Photosynthesis and stomatal behavior. In Progress in Botany 72; Luttge, U., Beyschlag, W., Budel, B., Francis, D., Eds.; Springer: Berlin/Heidelberg, Germany, 2011; pp. 265–304. [Google Scholar]
- Niinemets, U. Photosynthesis and resource distribution through plant canopies. Plant Cell Environ. 2007, 30, 1052–1071. [Google Scholar] [CrossRef] [PubMed]
- Howeler, R.H.; Cadavid, L.F. Accumulation and distribution of dry matter and nutrients during a 12-month growth cycle of cassava. Field Crop. Res. 1983, 7, 123–139. [Google Scholar] [CrossRef]
- Veltkamp, H.J. Photosynthesis, transpiration, water use efficiency and leaf and mesophyll resistance of cassava as influenced by light intensity. Agric. Univ. Wagening. Pap. 1985, 85, 27–35. [Google Scholar]
- Pipatsitee, P.; Eiumnoh, A.; Praseartkul, P.; Ponganan, N.; Taota, K.; Kongpugdee, S.; Sakulleerungroj, K.; Cha-um, S. Non-destructive leaf estimation model for overall growth performances in relation to yield attributes of cassava (Manihot esculenta Cranz) under Water Deficit Conditions. Not. Bot. Horti. Agrobo. 2019, 47, 580–591. [Google Scholar] [CrossRef] [Green Version]
- Boonman, A.; Anten, N.P.R.; Dueck, T.A.; Jordi, W.J.R.M.; Werf, A.K.; Voesenek, L.A.C.J.; Pons, T.L. Functional significance of shade-induced leaf senescence in dense canopies: An experimental test using transgenic tobacco. Am. Nat. 2006, 168, 597–607. [Google Scholar] [CrossRef]
- Woo, H.R.; Kim, H.J.; Nam, H.G.; Lim, P.O. Plant leaf senescence and death—Regulation by multiple layers of control and implications for aging in general. J. Cell Sci. 2013, 126, 4823–4833. [Google Scholar] [CrossRef] [Green Version]
- Brouwer, B.; Gardestrom, P.; Keech, O. In response to partial plant shading, the lack of phytochrome a does not directly induce leaf senescence but alter the fine-tuning of chlorophyll biosynthesis. J. Exp. Bot. 2014, 65, 4037–4049. [Google Scholar] [CrossRef] [Green Version]
- Chabot, B.F.; Jurik, T.W.; Chabot, J.F. Influence of instantaneous and integrated light-flux density on leaf anatomy and photosynthesis. Am. J. Bot. 1979, 66, 940–945. [Google Scholar] [CrossRef]
- Niinemets, U.; Garcia-Plazaola, J.I.; Tosens, T. Photosynthesis during leaf development and ageing. In Terrestrial Photosynthesis in a Chanhing Environement. A Molecular, Physiological and Ecological Approach; Flexas, J., Loreto, F., Medrano, H., Eds.; Cambridge University Press: Cambridge, UK, 2012; pp. 353–372. [Google Scholar]
- Burgess, A.J.; Retkute, R.; Herman, T.; Murchie, E.H. Exploring relationships between canopy architecture, light distribution, and photosynthesis in contrasting rice genotypes using 3D canopy reconstruction. Front. Plant Sci. 2017, 8, 734. [Google Scholar] [CrossRef] [PubMed]
- Feng, G.; Luo, H.; Zhang, Y.; Gou, L.; Yao, Y.; Lin, Y.; Zhang, W. Relationship between plant canopy characteristics and photosynthetic productivity in diverse cultivars of cotton (Gossypium hirsutum L.). Crop J. 2016, 4, 499–508. [Google Scholar] [CrossRef] [Green Version]
- Raji, P.; Byju, G. Is cassava (Manihot esculenta Crantz) a climate “smart” crop? A review in the context of bridging future food demand gap. Trop. Plant Biol. 2020, 13, 201–211. [Google Scholar]
- Irikura, Y.; Cock, J.H.; Kawano, K. The physiological basis of genotype-temperature interactions in cassava. Field Crop. Res. 1979, 2, 227–239. [Google Scholar] [CrossRef]
- Milford, G.F.J.; Riley, J. The effects of temperature on leaf growth of sugar beet varieties. Ann. Appl. Biol. 1980, 94, 431–443. [Google Scholar] [CrossRef]


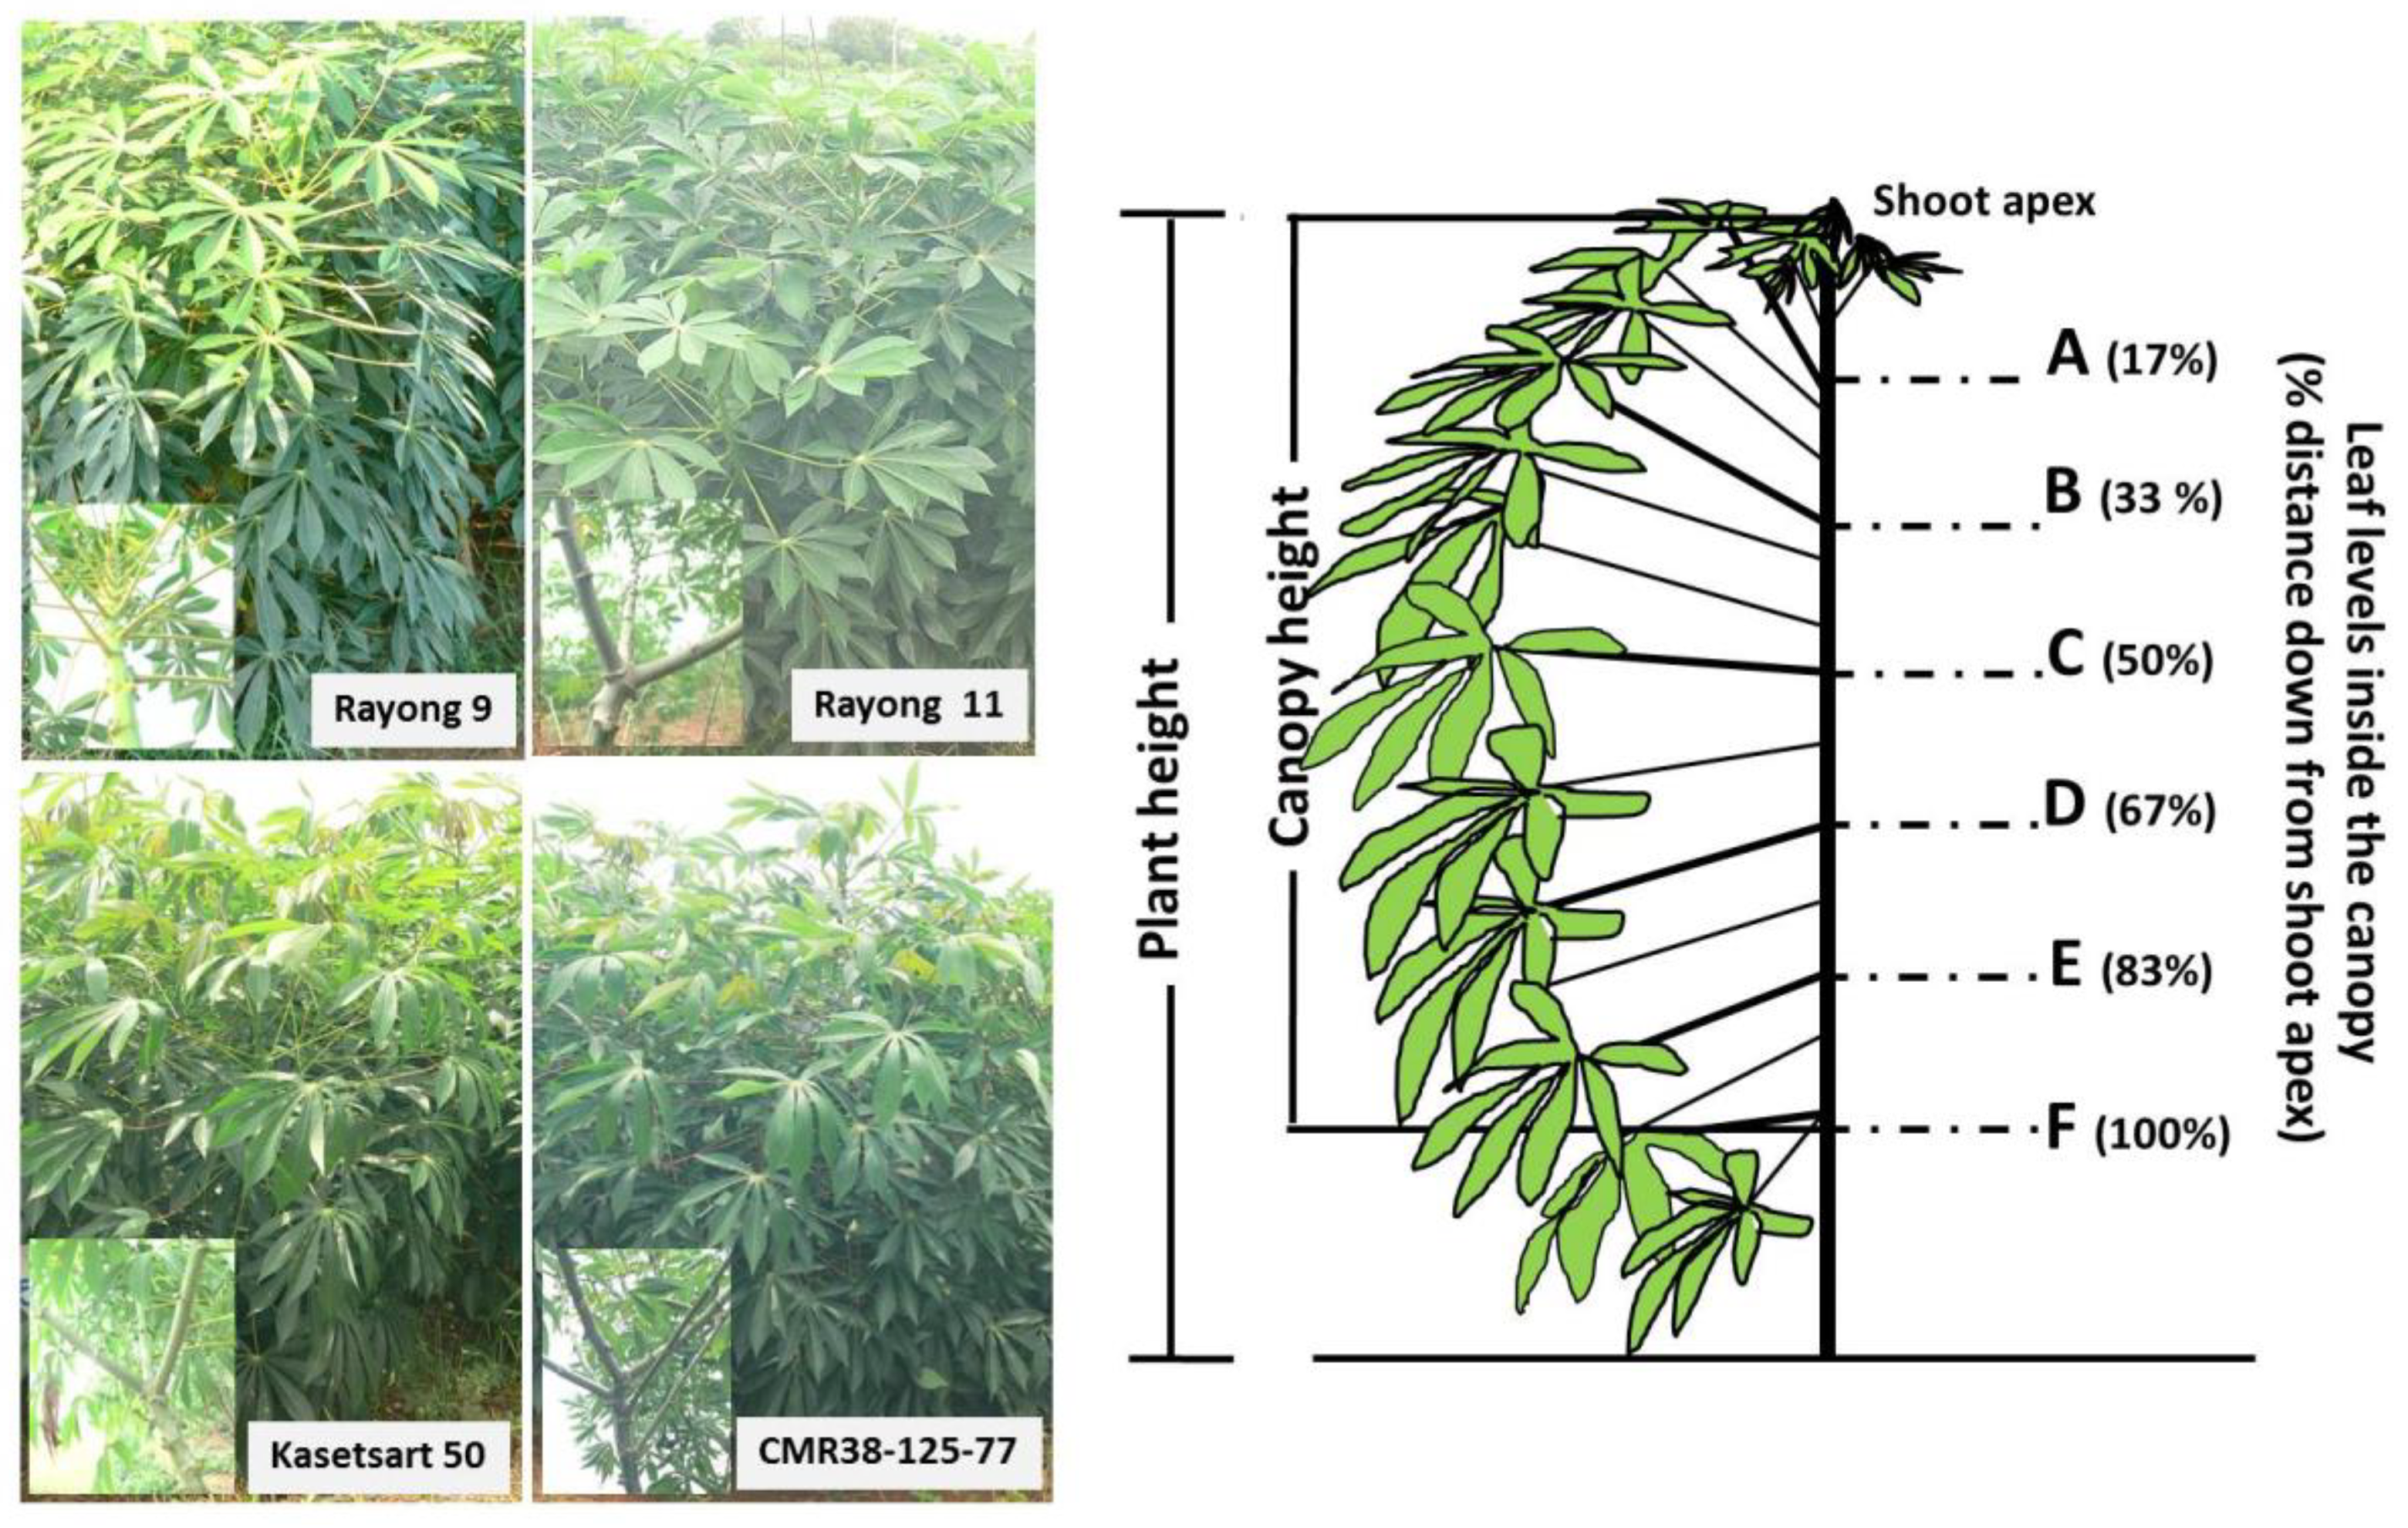
 ), Rayong 11 (RY11;
  ), Kasetsart 50 (KU50;
  ), and CMR38-125-77 (
  ) planted in April (Hot PD; D), June (Rainy PD; A,E), November (Cool PD1; B,F), and December (Cool PD2; (C) in 2015. The six canopy levels from A, B, C, D, E, to F were at the distance 17, 33, 50, 66, 88, and 100%, respectively, down from the shoot apex. Data show means of six plants (n = 6, two plants/replication).
), Rayong 11 (RY11; ), Kasetsart 50 (KU50; ), and CMR38-125-77 ( ) planted in April (Hot PD; D), June (Rainy PD; A,E), November (Cool PD1; B,F), and December (Cool PD2; (C) in 2015. The six canopy levels from A, B, C, D, E, to F were at the distance 17, 33, 50, 66, 88, and 100%, respectively, down from the shoot apex. Data show means of six plants (n = 6, two plants/replication).
) planted in April (Hot PD; D), June (Rainy PD; A,E), November (Cool PD1; B,F), and December (Cool PD2; (C) in 2015. The six canopy levels from A, B, C, D, E, to F were at the distance 17, 33, 50, 66, 88, and 100%, respectively, down from the shoot apex. Data show means of six plants (n = 6, two plants/replication).
), Rayong 11 (RY11; ), Kasetsart 50 (KU50; ), and CMR38-125-77 ( ) planted in April (Hot PD; D), June (Rainy PD; A,E), November (Cool PD1; B,F), and December (Cool PD2; (C) in 2015. The six canopy levels from A, B, C, D, E, to F were at the distance 17, 33, 50, 66, 88, and 100%, respectively, down from the shoot apex. Data show means of six plants (n = 6, two plants/replication).
 ), Rayong 11 (RY11;
  ), Kasetsart 50 (KU50;
  ), and CMR38-125-77 (
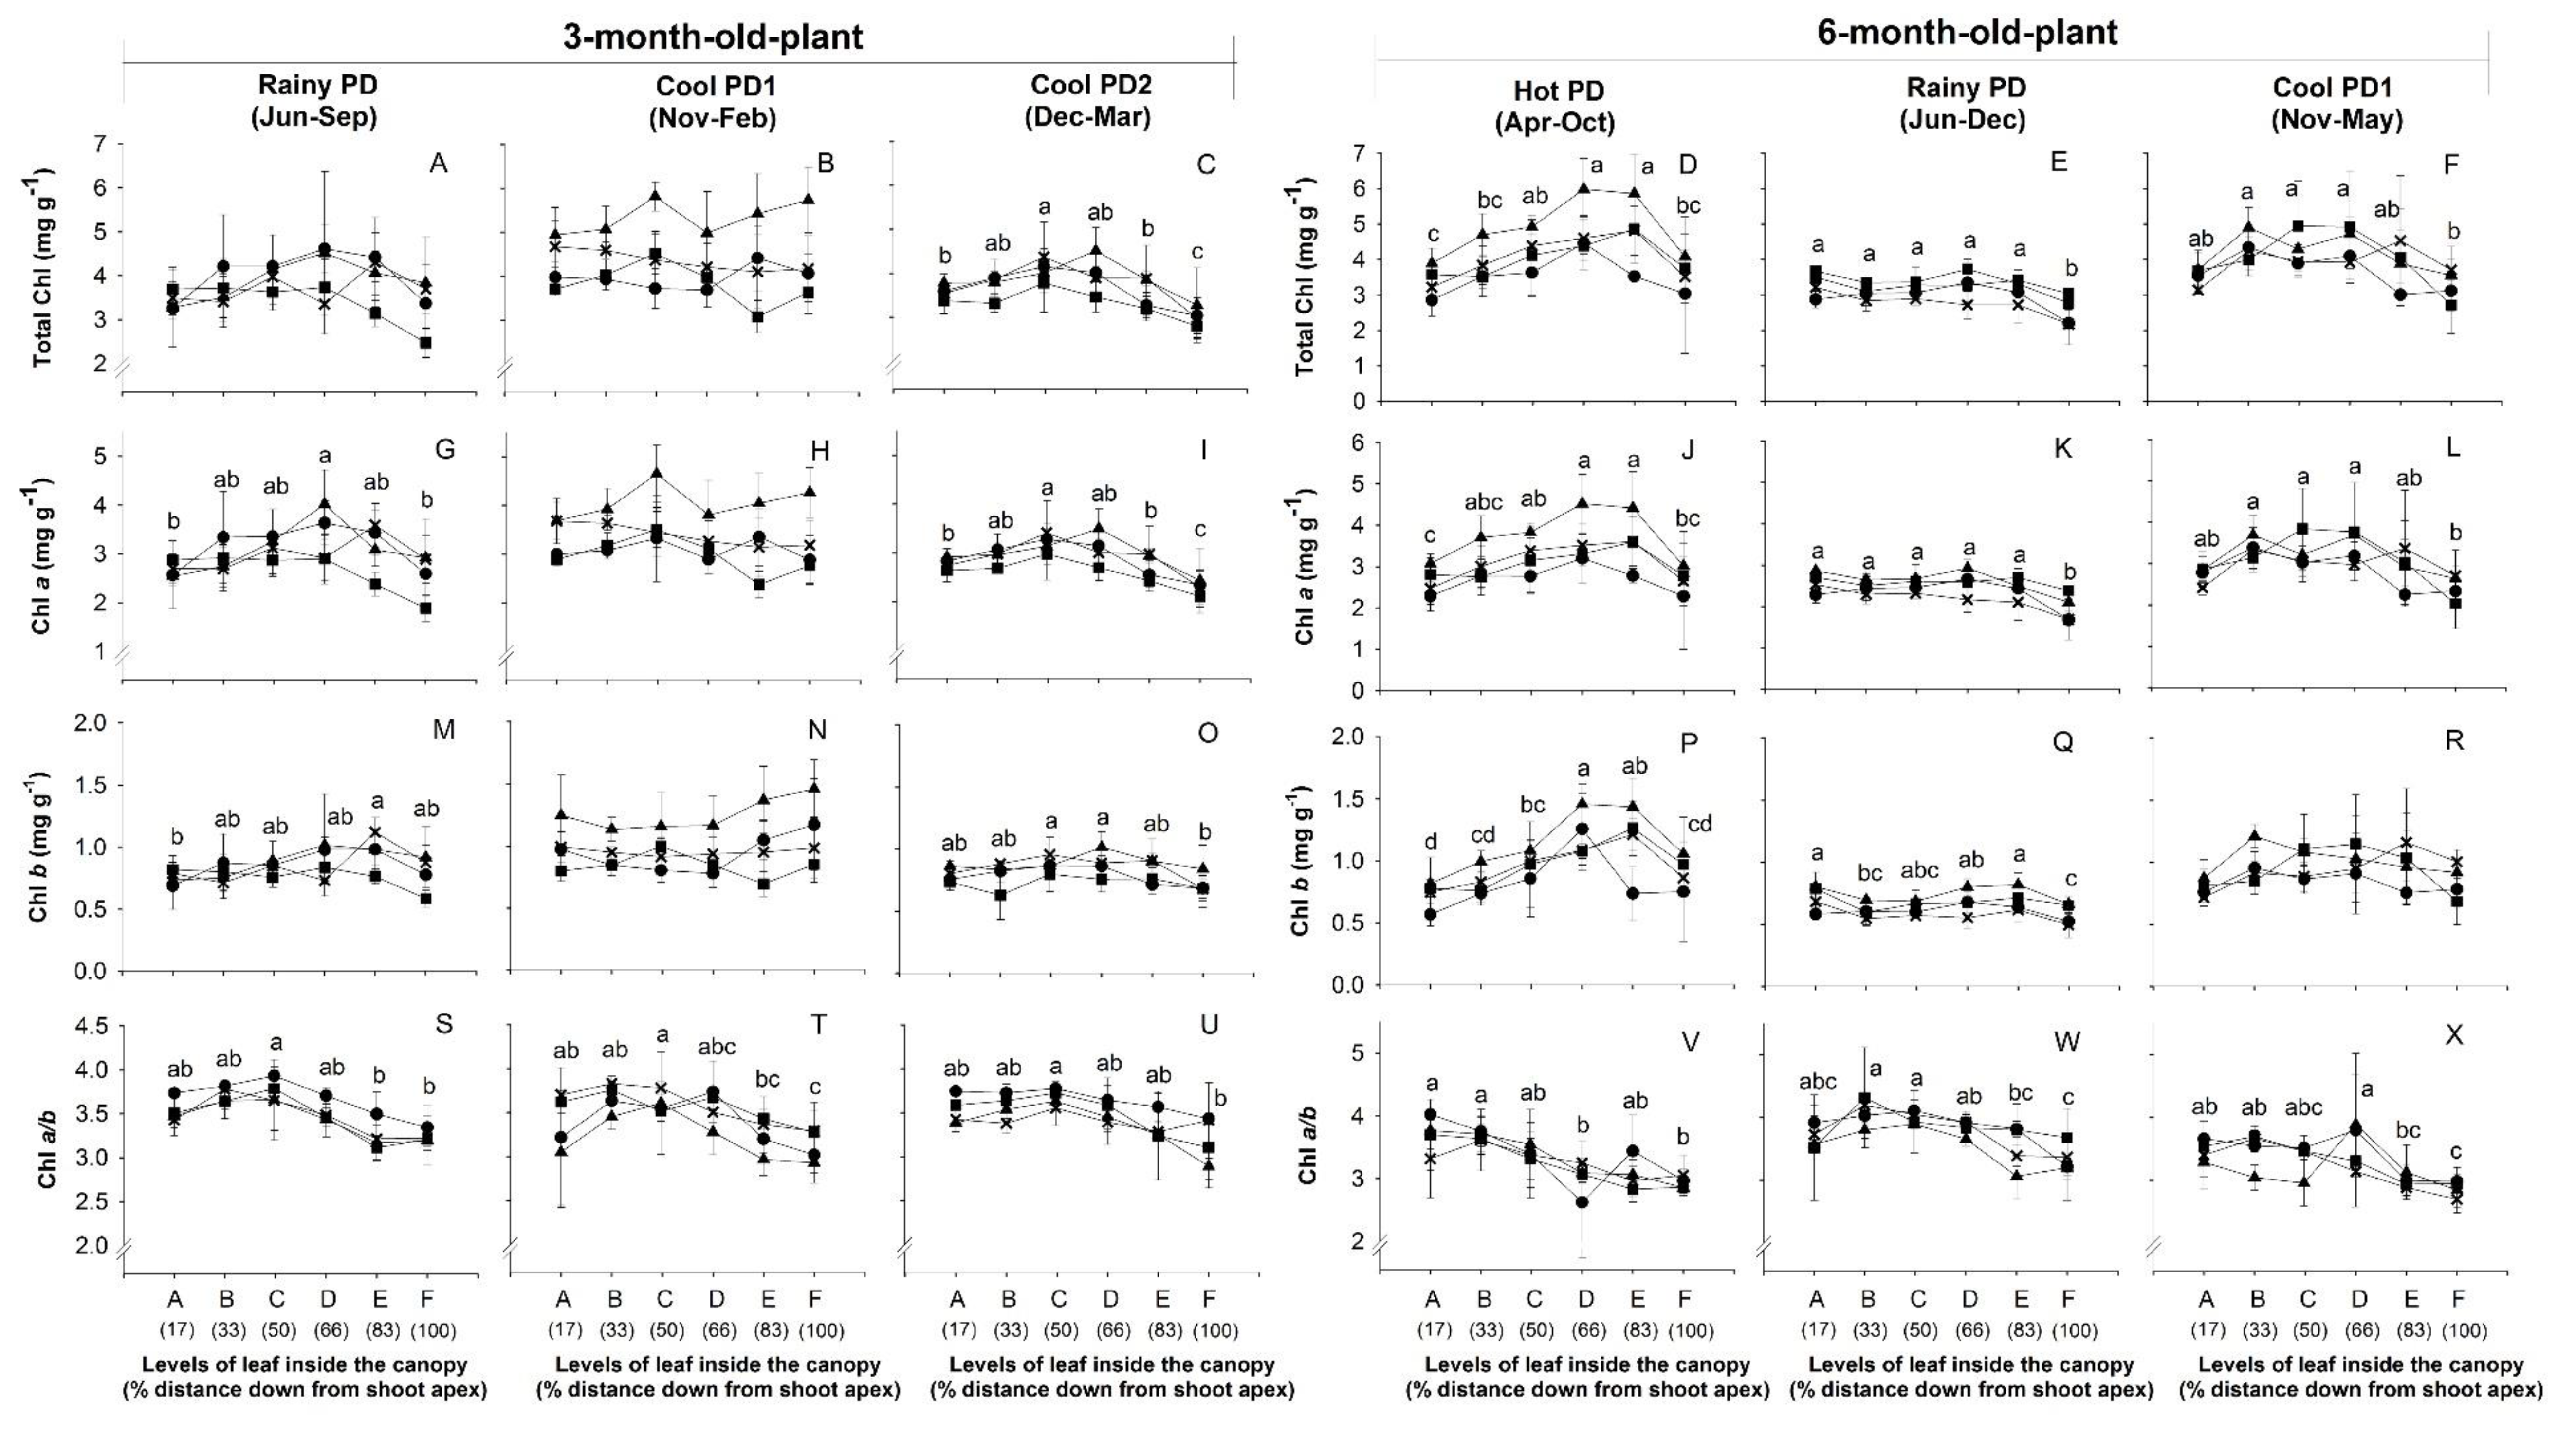
  ) were planted in April (Hot PD), June (Rainy PD), November (Cool PD1), and December (Cool PD2) in 2015. For each genotype and plant age, six plants (n = 6, two plants/replication) were observed. Means across genotypes that were significantly different (p < 0.05) among levels are denoted by lower case letters.
), Rayong 11 (RY11; ), Kasetsart 50 (KU50; ), and CMR38-125-77 ( ) were planted in April (Hot PD), June (Rainy PD), November (Cool PD1), and December (Cool PD2) in 2015. For each genotype and plant age, six plants (n = 6, two plants/replication) were observed. Means across genotypes that were significantly different (p < 0.05) among levels are denoted by lower case letters.
) were planted in April (Hot PD), June (Rainy PD), November (Cool PD1), and December (Cool PD2) in 2015. For each genotype and plant age, six plants (n = 6, two plants/replication) were observed. Means across genotypes that were significantly different (p < 0.05) among levels are denoted by lower case letters.
), Rayong 11 (RY11; ), Kasetsart 50 (KU50; ), and CMR38-125-77 ( ) were planted in April (Hot PD), June (Rainy PD), November (Cool PD1), and December (Cool PD2) in 2015. For each genotype and plant age, six plants (n = 6, two plants/replication) were observed. Means across genotypes that were significantly different (p < 0.05) among levels are denoted by lower case letters.
 ), Rayong 11 (RY11;
  ), Kasetsart 50 (KU50;
  ), and CMR38-125-77 (
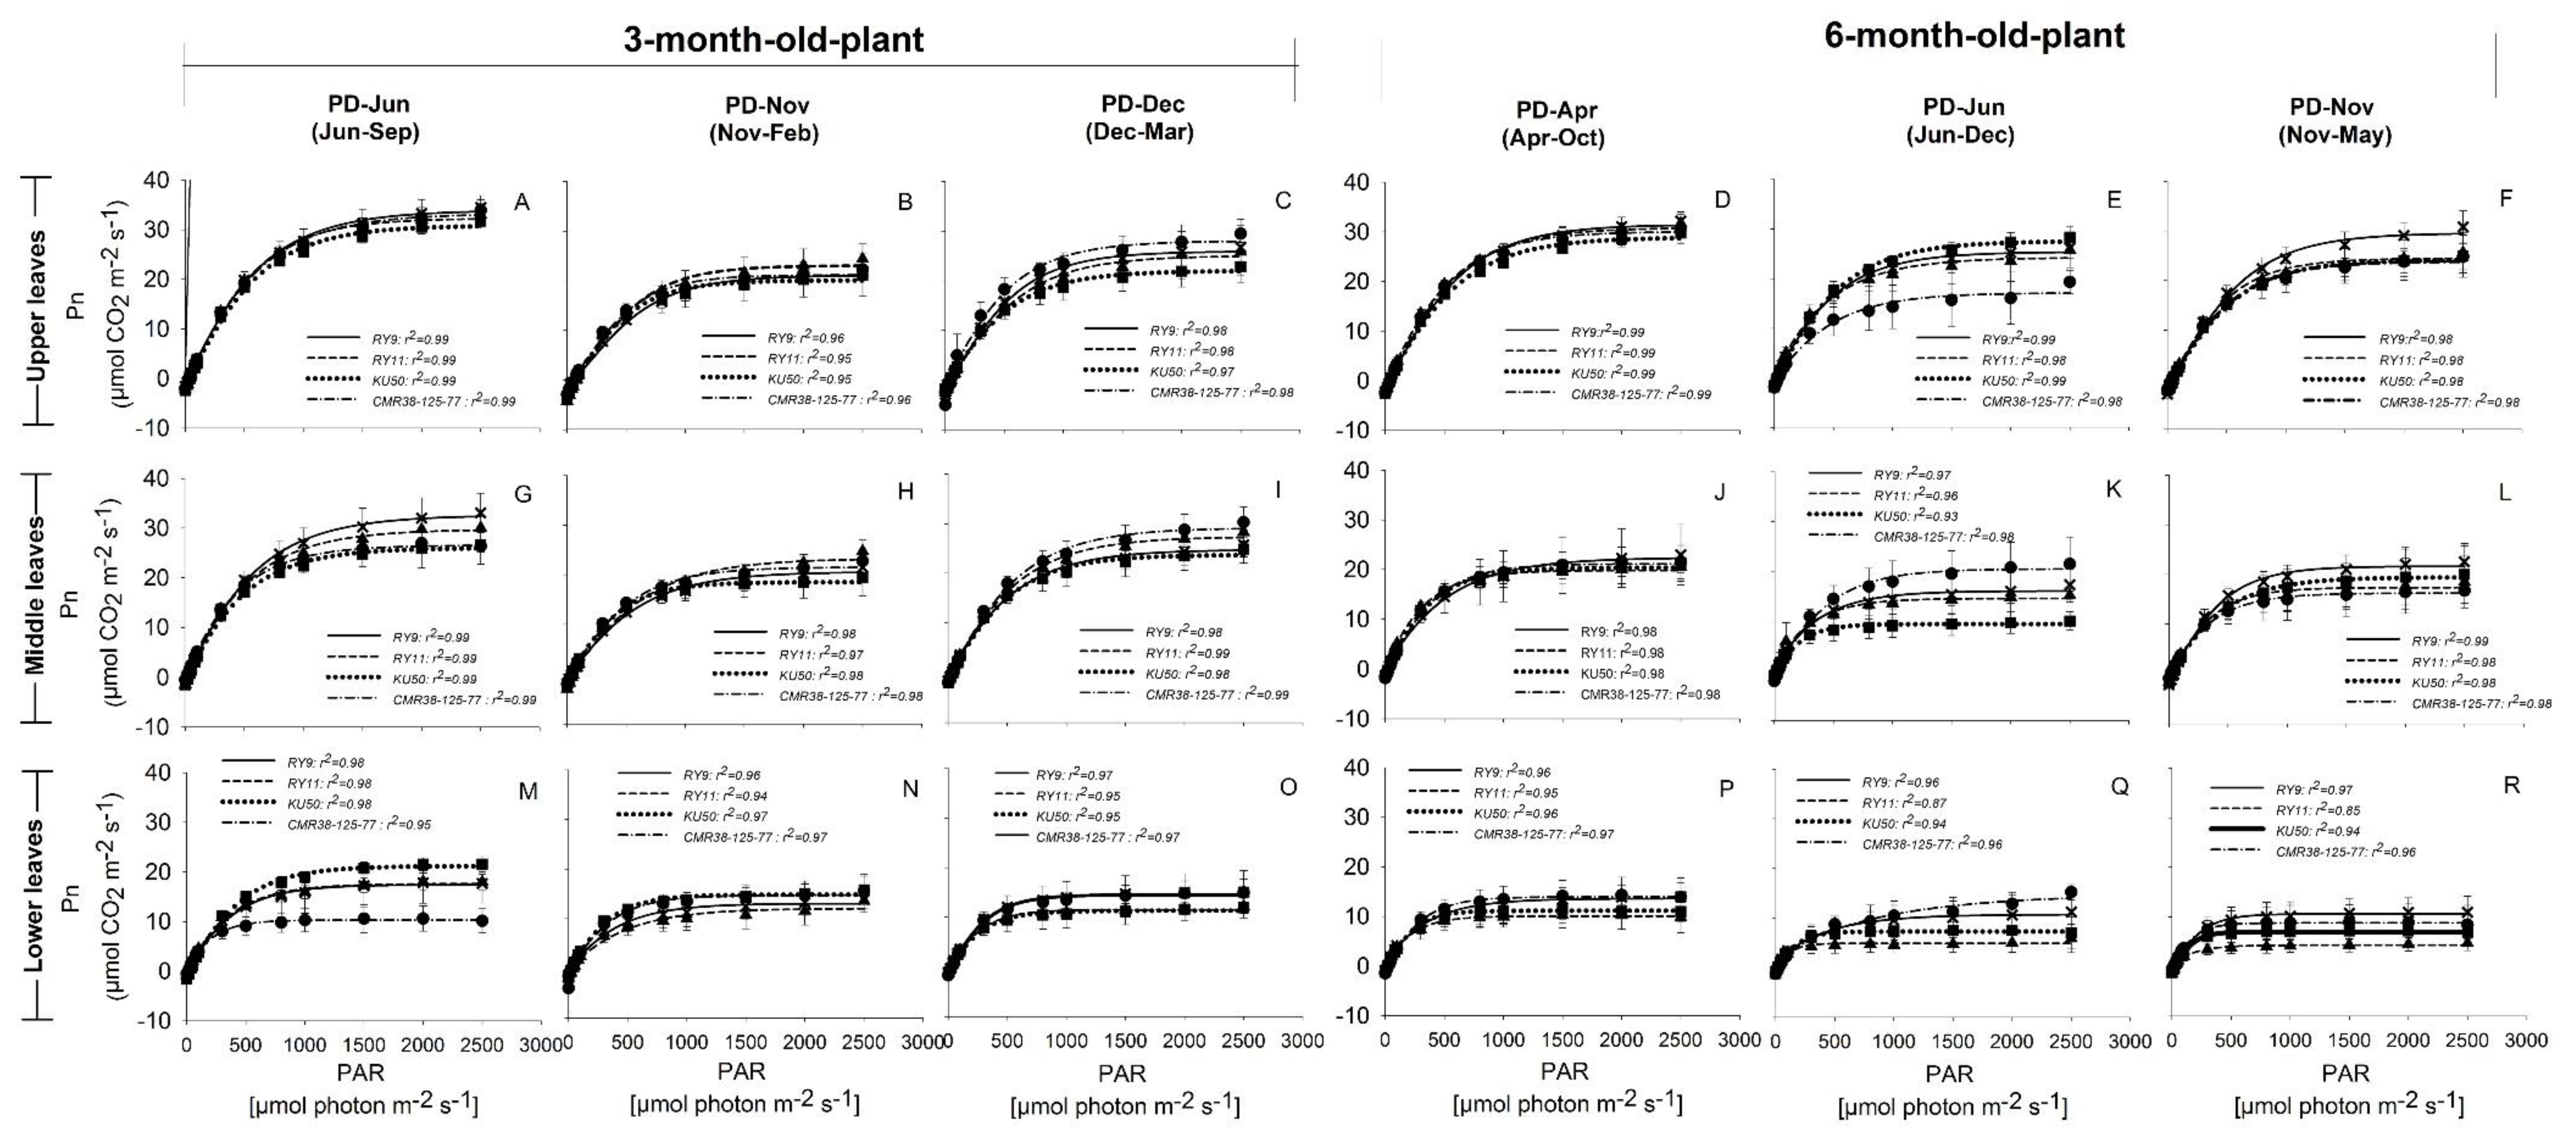
  ) were planted in April (Hot PD; D,J,P), June (Rainy PD; (A,G,M) for 3-month-old plants and (E,K,Q) for 6-month-old plants), November (Cool PD1; (B,H,N) for 3-month-old plants and (F,L,R) for 6-month-old plants), and December (Cool PD2; C,I,O) in 2015. Data show means of four plants of each genotype ± SD.
), Rayong 11 (RY11; ), Kasetsart 50 (KU50; ), and CMR38-125-77 ( ) were planted in April (Hot PD; D,J,P), June (Rainy PD; (A,G,M) for 3-month-old plants and (E,K,Q) for 6-month-old plants), November (Cool PD1; (B,H,N) for 3-month-old plants and (F,L,R) for 6-month-old plants), and December (Cool PD2; C,I,O) in 2015. Data show means of four plants of each genotype ± SD.
) were planted in April (Hot PD; D,J,P), June (Rainy PD; (A,G,M) for 3-month-old plants and (E,K,Q) for 6-month-old plants), November (Cool PD1; (B,H,N) for 3-month-old plants and (F,L,R) for 6-month-old plants), and December (Cool PD2; C,I,O) in 2015. Data show means of four plants of each genotype ± SD.
), Rayong 11 (RY11; ), Kasetsart 50 (KU50; ), and CMR38-125-77 ( ) were planted in April (Hot PD; D,J,P), June (Rainy PD; (A,G,M) for 3-month-old plants and (E,K,Q) for 6-month-old plants), November (Cool PD1; (B,H,N) for 3-month-old plants and (F,L,R) for 6-month-old plants), and December (Cool PD2; C,I,O) in 2015. Data show means of four plants of each genotype ± SD.
 ), Rayong 11 (RY11;
  ), Kasetsart 50 (KU50;
  ), and CMR38-125-77 (
  ) were planted in April (Hot PD), June (Rainy PD), November (Cool PD1), and December (Cool PD2) in 2015. Means across genotypes that were significantly different (p < 0.05) among levels are denoted by lower case letters.
), Rayong 11 (RY11; ), Kasetsart 50 (KU50; ), and CMR38-125-77 ( ) were planted in April (Hot PD), June (Rainy PD), November (Cool PD1), and December (Cool PD2) in 2015. Means across genotypes that were significantly different (p < 0.05) among levels are denoted by lower case letters.
) were planted in April (Hot PD), June (Rainy PD), November (Cool PD1), and December (Cool PD2) in 2015. Means across genotypes that were significantly different (p < 0.05) among levels are denoted by lower case letters.
), Rayong 11 (RY11; ), Kasetsart 50 (KU50; ), and CMR38-125-77 ( ) were planted in April (Hot PD), June (Rainy PD), November (Cool PD1), and December (Cool PD2) in 2015. Means across genotypes that were significantly different (p < 0.05) among levels are denoted by lower case letters.

| Genotype | Three-Month-Old Plant | Six-Month-Old Plant | ||||||
|---|---|---|---|---|---|---|---|---|
| Rainy PD (Jun–Sep) | Cool PD1 (Nov–Feb) | Cool PD2 (Dec–Mar) | Critical-p Value | Hot PD (Apr–Oct) | Rainy PD (Jun–Dec) | Cool PD1 (Nov–May) | Critical-p Value | |
| Plant height (cm) | ||||||||
| Rayong 9 | 116 ± 10 | 76 ± 11 | 86 ± 19 a | 369 ± 11 a | 228 ± 3 c* | 180 ± 23 a* | ||
| Rayong 11 | 103 ± 6 | 75 ± 9 | 65 ± 6 b | 301 ± 11 c | 218 ± 3 c* | 157 ± 8 b* | ||
| Kasetsart 50 | 104 ± 22 | 81 ± 15 | 80 ± 7 a | 350 ± 9 ab | 273 ± 23 a* | 155 ± 22 b* | ||
| CMR38-125-77 | 120 ± 11 | 85 ± 9 | 90 ± 9 a | 330 ± 23 b | 248 ± 14 b* | 153 ± 13 b* | ||
| F-test | ns | ns | p < 0.05 | p < 0.01 | p < 0.001 | p < 0.05 | ||
| mean | 111 A | 79 B | 80 B | p < 0.05 | 338 A | 242 B | 161 C | p < 0.001 |
| Canopy height (cm) | ||||||||
| Rayong 9 | 105 ± 6 * | 65 ± 9 | 67 ± 17 ab | 110 ± 9 a | 48 ± 9 c | 104 ± 22 * | ||
| Rayong 11 | 95 ± 7 * | 65 ± 4 | 50 ± 4 c | 90 ± 13 c | 68 ± 7 b | 97 ± 10 * | ||
| Kasetsart 50 | 97 ± 26 | 66 ± 11 | 63 ± 8 b | 102 ± 5 b | 111 ± 26 a | 96 ± 12 | ||
| CMR38-125-77 | 114 ± 14 | 67 ± 4 | 75 ± 10 a | 106 ± 12 ab | 75 ± 21 b | 91 ± 15 | ||
| F-test | ns | ns | p < 0.01 | p < 0.01 | p < 0.001 | ns | ||
| mean | 103 A | 66 B | 64 B | p < 0.01 | 102 | 75 | 97 | ns |
| LCR (%) | ||||||||
| Rayong 9 | 90.80 ± 1.84 * | 86.08 ± 2.02 * | 77.36 ± 3.54 | 28.82 ± 1.59 b | 20.05 ± 1.88 d | 56.51 ± 6.58 | ||
| Rayong 11 | 91.65 ± 0.65 * | 88.78 ± 11.62 * | 77.06 ± 3.00 | 28.64 ± 2.78 b | 30.20 ± 2.03 b | 60.70 ± 1.49 | ||
| Kasetsart 50 | 92.18 ± 4.42 * | 82.89 ± 6.04 * | 76.00 ± 5.45 | 28.74 ± 1.21 b | 37.93 ± 4.28 a | 61.93 ± 4.81 | ||
| CMR38-125-77 | 93.53 ± 1.54 * | 77.05 ± 3.27 * | 81.88 ± 4.87 | 31.26 ± 2.67 a | 27.40 ± 2.78 c | 58.53 ± 8.54 | ||
| F-test | ns | ns | ns | p < 0.01 | p < 0.001 | ns | ||
| mean | 92.05 A | 83.71 B | 78.08 C | p < 0.001 | 29.37 B | 28.90 B | 59.42 A | p < 0.001 |
| Total number of leaves | ||||||||
| Rayong 9 | 70 ± 16 a | 60 ± 19 | 54 ± 7 b | 160 ± 68 | 67 ± 13 b | 135 ± 65 * | ||
| Rayong 11 | 72 ± 16 a | 73 ± 18 | 51 ± 6 b | 291 ± 59 | 196 ± 115 a* | 256 ± 139 * | ||
| Kasetsart 50 | 44 ± 8 b | 46 ± 4 | 56 ± 6 b | 292 ± 95 | 143 ± 61 ab* | 154 ± 62 * | ||
| CMR38-125-77 | 77 ± 9 a | 62 ± 24 | 68 ± 10 a | 293 ± 82 | 93 ± 21 b | 192 ± 72 * | ||
| F-test | p < 0.01 | ns | p < 0.001 | ns | p < 0.05 | ns | ||
| mean | 66 | 60 | 57 | ns | 259 A | 125 B | 184 B | p < 0.05 |
| Internode length (cm) | ||||||||
| Rayong 9 | 1.54 ± 0.26 b* | 1.18 ± 0.38 | 1.23 ± 0.22 a | 2.79 ± 0.62 a | 0.91 ± 0.11 d | 2.01 ± 0.55 a | ||
| Rayong 11 | 1.37 ± 0.23 b | 0.93 ± 0.16 | 0.98 ± 0.07 b | 2.23 ± 0.25 b | 1.22 ± 0.19 c | 1.16 ± 0.33 bc | ||
| Kasetsart 50 | 2.20 ± 0.23 a* | 1.43 ± 0.13 * | 1.13 ± 0.16 ab | 1.37 ± 0.70 c | 1.62 ± 0.25 b | 1.13 ± 0.21 c | ||
| CMR38-125-77 | 1.47 ± 0.09 b | 1.24 ± 0.45 | 1.11 ± 0.06 ab | 2.41 ± 0.63 ab | 2.04 ± 0.34 a* | 1.41 ± 0.28 b | ||
| F-test | p < 0.05 | ns | p < 0.05 | p < 0.01 | p < 0.001 | p < 0.001 | ||
| mean | 1.65 A | 1.19 B | 1.11 B | p < 0.01 | 2.20 A | 1.45 B | 1.43 B | p < 0.05 |
| LAI (m2 m−2) | ||||||||
| Rayong 9 | 2.89 ± 0.64 | 1.96 ± 0.64 | 2.44 ± 0.58 b | 5.28 ± 1.53 a | 2.90 ± 1.37 c | 3.14 ± 1.05 b | ||
| Rayong 11 | 3.77 ± 1.37 | 2.44 ± 0.34 | 2.46 ± 0.33 b | 5.68 ± 1.94 a | 6.43 ± 1.40 a* | 4.19 ± 0.39 a | ||
| Kasetsart 50 | 3.09 ± 0.81 | 2.48 ± 1.18 | 1.99 ± 0.21 b | 4.08 ± 1.24 b | 4.95 ± 1.91 b | 2.75 ± 0.85 b | ||
| CMR38-125-77 | 4.10 ± 1.68 | 2.24 ± 0.55 | 3.48 ± 0.73 a | 5.01 ± 1.36 a | 2.76 ± 0.63 c | 1.80 ± 0.39 c | ||
| F-test | ns | ns | p < 0.01 | p < 0.05 | p < 0.001 | p < 0.01 | ||
| mean | 3.46 | 2.28 | 2.59 | ns | 5.01 | 4.26 | 2.97 | ns |
| Genotype | Three-Month-Old Plant | Six-Month-Old Plant | ||||||
|---|---|---|---|---|---|---|---|---|
| Rainy PD (Jun–Sep) | Cool PD1 (Nov–Feb) | Cool PD2 (Dec–Mar) | Critical-p Value | Hot PD (Apr–Oct) | Rainy PD (Jun–Dec) | Cool PD1 (Nov–May) | Critical-p Value | |
| Pn (µmol CO2 m−2 s−1) | ||||||||
| Rayong 9 | 22.43 ± 7.42 * | 15.81 ± 3.61 * | 16.71 ± 6.67 | 17.94 ± 9.45 | 17.95 ± 5.78 a | 12.60 ± 7.67 | ||
| Rayong 11 | 23.13 ± 6.47 * | 15.32 ± 5.08 | 18.42 ± 6.34 | 17.58 ± 8.74 | 12.92 ± 7.74 b | 13.15 ± 7.68 | ||
| Kasetsart 50 | 22.18 ± 6.40 * | 16.59 ± 4.01 * | 17.47 ± 7.00 | 15.78 ± 9.08 | 8.93 ± 5.47 c | 12.72 ± 7.49 | ||
| CMR38-125-77 | 24.95 ± 6.03 * | 16.24 ± 5.58 | 19.41 ± 5.99 | 18.37 ± 9.50 | 9.51 ± 4.51 c | 14.37 ± 6.40 | ||
| F-test | ns | ns | ns | ns | p > 0.001 | ns | ||
| mean | 23.17 A | 15.99 B | 18.00 B | p < 0.001 | 17.42 A | 12.33 B | 13.31 B | p < 0.01 |
| R (µmol CO2 m−2 s−1) | ||||||||
| Rayong 9 | 2.79 ± 1.13 b* | 2.98 ± 1.45 ab* | 2.87 ± 0.97 a | 2.22 ± 1.33 | 1.62 ± 0.70 | 2.22 ± 1.48 | ||
| Rayong 11 | 3.42 ± 1.15 a* | 3.48 ± 1.03 a* | 3.22 ± 1.48 a | 1.90 ± 1.40 | 1.93 ± 0.88 | 1.92 ± 1.07 | ||
| Kasetsart 50 | 2.25 ± 0.77 b* | 2.71 ± 0.99 b* | 2.04 ± 0.71 b | 1.49 ± 0.80 | 1.48 ± 0.68 | 1.67 ± 1.24 | ||
| CMR38-125-77 | 2.51 ± 1.01 b* | 2.58 ± 0.95 b* | 2.34 ± 0.73 b | 1.68 ± 1.14 | 2.05 ± 0.70 | 1.74 ± 1.08 | ||
| F-test | p < 0.05 | ns | p < 0.01 | ns | ns | ns | ||
| mean | 2.74 | 2.94 | 2.62 | ns | 1.82 | 1.77 | 1.89 | ns |
| Gs (mol H2O m−2 s−1) | ||||||||
| Rayong 9 | 0.49 ± 0.24 * | 0.18 ± 0.07 | 0.33 ± 0.25 | 0.32 ± 0.23 | 0.21 ± 0.09 a | 0.15 ± 0.13 | ||
| Rayong 11 | 0.57 ± 0.23 * | 0.22 ± 0.09 | 0.37 ± 0.20 | 0.25 ± 0.17 | 0.11 ± 0.09 b | 0.17 ± 0.16 | ||
| Kasetsart 50 | 0.44 ± 0.18 * | 0.20 ± 0.07 | 0.26 ± 0.18 | 0.29 ± 0.24 | 0.07 ± 0.05 c | 0.20 ± 0.21 | ||
| CMR38-125-77 | 0.62 ± 0.20 * | 0.20 ± 0.10 | 0.34 ± 0.16 | 0.29 ± 0.24 | 0.06 ± 0.04 c | 0.17 ± 0.13 | ||
| F-test | ns | ns | ns | ns | p > 0.001 | ns | ||
| mean | 0.53 A | 0.20 C | 0.32 B | p < 0.001 | 0.30 A | 0.11 C | 0.17 B | p < 0.001 |
| Tr (mmol H2O m−2 s−1) | ||||||||
| Rayong 9 | 6.87 ± 2.19 * | 4.78 ± 1.38 * | 5.11 ± 1.91 bc | 4.46 ± 2.28 a | 1.69 ± 0.56 b | 2.91 ± 1.98 | ||
| Rayong 11 | 8.26 ± 1.73 * | 4.39 ± 1.78 * | 7.75 ± 1.88 a | 1.69 ± 0.95 b | 2.46 ± 1.53 a | 2.41 ± 1.73 | ||
| Kasetsart 50 | 7.32 ± 1.92 * | 4.62 ± 1.18 * | 4.90 ± 1.62 c | 1.62 ± 0.95 b | 0.94 ± 0.55 c | 2.12 ± 1.59 | ||
| CMR38-125-77 | 8.48 ± 1.59 * | 4.40 ± 1.42 * | 6.31 ± 1.50 ab | 1.60 ± 0.87 b | 1.15 ± 0.58 c | 2.90 ± 1.69 | ||
| F-test | ns | ns | p < 0.05 | p > 0.001 | p > 0.001 | ns | ||
| mean | 7.73 A | 4.55 C | 6.27 B | p < 0.001 | 2.34 A | 1.56 B | 2.59 A | p < 0.01 |
| Ci/Ca | ||||||||
| Rayong 9 | 0.72 ± 0.08 * | 0.56 ± 0.06 | 0.69 ± 0.15 | 0.66 ± 0.08 | 0.58 ± 0.08 a | 0.52 ± 0.17 b | ||
| Rayong 11 | 0.75 ± 0.06 * | 0.62 ± 0.07 | 0.72 ± 0.12 | 0.71 ± 0.16 | 0.43 ± 0.09 b | 0.68 ± 0.28 a | ||
| Kasetsart 50 | 0.70 ± 0.07 * | 0.58 ± 0.05 | 0.58 ± 0.11 | 0.67 ± 0.12 | 0.34 ± 0.09 c | 0.56 ± 0.24 ab | ||
| CMR38-125-77 | 0.75 ± 0.06 * | 0.58 ± 0.08 * | 0.69 ± 0.06 | 0.64 ± 0.12 | 0.30 ± 0.07 c | 0.50 ± 0.19 b | ||
| F-test | ns | ns | ns | ns | p > 0.001 | p < 0.05 | ||
| mean | 0.73 A | 0.59 C | 0.67 B | p < 0.01 | 0.67 A | 0.41 C | 0.57 B | p < 0.001 |
| WUE (µmol CO2 mmol H2O−1) | ||||||||
| Rayong 9 | 3.34 ± 0.78 | 3.38 ± 0.44 | 3.23 ± 0.55 ab | 3.96 ± 0.47 b | 10.35 ± 0.89 a* | 5.35 ± 1.40 * | ||
| Rayong 11 | 2.79 ± 0.46 | 2.77 ± 0.72 | 2.14 ± 0.50 c | 10.94 ± 2.01 a | 5.25 ± 0.73 c* | 6.85 ± 2.63 * | ||
| Kasetsart 50 | 3.05 ± 0.47 | 3.63 ± 0.49 | 3.75 ± 0.43 a | 9.56 ± 2.68 a | 9.82 ± 2.53 ab* | 4.89 ± 1.68 * | ||
| CMR38-125-77 | 2.95 ± 0.54 | 3.69 ± 0.52 | 3.00 ± 0.67 bc | 11.91 ± 3.09 a | 8.71 ± 1.83 b* | 5.25 ± 1.85 * | ||
| F-test | ns | ns | p < 0.05 | p < 0.01 | p > 0.001 | ns | ||
| mean | 3.03 | 3.37 | 3.04 | ns | 9.09 A | 8.53 A | 5.49 B | p < 0.001 |
| Leaf Level | Genotype | Three-Month-Old Plant | Six-Month-Old Plant | ||||
|---|---|---|---|---|---|---|---|
| Rainy PD (Jun–Sep) | Cool PD1 (Nov–Feb) | Cool PD2 (Dec–Mar) | Hot PD (Apr–Oct) | Rainy PD (Jun–Dec) | Cool PD1 (Nov–May) | ||
| Pn(Imax) (µmol CO2 m−2 s−1) | |||||||
| Level B | Rayong 9 | 33.47 ± 2.18 A* | 20.91 ± 1.67 B | 25.76 ± 5.29 B | 30.96 ± 1.63 A | 25.19 ± 1.61 aB | 29.16 ± 2.74 A* |
| Rayong 11 | 31.91 ± 1.86 A* | 23.15 ± 3.13 B | 24.69 ± 1.66 B | 30.45 ± 1.39 A | 24.03 ± 3.08 aB | 24.42 ± 3.86 B | |
| Kasetsart 50 | 30.37 ± 1.34 A* | 20.46 ± 3.66 B | 21.83 ± 3.15 B | 28.45 ± 1.29 | 27.24 ± 1.54 a | 23.93 ± 4.07 | |
| CMR38-125-77 | 32.43 ± 1.96 A* | 21.26 ± 1.72 C | 27.82 ± 1.91 B | 29.85 ± 2.94 A | 16.97 ± 3.60 bC | 23.64 ± 2.39 B | |
| mean | 32.05 A | 21.45 C | 25.03 B | 29.93 A | 23.36 B | 25.29 B | |
| Level D | Rayong 9 | 31.82 ± 3.33 aA* | 20.29 ± 2.23 B | 24.40 ± 3.04 abB | 21.94 ± 5.99 | 15.87 ± 3.98 a | 21.72 ± 3.59 |
| Rayong 11 | 29.24 ± 2.20 abA* | 22.68 ± 1.76 B | 26.92 ± 0.54 abA | 19.53 ± 2.97 | 14.25 ± 1.26 ab | 17.20 ± 4.71 | |
| Kasetsart 50 | 25.51 ± 3.35 bA* | 18.86 ± 3.24 B | 23.61 ± 1.27 bA | 20.23 ± 1.17 A | 8.95 ± 2.26 bB | 19.19 ± 4.85 A | |
| CMR38-125-77 | 26.28 ± 1.00 abA* | 21.49 ± 1.85 B* | 28.68 ± 3.12 aA | 20.97 ± 3.23 | 20.40 ± 4.41 a | 15.98 ± 3.47 | |
| mean | 28.22 A | 20.83 C | 25.91 B | 20.68 A | 14.87 B | 18.53 A | |
| Level F | Rayong 9 | 17.18 ± 3.60 a | 12.65 ± 2.93 | 14.34 ± 3.31 | 13.04 ± 4.07 | 9.98 ± 4.20 a | 10.25 ± 2.95 a |
| Rayong 11 | 17.36 ± 1.72 aA* | 11.50 ± 2.73 B* | 11.08 ± 1.16 B | 9.67 ± 2.49 A | 4.62 ± 1.89 bB | 3.87 ± 1.30 bB | |
| Kasetsart 50 | 21.06 ± 1.33 aA* | 14.97 ± 2.23 B* | 10.86 ± 2.06 C | 10.70 ± 2.46 | 7.00 ± 2.54 a | 6.65 ± 1.56 ab | |
| CMR38-125-77 | 9.86 ± 2.42 bB | 14.48 ± 2.42 A* | 14.13 ± 2.04 A | 13.71 ± 2.15 A | 12.80 ± 2.10 aA | 8.54 ± 3.48 abB | |
| mean | 16.37 A | 13.41 B | 12.61 B | 11.79 A | 8.60 B | 7.33 B | |
| Icomp (µmol photon m−2 s−1) | |||||||
| Level B | Rayong 9 | 33.09 ± 8.48 C | 70.28 ± 6.33 aA* | 50.64 ± 9.73 B | 41.21 ± 4.57 A | 25.29 ± 2.30 abB | 49.04 ± 7.06 A |
| Rayong 11 | 35.92 ± 8.20 B* | 74.12 ± 8.03 aA* | 49.88 ± 9.90 B | 30.27 ± 11.83 AB | 16.72 ± 10.01 bB | 38.80 ± 4.92 A | |
| Kasetsart 50 | 39.98 ± 6.17* | 55.61 ± 13.47 b | 38.81 ± 12.95 | 41.63 ± 10.61 | 30.81 ± 2.91 a | 42.99 ± 16.05 | |
| CMR38-125-77 | 33.24 ± 10.36 B | 55.55 ± 7.13 bA | 42.04 ± 7.58 AB | 38.74 ± 5.06 | 35.92 ± 7.89 a | 38.38 ± 12.21 | |
| mean | 35.56 C | 63.89 A | 45.35 B | 37.97 A | 27.19 B | 42.30 A | |
| Level D | Rayong 9 | 24.81 ± 2.27 aB | 40.60 ± 9.16 A | 31.41 ± 6.65 AB | 24.83 ± 5.95 aAB | 16.75 ± 9.31 bB | 36.32 ± 6.13 A |
| Rayong 11 | 21.02 ± 2.32 abB | 51.47 ± 5.79 A* | 30.93 ± 10.41 B | 8.75 ± 5.53 bB | 18.98 ± 8.00 abAB | 27.43 ± 10.88 A | |
| Kasetsart 50 | 24.79 ± 11.07 a | 36.15 ± 11.47 | 36.41 ± 4.05 | 23.15 ± 6.720 a | 22.55 ± 3.79 ab | 27.89 ± 14.03 | |
| CMR38-125-77 | 8.19 ± 5.12 bB | 36.78 ± 9.92 A* | 35.60 ± 5.74 A | 30.20 ± 5.25 aAB | 34.92 ± 10.95 aA* | 15.26 ± 11.32 B | |
| mean | 19.71 C | 41.25 A | 33.59 B | 21.74 | 23.31 | 26.73 | |
| Level F | Rayong 9 | 19.69 ± 2.57 ab | 31.10 ± 13.15 | 24.02 ± 7.88 | 15.12 ± 2.28 B | 13.33 ± 5.87 B | 21.98 ± 3.07 A |
| Rayong 11 | 15.02 ± 7.82 bB | 39.82 ± 11.44 A* | 24.54 ± 7.21 B | 8.45 ± 9.77 | 16.32 ± 10.47 | 16.68 ± 13.74 | |
| Kasetsart 50 | 28.46 ± 8.37 a | 28.35 ± 10.68 | 23.14 ± 8.34 | 21.22 ± 10.64 | 23.64 ± 6.67 | 25.33 ± 14.84 | |
| CMR38-125-77 | 9.48 ± 3.18 bB | 27.36 ± 8.98 A* | 31.60 ± 5.65 A | 24.32 ± 16.28 | 17.78 ± 3.57* | 9.21 ± 10.67 | |
| mean | 18.17 B | 31.66 A | 25.83 A | 17.28 | 17.77 | 18.31 | |
| Imax (µmol photon m−2 s−1) | |||||||
| Level B | Rayong 9 | 1950 ± 0.00 | 1950 ± 0.00 | 1944 ± 11.0 | 1950 ± 0.00 | 1950 ± 0.00 | 1950 ± 0.00 |
| Rayong 11 | 1950 ± 0.00 | 1950 ± 0.00 | 1950 ± 0.00 | 1950 ± 0.00 | 1950 ± 0.00 | 1833 ± 233 | |
| Kasetsart 50 | 1950 ± 0.00 | 1950 ± 0.00 | 1923 ± 53.0 | 1950 ± 0.00 | 1950 ± 0.00 | 1895 ± 109 | |
| CMR38-125-77 | 1950 ± 0.00 | 1862 ± 105 | 1934 ± 32.0 | 1950 ± 0.00 | 1912 ± 75.0 | 1847 ± 119 | |
| mean | 1950 | 1928 | 1938 | 1950 A | 1941 A | 1882 B | |
| Level D | Rayong 9 | 1950 ± 0.00 | 1950 ± 0.00 | 1950 ± 0.00 | 1922 ± 56.0 | 1639 ± 261 a | 1768 ± 363 |
| Rayong 11 | 1950 ± 0.00* | 1950 ± 0.00 | 1950 ± 0.00 | 1429 ± 302 | 1371 ± 333 ab | 1448 ± 367 | |
| Kasetsart 50 | 1853 ± 149* | 1831 ± 237 | 1950 ± 0.00 | 1604 ± 253 A | 903 ± 134 bB | 1709 ± 350 A | |
| CMR38-125-77 | 1878 ± 138 | 1950 ± 0.00 | 1950 ± 0.00 | 1613 ± 239 | 1802 ± 296 a | 1404 ± 407 | |
| mean | 1907 | 1920 | 1950 | 1642 | 1429 | 1583 | |
| Level F | Rayong 9 | 1540 ± 182 a | 1479 ± 160* | 1152 ± 332 | 1294 ± 162 | 1169 ± 487 ab | 816 ± 310 |
| Rayong 11 | 1558 ± 330 a* | 1485 ± 489* | 976 ± 690 | 769 ± 388 | 513 ± 231 b | 474 ± 114 | |
| Kasetsart 50 | 1754 ± 236 aA* | 1555 ± 296 A* | 995 ± 690 B | 754 ± 87 | 580 ± 338 b | 503 ± 103 | |
| CMR38-125-77 | 763 ± 196 bB | 1368 ± 359 A* | 1227 ± 294 AB | 1151 ± 446 B | 1758 ± 323 aA* | 480 ± 341 C | |
| mean | 1404 A | 1472 A | 1088 B | 1144 A | 1006 A | 569 B | |
| AQE (μmolCO2 μmol photon−1) | |||||||
| Level B | Rayong 9 | 0.063 ± 0.001 A | 0.049 ± 0.003 cC | 0.057 ± 0.002 B | 0.058 ± 0.003 b | 0.063 ± 0.003 b | 0.064 ± 0.009* |
| Rayong 11 | 0.065 ± 0.005 | 0.061 ± 0.005 b | 0.056 ± 0.005 | 0.070 ± 0.003 aAB | 0.080 ± 0.013 aA | 0.061 ± 0.005 B | |
| Kasetsart 50 | 0.063 ± 0.003 B | 0.079 ± 0.007 aA* | 0.053 ± 0.005 C | 0.065 ± 0.006 a | 0.061 ± 0.004 b | 0.054 ± 0.007 | |
| CMR38-125-77 | 0.067 ± 0.008 | 0.056 ± 0.007 b | 0.083 ± 0.036 | 0.063 ± 0.005 ab | 0.060 ± 0.013 b | 0.052 ± 0.003 | |
| mean | 0.065 | 0.062 | 0.063 | 0.064 AB | 0.067 A | 0.058 B | |
| Level D | Rayong 9 | 0.064 ± 0.001 A | 0.058 ± 0.002 bB | 0.060 ± 0.003 B | 0.066 ± 0.005 | 0.075 ± 0.020 | 0.066 ± 0.017 |
| Rayong 11 | 0.068 ± 0.009 | 0.062 ± 0.009 b | 0.059 ± 0.003 | 0.065 ± 0.003 | 0.108 ± 0.043 | 0.072 ± 0.006 | |
| Kasetsart 50 | 0.061 ± 0.002 B | 0.087 ± 0.011 aA* | 0.062 ± 0.004 B | 0.064 ± 0.010 | 0.075 ± 0.016 | 0.059 ± 0.007 | |
| CMR38-125-77 | 0.060 ± 0.004 | 0.058 ± 0.006 b | 0.065 ± 0.005 | 0.061 ± 0.002 | 0.068 ± 0.004* | 0.062 ± 0.021 | |
| mean | 0.064 | 0.067 | 0.062 | 0.064 B | 0.082 A | 0.065 B | |
| Level F | Rayong 9 | 0.060 ± 0.009 | 0.057 ± 0.010 b | 0.055 ± 0.005 | 0.069 ± 0.010 | 0.060 ± 0.013 | 0.053 ± 0.008 |
| Rayong 11 | 0.066 ± 0.006 | 0.053 ± 0.009 b | 0.056 ± 0.007 | 0.049 ± 0.008 | 0.069 ± 0.021 | 0.058 ± 0.015 | |
| Kasetsart 50 | 0.061 ± 0.003 B | 0.089 ± 0.010 aA* | 0.052 ± 0.005 B | 0.051 ± 0.008 | 0.053 ± 0.007 | 0.050 ± 0.002 | |
| CMR38-125-77 | 0.057 ± 0.006* | 0.056 ± 0.009 b | 0.061 ± 0.004 | 0.059 ± 0.017 | 0.041 ± 0.011 | 0.050 ± 0.010 | |
| mean | 0.062 | 0.064 | 0.056 | 0.058 | 0.056 | 0.053 | |
| Genotype | Three-Month-Old Plant | Six-Month-Old Plant | ||||
|---|---|---|---|---|---|---|
| Rainy PD (Jun–Sep) | Cool PD1 (Nov–Feb) | Cool PD2 (Dec–Mar) | Hot PD (Apr–Oct) | Rainy PD (Jun–Dec) | Cool PD1 (Nov–May) | |
| Total Chl (mg g−1) | ||||||
| Rayong 9 | 3.71 ± 0.59 B* | 4.35 ± 0.57 bA | 3.75 ± 0.55 aB | 4.07 ± 0.80 bA | 2.76 ± 0.47 cB | 3.92 ± 0.84 A |
| Rayong 11 | 3.89 ± 0.92 B | 5.33 ± 0.70 aA | 3.87 ± 0.59 aB | 4.91 ± 1.05 aA | 3.37 ± 0.38 aC | 4.18 ± 0.78 B |
| Kasetsart 50 | 3.40 ± 0.63 AB | 3.82 ± 0.54 cA | 3.32 ± 0.44 bB | 4.04 ± 0.77 bA | 3.27 ± 0.27 abB | 4.05 ± 1.20 A |
| CMR38-125-77 | 4.02 ± 0.78 * | 3.96 ± 0.44 bc | 3.66± 0.49 ab | 3.51 ± 0.89 bA | 2.94 ± 0.40 bcB | 3.67 ± 0.62 A |
| mean | 3.76 B | 4.37 A | 4.13 B | 4.13 A | 3.08 B | 3.95 A |
| Chl a (mg g−1) | ||||||
| Rayong 9 | 2.93 ± 0.45 abB* | 3.40 ± 0.44 bA* | 2.90 ± 0.43 abB | 3.11 ± 0.64 bA | 2.18 ± 0.39 cB | 2.98 ± 0.64 A |
| Rayong 11 | 3.10 ± 0.68 abB* | 4.06 ± 0.57 aA* | 2.98 ± 0.48 aB | 3.76 ± 0.79 aA | 2.62 ± 0.33 aC | 3.17 ± 0.62 B |
| Kasetsart 50 | 2.64 ± 0.52 bAB | 2.98 ± 0.43 bA | 2.57 ± 0.37 bB | 3.07 ± 0.54 bAB | 2.58 ± 0.23 abB | 3.11 ± 0.93 A |
| CMR38-125-77 | 3.16 ± 0.63 a* | 3.09 ± 0.49 b | 2.87 ± 0.40 ab | 2.69 ± 0.64 bAB | 2.33 ± 0.34 bcB | 2.83 ± 0.50 A |
| mean | 2.92 B | 3.39 A | 3.16 B | 3.16 A | 2.43 B | 3.02 A |
| Chl b (mg g−1) | ||||||
| Rayong 9 | 0.85 ± 0.16 * | 0.96 ± 0.15 b | 0.85 ± 0.12 a | 0.96 ± 0.19 abA | 0.58 ± 0.09 bB | 0.94 ± 0.22 A |
| Rayong 11 | 0.88 ± 0.22 B* | 1.26 ± 0.24 aA* | 0.89 ± 0.12 aB | 1.14 ± 0.28 aA | 0.75 ± 0.09 aB | 1.01 ± 0.21 A |
| Kasetsart 50 | 0.76 ± 0.12 AB* | 0.84 ± 0.12 bA | 0.73 ± 0.12 bB | 0.97 ± 0.25 abA | 0.68 ± 0.10 aB | 0.94 ± 0.28 A |
| CMR38-125-77 | 0.86 ± 0.16 AB* | 0.94 ± 0.22 bA | 0.78 ± 0.09b bB | 0.82 ± 0.31 bA | 0.61 ± 0.06 bB | 0.84 ± 0.16 A |
| mean | 0.84 B | 1.00 A | 0.97 B | 0.97 A | 0.65 B | 0.93 A |
| Chl a/b | ||||||
| Rayong 9 | 3.46 ± 0.27 | 3.58 ± 0.28 * | 3.41 ± 0.21 | 3.26 ± 0.44 B | 3.77 ± 0.37 A | 3.21± 0.41 B |
| Rayong 11 | 3.43 ± 0.30 | 3.22 ± 0.41 | 3.36 ± 0.27 | 3.34 ± 0.40 | 3.53 ± 0.39 | 3.19 ± 0.64 |
| Kasetsart 50 | 3.45 ± 0.25 | 3.55 ± 0.20 | 3.65 ± 0.82 | 3.24 ± 0.43 B | 3.85 ± 0.63 A* | 3.32 ± 0.31 B |
| CMR38-125-77 | 3.67 ± 0.24 A | 3.39 ± 0.43 B | 3.65 ± 0.16 A | 3.37 ± 0.63 | 3.83 ± 0.33 | 3.42 ± 0.54 |
| mean | 3.52 | 3.44 | 3.33 | 3.30 B | 3.75 A | 3.28 B |
Publisher’s Note: MDPI stays neutral with regard to jurisdictional claims in published maps and institutional affiliations. |
© 2020 by the authors. Licensee MDPI, Basel, Switzerland. This article is an open access article distributed under the terms and conditions of the Creative Commons Attribution (CC BY) license (http://creativecommons.org/licenses/by/4.0/).
Share and Cite
Santanoo, S.; Vongcharoen, K.; Banterng, P.; Vorasoot, N.; Jogloy, S.; Roytrakul, S.; Theerakulpisut, P. Canopy Structure and Photosynthetic Performance of Irrigated Cassava Genotypes Growing in Different Seasons in a Tropical Savanna Climate. Agronomy 2020, 10, 2018. https://doi.org/10.3390/agronomy10122018
Santanoo S, Vongcharoen K, Banterng P, Vorasoot N, Jogloy S, Roytrakul S, Theerakulpisut P. Canopy Structure and Photosynthetic Performance of Irrigated Cassava Genotypes Growing in Different Seasons in a Tropical Savanna Climate. Agronomy. 2020; 10(12):2018. https://doi.org/10.3390/agronomy10122018
Chicago/Turabian StyleSantanoo, Supranee, Kochaphan Vongcharoen, Poramate Banterng, Nimitr Vorasoot, Sanun Jogloy, Sittiruk Roytrakul, and Piyada Theerakulpisut. 2020. "Canopy Structure and Photosynthetic Performance of Irrigated Cassava Genotypes Growing in Different Seasons in a Tropical Savanna Climate" Agronomy 10, no. 12: 2018. https://doi.org/10.3390/agronomy10122018