Article

Improved Prediction of Leaf Emergence for Efficacious Crop Protection: Assessing Field Variability in Phyllotherms for Upper Leaves in Winter Wheat and Winter Barley

1
Department of Environmental Sciences and Management, University of Liège, 6700 Arlon, Belgium
2
Centre for Applied Climate Sciences, University of Southern Queensland, Toowoomba, QLD 4350, Australia
3
Environmental Research and Innovation, Luxembourg Institute of Science and Technology, Belvaux 4422, Luxembourg
4
United States Department of Agriculture-Agricultural Research Service SEFTNRL, Byron, GA 31008, USA
*
Author to whom correspondence should be addressed.
Agronomy 2020, 10(11), 1825; https://doi.org/10.3390/agronomy10111825
Submission received: 20 October 2020 / Revised: 8 November 2020 / Accepted: 17 November 2020 / Published: 20 November 2020
(This article belongs to the Section Farming Sustainability)

Abstract

:
The choice of the phyllotherm value for predicting leaf emergence under field conditions is pivotal to the success of fungicide-based disease risk management in temperate cereals. In this study, we investigated phyllotherm variability for predicting the emergence of the three uppermost leaves (i.e., three last leaves to emerge) in winter wheat and winter barley fields. Data from four sites representative of wheat and barley growing regions in Luxembourg were used within the PROCULTURE model to predict the emergence of F-2, F-1 and F (F being the flag leaf) during the 2014–2019 cropping seasons. The phyllotherms tested ranged between 100 °Cd and 160 °Cd, in 15 °Cd steps, including the current default value of 130 °Cd. The comparisons between the observed and predicted emerged leaf area were qualitatively evaluated using the mean absolute error (MAE), the root mean square error (RMSE) and Willmott’s index (WI). A phyllotherm of 100 °Cd accurately and reliably predicted the emergence of all three upper leaves under the various environmental conditions and crop cultivars of winter wheat and winter barley over the study period. MAE and RMSE were generally <5% and the WI values were most often ≥0.90 for F-1 and F. For phyllotherm values ≥115 °Cd, the prediction errors generally increased for F-1 and F, with MAE and RMSE exceeding 20% in most cases. F-2 agreement between observed and predicted values was generally similar when using 100 °Cd or 115 °Cd. These results tie in valuable, complementary information regarding the variability of phyllotherms within leaf layers in winter wheat and winter barley in Luxembourg. Accurate and reliable leaf emergence prediction from F-2 to F allows for timely fungicide application, which ensures lasting protection against infections by foliar fungal disease pathogens. Hence, understanding phyllotherms can help ensure timely, environmentally sound, and efficacious fungicide application while increasing the likelihood of improved yields of winter wheat and winter barley.

1. Introduction

The upper three leaves (the flag leaf ‘F’, and the two leaves below F, F-1 and F-2) of wheat (Triticum aestivum L.), and the F-1 and F-2 leaves and the ear of barley (Hordeum vulgare L.) contribute most to yield, respectively (in barley, the contribution from the flag leaf is minimal due to its small size) [1,2,3]. The reliable prediction of the emergence of the upper leaves (i.e., last leaves to emerge) in wheat and barley is thus pivotal to the fungicides applied to control fungal diseases and ensure a satisfactory yield. In the absence of fungicides, several diseases are particularly limiting to the yield of both crops [2,4,5,6,7]. On the upper leaves, infections by fungal pathogens must occur early in development if the disease is to become severe, assuming favorable environmental conditions are met and that the leaves are left unprotected. In Luxembourg, foliar fungal diseases including Septoria tritici blotch (STB, caused by Zymoseptoria tritici (Desm.) Quaedvlieg & Crous), brown (Puccinia triticina Roberge ex Desmaz.) and stripe (P. striiformis Westend) rusts, as well as powdery mildew (Blumeria graminis DC. f. sp. tritici em. Marchal), are among the major threats which can cause grain yield losses, which, in turn, result in economic losses [6,8]. To safeguard crops against economic losses from diseases, Luxembourgish farmers typically apply two to three preventive foliar fungicide treatments, in conjunction with suitable management practices (e.g., use of disease-resistant cultivars, crop rotation, etc.). Crop management advice for fungicide applications is provided by the Luxembourgish Chamber of Agriculture. Depending on the fungicide’s persistence and prevailing weather conditions, a foliar fungicide applied between growth stage (GS) 37–39 (flag leaf just visible to flag leaf blade all visible) up to GS59 (ear emergence) [9] increases the chances of all three upper leaves being protected against infection from fungal foliar pathogens [6]. Additional fungicide applications may be required to fully protect all three leaves if there were earlier applications (i.e., before GS37) of fungicide. Likewise, applications at GS59 may result in yield losses due to disease as the upper leaves F to F-2 were left unprotected during their emergence and expansion. Consequently, yield losses may occur, providing favorable weather conditions for a disease epidemic are met. Hence, there is a need for reliable leaf emergence prediction within an integrated decision support system (DSS) that can be used to guide optimum fungicide application timing [6].
A number of models with varying levels of complexity and data requirements have been evaluated for simulating winter wheat and winter barley crop phenology: from relatively simple equations based on cultivar thermo-photoperiodic response (e.g., [10,11,12]) to complex algorithms that describe variations in the rate of development in response to environmental factors including temperature, vernalization and photoperiod (e.g., [13,14,15,16]). Under conditions of constant diurnal day length and temperature, and in the absence of severe stress, it is assumed that the phyllochron remains generally constant across all leaf layers [16,17,18]. A phyllochron is defined as the time duration (usually given in days) that separates the appearance of two successive leaves; the corresponding degree-day sum is termed the phyllotherm ([19,20]). Phyllotherms for wheat and barley can be as low as 52 °Cd [20,21] or as high as 160 °Cd [22] depending on the genotype, growth stage and environmental conditions (i.e., field or growth chamber conditions).
Changes in leaf appearance rate in winter wheat and winter barley as a function of leaf number or as a chronology factor have been considered (e.g., [23,24,25,26]). For example, Miglietta [23] assumed an exponential decrease in the rate of leaf appearance with the number of emerged leaves in wheat. Jamieson et al. [24] considered an increase in phyllotherm throughout the growing season in winter wheat, which ranged from 75 °Cd (base temperature = 0 °C) for the two lowest leaf positions to 100 °Cd for leaf positions 2 to 8, to 130 °Cd for leaf positions > 8. Decreasing leaf appearance rates are expected as the number of emerged leaves increases [25,27,28]; that is, the duration between the appearance of two successive upper leaves is longer compared to the duration between the lower leaves. Within a DSS for managing fungal disease risks in cereals in Belgium and Luxembourg (i.e., the PROCULTURE model [6,29,30]), a constant phyllotherm value of 130 °Cd (base temperature = 0 °C) is commonly used for predicting the emergence of all five upper leaves (F-4 to F) [29,31]. However, the simultaneous and continuous variations in temperature and photoperiod under field conditions can affect the rate of leaf emergence in different leaf layers. Exploring the use of leaf-specific phyllotherms between the lower (F-4 and F-3) and upper (F-2 to F) leaves within the DSS requires further research to ensure the reliable prediction of the emergence of leaves F-4 to F. In particular, improved prediction of the emergence of leaves F-2 to F in winter wheat and winter barley will help ensure timely, environmentally friendly and efficacious fungicide applications to help maximize yields.
The main objective of this study was to investigate the variability in phyllotherm for predicting the emergence of the three upper leaves, F-2 to F, in winter wheat and winter barley in the field. The overarching objective was to improve the performance of the DSS used for managing foliar fungal disease risk in the Grand-Duchy of Luxembourg (GDL). Specifically, five phyllotherms (i.e., 100 °Cd to 160 °Cd, in 15 °Cd steps) were assessed for predicting the emergence of leaves F-2 to F for both winter wheat and winter barley using the PROCULTURE model [29]. The predicted values were compared to field data collected during the 2014–2019 cropping seasons at four sites representative of the Luxembourgish wheat- and barley-growing regions. The emergence of F-2 to F, which correspond generally to the period spanning GS31 (first node detectable) to GS37 in winter wheat and winter barley in the GDL, is a critical period for efficacious fungicide-based fungal disease management [6]. Thus, accurate and reliable leaf emergence prediction for F-2 to F will allow for timely fungicide application to ensure lasting protection against infections by foliar fungal disease pathogens and to maximize disease control.

2. Materials and Methods
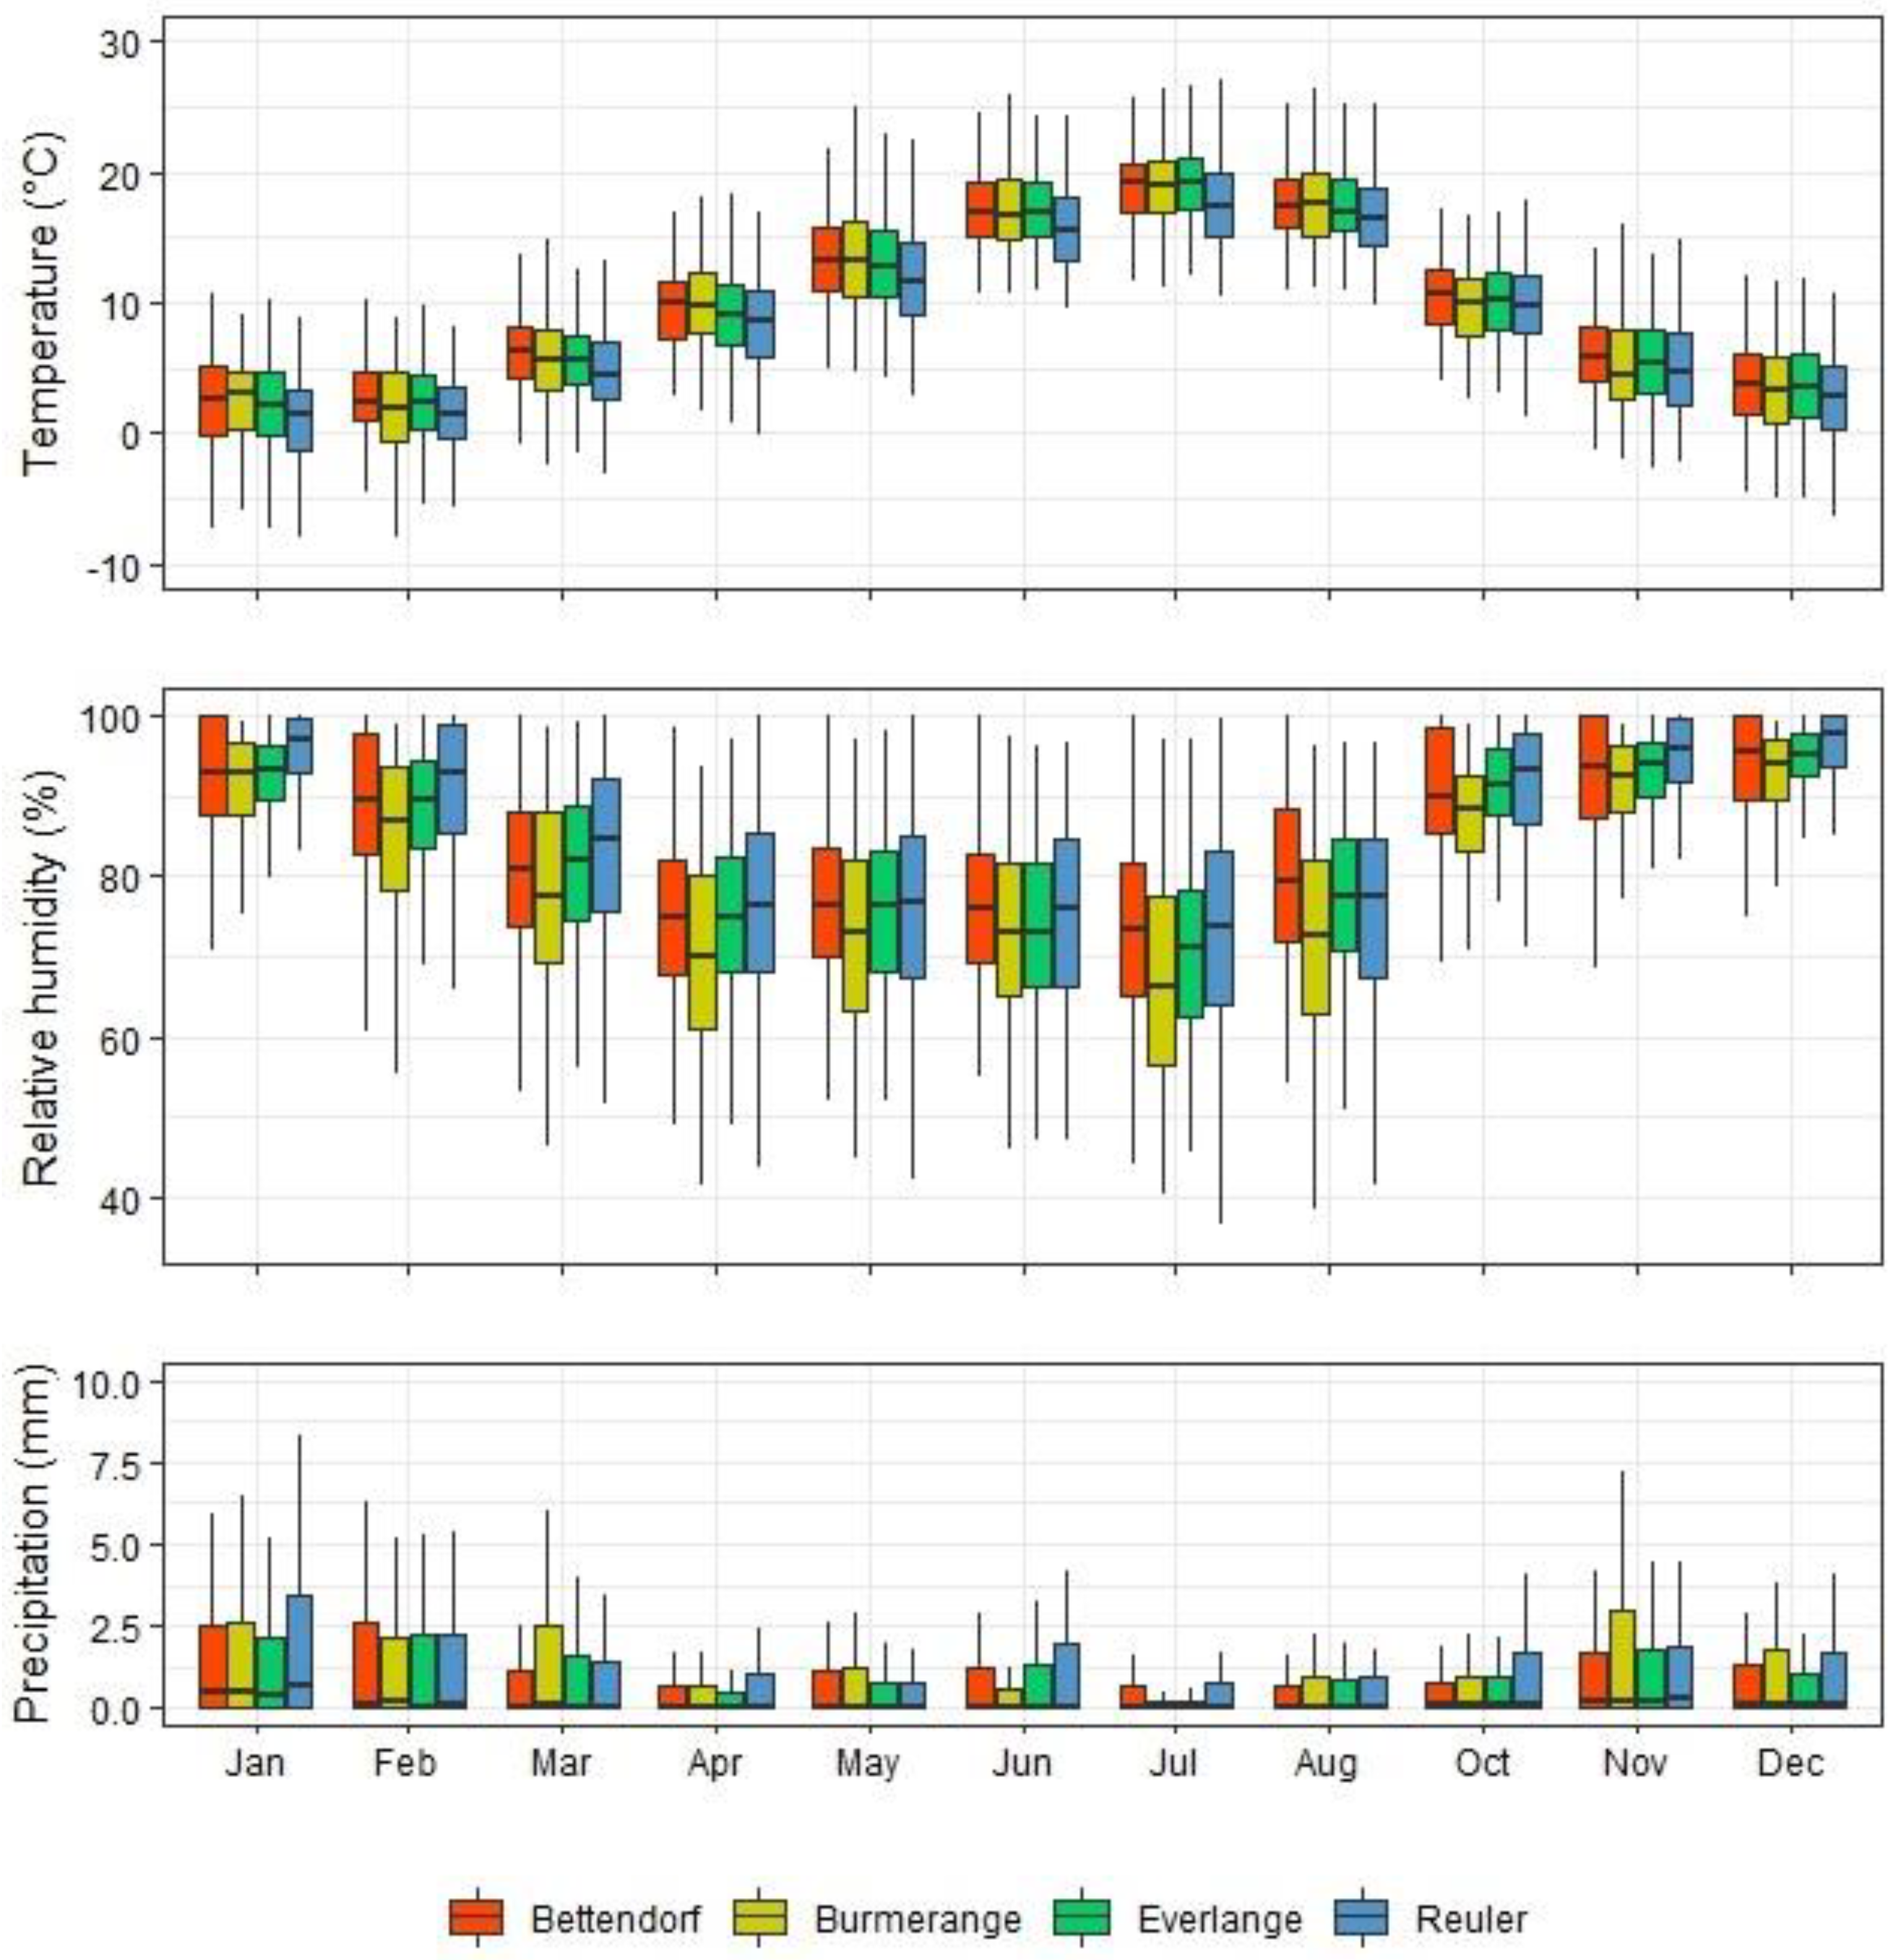
2.1. Study Areas

Data from fields of winter wheat and winter barley located at Bettendorf (6.19 E, 49.87 N), Burmerange (6.28 E, 49.52 N), Everlange (5.95 E, 49.78 N), and Reuler (6.04 E, 50.06 N) in the GDL were used in the study. The experimental sites were selected across commercial winter wheat and winter barley fields during the 2014–2019 cropping seasons; they included early and medium-maturity cultivars (Table 1). Experiments were designed in a randomized block with four replicates, with one replicate plot size = 8.0 m × 1.5 m. Sowing and harvest methods, as well as crop practices, were typical of wheat and barley production in the GDL. Winter barley and wheat are generally sown between the end of September and the end of October. Plant densities ranged from 200 to 250 plants m−2 and 170 to 200 plants m−2 for winter wheat and winter barley, respectively, with sowing depths varying between 1 and 2 cm for both crops. Nitrogen fertilizers were applied three times: the first applications were generally made between the end of February and early March; the second nitrogen fertilizer was applied during the first fortnight of April (which corresponds to the first node stage); and the third and last application of nitrogen fertilizer was made during the second half of May (which corresponds to the period when the flag leaf emerges). Growth regulators are often applied from the end of April to early May, in conjunction with herbicides or fungicides. Herbicides were typically applied from the end of March to early April. The application and frequency of fungicide application depend on the prevalence and severity of foliar disease at earlier growth stages, and the prevailing weather conditions.

2.2. Data

Daily weather data (mean air temperature, relative humidity, and precipitation) were recorded at an automatic weather station located within 1 to 2 km of each experimental field. Mean air temperature and relative humidity were measured at 2 m above the soil surface. Total precipitation was measured at 1 m above the soil surface. The raw weather variables, recorded at 10 min intervals, were automatically retrieved from the web-based database system (www.agrimeteo.lu) and processed using an automatic data processing chain within which data were quality checked [33]. The mean daily weather variables by month during the 2014–2019 period for each of the study sites are presented in Figure 1.
Data for leaf appearance used in the study originated from plots which received no foliar fungicide throughout the cropping seasons. Ten plants per plot (40 plants total) were randomly selected and marked when delineating the experimental plots at each site. To closely monitor the emergence of the three upper leaves, a reference marking was made on each of the 10 plants at the time of selecting the plants. The mark consisted of manually cutting a small section of the leaf at the extremity of the third leaf layer. The correct number of the leaf layers was determined upon the emergence of the flag leaf (F). The percentage of emerged leaf area for each leaf layer was estimated by comparison to the total area of the preceding fully formed leaf (assumed to be 100%), and by checking the ligule of the emerging leaf (a fully visible leaf ligule corresponds to a fully emerged leaf). Thus, the percentage of emerged area of each of the three leaf layers was estimated relative to the preceding leaf layer for each of the 40 plants. Observations were carried out weekly between March and July each year by experienced agronomists and plant pathologists. Care was also taken to ensure the same rater assessed the same replicate during each of the monitoring weeks.

2.3. Simulations of Leaf Emergence

The PROCULTURE model [29,31] was used to simulate the emergence of the three upper leaves. PROCULTURE is a mechanistic model used for simulating the risk of infection and progress of STB, as well as the emergence of the five upper leaves, within the DSS for managing fungal disease risks in cereals in Luxembourg [6,30]. For each cropping season and for each of the study sites, the default phyllotherm value (130 °Cd) in PROCULTURE was used to predict the emergence of F-4, F-3 and F-2 based on the sowing dates. Given that PROCULTURE allows for correction when predicting F-2 before the prediction of subsequent leaves (F-1 and F), adjustments were applied based on the date of the first report of the emergence of F-2 on the plants in the fields, and the percentage of that leaf position that had emerged, where necessary [30].
Five phyllotherm values, 100 °Cd to 160 °Cd (in 15 °Cd steps), including the default value (130 °Cd), were used for predicting the emergence of leaves F-2 to F for both winter wheat and winter barley during the 2014–2019 cropping seasons. The range was chosen based on previously reported phyllotherm values [20,22,24]. A base temperature of 0 °C was used for both crops [26,34]. As noted, the simulation of F-2 emergence was empirically corrected based on field observations (Table 2).

2.4. Statistical Analyses

The predicted percentage leaf emergence (expressed as the percentage of emerged leaf area) for each of the three upper leaves during each phyllotherm was compared to field assessments (the estimated area emerged for that leaf layer relative to the previous, fully emerged layer). The accuracy of predictions was evaluated using the mean absolute error (MAE), the root mean square error (RMSE) and the Willmott’s index of agreement (WI) [35]. The three statistics were calculated as follows:
M A E = 1 n i = 1 n | O i P i |
R M S E = 1 n i = 1 n ( O i P i ) 2
W I = { 1 i = 1 N | P i O i | 2 i = 1 N | O i O ¯ | ,   when   i = 1 N | P i O i | 2 i = 1 N | O i O ¯ | 2 i = 1 N | O i O ¯ | i = 1 N | P i O i | 1 ,   when   i = 1 N | P i O i | > 2 i = 1 N | O i O ¯ |
where n is the number of field observations; O i is the ith observed value; O ¯ is the mean observed value; and P i is the ith predicted value.
The smaller the value of the MAE or RMSE, the more accurate are the predictions. Values of WI closer to 1 are indicative of good agreements between predicted and observed values, and are thereby indicative of good model performance.
Considering that data were available for two winter wheat cultivars during each of the 2017 and 2019 cropping seasons at Bettendorf (Table 1), a comparison of leaf emergence using the default phyllotherm in PROCULTURE and those obtained using the best-performing phyllotherm (found after comparisons of all five phyllotherms) was made to check whether the performance of the latter phyllotherm was cultivar-sensitive.
Additionally, the ability of the best-performing pyhllotherm -adjusted PROCULTURE model (i.e., the model using the best-performing phyllotherm) to predict the point of first emergences of each of the three upper leaves F-2 to F for both winter wheat and winter barley was also investigated. Statistical scores derived from a contingency table analysis were used to evaluate the ability of the best-performing phyllotherm to predict the point of the first observed emergence of leaves F-2 to F during the 6-year period at each of the study sites. The statistical scores used were the probability of detection (POD), the false alarm ratio (FAR), and the critical success index (CSI). They were calculated as follows: POD = a/(a + c), FAR = b/(a + b), and CSI = a/(a + b + c), where a, b, and c refer to leaf emergence either observed or predicted, leaf emergence predicted but not observed, and leaf emergence observed but not predicted, respectively.
All statistical analyses and graphical representations were performed using R (v4.0.0; [36]) and SigmaPlot (v14; Systat Software Inc., San Jose, CA, USA).

3. Results

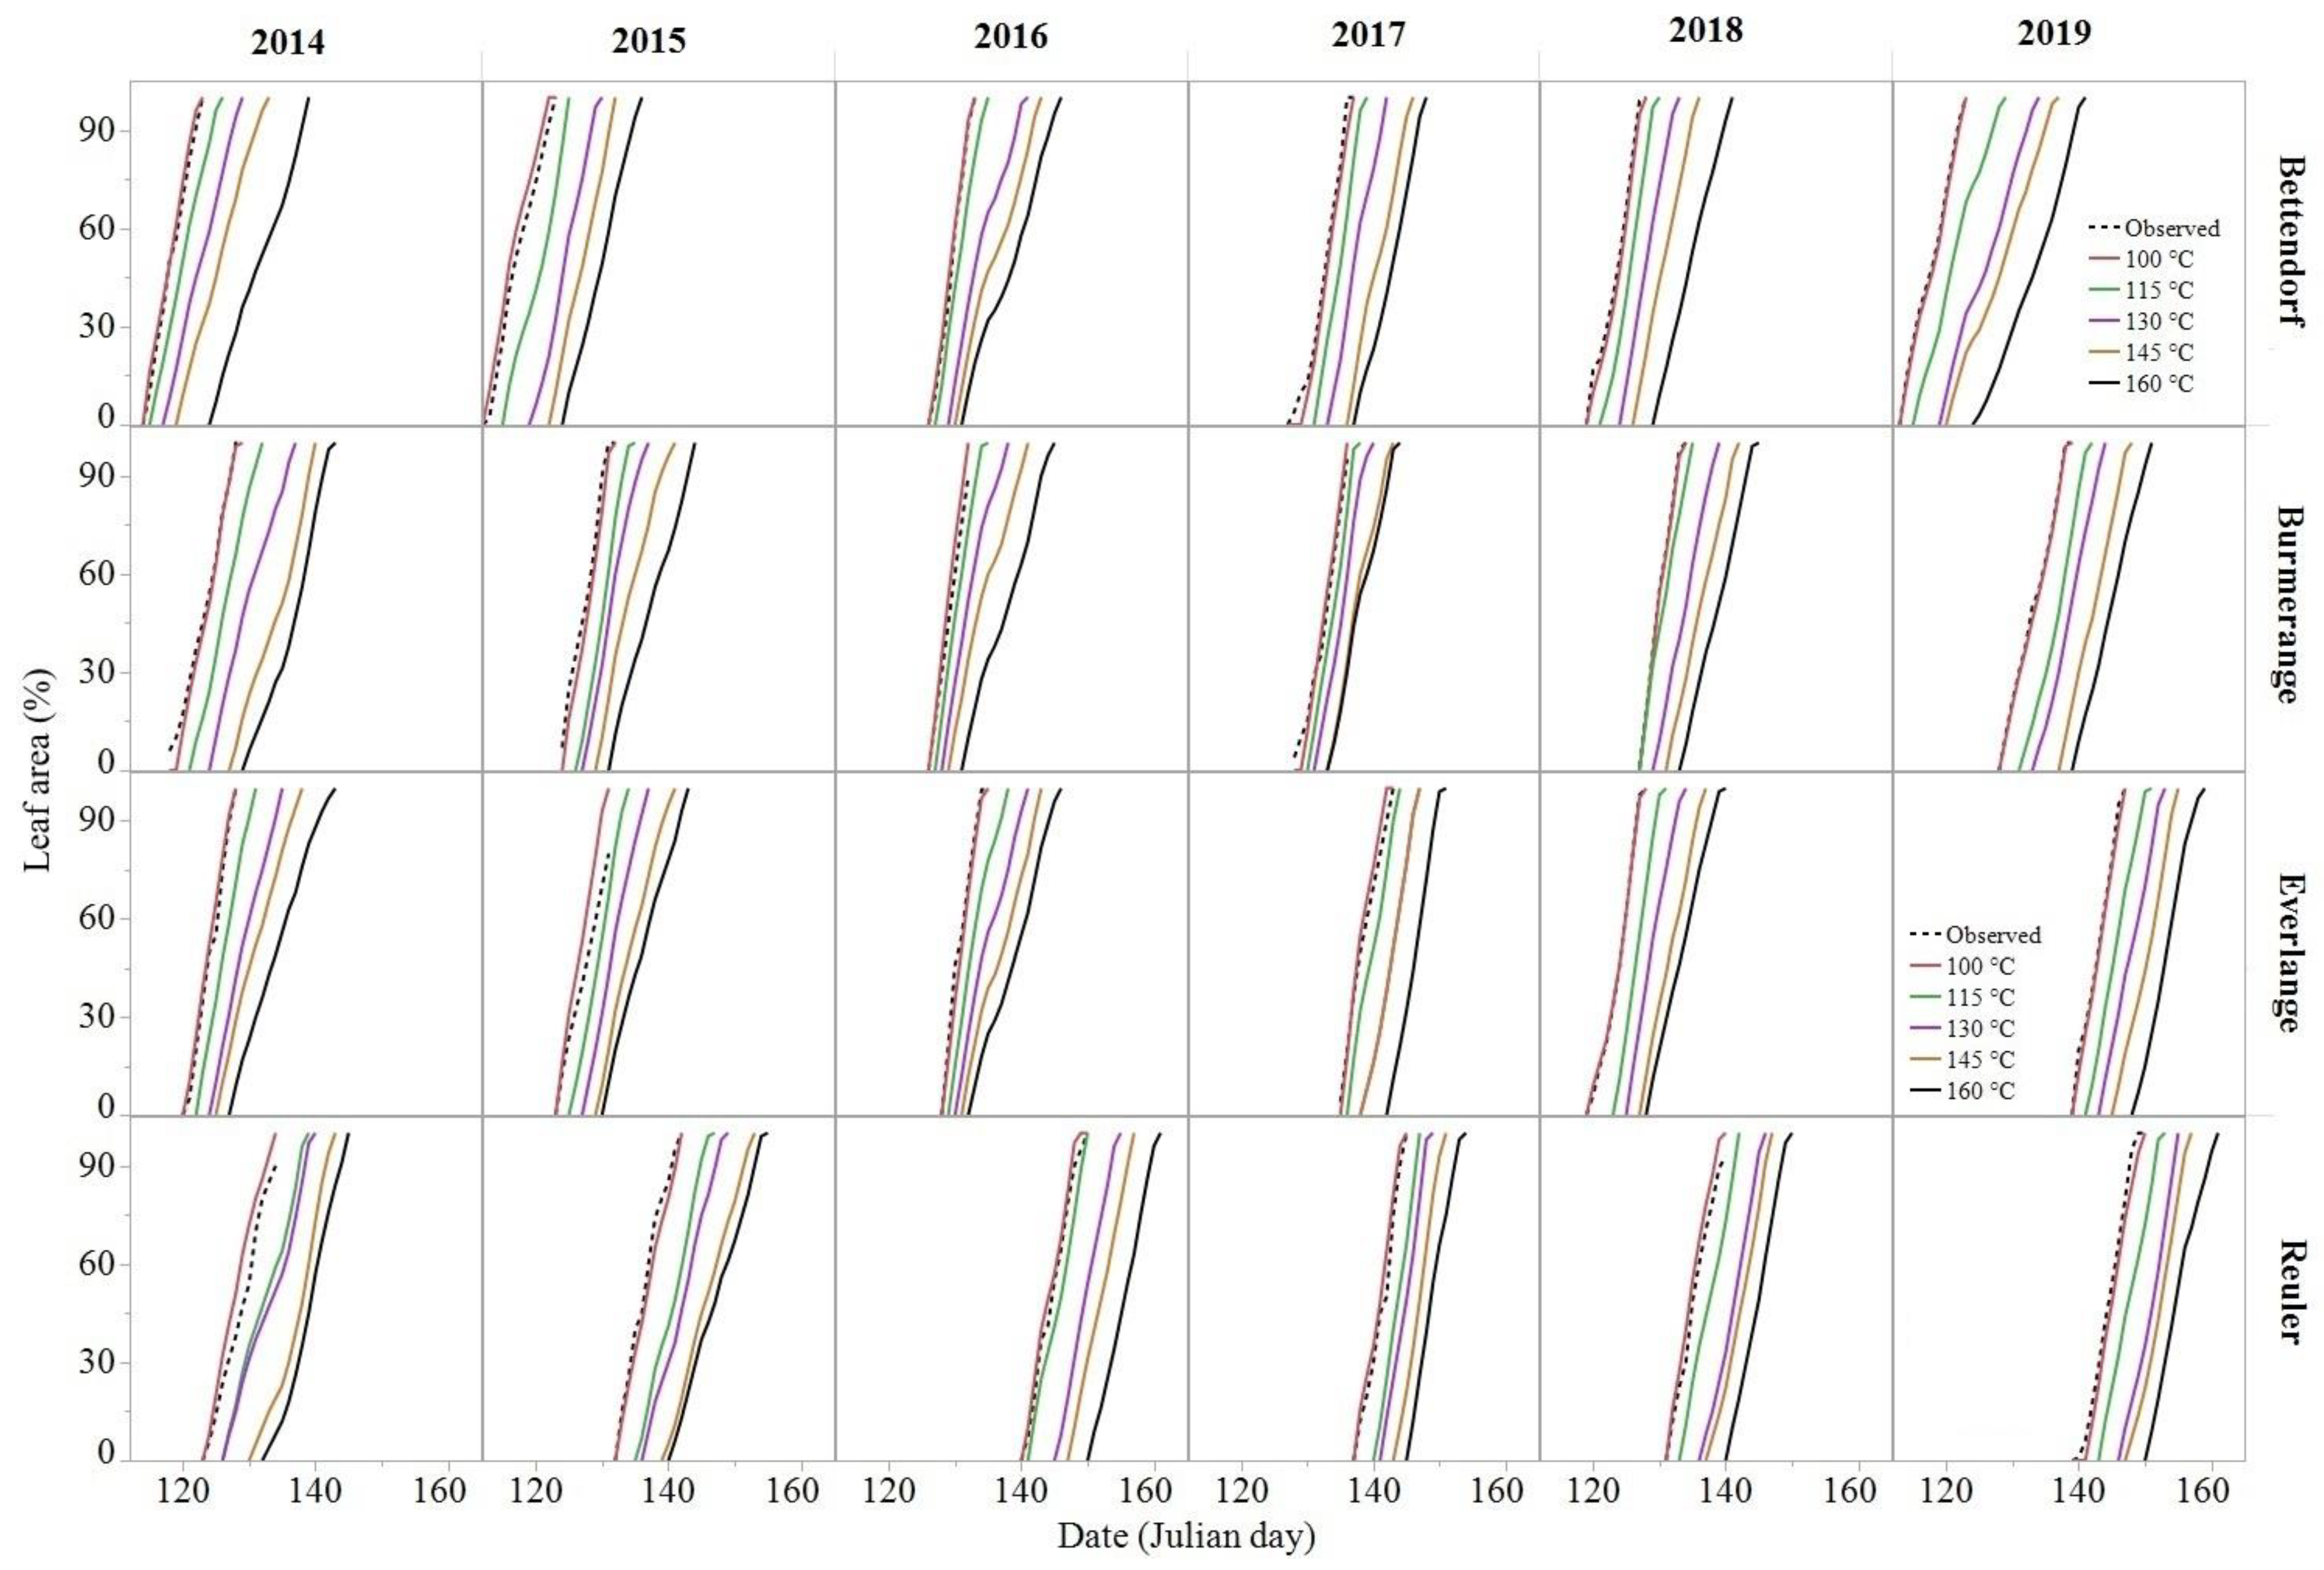
3.1. Prediction of Emergence of Leaves F-2, F-1 and F in Winter Wheat

The performance of various models differed when simulating the emergence of F-2, F-1 and F using the five different phyllotherms. Overall, accurate predictions of leaf emergence were found when using the 100 °Cd phyllotherm in all years and at all study sites, irrespective of the leaf. For F-1 and F, the MAE and RMSE were ≤5% (Figure 2). Exceptions included the sites at Burmerange in 2017 for F-1 (MAE = 11%; RMSE = 12%), and Everlange in 2015 for F (MAE = 12%; RMSE = 15%), which indicate only modest deviations in accuracy in these cases (Figure 2). For the F-1 and F leaves, using a phyllotherm greater than or equal to 115 °Cd yielded generally greater prediction errors when compared to those found using a phyllotherm of 100 °Cd, indicating less accuracy. For example, for phyllotherms 130 °Cd, 145 °Cd and 160 °Cd, the MAE and RMSE values were most often ≥20% for all sites and in all years, indicating less accuracy in prediction (Figure 2). With regard to F-2, the 100 °Cd and 115 °Cd phyllotherms, and to a lesser extent the 130 °Cd phyllotherm, resulted in a similar model performance (Figure 2). However, prediction errors were more frequent (≥10% on average) for phyllotherms greater than 130 °Cd, indicating less accuracy when compared to the 100 °Cd, 115 °Cd and 130 °Cd phyllotherms.
Leaf emergence (% area emerged), as recorded on plants in the winter wheat fields during each of the study cropping seasons, and predicted values are provided (Figure 3, and Supplementary Materials Figures S1 and S2; results for F were presented in the text to reduce redundancy). Similarities between the curve shape based on the observed values and the curve shape based on the predicted values showed that, in most of the site–year cases, the 100 °Cd phyllotherm outperformed the other phyllotherms tested. Thus, the 100 °Cd phyllotherm appears appropriate for simulating leaf emergence in winter wheat fields under Luxembourgish conditions. The agreements between the observed and predicted leaf emergence values for F-1 and F based on the 100 °Cd phyllotherm were confirmed by the WI values; the WI values were consistently ≥0.90, indicating close agreement (Figure 4). For phyllotherms >130 °Cd, the WIs were generally ≤0.50 for F in all site–year cases (Figure 4). A similar pattern was observed for F-1 for phyllotherms 145 °Cd and 160 °Cd. With F-2, the WI values were all greater than 0.70 for the majority of site–year cases (Figure 4), irrespective of the phyllotherm value.
Analyzing the simulation results for different wheat cultivars in 2017, 2018 and 2019 (Figure 5, Table S1) showed that using a phyllotherm of 100 °Cd for simulating the emergence of the upper leaves gave accurate results, regardless of the cultivar. A similar range of prediction errors were found when comparing the cultivar Kerubino to cultivars Achat (in 2017) or Desamo (in 2018 and 2019). For Kerubino, RMSE and MAE ranged from 1 to 6%, and from 1 to 3%, respectively, over the three cropping seasons (all leaves considered), indicating accurate predictions. The respective range of errors for the other cultivars was from 2 to 65%, and from 1 to 4% (Table S1). Although larger prediction errors were found with the emergence of the F-2 leaves of the cultivar Desamo in 2018 (RMSE = 11% and MAE = 10%; Table S1), the lowest prediction errors occurred when using the phyllotherm of 100 °Cd, indicating that this phyllotherm can be applied to accurately and reliably predict the emergence of the three uppermost leaves in different winter wheat cultivars in the GDL.

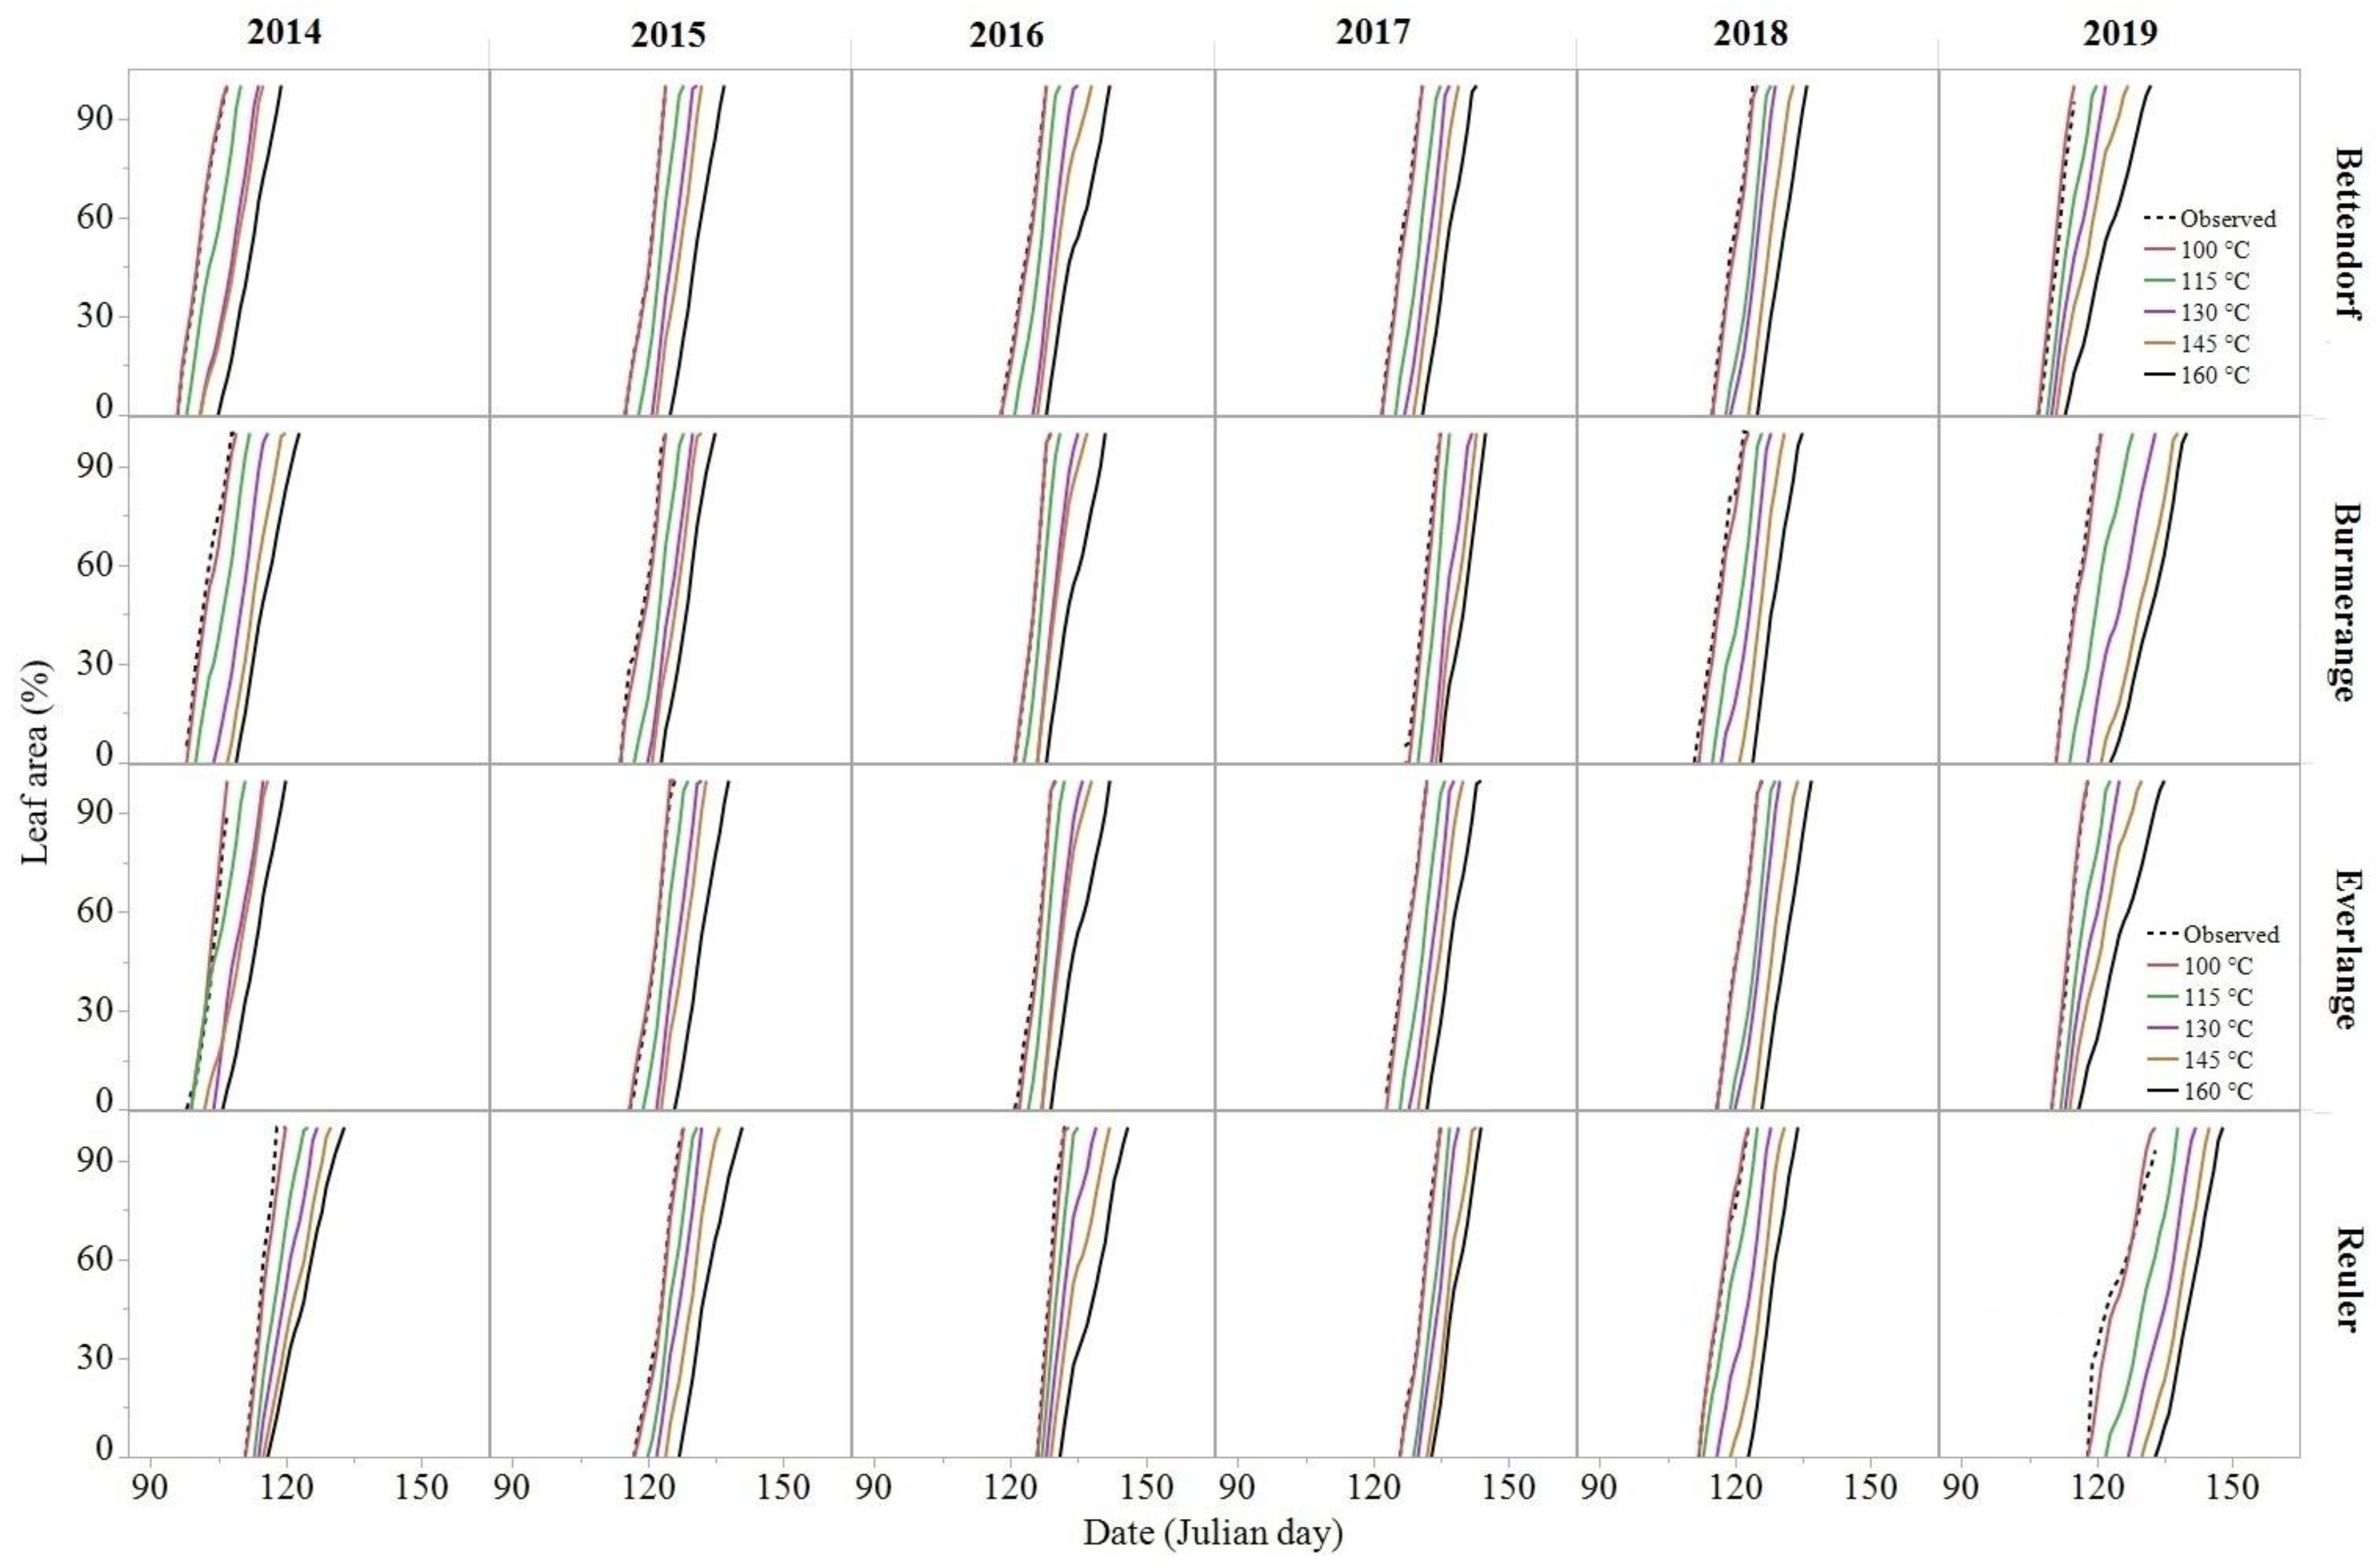
3.2. Prediction of Emergence of Leaves F-2, F-1 and F in Winter Barley

The patterns of leaf emergence and prediction errors in winter barley were similar to those found for winter wheat. Good predictions were observed when using a phyllotherm of 100 °Cd for F and F-1 for the majority of the site–year cases; the MAE and RMSE were generally <5% (Figure 6). Exceptions occurred in 2014 and 2019 for F at Reuler where the MAE and RMSE were 9%. For phyllotherm ≥115 °Cd, the prediction errors most often increased for both F and F-1 leaves, with values exceeding 20% in most cases (Figure 6). For the prediction of F-2, the errors were most often lower compared to those for F and F-1 leaves. Leaf emergence predictions using a phyllotherm of 100 °Cd outperformed those based on phyllotherms from 115 °Cd to 160 °Cd. The differences in prediction errors were generally ≤5% for phyllotherms of 115 °Cd and 130 °Cd (Figure 6), suggesting similar accuracies.
The analyses of the WI values corroborate these results. There was clear and strong agreement between the observed and predicted leaf emergence values for F-1 and F in all years for all the study sites (Figure 7). Similar to winter wheat, in most cases, the WI values for F-2 were greater than or equal to 0.70. Moreover, a visual inspection of the relationships between the observed or predicted emerged leaf area based on the 100 °Cd phyllotherm showed, in most cases, that the curves had very similar shapes (Figure 8, and Figures S3 and S4).

3.3. Improvement of Leaf Emergence Prediction within the DSS

We have shown that the 100 °Cd phyllotherm is an accurate and reliable basis for predicting leaf emergence for F, F-1 and F-2 in both winter wheat and winter barley. Using the 100 °Cd phyllotherm, the predicted visible emergence of the three uppermost leaves was compared to the first observed emergence. The analysis of the statistical scores indicated satisfactory levels of visible leaf emergence prediction for all the study sites during the 2014–2019 cropping seasons for both winter wheat and winter barley. POD and CSI were greater than or equal to 0.70 (a perfect score for either statistic is 1.0), with the lower values associated with the prediction of the first emergence of F (Table 3). The maximum FAR values were 0.16 for F-2 in winter wheat at Burmerange, and F-2 and F-1 in winter barley at Reuler. For the remainder of the site–crop cases, a perfect FAR score of 0.00 was obtained (Table 3).
The performance of the prediction of first emergence based on different phyllotherms is presented in Figure 3 and Figure 8, as well as Figures S1–S4. The predicted first emergence dates of F and F-1 based on the 100 °Cd phyllotherm generally coincided with the observed values, whereas the predicted first emergence was delayed by up to 10 days in some cases when using the default phyllotherm value (130 °Cd). This was especially so when predicting the first emergence of F in winter wheat (Figure 3 and Figure 8). In winter barley, there was little or no delay in the prediction of the first emergence of F-1 when using either the default phyllotherm values of 130 °Cd or 100 °Cd (Figure S3).

4. Discussion

Despite its relatively small size (approximately 2586 km2), the Grand-Duchy of Luxembourg is characterized by noticeable climatic contrasts between and within its agricultural regions, which affect crop growth and the development and severity of foliar fungal diseases in winter wheat and winter barley throughout the cropping season [37,38]. The variable within- and between-season disease risks imply tailored fungicide-based crop protection to meet growers’ needs to maintain yield while minimizing the cost of inputs and any adverse environmental effects of the crop protection measures. Extending the duration of the green leaf area of the upper leaves in both winter wheat and winter barley through the application of certain foliar fungicides benefits the grain filling period, that is, the fungicide effect leads to extended leaf area greenness, allowing grain filling over a longer period [7,39,40]. Such a long grain filling period could ultimately result in an increased final grain yield. In the GDL, preventive fungicide applications following a phenology-based calendar are integral to wheat and barley production [6,30]: the first treatment is applied during stem elongation to control early season fungal diseases (i.e., wheat powdery mildew and eyespot); the second treatment is typically applied at flag leaf emergence to protect against STB; and the third is occasionally applied at early flowering to protect against Fusarium head blight [6,30]. In this study, the prediction of leaf emergence of the upper leaves F-2 to F within the DSS, used for managing foliar fungal disease risks in the GDL, was assessed based on five phyllotherm values over six cropping seasons at different sites. The results indicate that the most accurate leaf emergence predictions based on the various environmental conditions and crop cultivars of winter wheat and winter barley used during the study period were based on a 100 °Cd phyllotherm for both crops, irrespective of the leaf. These findings are in agreement with previous reports (e.g., [24,41,42]), which concluded the average phyllotherms for the upper leaves were in the range 100 to 115 °Cd. The slight differences observed in the current study could be explained by environmental conditions, including variable sowing dates and varieties, variable nutrient application rates and availabilities, and differences in the effect of temperatures on leaf emergence.
Various factors, considered alone or in interaction with one another, regulate the rate of development and leaf emergence in wheat and barley, with the major variables being temperature, photoperiod and vernalization [16,26,43,44,45,46,47,48]. Nutrition (including availability of nitrogen, phosphorus and sulfur, aluminum toxicity) also affects the duration of the ontogenic phases from seedling emergence to flowering, though to a lesser extent [49,50,51,52,53,54]. Our experiments were conducted in commercial winter wheat and winter barley fields, and the responses of leaf emergence to varying sowing dates or nutrient rates in each of the cropping seasons were beyond the scope of the study’s objectives, and thus were not investigated. Nevertheless, the results we present are of value and can guide future research in relation to the effects of other factors.
Although the contribution of F (the flag leaf) to grain filling and final yield in barley is almost insignificant due to its small size (hence the focus on keeping F-1 free of disease; [2]), we extended our analysis to F and F-2 because the potential severity of some diseases on F-1 might depend upon their severity in F or F-2. Thus, ensuring accurate and reliable prediction for all leaf layers (F-2 to F) could help minimize yield losses from diseases. Our analyses demonstrated that, for winter barley, as well as for winter wheat, accurate predictions of leaf emergence (i.e., the time of first appearance of the leaf) (Table 3) and subsequent leaf area development (Figure 3 and Figure 8; Figures S1–S4), were obtained using a phyllotherm of 100 °Cd. Compared to the prediction errors when using the default phyllotherm value (130 °Cd), using a 100 °Cd phyllotherm improved the performance of PROCULTURE under the environmental conditions prevailing in Luxembourg, and thereby the overall performance of the DSS. A 100 °Cd phyllotherm allows more timely fungicide application for lasting protection [6]. Under changing climate conditions [55], and considering the continued improvements in crop breeding, it is worth re-evaluating phyllotherm variability for the uppermost leaf layers of major winter wheat and winter barley cultivars across major cropping regions beyond Luxembourg. To this end, our findings may provide valuable insights for broader applications regarding the variability of phyllotherm within the leaf layers of these two economically important food crops.
In conclusion, our research confirms that a phyllotherm of 100 °Cd can be considered accurate and reliable for predicting the leaf emergence of the three uppermost leaf layers in winter wheat and winter barley under variable environmental and crop conditions in the GDL. The simulations of leaf emergence of F-2, F-1 and F in both crops at all the study sites were improved using the 100 °Cd phyllotherm when compared to phyllotherm values ≥ 115 °Cd, including the current phyllotherm standard of 130 °Cd used in the DSS. Moreover, based on the prediction errors when comparing the emergence of the three uppermost leaves for different winter wheat cultivars, our results indicate that the 100 °Cd phyllotherm is reliable for predicting the emergence of F-2, F-1 and F. Within the DSS, for managing disease risks based on foliar fungicide applications, leaf emergence simulations are important for efficacious crop protection. Thus, the results we present can help ensure timely fungicide applications to maximize disease control, to reduce the risk of disease and increase the likelihood of an improved yield for both winter wheat and winter barley, while minimizing the impact on the environment. Further research involving multiyear, multilocation experiments with major wheat and barley cultivars is warranted to extend the results across a broader range of conditions and cropping practices in Europe and elsewhere.

Supplementary Materials

The following are available online at https://www.mdpi.com/2073-4395/10/11/1825/s1, Table S1: Comparisons of leaf emergence predictions for different winter wheat cultivars at Bettendorf using five different phyllotherm values; Figure S1: Observed (dashed lines) and predicted (solid lines) percentage emergence of the leaf below the flag leaf (F-1) in winter wheat during the 2017–2019 growing seasons at the different study sites in Luxembourg; Figure S2: Observed (dashed lines) and predicted (solid lines) percentage emergence of the leaf below the flag leaf (F-2) in winter wheat during the 2017–2019 growing seasons at the different study sites in Luxembourg; Figure S3: Observed (dashed lines) and predicted (solid lines) percentage emergence of the leaf below the flag leaf (F-1) in winter barley during the 2017–2019 growing seasons at the different study sites in Luxembourg; Figure S4: Observed (dashed lines) and predicted (solid lines) percentage emergence of the leaf below the flag leaf (F-2) in winter barley during the 2017–2019 growing seasons at the different study sites in Luxembourg.

Author Contributions

Conceptualization, M.E.J. and L.K.; methodology, M.E.J. and L.K.; validation, M.E.J. and L.K.; formal analysis, M.E.J. and L.K.; investigation, M.E.J. and J.J.; data curation, M.E.J., L.K. and J.J.; writing—original draft preparation, L.K. and M.E.J.; writing—review and editing, M.E.J., L.K., J.J. and C.H.B.; funding acquisition, M.E.J. All authors have read and agreed to the published version of the manuscript.

Funding

This research was funded by the Ministry of Culture, Higher Education, and Scientific Research of the Grand-Duchy of Luxembourg and the Administration Des Services Techniques de l’Agriculture through the SENTINELLE projects.

Acknowledgments

The authors acknowledge all the people who helped us to realize the field experiments and logistics. We thank Marco Beyer, Doriane Diane, Marine Pallez-Barthel, Mohammed Sallah Abdoulhamid, Malika Yazza, Fouad Zouhir, Marie Dufrasne, Mathieu Almeida, Chloé Dupuis, Martin Vanrykel for their excellent technical assistance, Bernard Tychon, Guy Reiland and Serge Heuschling for their organizational support and the Administration des Services Techniques de l’Agriculture of Luxembourg for financially supporting the project SENTINELLE.

Conflicts of Interest

The authors declare no conflict of interest.

References

  1. Gooding, M.J.; Dimmock, J.P.R.E.; France, J.; Jones, S.A. Green leaf area decline of wheat flag leaves: The influence of fungicides and relationships with mean grain weight and grain yield. Ann. Appl. Biol. 2000, 136, 77–84. [Google Scholar] [CrossRef]
  2. AHDB. Barley Growth Guide; The Agriculture and Horticulture Development Board (AHDB) of the United Kingdom: Stoneleigh, UK, 2018. [Google Scholar]
  3. Bingham, I.J.; Young, C.; Bounds, P.; Paveley, N.D. In sink-limited spring barley crops, light interception by green canopy does not need protection against foliar disease for the entire duration of grain filling. Field Crops Res. 2019, 239, 124–134. [Google Scholar] [CrossRef]
  4. Thomas, M.R.; Cook, R.J.; King, J.E. Factors affecting development of Septoria tritici in winter wheat and its effect on yield. Plant Pathol. 1989, 38, 246–257. [Google Scholar] [CrossRef]
  5. Shaw, M.W.; Royle, D.J. Estimation and validation of a function describing the rate at which Mycosphaerella graminicola causes yield loss in winter wheat. Ann. Appl. Biol. 1989, 115, 425–442. [Google Scholar] [CrossRef]
  6. El Jarroudi, M.; Kouadio, L.; Beyer, M.; Junk, J.; Hoffmann, L.; Tychon, B.; Maraite, H.; Bock, C.H.; Delfosse, P. Economics of a decision–support system for managing the main fungal diseases of winter wheat in the Grand-Duchy of Luxembourg. Field Crops Res. 2015, 172, 32–41. [Google Scholar] [CrossRef] [Green Version]
  7. Jalli, M.; Kaseva, J.; Andersson, B.; Ficke, A.; Nistrup-Jørgensen, L.; Ronis, A.; Kaukoranta, T.; Ørum, J.-E.; Djurle, A. Yield increases due to fungicide control of leaf blotch diseases in wheat and barley as a basis for IPM decision-making in the Nordic-Baltic region. Eur. J. Plant Pathol. 2020, 158, 315–333. [Google Scholar] [CrossRef]
  8. El Jarroudi, M.; Kouadio, L.; Junk, J.; Beyer, M.; Pasquali, M.; Bock, C.H.; Delfosse, P. Do single, double or triple fungicide sprays differentially affect the grain quality in winter wheat? Field Crops Res. 2015, 183, 257–266. [Google Scholar] [CrossRef]
  9. Zadoks, J.C.; Chang, T.T.; Konzak, C.F. A decimal code for the growth stages of cereals. Weed Res. 1974, 14, 415–421. [Google Scholar] [CrossRef]
  10. Alzueta, I.; Arisnabarreta, S.; Abeledo, L.G.; Miralles, D.J. A simple model to predict phenology in malting barley based on cultivar thermo-photoperiodic response. Comput. Electron. Agric. 2014, 107, 8–19. [Google Scholar] [CrossRef]
  11. French, R.; Schultz, J.; Rudd, C. Effect of time of sowing on wheat phenology in South Australia. Aust. J. Exp. Agric. 1979, 19, 89–96. [Google Scholar] [CrossRef]
  12. Brown, H.; Huth, N.; Holzworth, D. Crop model improvement in APSIM: Using wheat as a case study. Eur. J. Agron. 2018, 100, 141–150. [Google Scholar] [CrossRef]
  13. Wang, E.; Engel, T. Simulation of phenological development of wheat crops. Agric. Syst. 1998, 58, 1–24. [Google Scholar] [CrossRef]
  14. Van Diepen, C.A.; Wolf, J.; van Keulen, H.; Rappoldt, C. WOFOST: A simulation model of crop production. Soil Use Manag. 1989, 5, 16–24. [Google Scholar] [CrossRef]
  15. Slafer, G.A.; Rawson, H.M. Sensitivity of wheat phasic development to major environmental factors: A re-examination of some assumptions made by physiologists and modellers. Func. Plant Biol. 1994, 21, 393–426. [Google Scholar] [CrossRef]
  16. Jame, Y.W.; Cutforth, H.W.; Ritchie, J.T. Interaction of temperature and daylength on leaf appearance rate in wheat and barley. Agric. For. Meteorol. 1998, 92, 241–249. [Google Scholar] [CrossRef]
  17. Baker, C.K.; Gallagher, J.N.; Monteith, J.L. Daylength change and leaf appearance in winter wheat. Plant Cell Environ. 1980, 3, 285–287. [Google Scholar] [CrossRef]
  18. Jamieson, P.; Brooking, I.; Zyskowski, R.; Munro, C. The vexatious problem of the variation of the phyllochron in wheat. Field Crops Res. 2008, 108, 163–168. [Google Scholar] [CrossRef]
  19. Bonhomme, R. Bases and limits to using ‘degree.day’ units. Eur. J. Agron. 2000, 13, 1–10. [Google Scholar] [CrossRef]
  20. Cao, W.; Moss, D.N. Temperature effect on leaf emergence and phyllochron in wheat and barley. Crop Sci. 1989, 29, 1018–1021. [Google Scholar] [CrossRef]
  21. Cao, W.; Moss, D.N. Daylength effect on leaf emergence and phyllochron in wheat and barley. Crop Sci. 1989, 29, 1021–1025. [Google Scholar] [CrossRef]
  22. Hay, R.; Kirby, E. Convergence and synchrony-a review of the coordination of development in wheat. Aust. J. Agric. Res. 1991, 42, 661–700. [Google Scholar] [CrossRef]
  23. Miglietta, F. Simulation of wheat ontogenesis. I. Appearance of mainstem leaves in the field. Clim. Res. 1991, 1, 145–150. [Google Scholar] [CrossRef]
  24. Jamieson, P.D.; Brooking, I.R.; Porter, J.R.; Wilson, D.R. Prediction of leaf appearance in wheat: A question of temperature. Field Crops Res. 1995, 41, 35–44. [Google Scholar] [CrossRef]
  25. Streck, N.A.; Weiss, A.; Xue, Q.; Baenziger, P.S. Incorporating a chronology response into the prediction of leaf appearance rate in winter wheat. Ann. Bot. 2003, 92, 181–190. [Google Scholar] [CrossRef] [PubMed] [Green Version]
  26. Kirby, J.M.; Appleyard, M.; Fellows, G. Leaf emergence and tillering in barley and wheat. Agronomie 1985, 5, 193–2000. [Google Scholar] [CrossRef] [Green Version]
  27. Skinner, R.H.; Nelson, C.J. Elongation of the grass leaf and its relationship to the phyllochron. Crop Sci. 1995, 35, 4–10. [Google Scholar] [CrossRef]
  28. Gallagher, J.N. Field studies of cereal leaf growth: I. Initiation and expansion in relation to temperature and ontogeny. J. Exp. Bot. 1979, 30, 625–636. [Google Scholar] [CrossRef]
  29. Moreau, J.M.; Maraite, H. Integration of knowledge on wheat phenology and Septoria tritici epidemiology into a disease risk simulation model validated in Belgium. Asp. Appl. Biol. 1999, 55, 1–6. [Google Scholar]
  30. El Jarroudi, M.; Delfosse, P.; Maraite, H.; Hoffmann, L.; Tychon, B. Assessing the accuracy of simulation model for Septoria leaf blotch disease progress on winter wheat. Plant Dis. 2009, 93, 983–992. [Google Scholar] [CrossRef] [Green Version]
  31. Moreau, J.M.; Maraite, H. Development of an interactive decision-support system on a Web site for control of Mycosphaerella graminicola in winter wheat. EPPO Bull. 2000, 30, 161–163. [Google Scholar] [CrossRef]
  32. BSA. Beschreibende Sortenliste 2018. Getreide, Mais, Ölfrüchte, Leguminosen (großkörnig) Hackfrüchte (außer Kartoffeln); Deutscher Landwirtschaftsverlag GmbH.: Hannover, Germany, 2018. [Google Scholar]
  33. Junk, J.; Görgen, K.; El Jarroudi, M.; Delfosse, P.; Pfister, L.; Hoffmann, L. Operational application and improvements of the disease risk forecast model PROCULTURE to optimize fungicides spray for the septoria leaf blotch disease in winter wheat in Luxembourg. Adv. Sci. Res. 2008, 2, 57–60. [Google Scholar] [CrossRef]
  34. Klepper, B.; Rickman, R.W.; Betfort, R.K. Leaf and tiller identification on wheat plants. Crop Sci. 1983, 23, 1002–1004. [Google Scholar] [CrossRef]
  35. Willmott, C.J.; Robeson, S.M.; Matsuura, K. A refined index of model performance. Int. J. Climatol. 2012, 32, 2088–2094. [Google Scholar] [CrossRef]
  36. R Core Team. R: A Language and Environment for Statistical Computing; R Foundation for Statistical Computing: Vienna, Austria, 2020. [Google Scholar]
  37. El Jarroudi, M.; Kouadio, L.; Delfosse, P.; Giraud, F.; Junk, J.; Hoffmann, L.; Maraite, H.; Tychon, B. Typology of the main fungal diseases affecting winter wheat in the Grand Duchy of Luxembourg. J. Agric. Sci. Technol. 2012, 2, 1386–1399. [Google Scholar]
  38. El Jarroudi, M.; Kouadio, L.; El Jarroudi, M.; Junk, J.; Bock, C.; Diouf, A.A.; Delfosse, P. Improving fungal disease forecasts in winter wheat: A critical role of intra-day variations of meteorological conditions in the development of Septoria leaf blotch. Field Crops Res. 2017, 213, 12–20. [Google Scholar] [CrossRef]
  39. Dimmock, J.P.R.E.; Gooding, M.J. The effects of fungicides on rate and duration of grain filling in winter wheat in relation to maintenance of flag leaf green area. J. Agric. Sci. 2002, 138, 1–16. [Google Scholar] [CrossRef]
  40. Pepler, S.; Gooding, M.J.; Ford, K.E.; Ellis, R.H.; Jones, S.A. Delaying senescence of wheat with fungicides has interacting effects with cultivar on grain sulphur concentration but not with sulphur yield or nitrogen:sulphur ratios. Eur. J. Agron. 2005, 22, 405–416. [Google Scholar] [CrossRef]
  41. Kirby, E.J.M.; Appleyard, M.; Fellowes, G. Variation in development of wheat and barley in response to sowing date and variety. J. Agric. Sci. 1985, 104, 383–396. [Google Scholar] [CrossRef]
  42. Abeledo, L.G.; Calderini, D.F.; Slafer, G.A. Leaf appearance, tillering and their coordination in old and modern barleys from Argentina. Field Crops Res. 2004, 86, 23–32. [Google Scholar] [CrossRef]
  43. Slafer, G.A.; Connor, D.J.; Halloran, G.M. Rate of leaf appearance and final number of leaves in wheat: Effects of duration and rate of change of photoperiod. Ann. Bot. 1994, 74, 427–436. [Google Scholar] [CrossRef]
  44. Davidson, J.; Christian, K.; Jones, D.; Bremner, P. Responses of wheat to vernalization and photoperiod. Aust. J. Agric. Res. 1985, 36, 347–359. [Google Scholar] [CrossRef]
  45. Miralles, D.J.; Slafer, G.A.; Richards, R.A.; Rawson, H.M. Quantitative developmental response to the length of exposure to long photoperiod in wheat and barley. J. Agric. Sci. 2003, 141, 159–167. [Google Scholar] [CrossRef] [Green Version]
  46. González, F.G.; Slafer, G.A.; Miralles, D.J. Vernalization and photoperiod responses in wheat pre-flowering reproductive phases. Field Crops Res. 2002, 74, 183–195. [Google Scholar] [CrossRef]
  47. Kernich, G.C.; Slafer, G.A.; Halloran, G.M. Barley development as affected by rate of change of photoperiod. J. Agric. Sci. 1995, 124, 379–388. [Google Scholar] [CrossRef] [Green Version]
  48. Miglietta, F. Effect of photoperiod and temperature on leaf initiation rates in wheat (Triticum spp.). Field Crops Res. 1989, 21, 121–130. [Google Scholar] [CrossRef]
  49. Alzueta, I.; Abeledo, L.G.; Mignone, C.M.; Miralles, D.J. Differences between wheat and barley in leaf and tillering coordination under contrasting nitrogen and sulfur conditions. Eur. J. Agron. 2012, 41, 92–102. [Google Scholar] [CrossRef]
  50. Salvagiotti, F.; Miralles, D.J. Wheat development as affected by nitrogen and sulfur nutrition. Aust. J. Agric. Res. 2007, 58, 39–45. [Google Scholar] [CrossRef]
  51. Valle, S.R.; Calderini, D.F. Phyllochron and tillering of wheat in response to soil aluminum toxicity and phosphorus deficiency. Crop Pasture Sci. 2010, 61, 863–872. [Google Scholar] [CrossRef]
  52. Prystupa, P.; Slafer, G.A.; Savin, R. Leaf appearance, tillering and their coordination in response to NxP fertilization in barley. Plant Soil 2003, 255, 587–594. [Google Scholar] [CrossRef]
  53. Hall, A.J.; Savin, R.; Slafer, G.A. Is time to flowering in wheat and barley influenced by nitrogen?: A critical appraisal of recent published reports. Eur. J. Agron. 2014, 54, 40–46. [Google Scholar] [CrossRef]
  54. Rodríguez, D.; Pomar, M.C.; Goudriaan, J. Leaf primordia initiation, leaf emergence and tillering in wheat (Triticum aestivum L.) grown under low-phosphorus conditions. Plant Soil 1998, 202, 149–157. [Google Scholar] [CrossRef]
  55. Junk, J.; Goergen, K.; Krein, A. Future heat waves in different European capitals based on climate change indicators. Int. J. Environ. Res. Public Health 2019, 16, 3959. [Google Scholar] [CrossRef] [PubMed] [Green Version]
Figure 1. Distribution and variability of daily mean air temperature, relative humidity and precipitation during the 2014–2019 period at the study sites in the Grand-Duchy of Luxembourg. For a given site, the boxplot represents the distribution of daily meteorological variables for each month over the 2014–2019 period. The top and bottom of the box represent the 75th and 25th percentiles, respectively; the solid line indicates the median. The whiskers on the top and bottom represent the largest and smallest values within 1.5 times interquartile range above the third and first quantiles, respectively.
Agronomy 10 01825 g001
Figure 2. Mean absolute errors (MAE; left) and root mean square errors (RMSE; right) according to the phyllotherms used for predicting the emergence of leaves F, F-1 and F-2 in winter wheat in the Grand-Duchy of Luxembourg. Phyllotherms are expressed in °Cd. F is the flag leaf. In all years only values for the cultivar Kerubino were used.
Agronomy 10 01825 g002
Figure 3. Observed (dashed lines) and predicted (solid lines) percentage emergence of formation of the flag leaf (F) in winter wheat during the 2014–2019 cropping seasons at the different study sites in the Grand-Duchy of Luxembourg. The percentage of emerged leaf area for each of the three leaf layers was estimated by comparison to the total area of the preceding fully emerged leaf (assumed as 100%), and by checking the ligule of the emerging leaf (a fully visible leaf ligule corresponds to a fully emerged leaf). The percentage emerged areas were estimated for each of the 40 replicate plants at each assessment. In all years only values for the cultivar Kerubino were used. Note: the curve for observed values and that for predicted values using the 100 °Cd phyllotherm appear superposed in most of the graphs.
Agronomy 10 01825 g003
Figure 4. Comparisons of the Willmott’s index values according to the phyllotherms (100, 115, 130, 145 and 160 °Cd) used for predicting the emergence of leaves F, F-1 and F-2 in winter wheat during the 2014–2019 cropping seasons at the different study sites in the Grand-Duchy of Luxembourg. F is the flag leaf. In all years only values for the cultivar Kerubino were used.
Agronomy 10 01825 g004
Figure 5. Comparisons between observed and predicted leaf emergence for the three upper leaves (F, F-1 and F-2, F being the flag leaf) for different winter wheat cultivars at Bettendorf during the 2017–2019 cropping seasons. Only results for the default phyllotherm in PROCULTURE (130 °Cd) and phyllotherm 100 °Cd are presented. Note: the curves for observed values and predicted values using the 100 °Cd phyllotherm appear superposed in some of the graphs.
Agronomy 10 01825 g005
Figure 6. Mean absolute errors (MAE; left) and root mean square errors (RMSE; right) according to the phyllotherms tested for predicting the emergence of the upper leaves F, F-1 and F-2 in winter barley at the different study sites in the Grand-Duchy of Luxembourg. Phyllotherms are expressed in °Cd. F is the flag leaf.
Agronomy 10 01825 g006
Figure 7. Comparisons of the Willmott’s index values according to the phyllotherms (100, 115, 130, 145 and 160 °Cd) used for predicting the emergence of leaves F, F-1 and F-2 in winter barley at the different study sites in the Grand-Duchy of Luxembourg. F is the flag leaf.
Agronomy 10 01825 g007
Figure 8. Observed (dashed lines) and predicted (solid lines) percentage emergence (in this case measure as first visible appearance) of the flag leaf (F) in winter barley during the 2014–2019 cropping seasons in the Grand-Duchy of Luxembourg. The percentage of emerged leaf area for each of the three leaf layers was estimated by comparison to the total area of the preceding fully emerged leaf (assumed as 100%), and by checking the ligule of the emerging leaf (a fully visible leaf ligule corresponds to a fully emerged leaf). The percentage emerged areas were estimated for each of the 40 replicate plants at each assessment. Note: the curves for observed values and predicted values using the 100 °Cd phyllotherm are superposed in most of the graphs.
Agronomy 10 01825 g008
Table 1. Agronomic information for the commercial winter wheat and winter barley fields at the study sites used for investigating the effect of phyllotherm on leaf emergence during the 2014–2019 cropping seasons in the Grand-Duchy of Luxembourg.
SiteYear Wheat Barley
CultivarCC aSowing DatePrevious CropTillageN Rate
(N kg/ha) b
CultivarCC aSowing DatePrevious CropTillageN Rate
(N kg/ha)
Bettendorf2014Kerubino49 October 2013Oilseed rapeNo150Leibniz624 September 2013WheatYes220
2015Kerubino415 October 2014Oilseed rapeNo170California628 September 2014Oilseed rapeYes220
2016Kerubino409 October 2015Oilseed rapeNo160California628 September 2015MaizeYes220
2017Kerubino412 October 2016Oilseed rapeNo160California630 September 2016Winter wheatYes220
Achat612 October 2016Oilseed rapeNo160
2018Kerubino419 October 2017Oilseed rapeYes150California630 September 2017Winter wheatYes220
Desamo519 October 2017Oilseed rapeYes150
2019Kerubino424 October 2018Oilseed rapeNo150California628 September 2018Winter wheatYes220
Desamo524 October 2018Oilseed rapeNo150
Burmerange2014Asano43 October 2013Oilseed rapeNo185Sandra527 September 2013WheatNo140
2015Asano44 October 2014MaizeNo190Leibniz618 September 2014WheatNo140
2016Kerubino44 October 2015MaizeNo200Leibniz618 September 2015WheatNo140
2017Kerubino417 October 2016Oilseed rapeNo190Wotan515 October 2016WheatYes140
2018Reform612 October 2017Oilseed rape.Yes140Wotan515 October 2017Winter wheatNo140
2019Kerubino418 October 2018Oilseed rapeYes140California627 September 2018Spring triticaleNo140
Everlange2014Privilege63 October 2013Oilseed rapeNo160Meridian526 September 2013Oilseed rapeNo150
2015Desamo525 October 2014MaizeNo180Souleika624 September 2014TriticaleYes170
2016Desamo525 October 2015MaizeNo170Tamina620 September 2015.Spring wheatYes160
2017Manitou613 October 2016MaizeYes160Tamina629 September 2016RyegrassYes160
2018Genius514 October 2017PeasYes140Meridian525 September 2017Oilseed rapeYes150
2019Kerubino416 October 2018Oilseed rapeYes140Higgins528 September 2018Grass seedYes150
Reuler2014Kerubino420 October 2013MaizeYes180California630 September 2013WheatYes200
2015Kerubino41 October 2014Oilseed rapeYes190California630 September2014SpelledYes200
2016Kerubino430 October 2015MaizeYes200California629 September 2015WheatYes200
2017Kerubino43 October 2016MaizeYes190California622 September 2016Oilseed rapeYes200
2018Kerubino419 October 2017MaizeNo140California625 September 2017Oilseed rapeYes200
2019Kerubino412 October 2018Oilseed rapeYes140California627 October 2018MaizeNo150
a: Cultivar classification. Early-maturity cultivar: ≤4; Medium-maturity cultivar: 5–6; Late-maturity cultivar: ≥7 [32]. b: Nitrogen fertilizer.
Table 2. Dates of observation and percentage of emerged leaf area for the F-2 leaf (where F = flag) on plants in commercial winter wheat and winter barley fields at the four study sites in the Grand-Duchy of Luxembourg during the 2014–2019 cropping seasons.
SiteYearDate of ObservationPercentage of Leaf Formed (%) a
BarleyWheatBarleyWheat
Bettendorf201431 March14 April8510
201516 April22 April7060
201611 April19 April2550
201718 April2 May6795
201816 April16 April409
20198 April15 April9013
Burmerange201421 March14 April513
201513 April20 April3232
20168 April18 April1460
201719 April29 April1590
201813 April21 April152
20193 April20 April1216
Everlange20145 March14 April8018
201512 April20 April2743
20164 April25 April1489
201712 April2 May4330
20186 April16 April67
20196 April28 April15
Reuler201410 April22 April9057
201513 April4 May3670
201618 April5 May805
201723 April1 May905
20189 April30 April1324
20195 April28 April56
a: The percentage of emerged leaf area for each leaf layer was estimated by comparison to the total area of the preceding fully formed leaf (assumed as 100%), and by checking the ligule of the emerging leaf (a fully visible leaf ligule corresponds to a fully emerged leaf). Thus, the percentage of the emerged area of each of the three leaf layers was estimated relative to the preceding leaf layer for each of the 40 plants.
Table 3. Probability of detecting (POD) leaf emergence, false alarm ratio (FAR), and critical success index (CSI) using a phyllotherm of 100 °Cd for winter wheat and winter barley during the 2014–2019 cropping seasons. The values of the forecasted and observed data used for the calculations of the statistical scores are provided. For 2017, 2018 and 2019, only observations for the wheat cultivar Kerubino were used. F = the flag leaf.
CropSiteLeafFE aFNE bNFE cPOD dFAR eCSI f
Winter wheatBettendorfF-26001.000.001.00
F-16001.000.001.00
F6001.000.001.00
BurmerangeF-26001.000.001.00
F-16001.000.001.00
F4020.700.000.70
EverlangeF-25101.000.160.84
F-16001.000.001.00
F5010.840.000.84
ReulerF-26001.000.001.00
F-16001.000.001.00
F5010.840.000.84
Winter barleyBettendorfF-26001.000.001.00
F-16001.000.001.00
F6001.000.001.00
BurmerangeF-26001.000.001.00
F-16001.000.001.00
F5010.840.000.84
EverlangeF-26001.000.001.00
F-16001.000.001.00
F4020.700.000.70
ReulerF-25101.000.160.84
F-15101.000.160.84
F6001.000.001.00
a Forecasted and emerged. b Forecasted but not emerged. c Emerged but not forecasted. d POD, probability of detection, it is the probability of correctly forecasting the observed event; it ranges between zero and one (perfect score = 1). e FAR, false alarm ratio, is the number of times an event is forecast but is not observed, divided by the total number of forecasts of that event. Perfect value = 0. f CSI, critical success index, considers both false alarms and missed events; it ranges between zero and one (perfect score = 1).
Publisher’s Note: MDPI stays neutral with regard to jurisdictional claims in published maps and institutional affiliations.

