Article

Genome-Wide Association Study for Plant Architecture and Bioenergy Traits in Diverse Sorghum and Sudangrass Germplasm

1
College of Agronomy, Resources & Environment, Tianjin Agricultural University, Tianjin 300384, China
2
College of Life Sciences, Shanxi Agricultural University, Taigu 030801, China
3
Department of Agronomy, Purdue University, West Lafayette, IN 47907, USA
*
Authors to whom correspondence should be addressed.
These authors have contributed equally to this work.
Agronomy 2020, 10(10), 1602; https://doi.org/10.3390/agronomy10101602
Submission received: 23 September 2020 / Accepted: 13 October 2020 / Published: 19 October 2020
(This article belongs to the Section Crop Breeding and Genetics)

Abstract

:
Sorghum is an important grain, forage, and bioenergy crop. The objective of this study was to identify genetic signals associated with plant architecture and bioenergy traits in sorghum and sudangrass germplasm through a genome-wide association study (GWAS). Plant height (HT), tiller number (TN), internode number (IN), stem diameter (SD), panicle length (PL), panicle weight (PW), reducing sugar (RS) content, Brix, and protein (PRO) content were assessed in 300 germplasm consisting of grain sorghum, sweet sorghum, sudangrass, sweet sorghum-sweet sorghum recombinant inbred lines (RILs) and sudangrass-sudangrass RILs grown in three different environments over two years. Large variations of phenotypic traits were observed in the population panel. The heritability of traits were all higher than 0.5, ranging from 0.52 (PRO) to 0.92 (HT) with an average of 0.76. The population exhibited three population structures (Q) and minor relative kinship (K), assessed by using 7982 single-nucleotide polymorphisms (SNPs). After controlling Q and K, GWAS identified 24 SNPs that were significantly associated with traits, including three SNPs with HT, four with TN, four with PL, three with Brix, and ten with RS. Of them, seven SNPs were novel signals that were not identified previously, including one for HT, one for TN, one for Brix, and four for RS. The putative candidate genes involved in brassinosteroid regulatory pathway, auxin biosynthesis, carbohydrate metabolism, and sugar transport were identified underlying the significant SNPs. Identification of SNP signals and related candidate genes would enrich the current genomic resource for further molecular breeding aimed at improvement of food, feed, and biofuel productions of sorghum.

1. Introduction

Sorghum (Sorghum bicolor) is an important crop worldwide. Grain sorghum is a major world staple crop for human food and livestock feed [1,2], and is ranked as the fifth most important grain crop worldwide. Sweet and biomass sorghums have also been increasingly receiving attention for bioenergy production due to their high sugar content in the stalk for potentially producing more ethanol [3,4]. Sudangrass (Sorghum sudanese) is an annual forage crop with a strong capacity for tillering and regeneration, and has softer stems and leaves than forage maize (Zea mays) and sorghum [5]. Both sorghum and sudangrass have the same diploid chromosomes (2n = 2x = 20), and crosses can be made between these two species. The sorghum-sudangrass hybrids (S. bicolor × S. sudanense) show a wide range of advantages including high yield, good lodging resistance, drought and cold tolerance, good palatability, and high nutritional values [6]. Large variations in phenotypic traits such as plant morphology, biomass, grain quality, and stress tolerance have been observed in grain, biomass and sweet sorghum lines or sorghum–sudangrass hybrids [4,7,8,9,10]. A wide range of adaptation with phenotypic diversity in sorghum and sudangrass allows exploration of genetic mechanisms underlying the trait variation.
Genomic analysis of diverse populations has demonstrated the power of dissection of the genetic basis of various phenotypic traits in plant species. The genome-wide association study (GWAS), based on linkage disequilibrium (LD) mapping, which correlates molecular markers with complex quantitative traits, offers advantages for increasing resolution of marker identification [11]. Single nucleotide polymorphisms (SNPs) associated with a variety of phenotypic traits have been identified through GWAS in landraces and accessions or recombinant inbred lines (RILs) of sorghum, including traits related to plant architecture [12,13,14,15,16,17], agronomy [16,18,19,20,21], bioenergy [22,23,24,25,26], and physiology and biochemistry [10,27,28,29]. Some of the significant markers were supported by the quantitative trait locus (QTL) interval detected by parental linkage mapping studies or additional GWAS studies. For example, seven QTLs for plant height were detected by a GWAS in sorghum accessions [15], and four of them were within the previously identified QTL region on chromosomes 6 and 9 [30,31]. In addition, two associations for plant height observed on chromosome 7 corresponded to qPHT7.1 and Dw3 [16], which were identified using linkage mapping [32,33,34]. Three QTLs detected for plant height, qPH6.1, qPH7.1 and qPH9.1 through QTL mapping [35], have also been found in two GWAS studies [12,36]. However, novel genomic regions are often detected to be associated with traits in each of the unique GWAS studies. These signals would assist in selecting and narrowing down the genomic region for further validation of the locus or gene underlying a trait of interest.
The candidate genes in the target SNP regions presumably play an important role in controlling phenotypic traits. To date, several genes or classical loci have been discovered in sorghum including the most studied Dw1-Dw4 [37] and qHT7.1 [13] for plant height. The Dw1 locus, located at ~57 Mbp on chromosome 9, is a novel component of brassinosteroid signaling and acts as a positive modulator of brassinosteroid signaling [32]. Dw2 was mapped to chromosome 6 at ∼42 Mbp [12], and is identified as a protein kinase that regulates stem internode length [33]. Dw3 is located at ~ 58Mbp on chromosome 7 and is identified as an adenosine triphosphate-binding cassette (ABC) transporter of the plant hormone auxin [38]. The exact location of Dw4 has not been determined, and it is possibly on the lower arm of chromosome 4 [13]. qPHT7.1 is also on chromosome 7 [13,16]. The two associated SNPs for qPHT7.1 were approximately 50 kb from the gene encoding an MYB domain protein, which was highly expressed in the internode and peduncle [16]. The rice ortholog of this gene regulates internode elongation and mutants exhibit a modest reduction in plant height [39]. The results suggest that this MYB domain protein could be a promising candidate for qPHT7.1. Information on other molecular markers, QTL, and the underlying traits of candidate genes has been summarized in sorghum [40,41].
Previous studies have revealed genetic control of plant architecture and bioenergy related traits in sorghum. However, given the existence of genetic diversity within different types of germplasm and genotype by environment interaction for complex traits, it is necessary to identify potential novel signals and/or verify the robustness of the existing QTLs in diverse germplasm across different environments. Therefore, we assembled 300 germplasm lines including sweet sorghum, grain sorghum, sudangrass, sweet sorghum RILs, and sudangrass RILs and conducted GWAS for plant architecture and bioenergy related traits across three climate regions in China. The research aimed at the identification of signals for a better understanding of the genetic control of phenotypic traits in sorghum and sudangrass germplasm. The results would benefit marker-assisted breeding for improved food, feed, and biofuel productions in sorghum plants.

2. Materials and Methods

2.1. Plant Materials and Growing Conditions

Three hundred diverse germplasm lines were used for the experiment, consisting of 22 grain sorghum, 165 sweet sorghum, 63 sudangrass, 8 sweet sorghum-sweet sorghum RILs, and 42 sudangrass-sudangrass RILs (Supplemental Table S1). Seeds of each line were planted in three locations in China, including Xinjiang province (44.54° N, 88.17° E) and Inner Mongolia province (45.54° N, 108.31° E) in 2014 and Liaoning province (42.19° N and 120.80° E) in 2015. Seeding and harvesting time, and environmental and soil conditions for each location are listed in Supplemental Table S2.

2.2. Phenotypic Traits and Repeatability

Plant height, tiller number, internode number, stem diameter, panicle length, panicle weight, reducing sugar, Brix, and protein content were measured in all germplasm lines at the reproductive stage across all locations in both years. Plant height was determined from the soil surface to the top of the panicle. Tiller number was recorded by manual separation from the main stalk, and internode number was counted on the main stalk. Stem diameter was measured using calipers. Panicle length was measured from the base of the leaf scar to the top of the panicle and dry weight was recorded. The third internode area from the top of the main stalk was collected for measuring Brix using a Brix meter (PAL-1, ATAGO Co., Ltd., Tokyo, Japan) and reducing sugar using Fehling’s solution in an SGD-IV automatic reducing sugar analyzer (Shandong Acad. Sci., Jinan, China). Brix (%) measures the sugar content of an aqueous solution and is commonly used as an indicator of sugar content in stalk juice. Crude protein was measured using the main stalk. Tissue was placed in an oven at 105 °C for 30 min and then at 65 °C until reaching constant dry weight. The dry tissue was ground into powder and sieved by 0.4 mm. Protein was determined by the Dumas combustion method using a rapid N/protein analyzer (Elementar Co., Langenselbold, Germany).
The heritability (h2) of phenotypic traits across three locations (environments) was calculated using PROC MIXED (SAS Institute, Version 9.1, Cary, NC, USA). The h2 was calculated as follows: h2 = σ2g/2g + σ2ge/l + σ2e/rl), where σ2e is the variance component for genotypes, σ2ge for genotype-by-environment, σ2e for error; r is the number of replications, and l is number of environment [42]. Based on the outcome of h2, least square means were estimated for each trait per germplasm line across three locations.

2.3. Experimental Design and Statistical Analysis

All locations were a randomized complete block design with three replications (blocks). Each block contained 300 germplasm lines, and they were randomly assigned into each block. Twenty-five plants of each line were planted in a single 5-m-long row, with 50-cm row spacing, 20-cm plant spacing in each block. Three representative plants from each row were chosen for sampling in each block as one replication. The analysis of variance was performed at a significance level of 0.05 using PROC MIXED in SAS [43], with accession and environment as fixed factors and replications as a random factor. Least squares means for each trait generated by PROC MIXED were used for testing trait correlation, trait differences among structural groups, and gene-trait association analysis. Pearson correlation among traits was performed using PROC CORR in SAS.

2.4. Genotyping

The population was genotyped using restriction site-associated DNA (2b-RAD) with type IIB (BsaXI) restriction enzyme; the detailed procedure was described previously [44,45]. Briefly, the library was established and sequenced at Illumina Hiseq Xten platform to produce nucleotide paired-end reads, with an average of ~6.8 M reads per sample generated. The reads were filtered by removal of reads with adaptor, low quality reads, and reads with unidentified nucleotide sequence. The clean reads were aligned to the Sorghum bicolor genome version 1.4 using SOAP [46], and a total of 91,197 SNPs were discovered. The most informative 7928 SNPs were retained across 10 chromosomes for this study. The pipeline parameters included minimum SNP call rate of 80%, maximum observed heterozygosity of 0.5, and minor allele frequency of 1%.

2.5. Population Structure, Relative Kinship, Principal Component Analysis (PCA), and Linkage Disequilibrium (LD)

Population structure (Q) was determined by using STRUCTURE 2.3.2 software [47] using filtered SNP markers generated for this study. Briefly, the structure was run 10 times by setting pre-defined k (the number of population groups) from 1 to 8 using admixture models, with 10,000 burn-in time and 10,000 iterations of Markov chain convergence for each run. Among the 10 runs, the one with the highest likelihood value was selected to assign the proportion of membership for each accession [48]. Relative pairwise kinship (K) was calculated using TASSEL 5.0 [49]. The PCA was analyzed with SNP markers using the TASSEL 5.0, and the results were visualized using R (https://www.r-project.org). The LD was also calculated using TASSEL 5.0. The generated r2 values averaged with each 50 kb were plotted against the physical distance among each pair of SNPs.

2.6. Genome-Wide Association Study (GWAS) and Candidate Gene Identification

Quantile-quantile (Q-Q) plots for model comparisons of simple linear (S), linear model implemented with population structure (Q), mixed model implemented with relative kinship (K), and Q+K across all traits were generated using ‘qqman’ package in R. The best fit model that represents the best agreement between the observed and expected −log10 (p) value for a given trait for gene-trait associations was selected for the association analysis of each trait. GWAS analysis was conducted with phenotypic data across three environments as well as with data of each individual environment using TASSEL 5.0. Associations were considered to be significant only at a p-value lower than the pthreshold-value, calculated using pthreshold = 0.05/N (N = the number of SNPs), based on a Bonferroni correction for multiple comparisons. The positions of all significant SNPs were compared with those previously published signals through GWAS and linkage mapping studies with sorghum QTL atlas [50]. The SNP locations were identified using genome version 1.4, but their positions in comparison with genome version 3.1 were also provided. Using the S. bicolor genome assembly, candidate genes containing SNPs or adjacent to SNPs extended to 100 kb (based on LD) were identified. Candidate genes annotated using genome version 1.4 were listed and their corresponding gene names in genome version 3.1 were also provided. The annotated genes putatively involved in plant growth and development, and hormone and carbohydrate metabolism were given high priority for identifying candidate genes underlying a trait.

3. Results

3.1. Analysis of Variance, Trait Variation and Heritability

Genotypes had significant effects on plant height (HT), tiller number (TN), internode number (IN), stem diameter (SD), panicle length (PL), panicle weight (PW), reducing sugar (RS), Brix and protein (PRO) across three environments (Table 1). Significant environment effects and significant genotype by environment interactions were also noted in all traits (Table 1). All the trait values varied considerably across genotypes (Table 1). Heritability (h2) was calculated across 300 genotypes and three environments. The h2 values of all traits were higher than 0.5, ranging from 0.52 (PRO to 0.92 (HT) with an average of 0.76 (Table 1). The high heritability over testing the environments allowed least square means of individual traits to be calculated and used for association analyses of markers and traits.

3.2. Trait Correlations

There were 13 positive and 15 negative correlations among the traits across the population (Table 2). Specifically, HT was positively correlated with TN, IN, RS and Brix but negatively correlated with SD, PW, and PRO. TN was only positively correlated with PL but negatively correlated with IN, SD, PW, Brix and PRO. IN was only negatively correlated with PL but positively correlated with SD, PW, RS, Brix and PRO. Positive correlations were also observed between SD and PW, SD and PEO, PW and PRO, RS and Brix. Negative correlations were also identified between SD and PL, SD and RS, RS and PRO, and Brix and PRO. The PL was also negatively correlated with RS and Brix.

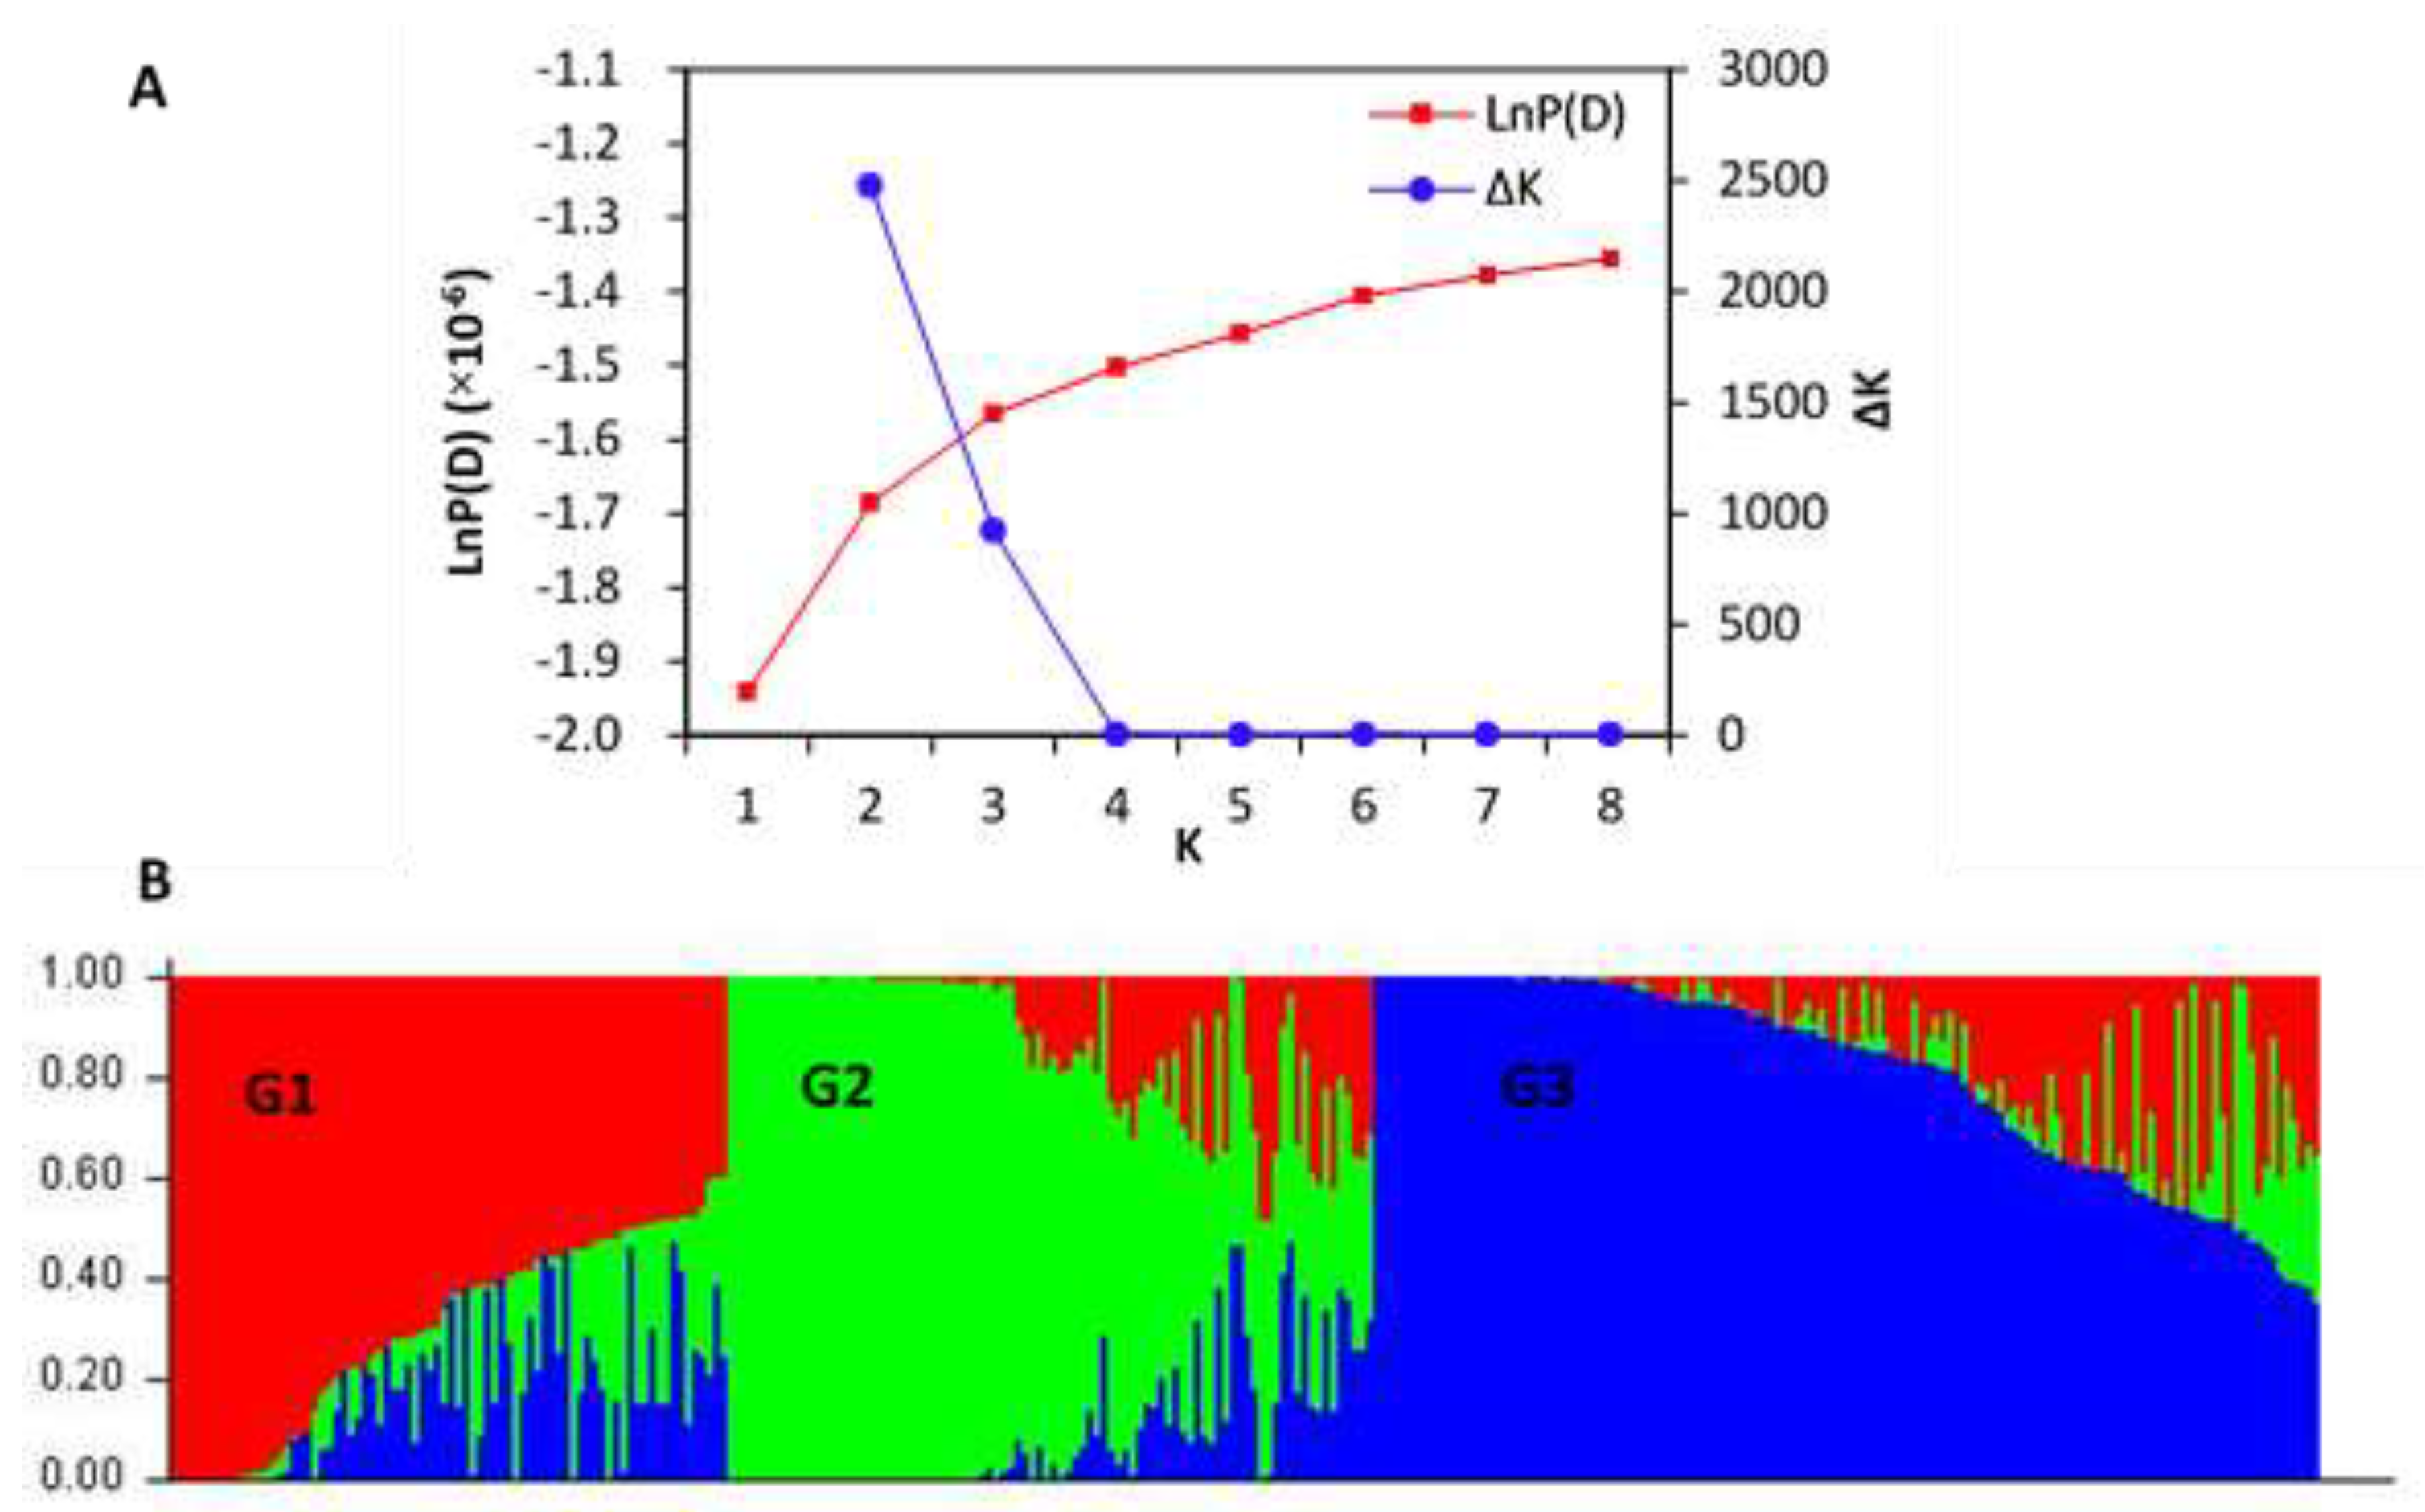
3.3. Population Structure and Its Effects on Traits

Population structure was analyzed using 7928 SNPs generated from the population. The combination trends of the likelihood values of [LnP(D)] and the ΔK calculated for each K showed the 300 genotypes could be assigned into three subgroups (G1, G2 and G3) (Figure 1A). There were 78, 90, and 132 genotypes from G1, G22 and G3, respectively (Figure 1B). G1 mainly contained sweet sorghum and sudangrass; G2 consisted of sweet sorghum, sudangrass, sudangrass inbred lines and sweet sorghum inbred lines, and G3 mainly included sweet sorghum and grain sorghum.
Three subgroups differed in trait values (Table 3). G2 had significantly higher TN, and PL and lower IN, SD, PW, RS, Brix, and PRO than both G1 and G3. G2 also had higher HT than G3 but not G1. Comparing G1 and G3, G1 had higher TN and PW but lower IN, SD, and Brix values than G3. No differences in HT, PL, RS and PRO were observed between G1 and G3.

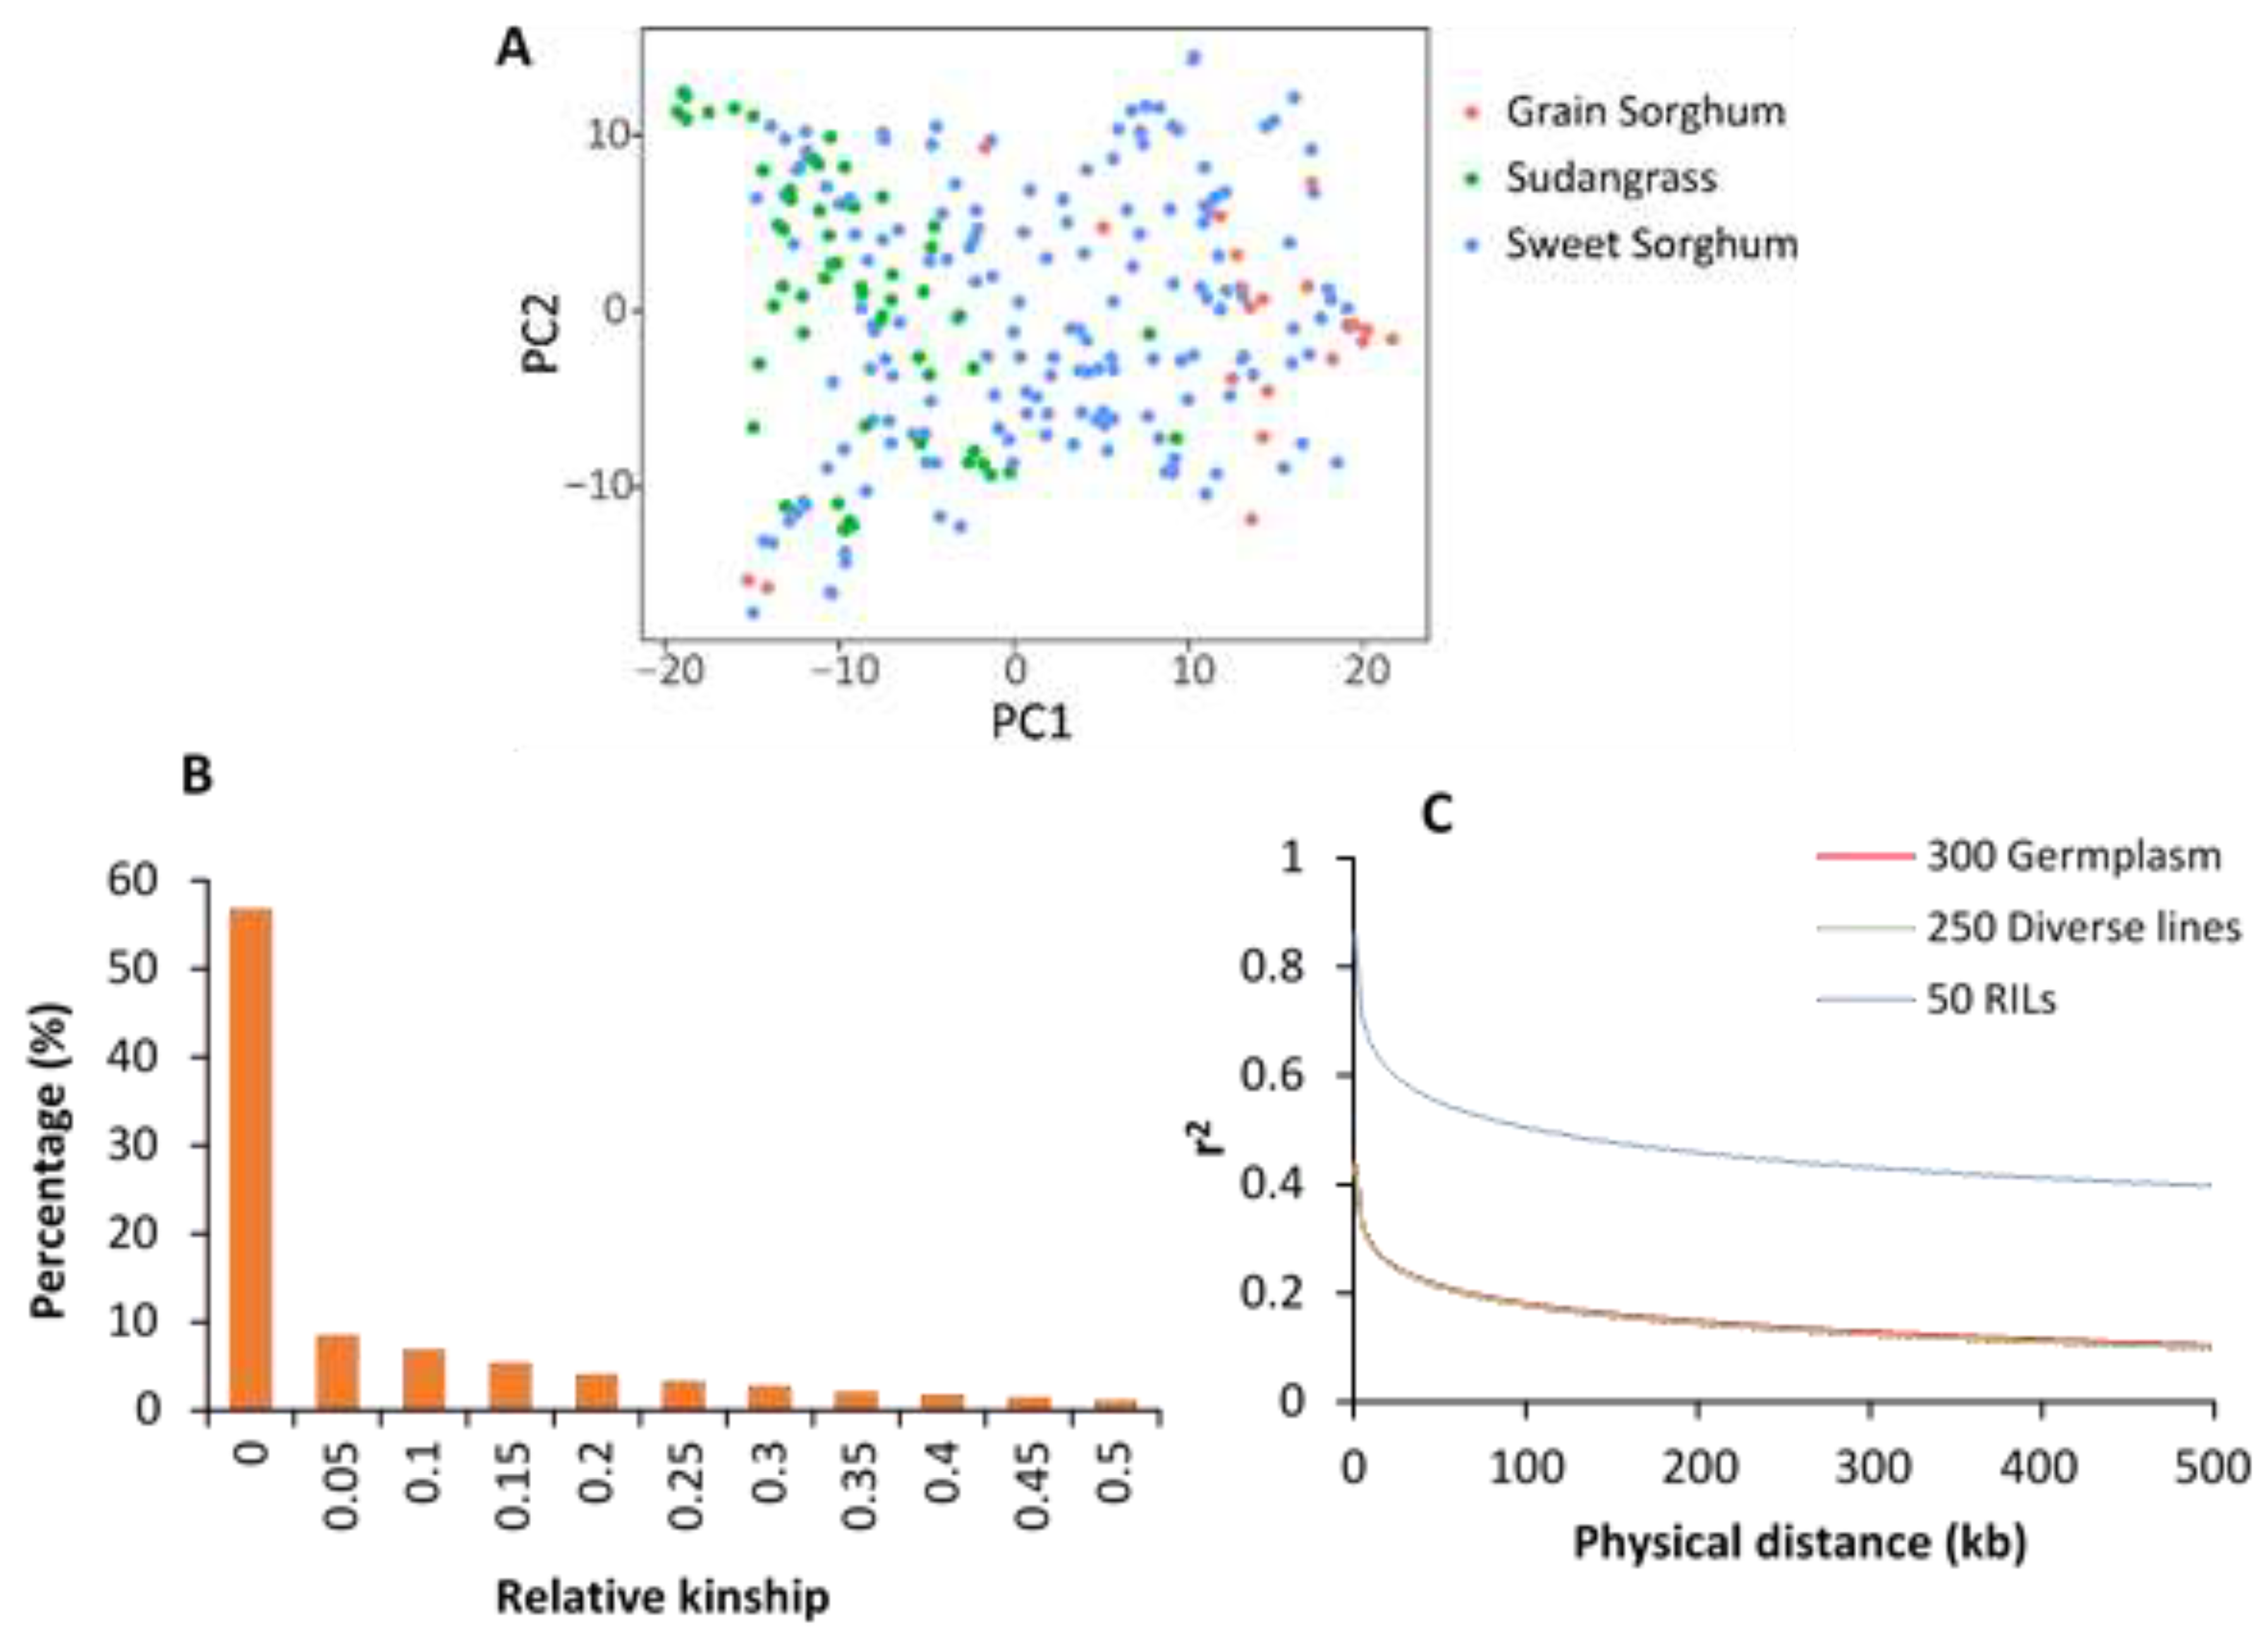
3.4. PCA, Relative Kinship and LD
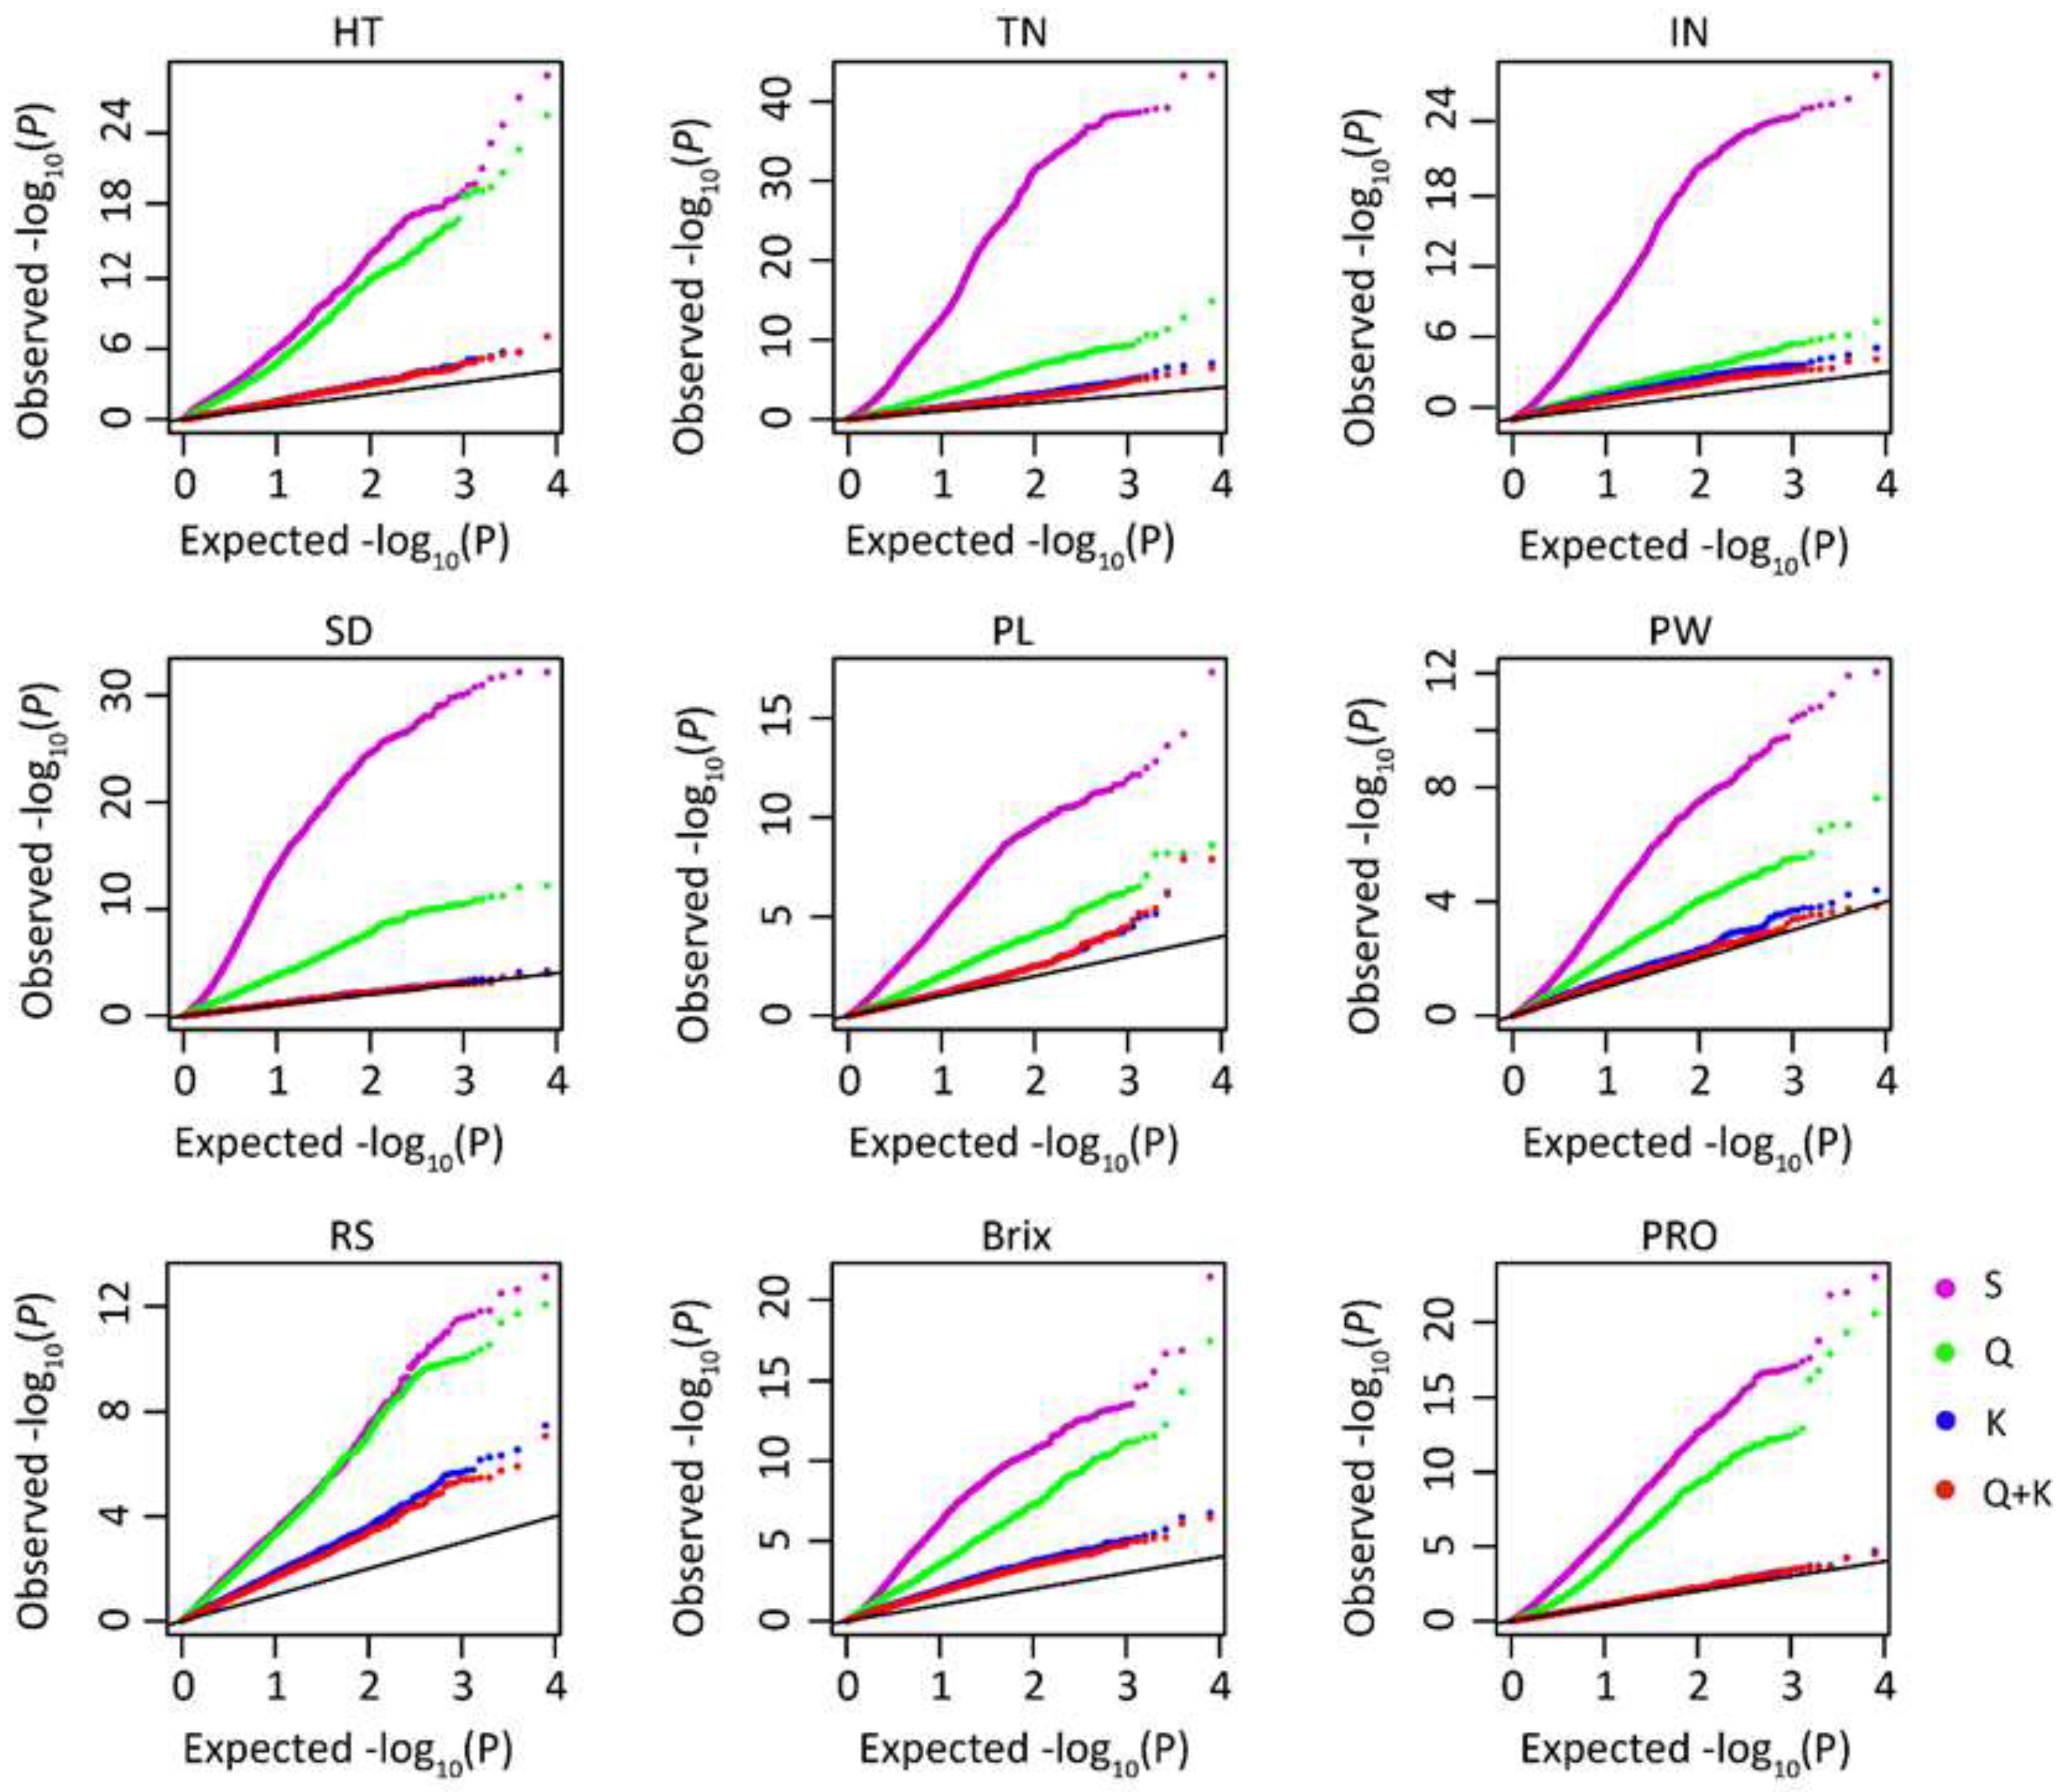
PCA revealed that grain sorghum and sudangrass germplasm were well-separated into different clusters, while grouping for sweet sorghum lines was not apparent as they were scattered into different clusters (Figure 2A). Approximately 56.8% of the pairwise kinship estimates were zero, while 8.6% were between zero and 0.05, 6.8% between 0.05 and 0.1, and 9.3% between 0.1 and 0.2, indicating that approximately 82% of the estimates were < 0.2 (Figure 2B). Across all 300 samples, a rapid decline in LD was observed within 100 kb with r2 = 0.18, but LD decay extended to 500 kb with r 2 = 0.10 (Figure 2C). The LD decay pattern of 250 diverse germplasm was almost identical to that of 300 samples, while LD decay for RILs (50) was r2 = 0.50 within 100 kb and extended to 500 kb with r 2 = 0.40 (Figure 2C).

3.5. GWAS

The quantile-quantile (Q-Q) plots verified the adequate model for controlling false positives for marker and trait association (Figure 3). The S, Q, K, and Q + K models were implemented and compared by examining the results between the observed and expected −log10 (p). The results showed that the Q + K model was more suitable for analyzing genome-wide association for all phenotypic traits.
Across three environments, GWAS detected 24 significant SNPs associated with HT, TN, PL, RS, and Brix after controlling Q and K (Figure 4, Table 4). Specifically, one SNP at S3_53230521 on chromosome 3, one at S8_50424256 on chromosome 8, and one at S9_56656748 on chromosome 9 were associated with HT, explaining HT variations by 9.5%, 9.0% and 11.3%, respectively. Four SNPs (S2_63990205, S6_46267204, S8_54924780 and S9_52354291) located on chromosomes 2, 6, 8, and 9 were associated with TN, explaining TN variations by 9.1%, 10.1%, 9.4%, and 8.7%, respectively. Four SNPs (S1_11646700, S2_794419, S8_49724219, S10_1803717), found on chromosomes 1, 2, 8, and 10, were associated with PL, causing PL variations by 13.2%, 8.5%, 9.6%, and 10.3%, respectively. Three SNP signals (S5_216438, S6_39878130, S8_40217639) were identified for Brix, leading to Brix variations of 11.2%, 11.5%, and 8.9%, respectively. There were 10 SNPs significantly associated with RS, including four on chromosome 1, two on chromosome 2, one on chromosome 3, two on chromosome 9, and one on chromosome 10. These SNPs caused RS variations ranging from 8.7% to 12.5%. Of total significant SNPs, six were novel signals that were not identified previously (Table 4, Supplementary Table S4), including S3_53230521 for HT, S8_54924780 for TN, S5_216438 for Brix, and S2_70725655, S9_83605, S9_43662454, and S10_57577048 for RS.

3.6. Candidate Genes

The putative candidate gene was identified within 100 kb of each significant SNP (Table 5). The selected genes, homologs to those in Arabidopsis, seemed to be interesting and might play a role in affecting a particular trait. Three candidate genes were identified for HT, including Sb03g026400 encoding an auxin-responsive protein on chromosome 3 within 40 kb of a SNP, Sb08g019600 encoding a protein kinase on chromosome 8 within 41 kb of a SNP, and Sb09g027683 encoding an indole-3-butyric acid response protein on chromosome 9 within 0.26 kb of a SNP. Four candidate genes, Sb02g028870 on chromosome 2, Sb06g017100 on chromosome 6, Sb08g022790 on chromosome 8, and Sb09g022660 on chromosome 9 were detected for TN, which were about 3.7-, 0.47-, 33.4-, and 72.5-kb away from the target SNP, respectively. There were four potential candidate genes for PL, including Sb01g012660 encoding a protein kinase family protein, Sb02g000960 encoding WRKY57 transpiration factor, Sb08g019140 encoding a RNA binding protein, and Sb10g002190 encoding an exordium-like 3 protein involved in the brassinosteroid regulatory pathway at 0.38-, 0.69-, 59.4-, and 52.3-kb from the target SNP, respectively. Three genes were detected for Brix, including Sb05g000330 encoding a mitochondrial substrate carrier protein, Sb06g014370 encoding a hydroxyproline-rich glycoprotein protein and Sb08g015300 encoding a pentatricopeptide protein, which were approximately 76.9-, 64.5-, and 9.6-kb away from the target SNP, respectively. Ten candidate genes could affect RS. Of them, the notable homologs for RS were Sb01g028790 encoding a MYB transcription factor, Sb01g029400 encoding a glucosyltransferase, Sb01g029590 encoding a trehalose-6-phosphate phosphatase, Sb02g030990 encoding glycoside hydrolase 9B7, and Sb02g036310 encoding a sugar transporter. These genes were located approximately 85.1-, 79.7-, 33.8-, and 5.1-kb from the target SNP on chromosomes 1 and 2, respectively.

4. Discussion

4.1. Trait Variations and Correlations

Large phenotypic variations were observed in the diverse collection panel. The range of HT, TN, IN and PL values were comparable to the previous study identified in 315 sorghum accessions [15]. The range of Brix values observed in this study was also comparable to sorghum RILs derived from a cross between a dwarf grain sorghum and a tall sweet sorghum [65]. All traits showed high heritability except for PW and PRO with moderate heritability. Overall, large variations of phenotypic traits and high heritability of the traits provide an important basis for analyzing marker-trait associations in sorghum panel.
Some of the trait correlations agreed with the results in other studies. A positive correlation between HT and IN, negative correlation between TN and IN, and no correlation between HT and PL found in this study were consistent with a previous report in sorghum accessions [15]. However, a positive correlation between HT and PL was found in biparental quantitative trait loci (QTL) mapping population [31,66] and accessions including sweet sorghum, grain sorghum, forage sorghum, mutant populations, and B- and R-lines [67]. We identified a positive correlation between HT and TN, which was also shown in a segregating population derived from a cross between S. bicolor and S. sudanense [68], but not in a RIL population derived from a cross between grain sorghum and sweet sorghum [63]. HT was negatively correlated with SD, which was consistent with the previous result [63], but did not support the correlations noted in another study [54]. In addition, the positive correlation between HT and Brix observed in this study was consistent with previous results [52,69,70,71]. Brix and RS were measured using stem tissue, but we found a negative correlation between SD and RS, but no correlation between SD and Brix. No correlation between SD and Brix and a positive correlation between SD and sugar were found previously [63], however, a positive correlation between HT and Brix was observed in RILs of sorghum [71]. Collectively, the results demonstrated interrelationships among morphological, agronomic and physiological traits in the diverse collection. Samples size, nature of the populations, and environmental conditions may all contribute to the variation of relationships among various traits.

4.2. LD Decay

The LD decay pattern of all 300 samples and 250 diverse accessions was almost identical, while LD decay for RIL lines was somewhat different (Figure 2C). Linkage disequilibrium determines the resolution of an association mapping [72]. In this study, LD decayed to r2 = 0.18 within 100 kb and to r2 = 0.10 within 500 kb across all 300 samples or across 250 diverse germplasm (Figure 2C). Previous studies have shown a varied LD decay pattern in sorghum. The LD decay was found to r2 < 0.2 within 5 kb and r2 < 0.1 within 20 kb in sweet cultivars and landraces [25], 15–20 kb in accessions [73,74], 30 kb in a mini core collection of landraces [73], 50 kb in the diverse landraces [16], 50–100 kb in landraces [75], and within 150 kb in accessions [12]. A recent study has demonstrated that LD decay to r2 < 0.1 within 50 kb in the diverse landraces, but decay to r2 = 0.2 within 90 kb in the recombinant inbred lines (RILs) [16]. In addition, several RILs population had LD decay to r2 = 0.4 to 0.6 within 100 kb and to r2 = 0.3 to 0.5 within 500 kb [76], and LD values for RILs in this study were in this range and consistent with their results. LD rate decay was slower in RILs families (∼500 kb) compared to diverse accessions from China and Ethiopia (∼20 kb) [76]. The mapping population in this study consisted of 50 RILs, accounting for 16.7% of total genotypes. The outcome of LD was similar to that observed in the RILs [16,76]. It appeared that genome coverage of markers and number and type of genotypes could contribute to variations of LD. The faster LD decay in more diverse populations may reflect greater recombination and lead to higher mapping resolution than in RIL families [72].

4.3. Marker Effects

On average, the significant SNPs caused 9.9% of phenotypic trait variations in this study (Table 4). The SNP effects on the traits were higher, lower or comparable to other studies in sorghum. For example, a SNP on chromosome 9 explained 11.1% of HT variation, which was in a range of 10% to 12% found in a population derived from a cross between grain sorghum and sweet sorghum [22], but lower than 16% to 29% identified in diverse sorghum accessions [15]. A marker causing 10.1% of TN variation on chromosome 6 was higher than the effects of two QTLs on fertile tiller number (~7.8%) but was lower than the other two QTLs on the same chromosome (~13.7%) in sorghum [58]. A SNP at S8_49724219 on chromosome 8 accounted for 9.6% variation of PL (Table 4), which was higher than the value in long-day trials (6.9%) and in short-day trials (4.0%) on the same chromosome in a RIL population of sorghum [66]. In addition, we found that a marker on chromosome 6 explained 11.5% of Brix variation, which was comparable to the previously found marker effects (~10%) on the same chromosome [22]. In addition, SNP effects accounted for 8.9% to 12.5% of RS variations on chromosomes 1 and 9, similar to those QTL effects for glucose juice (11%–12%) or within the range of QTL effects (7%–21%) on sugar yield in sorghum [22]. The different mapping panels, tested diverse environments, and marker density may lead to variations of marker effects on phenotypic traits.

4.4. Significant SNPs across Environments

Genetic signals have been identified for many phenotypic traits in sorghum through linkage mapping and/or GWAS, providing comparisons to our results. In sorghum, several studies identified a signal for HT on chromosome 9 at between 52 to 59 Mbp [19,36,52,53,54,55,56,57], while a SNP at S9_56656748 found in this study was in this genomic region noted above (Table 4, Supplemental Table S4). It demonstrated that S9_56656748 was a strong signal for controlling HT on chromosome 9. Previously, the Dw1 locus located at ~57 Mbp on chromosome 9 was detected, which positively regulates brassinosteroid signaling [32]. The SNP at S9_56656748 was not too far from the Dw1 locus, and it might be the same signal. In addition, the SNP at S9_56656748 in our study was 609 kb away from a previously identified marker on chromosome 9 that affected plant height in sorghum [15]. We also detected a signal for HT on chromosome 8 (S8_ 50424256) that was overlapped with a known QTL [70]. However, a SNP on chromosome 3 (S3_53230521) found in this study was about 1.6Mbp away from a reported QTL [63], so it could be a novel signal for controlling HT in sorghum.
We detected four SNPs (S2_63990205, S6_46267204, S8_54924780, S9_52354291) associated with TN. Of them, three SNPs were overlapped with the previously reported QTLs on chromosome 2 [58], chromosome 6 [36,55,59], and chromosome 9 [55] in sorghum, including one identified through a GWAS [36] (Table 4, Supplemental Table S4). However, a SNP at S8_54924780 on chromosome 8 did not fall into a known QTL region, and was approximately 3.4 Mbp away from a signal detected for TN though a GWAS using diverse sorghum germplasm [15]. The result suggests that S8_54924780 for TN could be a novel signal. We also confirmed that all four SNPs (S1_11646700, S2_794419, S8_ 49724219, S10_1803717) associated with PL were overlapped with regions of signals identified previously, including one on chromosome 1 and 8 by a GWAS [36], one on chromosome 2 through a QTL mapping [51] and GWAS [60], and one on chromosome 10 with a QTL mapping [61] (Table 4, Supplemental Table S4).
Three SNPs (S5_216438, S6_ 39878130, S8_40217639) were associated with Brix, and two were overlapped with known QTLs on chromosome 6 [74] and on chromosome 8 [63]. A SNP on chromosome 5 was approximately 1.0 Mbp away from a reported QTL [64], suggesting that this could be a novel signal. Among the traits, RS had the highest number of associations. Six out of ten significant SNPs were overlapped with known QTLs for RS, including four on chromosome 1 around 51 Mbp [52,64], one on chromosome 2 [52], and one on chromosome 3 [64]. Additional four SNPs were considered as novel signals, since they were distant to known QTLs, approximately 2.2 Mbp away on chromosome 2 [63], 3.0 Mbp and 8.8 Mbp on chromosome 9 [63], and 55.6 Mbp on chromosome 10 [77], respectively.

4.5. Significant SNPs for Individual Environment

In addition to a few common signals identified across environments as well as in a single environment, some unique SNPs were detected in each individual environment (Supplemental Table S4). Notably, significant associations were found for IN, SD, PW and PRO for Env 1, which were all novel signals. For example, two SNPs for SD on chromosome 4 were 36.4 Mbp and 22.8 Mbp away from a reported QTL [51], while one SNP for PRO on chromosome 2 was 17.5 Mbp away from a known signal SNP [29] and four SNPs for PRO on chromosome 7 were about 10.1 to 54.1 Mbp away from a known QTL [78]. Thirteen significant associations for PW were especially found in Env 2, and ten were considered as novel signals. These SNPs ranged from 1.5 to 53 Mbp away from known QTLs on different chromosomes in sorghum [63]. For Env 3, there were ten significant associations for HT detected on chromosome 2, 4, 5, 6 and 9, respectively. Of them, four SNPs were considered as novel signals, since they were distant to known signals on chromosome 2 found a GWAS study [34] and on chromosome 5 [79] and chromosome 9 [63] found in a QTL mapping. In addition, novel signals were also noted for PW on chromosome 2, 5 and 9 in Env 3, respectively.
Overall, some novel SNPs were identified, either across environments or in a single environment analysis. We also confirmed the previously reported QTL or SNP signals in sorghum germplasm or QTL mapping population. In this study, we used 2b-RAD genotyping method, which is proven as a simple and flexible method for genome-wide genotyping [44,45,80,81]. Given that 2b-RAD is a reduced representation sequencing approach compared to the whole genome sequence (WGS), it is expected that the number of identified SNP markers in a population panel are lower than that using WGS. This can affect mapping resolution since high density genotyping increased the precision of association mapping in the panel. Nevertheless, our results indicate robustness of some candidate SNP signals in sorghum, regardless of variation of size and nature of different populations and genotype by environment interactions.

4.6. Potential Candidate Genes

The potential candidate genes in the significant SNP regions extended to 100 kb were searched for each signal associated with the target trait. Plant height is controlled by the phytohormones gibberellins (GA), brassinosteroids (BR), and auxins and by altering the distance between internodes. Dw3, a well-known auxin transporter gene, is located on chromosome 7 with a major effect on sorghum plant height [13]. We did not detect this gene nor any signals for HT on chromosome 7. However, a SNP at S9_56656748 for HT was found approximately 386 kb from the gene underlying the Dw1 locus, a regulator of sorghum stem internode length [82]. Dw1 is a novel component of brassinosteroid signaling and acts as a positive modulator of brassinosteroid signaling [32]. However, interestingly, approximately 260 bp away from SNP S9_56656748, a gene Sb09g026370, a homolog of AT4G14430, encoding indole-3-butyric response 10 (IBA10) was identified. Since IBA10 might be involved in the conversion of indole 3-butyric acid (IBA) to indole 3-acetic acid (IAA) in Arabidopsis [83], this Sb09g026370 could be the candidate gene that regulates plant height in sorghum. Notably, gene Sb03g026400, a homolog of AT1G76190, encoding small auxin up RNAs (SAUR)-like auxin-responsive protein, was also identified corresponding to SNP S3_53230521 on chromosome 3. In Arabidopsis, overexpression of several distinct SAUR genes results in increased growth of cotyledons, hypocotyls, or roots, respectively [84], suggesting a role of this protein in promoting plant growth.
Brassinosteroids (BRs) are a class of steroidal hormones essential for plant growth and development [85]. Gene Sb10g002190, a homolog of AT5G51550 encoding exordium (EXO)-like 3 protein, was found for PL in this study. The EXO gene was identified as a potential mediator of BR-promoted growth. Expressions of EXL3 (At5g51550) and EXL5 (At2g17230) were positively correlated with EXO expression in Arabidopsis, and an exo knock-out mutant showed reduced cell size and number and plant growth [86], suggesting a role of the EXL in promoting plant growth. We also identified another candidate gene Sb02g000960, a homolog of AT1G69310 encoding WRKY57 transcription factor. In Arabidopsis, WRKY57 protein acts as a repressor in jasmonic acid-induced leaf senescence and is a common component of the jasmonic acid- and auxin-mediated signaling pathways [87]. The results indicate a role of WRKY57 in regulating plant growth.
Several genes involved in carbohydrate metabolism were noted for Brix and RS, ranging from 5.1 kb to 88 kb from the associated SNPs. Interestingly, a gene Sb02g036310 was 5.1 kb from the SNP that was associated with RS. This gene is a homolog to AT1G11260, encoding SUGAR TRANSPORTER PROTEIN 1 (STP1), a high-affinity sugar transporter that acts as an H+/monosaccharide cotransporter, capable of transporting a wide range of hexoses [88,89]. STP1 is the member of the STP family with the highest expression level [90]. Moreover, the transcript AT1G11260 was strongly regulated by sugars, depending on phosphorylated hexoses [91]. Another gene Sb09g025790 encoding trehalose-6-phosphate synthase, located 64.2 kb from the significant SNP, is a homolog to AT1G78580 (AtTPS1). In Arabidopsis, AtTPS1 with a terminal TPS domain, is involved in trehalose synthesis [92]. It seemed that Sb02g036310 and Sb09g02579 might be candidate genes mediating sugar metabolism in sorghum.

5. Conclusions

Plant phenotype is regulated by a complex network of genetic and environmental signals. The work presented here has generated new knowledge of the genetic mechanisms underlying plant architecture and agronomics traits in sorghum, sudangrass and RILs collections. Through genome-wide association analysis across environments, 24 significant SNPs were detected and associated with plant height, tiller number, panicle length, Brix and reducing sugar. A few signals have not been previously detected and were considered as novel regions for controlling various traits. Several putative candidate genes underlying the signals could be potentially the targets for further validation of their roles in affecting plant architecture and growth. The significant markers may be used for marker-assisted breeding programs aimed at improvement of improved food, feed, and biofuel productions in sorghum and related species.

Supplementary Materials

The following are available online at https://www.mdpi.com/2073-4395/10/10/1602/s1, Table S1: Information about 300 germplasm used in this study; Table S2: Soil and environmental conditions in experimental locations; Table S3: SNP genotype of the population (HapMap format); Table S4: Summary of GWAS signals correspondence with other studies.

Author Contributions

F.L. led collecting phenotypic data and preparing the manuscript; Z.P. performed genotyping and assisted in collecting phenotypic data and preparing the manuscript; X.Z. performed GWAS analysis; H.L. contributed to data interpretation; F.L. and S.S. designed the experiments; Y.J. led data analysis and writing of the manuscript. All authors have read and agreed to the published version of the manuscript.

Funding

This research was supported by the Tianjin Science and Technology Support Program of China (grant no. 16YFZCNC00630). Xiongwei Zhao was supported by China Scholarship Council (award no. 201606910017).

Acknowledgments

The authors would like to thank Xiaoqing Yu for assisting in SNP analysis. All authors have read and agreed to the published version of the manuscript.

Conflicts of Interest

The authors declare that the research was conducted in the absence of any commercial or financial relationships that could be construed as a potential conflict of interest.

References

  1. National Research Council. Lost Crops of Africa: Volume I: Grains; National Academy Press: Washington, DC, USA, 1996. [Google Scholar]
  2. Wang, D.; Bean, S.; McLaren, J.; Seib, P.; Madl, R.; Tuinstra, M.; Shi, Y.; Lenz, M.; Wu, X.; Zhao, R. Grain sorghum is a viable feedstock for ethanol production. J. Ind. Microbiol. Biotech. 2008, 35, 313–320. [Google Scholar] [CrossRef]
  3. Nuessly, G.S.; Wang, Y.; Sandhu, H.; Larsen, N.; Cherry, R.H. Entomologic and agronomic evaluations of 18 sweet sorghum cultivars for biofuel in Florida. Fla. Entomol. 2013, 96, 512–528. [Google Scholar] [CrossRef]
  4. Ekefre, D.E.; Mahapatra, A.K.; Latimore, M., Jr.; Bellmer, D.D.; Jena, U.; Whitehead, G.J.; Williams, A.L. Evaluation of three cultivars of sweet sorghum as feedstocks for ethanol production in the Southeast United States. Heliyon 2017, 3, e00490. [Google Scholar] [CrossRef] [Green Version]
  5. Zhan, Q.; Qian, Z. Heterosis utilization of hybrid between sorghum [Sorghum bicolor (L.) Moench] and sudangrass [Sorghum sudanense (Piper) Stapf]. Acta Agron. Sin. 2004, 30, 73–77. [Google Scholar]
  6. Lu, X.; Yun, J.; Gao, C.; Acharya, S. Quantitative trait loci analysis of economically important traits in Sorghum bicolor × S. sudanense hybrid. Can. J. Plant Sci. 2011, 9, 81–90. [Google Scholar]
  7. Venuto, B.; Kindiger, B. Forage and biomass feedstock production from hybrid forage sorghum and sorghum–sudangrass hybrids. Grassland Sci. 2008, 54, 189–196. [Google Scholar] [CrossRef]
  8. Mace, E.S.; Singh, V.; Van Oosterom, E.J.; Hammer, G.L.; Hunt, C.H.; Jordan, D.R. QTL for nodal root angle in sorghum (Sorghum bicolor L. Moench) co-locate with QTL for traits associated with drought adaptation. Theor. Appl. Genet. 2012, 124, 97–109. [Google Scholar] [CrossRef] [Green Version]
  9. Upadhyaya, H.D.; Wang, Y.; Sastry, D.V.; Dwivedi, S.L.; Prasad, P.V.; Burrell, A.M.; Klein, R.R.; Morris, G.P.; Klein, P.E. Association mapping of germinability and seedling vigor in sorghum under controlled low-temperature conditions. Genome 2016, 59, 137–145. [Google Scholar] [CrossRef]
  10. Ortiz, D.; Hu, J.; Salas Fernandez, M.G. Genetic architecture of photosynthesis in Sorghum bicolor under non-stress and cold stress conditions. J. Exp. Bot. 2017, 68, 4545–4557. [Google Scholar] [CrossRef]
  11. Zhu, C.; Gore, M.; Buckler, E.S.; Yu, J. Status and prospects of association mapping in plants. Plant Genome 2008, 1, 5. [Google Scholar] [CrossRef]
  12. Morris, G.P.; Ramu, P.; Deshpande, S.P.; Hash, C.T.; Shah, T.; Upadhyaya, H.D.; Riera-Lizarazu, O.; Brown, P.J.; Acharya, C.B.; Mitchell, S.E.; et al. Population genomic and genome-wide association studies of agroclimatic traits in sorghum. Proc. Natl. Acad. Sci. USA 2013, 110, 453–458. [Google Scholar] [CrossRef] [Green Version]
  13. Li, X.; Li, X.; Fridman, E.; Tesso, T.T.; Yu, J. Dissecting repulsion linkage in the dwarfing gene Dw3 region for sorghum plant height provides insights into heterosis. Proc. Natl. Acad. Sci. USA 2015, 112, 11823–11828. [Google Scholar] [CrossRef] [Green Version]
  14. Lasky, J.R.; Upadhyaya, H.D.; Ramu, P.; Deshpande, S.; Hash, C.T.; Bonnette, J.; Juenger, T.E.; Hyma, K.; Acharya, C.; Mitchell, S.E.; et al. Genome-environment associations in sorghum landraces predict adaptive traits. Sci. Adv. 2015, 1, e1400218. [Google Scholar] [CrossRef] [Green Version]
  15. Zhao, J.; Mantilla Perez, M.B.; Hu, J.; Salas Fernandez, M.G. Genome-wide association study for nine plant architecture traits in sorghum. Plant Genome 2016, 9, 2. [Google Scholar] [CrossRef] [Green Version]
  16. Hu, Z.; Olatoye, M.O.; Marla, S.; Morris, G.P. An integrated genotyping-by-sequencing polymorphism map for over 10,000 sorghum Genotypes. Plant Genome 2019, 12, 180044. [Google Scholar] [CrossRef] [Green Version]
  17. Zhou, Y.; Srinivasan, S.; Mirnezami, S.V.; Kusmec, A.; Fu, Q.; Attigala, L.; Fernandez, M.G.S.; Ganapathysubramanian, B.; Schnable, P.S. Semiautomated feature extraction from RGB images for sorghum panicle architecture GWAS. Plant Physiol. 2019, 179, 24–37. [Google Scholar] [CrossRef] [Green Version]
  18. Rhodes, D.H.; Hoffmann, L., Jr.; Rooney, W.L.; Ramu, P.; Morris, G.P.; Kresovich, S. Genome-wide association study of grain polyphenol concentrations in global sorghum [Sorghum bicolor (L.) Moench] germplasm. J. Agric. Food Chem. 2014, 62, 10916–10927. [Google Scholar] [CrossRef]
  19. Boyles, R.E.; Pfeiffer, B.K.; Cooper, E.A.; Rauh, B.L.; Zielinski, K.J.; Myers, M.T.; Brenton, Z.; Rooney, W.L.; Kresovich, S. Genetic dissection of sorghum grain quality traits using diverse and segregating populations. Theor. Appl. Genet. 2017, 130, 697–716. [Google Scholar] [CrossRef] [Green Version]
  20. Chopra, R.; Burow, G.; Burke, J.J.; Gladman, N.; Xin, Z. Genome-wide association analysis of seedling traits in diverse Sorghum germplasm under thermal stress. BMC Plant Biol. 2017, 17, 12. [Google Scholar] [CrossRef] [Green Version]
  21. Li, J.; Tang, W.; Zhang, Y.-W.; Chen, K.-N.; Wang, C.; Liu, Y.; Zhan, Q.; Wang, C.; Wang, S.-B.; Xie, S.-Q.; et al. Genome-wide association studies for five forage quality-related traits in sorghum (Sorghum bicolor L.). Front. Plant Sci. 2018, 9, 1146. [Google Scholar] [CrossRef]
  22. Murray, S.C.; Sharma, A.; Rooney, W.L.; Klein, P.E.; Mullet, J.E.; Mitchell, S.E.; Kresovich, S. Genetic improvement of sorghum as a biofuel feedstock: I. QTL for stem sugar and grain nonstructural carbohydrates. Crop Sci. 2008, 48, 2165–2179. [Google Scholar] [CrossRef]
  23. Murray, S.C.; Rooney, W.L.; Hamblin, M.T.; Mitchell, S.E.; Kresovich, S. Sweet sorghum genetic diversity and association mapping for Brix and height. Plant Genome 2009, 2, 48. [Google Scholar] [CrossRef] [Green Version]
  24. Lv, P.; Ji, G.; Han, Y.; Hou, S.; Li, S.; Ma, X.; Du, R.; Liu, G. Association analysis of sugar yield-related traits in sorghum [Sorghum bicolor (L.)]. Euphytica 2013, 193, 419–431. [Google Scholar] [CrossRef]
  25. Burks, P.S.; Kaiser, C.M.; Hawkins, E.M.; Brown, P.K. Genome wide association for sugar yield in sweet sorghum. Crop Sci. 2015, 55, 2138–2148. [Google Scholar] [CrossRef] [Green Version]
  26. Disasa, T.; Feyissa, T.; Admassu, B.; Fetene, M.; Mendu, V. Mapping of QTLs associated with brix and biomass-related traits in sorghum using SSR markers. Sugar Tech. 2018, 20, 275–285. [Google Scholar] [CrossRef]
  27. Morris, G.P.; Rhodes, D.H.; Brenton, Z.; Ramu, P.; Thayil, V.M.; Deshpande, S.; Hash, C.T.; Acharya, C.; Mitchell, S.E.; Buckler, E.S.; et al. Dissecting genome-wide association signals for loss-of-function phenotypes in sorghum flavonoid pigmentation traits. G3 (Bethesda) 2013, 3, 2085–2094. [Google Scholar] [CrossRef] [PubMed] [Green Version]
  28. Brenton, Z.W.; Cooper, E.A.; Myers, M.T.; Boyles, R.E.; Shakoor, N.; Zielinski, K.J.; Rauh, B.L.; Bridges, W.C.; Morris, G.F.; Kresovich, S. Genomic resource for the development, improvement, and exploitation of sorghum for bioenergy. Genetics 2016, 204, 21–33. [Google Scholar] [CrossRef] [PubMed]
  29. Rhodes, D.H.; Hoffmann, L., Jr.; Rooney, W.L.; Herald, T.J.; Bean, S.; Boyles, R.; Brenton, Z.W.; Kresovich, S. Genetic architecture of kernel composition in global sorghum germplasm. BMC Genom. 2017, 18, 15. [Google Scholar] [CrossRef] [Green Version]
  30. Brown, P.J.; Rooney, W.L.; Franks, C.; Kresovich, S. Efficient mapping of plant height quantitative trait loci in a sorghum association population with introgressed dwarfing genes. Genetics 2008, 180, 629–637. [Google Scholar] [CrossRef] [Green Version]
  31. Nagaraja Reddy, R.; Madhusudhana, R.; Murali Mohan, S.; Chakravarthi, D.V.N.; Mehtre, S.P.; Seetharama, N.; Patil, J.V. Mapping QTL for grain yield and other agronomic traits in post-rainy sorghum [Sorghum bicolor (L.) Moench]. Theor. Appl. Genet. 2013, 126, 1921–1939. [Google Scholar] [CrossRef]
  32. Hirano, K.; Kawamura, M.; Araki-Nakamura, S.; Fujimoto, S.; Ohmae-Shinohara, K.; Yamaguchi, M.; Fujii, A.; Sasaki, H.; Kasuga, S.; Sazuka, T. Sorghum DW1 positively regulates brassinosteroid signaling by inhibiting the nuclear localization of BRASSINOSTEROID INSENSITIVE 2. Sci. Rep. 2017, 7, 126. [Google Scholar] [CrossRef]
  33. Hilley, J.L.; Weers, B.D.; Truong, S.K.; McCormick, R.F.; Mattison, A.J.; McKinley, B.A.; Morishige, D.T.; Mullet, J.E. Sorghum Dw2 encodes a protein kinase regulator of stem internode length. Sci. Rep. 2017, 7, 4616. [Google Scholar] [CrossRef] [Green Version]
  34. Bouchet, S.; Olatoye, M.O.; Marla, S.R.; Perumal, R.; Tesso, T.; Yu, J.; Tuinstra, M.; Morris, G.P. Increased power to dissect adaptive traits in global sorghum diversity using a nested association mapping population. Genetics 2017, 206, 573–585. [Google Scholar] [CrossRef] [PubMed] [Green Version]
  35. Kong, W.; Kim, C.; Zhang, D.; Guo, H.; Tan, X.; Jin, H.; Zhou, C.; Shuang, L.-S.; Goff, V.; Sezen, U.; et al. Genotyping by sequencing of 393 Sorghum bicolor BTx623 × IS3620C recombinant inbred lines improves sensitivity and resolution of QTL detection. G3 2018, 8, 2563–2572. [Google Scholar] [CrossRef] [PubMed] [Green Version]
  36. Zhang, D.; Kong, W.; Robertson, J.; Goff, V.H.; Epps, E.; Kerr, A.; Mills, G.; Cromwell, J.; Lugin, Y.; Phillips, C.; et al. Genetic analysis of inflorescence and plant height components in sorghum (Panicoidae) and comparative genetics with rice (Oryzoidae). BMC Plant Biol. 2015, 15, 107. [Google Scholar] [CrossRef] [PubMed] [Green Version]
  37. Quinby, J.R.; Karper, R.E. Inheritance of height in sorghum. Agron. J. 1954, 46, 211–216. [Google Scholar] [CrossRef]
  38. Multani, D.S.; Briggs, S.P.; Chamberlin, M.A.; Blakeslee, J.J.; Murphy, A.S.; Johal, G.S. Loss of an MDR transporter in compact stalks of maize br2 and sorghum Dw3 mutants. Science 2003, 302, 81–84. [Google Scholar] [CrossRef] [PubMed]
  39. Zhang, Y.; Yu, C.; Lin, J.; Liu, J.; Liu, B.; Wang, J.; Huang, A.; Li, H.; Zhao, T. OsMPH1 regulates plant height and improves grain yield in rice. PLoS ONE 2017, 12, e0180825. [Google Scholar] [CrossRef] [Green Version]
  40. Anami, S.E.; Zhang, L.-M.; Xia, Y.; Zhang, Y.-M.; Liu, Z.-Q.; Jing, H.-C. Sweet sorghum ideotypes: Genetic improvement of the biofuel syndrome. Food Energy Secur. 2015, 4, 159–177. [Google Scholar] [CrossRef] [Green Version]
  41. Boyles, R.E.; Brenton, Z.W.; Kresovich, S. Genetic and genomic resources of sorghum to connect genotype with phenotype in contrasting environments. Plant J. 2019, 97, 19–39. [Google Scholar] [CrossRef] [Green Version]
  42. Sukumaran, S.; Li, X.; Li, X.; Zhu, C.; Bai, G.; Perumal, R.; Tuinstra, M.R.; Prasad, P.V.V.; Mitchell, S.E.; Tesso, T.T.; et al. QTL mapping for grain yield, flowering time, and stay-green traits in sorghum with genotyping-by-sequencing markers. Crop Sci. 2016, 56, 1429–1442. [Google Scholar] [CrossRef]
  43. SAS Institute Inc. SAS Procedures Guide; Release 9.1 Edn.; SAS Institute: Cary, NC, USA, 2014. [Google Scholar]
  44. Wang, S.; Meyer, E.; McKay, J.K.; Matz, M.V. 2b-RAD: A simple and flexible method for genome-wide genotyping. Nat. Methods 2012, 9, 808–810. [Google Scholar] [CrossRef] [PubMed]
  45. Fu, X.; Dou, J.; Mao, J.; Su, H.; Jiao, W.; Zhang, L.; Hu, X.; Huang, X.; Wang, S.; Bao, Z. RADtyping: An integrated package for accurate De Novo codominant and dominant rad genotyping in mapping populations. PLoS ONE 2013, 8, e79960. [Google Scholar] [CrossRef] [Green Version]
  46. Li, R.; Yu, C.; Li, Y.; Lam, T.W.; Yiu, S.M.; Kristiansen, K.; Wang, J. SOAP2: An improved ultrafast tool for short read alignment. Bioinformatics 2009, 25, 1966–1967. [Google Scholar] [CrossRef] [Green Version]
  47. Pritchard, J.K.; Stephens, M.; Donnelly, P. Inference of population structure using multilocus genotype data. Genetics 2000, 155, 945–959. [Google Scholar]
  48. Wang, M.; Zhu, C.; Barkley, N.A.; Chen, Z.; Erpelding, J.E.; Murray, S.C.; Tuinstra, M.R.; Tesso, T.; Pederson, G.A.; Yu, J. Genetic diversity and population structure analysis of accessions in the US historic sweet sorghum collection. Theor. Appl. Genet. 2009, 120, 13–23. [Google Scholar] [CrossRef]
  49. Bradbury, P.J.; Zhang, Z.; Kroon, D.E.; Casstevens, T.M.; Ramdoss, Y.; Buckler, E.S. TASSEL: Software for association mapping of complex traits in diverse samples. Bioinformatics 2007, 23, 2633–2635. [Google Scholar] [CrossRef]
  50. Mace, E.S.; Innes, D.; Hunt, C.; Wang, X.; Tao, Y.; Baxter, J.; Hassall, M.; Hathorn, A.; Jordan, D.R. The Sorghum QTL Atlas: A powerful tool for trait dissection, comparative genomics and crop improvement. Theor. Appl. Genet. 2019, 132, 751–766. [Google Scholar] [CrossRef] [PubMed]
  51. Shehzad, T.; Okuno, K. QTL mapping for yield and yield-contributing traits in sorghum (Sorghum bicolor (L.) Moench) with genome-based SSR markers. Euphytica 2015, 203, 17–31. [Google Scholar] [CrossRef]
  52. Felderhoff, T.J.; Murray, S.C.; Klein, P.E.; Sharma, A.; Hamblin, M.T.; Kresovich, S.; Vermerris, W.; Rooney, W.L. QTLs for energy-related traits in a sweet × grain sorghum Sorghum bicolor (L.) Moench mapping population. Crop Sci. 2012, 52, 2040–2049. [Google Scholar] [CrossRef]
  53. Lin, Y.R.; Schertz, K.F.; Paterson, A.H. Comparative analysis of QTLs affecting plant height and maturity across the Poaceae, in reference to an interspecific sorghum population. Genetics 1995, 141, 391–411. [Google Scholar] [PubMed]
  54. Kajiya-Kanegae, H.; Takanashi, H.; Fujimoto, M.; Ishimori, M.; Ohnishi, N.; Fiona, W.W.; Omollo, E.A.; Kobayashi, M.; Yano, K.; Nakano, M.; et al. RAD-seq-based high-density linkage map construction and QTL mapping of biomass-related traits in sorghum using a Japanese landrace Takakibi NOG. Plant Cell Physiol. 2020, 61, 1262–1272. [Google Scholar] [CrossRef] [PubMed]
  55. Feltus, F.A.; Hart, G.E.; Schertz, K.F.; Casa, A.M.; Kresovich, S.; Abraham, S.; Klein, P.E.; Brown, P.J.; Paterson, A.H. Alignment of genetic maps and QTLs between inter- and intra-specific sorghum populations. Theor. Appl. Genet. 2006, 112, 1295. [Google Scholar] [CrossRef]
  56. Takai, T.; Yonemaru, J.-I.; Kaidai, H.; Kasuga, S. Quantitative trait locus analysis for days-to-heading and morphological traits in an RIL population derived from an extremely late flowering F1 hybrid of sorghum. Euphytica 2012, 187, 411–420. [Google Scholar] [CrossRef]
  57. Wang, X.; Mace, E.; Hunt, C.; Cruickshank, A.; Henzell, R.F.; Parkes, H.; Jordan, D. Two distinct classes of QTL determine rust resistance in sorghum. BMC Plant Biol. 2014, 14, 366. [Google Scholar] [CrossRef] [Green Version]
  58. Alam, M.M.; Mace, E.S.; Van Oosterom, E.J.; Cruickshank, A.; Hunt, C.H.; Hammer, G.L.; Jordan, D.R. QTL analysis in multiple sorghum populations facilitates the dissection of the genetic and physiological control of tillering. Theor. Appl. Genet. 2014, 127, 2253–2266. [Google Scholar] [CrossRef] [Green Version]
  59. Paterson, A.H.; Schertz, K.F.; Lin, Y.; Liu, S.; Chang, Y. The weediness of wild plants: Molecular analysis of genes influencing dispersal and persistence of johnsongrass, Sorghum halepense (L.) Pers. Proc. Natl. Acad. Sci. USA 1995, 92, 6127–6131. [Google Scholar] [CrossRef] [Green Version]
  60. Witt Hmon, K.P.; Shehzad, T.; Okuno, K. QTLs underlying inflorescence architecture in sorghum (Sorghum bicolor (L.) Moench) as detected by association analysis. Genet. Resour. Crop Evol. 2014, 61, 1545–1564. [Google Scholar] [CrossRef]
  61. Hart, G.; Schertz, K.; Peng, Y.; Syed, N.H. Genetic mapping of Sorghum bicolor (L.) Moench QTLs that control variation in tillering and other morphological characters. Theor. Appl. Genet. 2001, 103, 1232–1242. [Google Scholar] [CrossRef]
  62. Bai, C.; Wang, C.; Wang, P.; Zhu, Z.; Cong, L.; Li, D.; Liu, Y.; Zheng, W.; Lu, X. QTL mapping of agronomically important traits in sorghum (Sorghum bicolor L.). Euphytica 2017, 213, 285. [Google Scholar] [CrossRef]
  63. Shiringani, A.L.; Frisch, M.; Friedt, W. Genetic mapping of QTLs for sugar-related traits in a RIL population of Sorghum bicolor L. Moench. Theor. Appl. Genet. 2010, 121, 323–336. [Google Scholar] [CrossRef] [PubMed]
  64. Ritter, K.B.; Jordan, D.R.; Chapman, S.C.; Godwin, I.D.; Mace, E.S.; McIntyre, C.L. Identification of QTL for sugar-related traits in a sweet × grain sorghum (Sorghum bicolor L. Moench) recombinant inbred population. Mol. Breed. 2008, 22, 367–384. [Google Scholar] [CrossRef]
  65. Wang, H.-L.; Zhang, H.-W.; Du, R.-H.; Chen, G.-L.; Liu, B.; Yang, Y.-B.; Qin, L.; Cheng, E.-Y.; Liu, Q.; Guanet, Y.-A. Identification and validation of QTLs controlling multiple traits in sorghum. Crop Pasture Sci. 2016, 67, 193–203. [Google Scholar] [CrossRef]
  66. Zou, G.; Zhai, G.; Feng, Q.; Yan, S.; Wang, A.; Zhao, Q.; Shao, J.; Zhang, Z.; Zou, J.; Han, B.; et al. Identification of QTLs for eight agronomically important traits using an ultra-high-density map based on SNPs generated from high-throughput sequencing in sorghum under contrasting photoperiods. J. Exp. Bot. 2012, 63, 5451–5462. [Google Scholar] [CrossRef] [Green Version]
  67. Sinha, S.; Kumaravadivel, N. Understanding genetic diversity of sorghum using quantitative traits. Scientifica 2016, 2016, 3075023. [Google Scholar] [CrossRef] [Green Version]
  68. Liu, Y.; Wang, L.; Li, J.; Zhan, Q.; Zhang, Q.; Li, J.; Fan, F. QTL mapping of forage yield and forage yield component traits in Sorghum bicolor × S. Sudanense. Genet. Mol. Res. 2015, 14, 3854–3861. [Google Scholar] [CrossRef]
  69. Guan, Y.-A.; Wang, H.-L.; Qin, L.; Zhang, H.-W.; Yang, Y.-B.; Gao, F.-J.; Li, R.-Y.; Wang, H.-G. QTL mapping of bio-energy related traits in Sorghum. Euphytica 2011, 182, 431–440. [Google Scholar] [CrossRef]
  70. Shukla, S.; Felderhoff, T.J.; Saballos, A.; Vermerris, W. The relationship between plant height and sugar accumulation in the stems of sweet sorghum (Sorghum bicolor (L.) Moench). Field Crop Res. 2017, 203, 181–191. [Google Scholar] [CrossRef]
  71. Wang, H.; Wang, R.; Liu, B.; Yang, Y.; Qin, L.; Chen, E.; Zhang, H.; Guan, Y. QTL analysis of salt tolerance in Sorghum bicolor during whole-plant growth stages. Plant Breed. 2020, 139, 455–465. [Google Scholar] [CrossRef] [Green Version]
  72. Flint-Garcia, S.A.; Thornsberry, J.M.; Buckler, E.S. Structure of linkage disequilibrium in plants. Annu. Rev. Plant Biol. 2003, 54, 357–374. [Google Scholar] [CrossRef] [Green Version]
  73. Hamblin, M.T.; Salas Fernandez, M.G.; Casa, A.M.; Mitchell, S.E.; Paterson, A.H.; Kresovich, S. Equilibrium processes cannot explain high levels of short- and medium-range linkage disequilibrium in the domesticated grass Sorghum bicolor. Genetics 2005, 171, 1247–1256. [Google Scholar] [CrossRef] [Green Version]
  74. Wang, Y.-H.; Upadhyaya, H.D.; Burrell, A.M.; Sahraeian, S.M.E.; Klein, R.R.; Klein, P.E. Genetic structure and linkage disequilibrium in a diverse, representative collection of the C4 model plant, Sorghum bicolor. G3 2013, 3, 783–793. [Google Scholar] [CrossRef] [PubMed] [Green Version]
  75. Bouchet, S.; Pot, D.; Deu, M.; Rami, J.-F.; Billot, C.; Perrier, X.; Rivallan, R.; Gardes, L.; Xia, L.; Wenzl, P.; et al. Genetic structure, linkage disequilibrium and signature of selection in sorghum: Lessons from physically anchored dart markers. PLoS ONE 2012, 7, e33470. [Google Scholar] [CrossRef] [Green Version]
  76. Marla, S.R.; Burow, G.; Chopra, R.; Hayes, C.; Olatoye, M.O.; Felderhoff, T.; Hu, Z.; Raymundo, R.; Perumal, R.; Morris, G.P. Genetic architecture of chilling tolerance in sorghum dissected with a nested association mapping population. G3 (Bethesda) 2019, 9, 4045–4057. [Google Scholar] [CrossRef] [PubMed] [Green Version]
  77. Wang, Y.; Acharya, A.; Burrell, A.M.; Klein, R.R.; Klein, P.E.; Hasenstein, K.H. Mapping and candidate genes associated with saccharification yield in sorghum. Genome 2013, 56, 659–665. [Google Scholar] [CrossRef] [PubMed]
  78. Murray, S.C.; Rooney, R.L.; Mitchell, S.E.; Sharma, A.; Klein, P.E.; Mullet, J.E.; Kresovich, S. Genetic improvement of sorghum as a biofuel feedstock: II. QTL for stem and leaf structural carbohydrates. Crop Sci. 2008, 48, 2180–2193. [Google Scholar] [CrossRef]
  79. Zhang, H.; Wang, R.; Liu, B.; Chen, E.; Yang, Y.; Qin, L.; Li, F.; Gao, F.; Cao, P.; Wang, H.; et al. Inclusive composite-interval mapping reveals quantitative trait loci for plant architectural traits in sorghum (Sorghum bicolor). Crop Pasture Sci. 2019, 70, 659–668. [Google Scholar] [CrossRef]
  80. Guo, Y.; Yuan, H.; Fang, D.; Song, L.; Liu, Y.; Liu, Y.; Wu, L.; Yu, J.; Li, Z.; Xu, X.; et al. An improved 2b-RAD approach (I2b-RAD) offering genotyping tested by a rice (Oryza sativa L.) F2 population. BMC Genom. 2014, 15, 956. [Google Scholar] [CrossRef] [Green Version]
  81. Xu, L.-Y.; Wang, L.Y.; Wei, K.; Tan, L.-Q.; Su, J.-J.; Cheng, H. High-density SNP linkage map construction and QTL mapping for flavonoid-related traits in a tea plant (Camellia sinensis) using 2b-RAD sequencing. BMC Genom. 2018, 19, 955. [Google Scholar] [CrossRef] [Green Version]
  82. Hilley, J.; Truong, S.; Olson, S.; Morishige, D.; Mullet, J. Identification of Dw1, a regulator of sorghum stem internode length. PLoS ONE 2016, 11, e0151271. [Google Scholar] [CrossRef] [Green Version]
  83. Strader, L.C.; Culler, A.H.; Cohen, J.D.; Bartel, B. Conversion of endogenous indole-3-butyric acid to indole-3-acetic acid drives cell expansion in Arabidopsis seedlings. Plant Physiol. 2010, 153, 1577–1586. [Google Scholar] [CrossRef] [PubMed] [Green Version]
  84. Sun, N.; Wang, J.; Gao, Z.; Dong, J.; He, H.; Terzaghi, W.; Wei, N.; Deng, X.; Chen, H. Arabidopsis SAURs are critical for differential light regulation of the development of various organs. Proc. Natl. Acad. Sci. USA 2016, 113, 6071–6076. [Google Scholar] [CrossRef] [PubMed] [Green Version]
  85. Li, J.; Nagpal, P.; Vitart, V.; McMorris, T.C.; Chory, J. A role for brassinosteroids in light-dependent development of Arabidopsis. Science 1996, 272, 398–401. [Google Scholar] [CrossRef]
  86. Schröder, F.; Lisso, J.; Lange, P.; Müssig, C. The extracellular EXO protein mediates cell expansion in Arabidopsis leaves. BMC Plant Biol. 2009, 9, 20. [Google Scholar] [CrossRef] [PubMed] [Green Version]
  87. Jiang, Y.; Liang, G.; Yang, S.; Yu, D. Arabidopsis WRKY57 functions as a node of convergence for jasmonic acid– and auxin-mediated signaling in jasmonic acid–induced leaf senescence. Plant Cell. 2014, 26, 230–245. [Google Scholar] [CrossRef] [PubMed] [Green Version]
  88. Boorer, K.J.; Loo, D.D.; Wright, E.M. Steady-state and presteady-state kinetics of the H+/hexose cotransporter (STP1) from Arabidopsis thaliana expressed in Xenopus oocytes. J. Biol. Chem. 1994, 269, 20417–20424. [Google Scholar]
  89. Büttner, M.; Sauer, N. Monosaccharide transporters in plants: Structure, function and physiology. Biochim. Biophys. Acta 2000, 1465, 263–274. [Google Scholar] [CrossRef] [Green Version]
  90. Johnson, D.A.; Thomas, M.A. The monosaccharide transporter gene family in Arabidopsis and rice: A history of duplications, adaptive evolution, and functional divergence. Mol. Biol. Evol. 2007, 24, 2412–2423. [Google Scholar] [CrossRef]
  91. Cordoba, E.; Aceves-Zamudio, D.L.; Hernández-Bernal, A.F.; Ramos-Vega, M.; León, P. Sugar regulation of SUGAR TRANSPORTER PROTEIN 1 (STP1) expression in Arabidopsis thaliana. J. Exp. Bot. 2015, 66, 147–159. [Google Scholar] [CrossRef] [Green Version]
  92. Blázquez, M.A.; Santos, E.; Flores, C.L.; Martínez-Zapater, J.M.; Salinas, J.; Gancedo, C. Isolation and molecular characterization of the Arabidopsis TPS1 gene, encoding trehalose-6-phosphate synthase. Plant J. 1998, 13, 685–689. [Google Scholar] [CrossRef]
Figure 1. An estimated logarithm probability of the data likelihoods LnP(D) and magnitude of Δk for each K value in the population (A). LnP(D), the log probability of the data. K means subpopulations. Δk, delta K. Population structure results with three defined subpopulations (K = 3) (B). Numbers on X-axis represent germplasm and numbers on the y-axis indicate the membership coefficient for each germplasm line. The three clusters: G1 = red, G2 = green, G3 = blue. Accessions with the same color belong to the same group. G1 mainly contains sweet sorghum and sudangrass; G2 consists of sweet sorghum, sudangrass, sudangrass inbred lines and sweet sorghum inbred lines, and G3 mainly includes sweet sorghum and grain sorghum.
Agronomy 10 01602 g001
Figure 2. Principal component analysis (PCA) of 250 diverse accessions (A). PC1, the first principal component; PC2, the second principal component. Distribution of pairwise relative kinship estimates in the population panel (B). The peak around zero indicates no relationship. Genome-wide linkage disequilibrium (LD) decay (C). The generated r2 value averaged with each 50 kb was plotted against the physical distance among each pair of significant single nucleotide polymorphisms (SNPs). LD decay was calculated using all 300 samples (red), 250 diverse lines (green), and 50 recombinant inbred lines (RILs) (blue).
Agronomy 10 01602 g002
Figure 3. Quantile-quantile (QQ) plots for model comparisons with plant height (HT), tiller number (TN), internode number (IN), stem diameter (SD), panicle length (PL), panicle weight (PW), reducing sugar (RS), Brix, and protein concentration (PRO). The solid diagonal lines represent agreement between the observed and expected −log10 (p) for marker-trait associations. Colored lines represent agreement between the observed and expected −log10 (p) value for gene-trait associations analyzed with simple (S), population structure (Q), relative kinship (K), and Q + K implemented models, respectively.
Agronomy 10 01602 g003
Figure 4. Manhattan plot of genome-wide association analysis of plant height (HT), tiller number (TN), internode number (IN), panicle length (PL), panicle weight (PW), reducing sugar (RS), and Brix. Lines indicate threshold for significant single nucleotide polymorphisms (SNPs). The x-axis indicates the physical position of the SNPs on the ten sorghum chromosomes.
Agronomy 10 01602 g004
Table 1. The minimum (Min), maximum (Max), mean values, heritability and analysis of variance of plant height (HT), tiller number (TN), internode number (IN), stem diameter (SD), panicle length (PL), panicle weight (PW), reducing sugar (RS), Brix and protein (PRO) in the population across three environments.
TraitMinMaxMeanHeritabilityGenotype (G)Environment (E)G × E
HT (cm)83.3355.7235.30.92*********
TN (number)0.676.442.710.89********
IN (number)7.0013.410.30.84********
SD (cm)0.682.741.560.86*******
PL (cm)14.042.426.20.80*********
PW (g)17.0125.057.30.54*********
RS (g/L)0.141.210.410.76********
Brix (%)6.7022.414.10.73*********
PRO (%)2.797.994.940.52*********
*, **, and *** represent significance at 0.05, 0.01, and 0.001, respectively. NS, not significant.
Table 2. Pearson correlation coefficients among plant height (HT), tiller number (TN), internode number (IN), stem diameter (SD), panicle length (PL), panicle weight (PW), reducing sugar (RS), Brix, and protein (PRO) in the population cross three environments.
HTTNINSDPLPWRSBrixPRO
HT
TN0.43 ***
IN0.21 ***−0.53 ***
SD−0.59 ***−0.82 ***0.52 ***
PL−0.080.33 ***−0.38 ***−0.14 *
PW−0.26 ***−0.50 ***0.31 ***0.53 ***0.04
RS0.48 ***−0.0040.35 ***−0.12 *−0.35 ***−0.09
Brix0.52 ***−0.15 *0.59 ***0.03−0.45 ***−0.070.54 ***
PRO−0.73 ***−0.46 ***0.030.58 ***−0.0020.14 *−0.38 ***−0.27 ***
*, *** indicates significance at 0.05 and 0001, respectively.
Table 3. Three population structure groups differing in plant height (HT), tiller number (TN), internode number (IN), stem diameter (SD), panicle length (PL), panicle weight (PW), reducing sugar (RS), Brix, and protein (PRO) in the population across three environments.
GroupHT (cm)TNINSD (cm)PL (cm)PW (g)RS (g/L)Brix (%) PRO (%)
1238.8 ab2.4 b10.6 b1.6 b25.4 b66.2 a0.42 a14.3 b5.0 a
2250.4 a3.9 a9.1 c1.2 c 28.7 a47.9 c0.35 b12.1 c4.5 b
3223.0 b2.1 c11.1 a1.8 a25.0 b58.5 b0.45 a15.2 a5.2 a
Means followed by the same letter or not followed by any letter within a column for a given treatment were not significantly different at p < 0.05.
Table 4. Significant associations of single nucleotide polymorphism (SNP) with traits of plant height (HT), tiller number (TN), panicle length (PL), Brix, and reducing sugar (RS) in the population across three environments.
TraitsSNP PositionChromosome p-valuesR2 (%)Comments
HT5323052135.11 × 10−69.5Novel region
5042425683.77 × 10−69.0Overlap [51]
5665674891.78 × 10−711.3Overlap [19,36,52,53,54,55,56,57]
TN6399020522.68 × 10−69.1Overlap [58]
4626720463.61 × 10−710.1Overlap [36,55,59]
5492478081.07 × 10−69.4Novel region
5235429195.51 × 10−68.7Overlap [55]
PL1164670611.26 × 10−813.2Overlap [36]
79441926.11 × 10−68.5Overlap [51,60]
4972421983.83 × 10−69.6Overlap [36]
1803717105.63 × 10−710.3Overlap [61]
Brix 21643858.12 × 10−711.2Novel region
3987813063.56 × 10−711.5Overlap [62]
4021763986.02 × 10−68.9Overlap [63]
RS5033853613.35 × 10−610.7Overlap [52,64]
5094957213.86 × 10−68.9Overlap [52,64]
5145662713.89 × 10−68.9Overlap [52,64]
5172945615.08 × 10−69.9Overlap [52,64]
6596321323.43 × 10−69.5Overlap [63]
7072565521.24 × 10−69.8Novel region
2042400535.49 × 10−68.7Overlap [64]
8360595.60 × 10−68.9Novel region
4366245491.14 × 10−712.5Novel region
57577048101.82 × 10−610.3Novel region
GWAS was also analyzed with phenotypic data from individual environment (Env). There were 19, 21, and 26 significant SNPs associated with various traits for Env 1, Env 2, Env3, respectively (Supplemental Table S4). Of them, 16 SNPs were considered as novel markers for Env 1, 12 for Env 2, and 10 for Env 3 (Supplemental Table S4). Among the total 66 significant SNPs, 14 markers were also detected in the analysis across three environments, including three (HT, TN, and RS) for Env 1, four (two TN and two PL) for Env 2, and seven (HT, Brix, five RS) for Env 3. GWAS produced no associations of IN, PW, and RPO across three environments, but significant SNPs for these traits were shown on at least one of the single environment (Supplemental Table S4).
Table 5. The potential candidate genes identified corresponding to the significant single nucleotide polymorphism (SNP) associated with traits of plant height (HT), tiller number (TN), panicle length (PL), Brix, and reducing sugar (RS) in the population across three environments.
TraitSNPGene ID (V1.4)Distance to peak SNP (kb)Homolog to A. thalianaEncoding ProteinFunction/Biological ProcessGene ID (V3.1)
HTS3-53230521Sb03g02640040.1AT1G76190SAUR-like auxin-responsive proteinResponsive to auxinSobic.003G202000
S8-50424256Sb08g01960041.2AT2G25760Protein kinaseProtein binding Sobic.008G146100
S9-56656748Sb09g0263700.26AT4G14430Indole-3-butyric acid response 10Auxin metabolism Sobic.009G207100
TNS2-63990205Sb02g0288703.7AT2G24430NAC domain containing protein 38Transcription factorSobic.002G253000
S6-46267204Sb06g0171000.47AT2G01170Bidirectional amino acid transporter 1Amino acid transportSobic.006G084600
S8-54924780Sb08g02279033.4AT5G49660Receptor protein-tyrosine kinaseGrowth and development Sobic.008G186400
S9-52354291Sb09g02266072.5AT2G28710C2H2 zinc finger protein Transcription factorSobic.009G164600
PLS1-11646700Sb01g0126600.38AT1G67580Protein kinase family proteinSignal transductionSobic.001G145100
S2-794419Sb02g0009600.69AT1G69310WRKY57Hormone signaling Sobic.002G008600
S8-49724219Sb08g01914059.4AT5G19960RNA binding protein Growth and developmentSobic.008G140700
S10-1803717Sb10g00219052.3AT5G51550Exordium-like 3Brassinosteroid regulatory Sobic.010G023400
BrixS5-216438Sb05g00033076.9AT2G35800Mitochondrial substrate carrier proteinSubstrates transport Sobic.005G001700
S6-39878130Sb06g01437094.5AT2G33490Hydroxyproline-rich glycoprotein proteinCell wall composition Sobic.006G055400
S8-40217639Sb08g0153009.6AT4G18750Pentatricopeptide protein Growth and developmentSobic.008G100400
RSS1-50338536Sb01g02879088.0AT2G44730MYB transcription factorAlcohol dehydrogenaseSobic.001G294700
S1-50949572Sb01g0291705.5AT3G60530Zinc finger family protein GATA transcription factorSobic.001G299600
S1-51456627Sb01g02940085.1AT2G35710GlucosyltransferaseGlucose transferSobic.001G302200
S1-51729456Sb01g02959079.7AT4G22590Trehalose-6-phosphate phosphataseTrehalose biosynthesis Sobic.001G303900
S2-65963213Sb02g03099033.8AT1G75680Glycoside hydrolase 9B7Polysaccharide metabolism Sobic.002G276600
S2-70725655Sb02g0363105.1AT1G11260Sugar transporter 1Monosaccharide transportSobic.002G338500
S3-20424005Sb03g01478023.7AT3G06400Chromatin-remodeling protein Protein binding Sobic.003G163200
S9-83605Sb09g00032064.2AT1G57820C3HC4 zinc finger protein Transcription factorSobic.009G001200
S9-43662454Sb09g01754021.4AT3G06760Drought responsive family protein Unknown function Sobic.009G108600
S10-57577048Sb10g02779046.8AT4G30080Auxin response factor 16Auxin-activated signaling Sobic.010G236300
Publisher’s Note: MDPI stays neutral with regard to jurisdictional claims in published maps and institutional affiliations.

