Article

TiO2—MoS2—PMMA Nanocomposites for an Efficient Water Remediation

by
Vanessa Spanò
1,
Maria Cantarella
1,*,
Massimo Zimbone
1,
Federico Giuffrida
1,2,
Gianfranco Sfuncia
3,
Giuseppe Nicotra
3,
Alessandra Alberti
3,
Silvia Scalese
3,
Libera Vitiello
4,
Sabrina Carola Carroccio
4 and
Giuliana Impellizzeri
1
1
Consiglio Nazionale delle Ricerche, Istituto per la Microelettronica e Microsistemi, CNR-IMM, Via S. Sofia 64, 95123 Catania, Italy
2
Dipartimento di Fisica e Astronomia, Università di Catania, Via Santa Sofia 64, 95123 Catania, Italy
3
Consiglio Nazionale delle Ricerche, Istituto per la Microelettronica e Microsistemi, CNR-IMM, Zona Industriale Strada VIII n. 5, 95121 Catania, Italy
4
Consiglio Nazionale delle Ricerche, Istituto per i Polimeri Compositi e Biomateriali, CNR-IPCB, Via Paolo Gaifami 18, 95126 Catania, Italy
*
Author to whom correspondence should be addressed.
Polymers 2024, 16(9), 1200; https://doi.org/10.3390/polym16091200
Submission received: 28 February 2024 / Revised: 12 April 2024 / Accepted: 24 April 2024 / Published: 25 April 2024
(This article belongs to the Section Polymer Composites and Nanocomposites)

Abstract

:
An improvement of water supply and sanitation and better management of water resources, especially in terms of water reuse, is one of the priorities of the European Green Deal. In this context, it is crucial to find new strategies to recycle wastewater efficiently in a low-cost and eco-friendly manner. The immobilization of inorganic nanomaterials on polymeric matrices has been drawing a lot of attention in recent years due to the extraordinary properties characterizing the as-obtained nanocomposites. The hybrid materials, indeed, combine the properties of the polymers, such as flexibility, low cost, mechanical stability, high durability, and ease of availability, with the properties of the inorganic counterpart. In particular, if the inorganic fillers are nanostructured photocatalysts, the materials will be able to utilize the energy delivered by light to catalyze chemical reactions for efficient wastewater treatment. Additionally, with the anchoring of the nanomaterials to the polymers, the dispersion of the nanomaterials in the environment is prevented, thus overcoming one of the main limits that impede the application of nanostructured photocatalysts on a large scale. In this work, we will present nanocomposites made of polymers, i.e., polymethyl methacrylate (PMMA), and photocatalytic semiconductors, i.e., TiO2 nanoparticles (Evonik). MoS2 nanoflakes were also added as co-catalysts to improve the photocatalytic performance of the TiO2. The hybrid materials were prepared using the sonication and solution casting method. The nanocomposites were deeply characterized, and their remarkable photocatalytic abilities were evaluated by the degradation of two common water pollutants: methyl orange and diclofenac. The relevance of the obtained results will be discussed, opening the route for the application of these materials in photocatalysis and especially for novel wastewater remediation.

Graphical Abstract

1. Introduction

Among the environmental problems, water pollution is an urgent topic that needs to be addressed [1]. If, on the one hand, industrial development has brought improvements in the quality of human life, on the other hand, it has caused environmental devastation, including water resources. In addition, the increasing global population implies a growing demand for a greater quantity and quality of water compared to the past. One potential solution to the clean water supply problem is the reuse of wastewater [2]. However, this approach becomes challenging due to the presence of dangerous substances, suspended particles, or organic compounds that are difficult to treat and remove using conventional water treatment methodologies. In addition, some other effective methods have several drawbacks; for example, chlorination generates toxic by-products, while ozonation, although it was a very rapid method and also able to destroy viruses and bacteria, is not economical and very corrosive [3]. Consequently, finding new methods to remove pollutants from water resources has become essential [4].
In the field of wastewater treatment technologies, advanced oxidation processes (AOPs) have garnered increasing attention in recent years. The success of AOPs relies on the production of reactive free radicals (such as hydroxyl, superoxide, and hydroperoxyl radicals) active in the degradation of persistent organic pollutants (POPs), microorganisms (like bacteria), and disinfection residuals [5,6]. This phenomenon occurs because the radicals involved in AOPs have a high oxidation potential that allows for the efficient degradation of organic substances and the killing of bacteria.
One of the most common AOPs used for the photodegradation of organic water pollutants is heterogeneous photocatalysis [7,8,9]. It is a process in which a solid semiconductor is exposed to electromagnetic radiation with energy equal to or greater than the material’s band-gap energy; the irradiation promotes an electron from the valence band to the conduction band, leaving a hole in the valence band. The generated free carriers can migrate to the photocatalyst’s surface, where they can interact with the molecules adsorbed on it. While the holes can oxidize the water molecules and produce hydroxyl radicals (OH), the electrons have the power to reduce the electron acceptors, like oxygen molecules, to form superoxide radicals (O2). These reactive species are able to degrade the organic contaminants and reduce bacterial growth in wastewater [7,8,9].
In this field, titanium dioxide (TiO2), also known as titania, has emerged as a valid photocatalytic material due to its biological and chemical inertness, robust oxidation ability, and long-term durability against photo and chemical corrosion [10,11].
The recombination of photo-generated charges constitutes one of the main drawbacks of photocatalysis, which must be suppressed to improve the activity of the photocatalyst [12]. Studies on photocatalysis are mostly focused on strategies to improve photocatalytic activity, such as heterojunction formation due to the presence of additional semiconductors [13].
Layered two-dimensional (2D) transition metal dichalcogenides (TMDs), such as molybdenum disulfide (MoS2), have received great interest in recent years in the scientific community due to some of their intrinsic properties, such as tunable band-gap by changing the number of the layers, optical features, and resistant interaction with light [14,15]. The quick recombination of photo-generated charges usually prevents charge transfer to the surface, so their photocatalytic activity is relatively small. However, these materials can act as co-catalysts for TiO2 photocatalysts, improving the photocatalytic characteristics of the titania by creating a heterojunction [16,17,18].
The photocatalytic activity can also be enhanced by increasing the photocatalyst’s surface-to-volume ratio [19]. Hence, TiO2 nanostructures have a great deal of potential as highly efficient photocatalysts [11,20,21,22,23]. The Evonik TiO2 P 25 nanoparticles are the most widely utilized photocatalyst at the moment [24]. However, using this form of TiO2 requires an additional step for the recovery of the photocatalysts after the water treatment, requiring time and effort. As a result, a potential way to use nanomaterials in real water treatment applications consists of their immobilization on an inert support, such as a polymeric matrix [25,26,27].
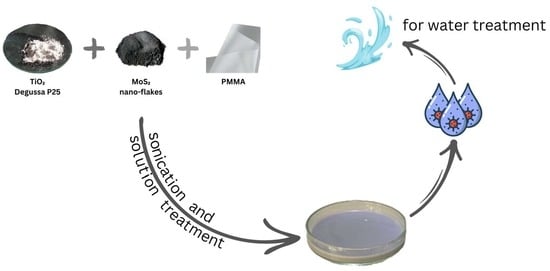
In this paper, poly(methyl methacrylate) (PMMA) was used as an inert support to form a polymeric film nanocomposite in the presence of Evonik Aeroxide® TiO2 P 25 nanoparticles, like active photocatalyst, and MoS2 nanoflakes, like co-catalyst to enhance the titania’s photocatalytic performance. The choice of PMMA as the polymeric matrix lies in its properties, such as its transparency to visible light, mechanical rigidity, and UV stability [28]. It is also a cost-effective polymer, making it suitable for water applications [28]. The polymeric nanocomposites were produced by applying the simple and inexpensive solution casting process. By this technique, we obtained films with TiO2 and MoS2 nanoparticles trapped in their surface, which solves the problem of powder dispersion in the environment when they are utilized as free powders for wastewater treatment.
To our knowledge, few studies on polymeric composites made of TiO2 and MoS2 have been reported in the literature, and only one work is about the use of combined TiO2, MoS2, and PMMA for photocatalytic application [29,30,31]. However, in our case, the studied nanocomposites are obtained using the simple method of solution casting, which is more appropriate for large-scale applications. In addition, in our samples, the nanomaterials are anchored to a polymeric inert support; as a consequence, no additional step of recovery is required after the water treatment, unlike the samples described by Li et al.

2. Experimental Section

2.1. Preparation Method

The Aeroxide® TiO2 P 25 was bought by Evonik (3–99 nm particle size) (Essen, Germany), while the MoS2 powders were purchased from Sigma-Aldrich (90 nm particle size) (St. Louis, MI, USA). The commercial MoS2 powders were previously characterized by our group [32]. Scanning electron microscopy evidenced the flake morphology of the powders; in particular, large MoS2 flakes (about 1 μm in size) together with small flakes (about 100 nm in size) were observed [32]. Transmission electron microscopy showed MoS2 nanoflakes with different areas and shapes stacked on top of each other [32]. In addition, a fast Fourier transform taken on a portion of the specimen showed the regular crystalline nature of the MoS2 [32].
The polymeric nanocomposites, the object of this work, were prepared utilizing the sonication and solution casting method, in which the polymer, i.e., the PMMA, was dissolved in acetone, and in another vial, the powders of TiO2 and MoS2 were dispersed and always sonicated in acetone. The amount of TiO2 was fixed at 5% in weight with respect to the polymer, while the amount of MoS2 was changed from 10% to 30% in weight with respect to the used titania. After sonicating the nanoparticles and once the polymer was dissolved, the two vials were mixed and subjected to additional sonication. Then, the resulting mixtures were cast into Petri dishes that were placed in a fridge to allow the solvent to evaporate slowly at a temperature of 4 °C.
In order to figure out whether or not the samples with various amounts of molybdenum disulfide had improved the photocatalytic effectiveness, a reference sample only consisting of titanium dioxide was also synthesized. Moreover, a simple PMMA film was produced and used as a reference.
The prepared materials will be hereafter indicated: “PMMA”, “TiO2—PMMA”, “TiO2—10% MoS2—PMMA”, “TiO2—20% MoS2—PMMA”, “TiO2—30% MoS2—PMMA”. Figure 1 shows the pictures of the films in the Petri dishes. The PMMA films resulted in transparency, as foreseen for PMMA [28]. The TiO2—PMMA appeared white in color due to the presence of the titania, while the presence of MoS2 induced in the composites a grey coloration, from light grey to dark grey with increasing the MoS2 content (as expected, due to the band-gap energy of the material in the Vis spectrum) [14,15].

2.2. Characterizations

Transmission electron microscopy (TEM) was used to characterize the morphology, chemistry, and structure of the nanomaterials. The TEM specimens were prepared by ultramicrotomy. The samples depicted in Figure 1 were embedded in resin and cut by a Leica EM TXP, creating flat slices containing a portion of our nanocomposite. Thin sectioning was performed with a Diatome ultra 35° diamond knife of a Leica EM UC7 ultramicrotome (Wetzlar, Germany), producing 70 nm thin TEM specimens, which were collected on copper TEM grids. To enhance the stability under the electron beam, the TEM specimens were coated with an ultrathin conductive layer of carbon (~3 nm) by a Quorum Q150V ES plus coater(Laughton, East Sussex, UK). A Jeol TEM ARM-200F (Tokyo, Japan) was used at 200 kV for the TEM characterization. The microscope was equipped with a cold field emission gun (FEG) emitter with 0.27 eV energy spread and a Gatan imaging filter QuantumER for electron energy loss spectroscopy (EELS). Scanning mode (S-TEM) was used for imaging and for spectrum imaging (SI) mode, which simultaneously collects spatial and spectroscopic information. Parallel-beam, conventional mode (C-TEM) was used to obtain electron diffraction patterns.
X-ray Crystallographic investigation by X-ray (XRD) was performed by a Rigaku Smartlab diffractometer (Tokyo, Japan) supplied with a rotating anode working at 45 kV-100 mA and of a HyPix 3000 detector (Tokyo, Japan).
XPS analysis was carried out by the PHI Genesis Multi-Technique Scanning XPS system, with a monochromatic Al Kα X-ray beam and a 180° hemispherical electron energy analyzer. The system is equipped with a dual-beam charge neutralization system that allows turnkey neutralization of all types of insulating samples.
In order to investigate the optical band-gap of the polymeric nanocomposites, UV-Vis diffuse reflectance spectroscopy (DRS) characterization was conducted by a Perkin-Elmer Lambda 1050+ UV/Vis/NIR spectrophotometer equipped with an integrating sphere. The optical band-gap of the nanocomposites was calculated using the Kubelka-Munk and Tauc-Plot procedure [33].
Thermogravimetric analyses (TGA) were performed using a Perkin Elmer TGA 8000 (Waltham, MA, USA) apparatus to assess the thermal stability of the polymer samples. Samples of 2 ± 0.4 mg were heated under nitrogen flow from 50 °C up to 600 °C with a heating rate of 10 °C/min. The experiment was performed in triplicate.
The wettability of the samples’ surface was characterized using DATAPHYSICS-OCA 15 PRO (Filderstadt, Germany) contact angle measurement equipment. The measurements were performed with drops of water. The average of three measurements in three different regions of each sample were considered.

2.3. Photocatalytic Tests

Photocatalysis tests were carried out using methyl orange (MO), a common industrial dye, and diclofenac, a popular nonsteroidal anti-inflammatory drug (NSAID). The tests were performed with 1 cm2 squared samples, each immersed in a small cylindrical reactor containing 2 mL of deionized water solution of the contaminant with a concentration of 5.5 × 10⁻⁵ M. In order to follow the pollutant adsorption and desorption on the surfaces of the photocatalyst and of the beaker, the samples were left in the solution for approximately 60 min under dark conditions. When the equilibrium was reached, the UWAVE LED UV lamp system (emission centered at 365 nm, full width at half maximum of 10 nm, irradiance of 12 mW/cm2) was switched on to start the photo-degradation test. At regular time intervals (for a total time of 4 h), the irradiated solutions were measured with a UV-Vis spectrophotometer (Lambda 45 Perkin-Elmer) (Waltham, MA, USA) in a wavelength range of 200–700 nm. The pure pollutant solution without any photocatalyst was also tested as a reference. The degradations of MO and diclofenac were evaluated by the absorbance peak at 464 and 276 nm, respectively, in the Lambert–Beer regime. According to the Langmuir–Hinshelwood model, which assumes that the photocatalysis reaction follows a pseudo-first-order kinetic, the photo-degradation reaction rate (k) of the contaminants was calculated by the following equation [7]:
l n C C 0 = k t
where t represents the irradiation time, C the concentration of contaminant at the time t, and C0 the initial concentration, that is, the value of the concentration reached after the establishment of adsorption/desorption equilibrium of the pollutant on the surface of the photocatalyst and of the beaker. We also estimated the photonic efficiency, which is useful to compare the process efficiencies of different photocatalytic materials [34]. The photonic efficiency describes the moles of product molecules formed divided by the mole (einstein) of photons at a given wavelength (i.e., 365 nm) in the reactor cell [34]. The photonic efficiency (ξ) can be calculated via the following expression [34,35]:
ξ = N m o l   m o l · c m 2 · s 1 N p h   ( e i n s t e i n · c m 2 · s 1 ) = R i n R o , λ × 100
where Rin (mol·cm−2·s−1) is the initial rate of photo-conversion of the organic molecule, and Ro (Einstein·cm−2·s−1) is the photon flow [35].

3. Results and Discussion

Figure 2 reports the TEM characterization of the TiO2—10% MoS2—PMMA sample. The morphology of the nanomaterials embedded inside the PMMA matrix was studied by S-TEM imaging using a high-angle annular dark-field (HAADF) detector. The result of this analysis is reported in Figure 2a. The HAADF signal intensity is roughly proportional to the square of the atomic number of the species. Hence, MoS2 nanoflakes appear brighter than TiO2 nanoparticles in Figure 2a. The MoS2 nanoflakes have a characteristic size of hundreds of nanometers. The observed structure results from the aggregation and folding of several 2D MoS2. The TiO2 nanoparticles are much smaller, having a size of the order of a few tens of nanometers. The estimated sizes correspond to the dimensions declared by the manufacturers (the reader can refer to the Section 2). The TiO2 nanoparticles decorating the MoS2 flakes are close enough to interact with them.
The chemistry of the nanomaterials inside the composite was analyzed by EELS in S-TEM SI mode. An EELS spectrum in the 100–600 eV energy range was collected for every electron probe position inside the green-shaded area depicted in Figure 2a. From the resulting dataset, it was possible to obtain the spatial distributions of Ti, Mo, O, and S (Figure 2b), fitting respectively the Ti L-edge at 456 eV, Mo M-edge at 227 eV, O K-edge at 532 eV, and S L-edge at 165 eV, after background modeling. The obtained elemental distribution makes evident the overlap of Ti/O and Mo/S signals, confirming, respectively, the chemical nature of TiO2 nanoparticles and MoS2 nanoflakes.
The electron diffraction analysis was used to investigate the crystal structure of the nanomaterials present in the composite. The diffraction patterns reported in Figure 2c showed several spots, both from TiO2 and MoS2 [36,37]. The larger white-shaded circle encloses the diffraction spots from (101) planes characteristic of the anatase phase of TiO2 (a-TiO2). A few diffraction spots relative to the (110) planes of the rutile phase of TiO2 (r-TiO2) were also observed, confirming the mixed-phase nature of the TiO2 nanoparticles. The diffraction analysis also showed evenly spaced diffraction spots from (00n) planes of MoS2 (with n = 2, 4, 6), characteristic of the stacking direction of the hexagonal MoS2 phase.
Figure 3 reports the diffractograms of the two composites, TiO2—PMMA and TiO2—10% MoS2—PMMA, respectively. In the TiO2–PMMA sample (represented with the red curve), most of the TiO2 peaks are ascribed to the anatase phase, with minor contributions from rutile. The measured lattice parameters are a = 0.378 nm, b = 0.378 nm, and c = 0.951 nm for TiO2 anatase; a = 0.457 nm, b = 0.457 nm, and c = 0.300 nm for TiO2 rutile. In the other sample (blue pattern in Figure 3), a blending of the two inorganic materials is visible since, together with the TiO2 peaks, the contribution related MoS2 is also present with lattice parameters a = 0.315 nm, b = 0.315 nm, and c = 1.232 nm. The TiO2 lattice parameters are unchanged with respect to the reference case (i.e., TiO2—PMMA sample). The grain size calculated from the full width at half maximum of the main diffraction peaks in TiO2 (2θ = 37.84°) and MoS2 (2θ = 39.62°) are 38 nm and 34 nm, respectively. In Table 1, the peak position, the interplanar distances, and the associated phases are listed.
The samples were characterized by XPS to investigate their chemical composition, and the XPS spectra are shown in Figure 4. The Ti2p spectra for TiO2—PMMA, TiO2—10% MoS2—PMMA, and TiO2—30% MoS2—PMMA are reported in Figure 4a; the O1s spectra for PMMA, TiO2—PMMA, TiO2—10% MoS2—PMMA, and TiO2—30% MoS2—PMMA are reported in Figure 4b; the Mo3d and S2p spectra for TiO2—10% MoS2—PMMA, and TiO2—30% MoS2—PMMA are depicted in Figure 4c and Figure 4d, respectively.
The C1s spectra were also acquired and reported in the Supporting Information (Figure S1). They are mainly related to the PMMA material, with a contribution at 284 eV associated with the C-C bonds and other contributions due to C-O or C=O bonds at 285.5 and 288 eV, respectively. In the case of TiO2—PMMA, an additional peak was observed at 289 eV, probably associated with carbonate groups in TiO2 [38,39]. In the TiO2—PMMA composites containing MoS2, the C1s peaks are more similar to the case of the PMMA sample since, in general, the contributions related to TiO2 are less evident.
The Ti 2p peaks did not show any significant changes for the three samples with or without the MoS2, as expected. The binding energies related to 2p3/2 and 2p1/2 peaks are 457.4 eV and 463.1 eV for all the samples and are consistent with the standard binding energy found for TiO2. The peaks were fitted for TiO2—PMMA with four peaks: Ti 4+ 2p1/2 at 463.1 eV, Ti 4+ 2p3/2 at 457.4 eV, Ti 3+ 2p1/2 at 464.1 eV, and Ti 3+ 2p3/2 at 458.8 eV.
Regarding the O1s peaks, in the case of PMMA, two different contributions have to be taken into account due to the presence of O atoms bound to C atoms within the polymeric structure, with single or double bonds, which correspond, respectively, to binding energies of 531.4 eV and 533 eV. For the PMMA–TiO2 sample, the O1s feature also contains other contributions related to the Ti-O bonds, in particular to lattice O, which is found at lower binding energy (528.7 eV), and an additional peak that can be addressed to O vacancy or OH in the TiO2 structure.
The Ti2p peaks and the O1s feature at 527 eV, due to the TiO2 structure, are more evident in the PMMA–TiO2 sample with respect to the samples also containing MoS2. Indeed, we expect that the presence of MoS2 could hide the TiO2 in the composite, determining a lower intensity of the TiO2 peaks.
The Mo3d and the S2p spectra reported in Figure 4c,d refer to samples TiO2—10% MoS2—PMMA and TiO2—30% MoS2—PMMA, respectively, and show two peaks at 227.5 eV and 230.6 eV for Mo3d5/2 and Mo3d3/2, respectively, and a large peak for S2p centered at 160 eV, given by the convolution of S2p3/2 and S2p1/2. The MoS2 powder used for the preparation of the nanocomposite materials was also analyzed as a reference, and the spectra are reported in the Supporting Information (Figure S1).
Figure 5 depicts UV-Vis DRS spectra of pristine MoS2, TiO2—PMMA, and TiO2—30% MoS2—PMMA. We reported the apparent absorbance, i.e., (100-Reflectance)%, for convenience.
The MoS2 UV-Vis spectrum shown in Figure 5a exhibited absorption peaks in accordance with the literature [40]. The crystal structure of bulk MoS2 consists of a vertical arrangement of MoS2 layers connected by weak van der Waals forces [15]. The bulk MoS2 material is reported to have an indirect band-gap of 1.3 eV [40]. With decreasing the layer thickness, progressive confinement induces a shift of the energy gap from the bulk value of 1.3 eV to over 1.9 eV, together with a change from indirect to direct band-gap in the monolayer limit [40]. Consequently, the various absorption peaks observed in the UV-Vis spectrum (Figure 5a) can be correlated to MoS2 nanoflakes with different thicknesses.
The UV-Vis spectrum of the TiO2—PMMA sample (Figure 5b) displayed an absorption at wavelengths lower than 400 nm that is consistent with the reported bad-gap energy of the TiO2 P 25 (that has a mixed anatase and rutile phase) [41].
In Figure 5c, the UV-Vis spectrum of the TiO2—30% MoS2—PMMA nanocomposite is reported. The spectrum reasonably shows both the features of TiO2 and MoS2. Indeed, at ~400 nm, the reader can see the absorption related to the TiO2, while the rest of the spectrum (at higher wavelengths) can be correlated to the absorption by the MoS2 nanomaterials.
The analyses of these spectra were performed using the Kubelka–Munk and Tauc-plot procedure [33] and are reported in the insets. The inset of Figure 5a shows two band-gaps related to the MoS2: (1.3 ± 0.1) eV and (2.4 ± 0.2) eV, in accordance with the reported modulation of the band-gap energy with the layer thickness, as discussed above [40]. The Tauc-plot reported in the inset of Figure 5b revealed the presence of the band-gap of the titania at (3.0 ± 0.3) eV, in perfect agreement with the existing literature [41]. The inset of Figure 5c indicates the presence of multiple optical band-gaps related to MoS2 and TiO2 contributions. The UV-Vis spectra of TiO2—10% MoS2—PMMA and TiO2—20% MoS2—PMMA, together with the Tauc-plots, are reported in the Supplementary Information as Figure S2. No significant differences were observed.
The thermogravimetry (TGA) and derivative thermogravimetry (DTG) results are shown in Figure 6a and Figure 6b, respectively. The onset temperature (Tonset) and peak temperature (Tpeak) of the degradation stages were extrapolated from the DTG curves, while the weight loss and residue at 600 °C were determined from TGA curves. Table 2 shows the extrapolated thermogravimetric data. According to the literature, the PMMA exhibits the typical three-step decomposition. The first mass loss begins at 144 °C and is associated with the cleavage of head-to-head H–H bonds, characterized by a lower bond energy compared to the C–C backbone bond due to steric hindrance and the inductive effect of ester groups. The second mass loss step (Tpeak = 259 °C) is related to the scission of unsaturated ends triggered by homolytic cleavage of the vinyl group. The final degradation phase partially overlaps with the previous degradation step and is attributed to random chain scissions [42]. The addition of titanium dioxide and molybdenum disulfide did not induce any significant change in the thermal stability of the PMMA during the first-step decomposition. However, in the second degradation phase, MoS2 accelerates the thermal degradation of the matrix by approximately 20 °C in the system with the highest filler content (30%).
Considering the potential application of the produced materials in wastewater remediation, the wettability of the surfaces plays an important role. The mean values of the contact angles for each investigated sample are reported in Table 3. The contact angles remained constant within the experimental errors for all the investigated surfaces. The contact angles of about 80° additionally indicated good hydrophilicity of the investigated surfaces [43], which are hence promising for water treatment through photocatalysis.
The photocatalytic aptitude of the composites was first tested by the degradation of MO dye. Methyl orange is a synthetic anionic azo dye, frequently used as a colorant in textile and leather industries. It is also widely used in research laboratories as a pH indicator because of its clear color variance at different pH values. MO is a carcinogenic dye, so it must be treated before discharging into the environment [44]. All the produced composites were tested, and the results are reported in
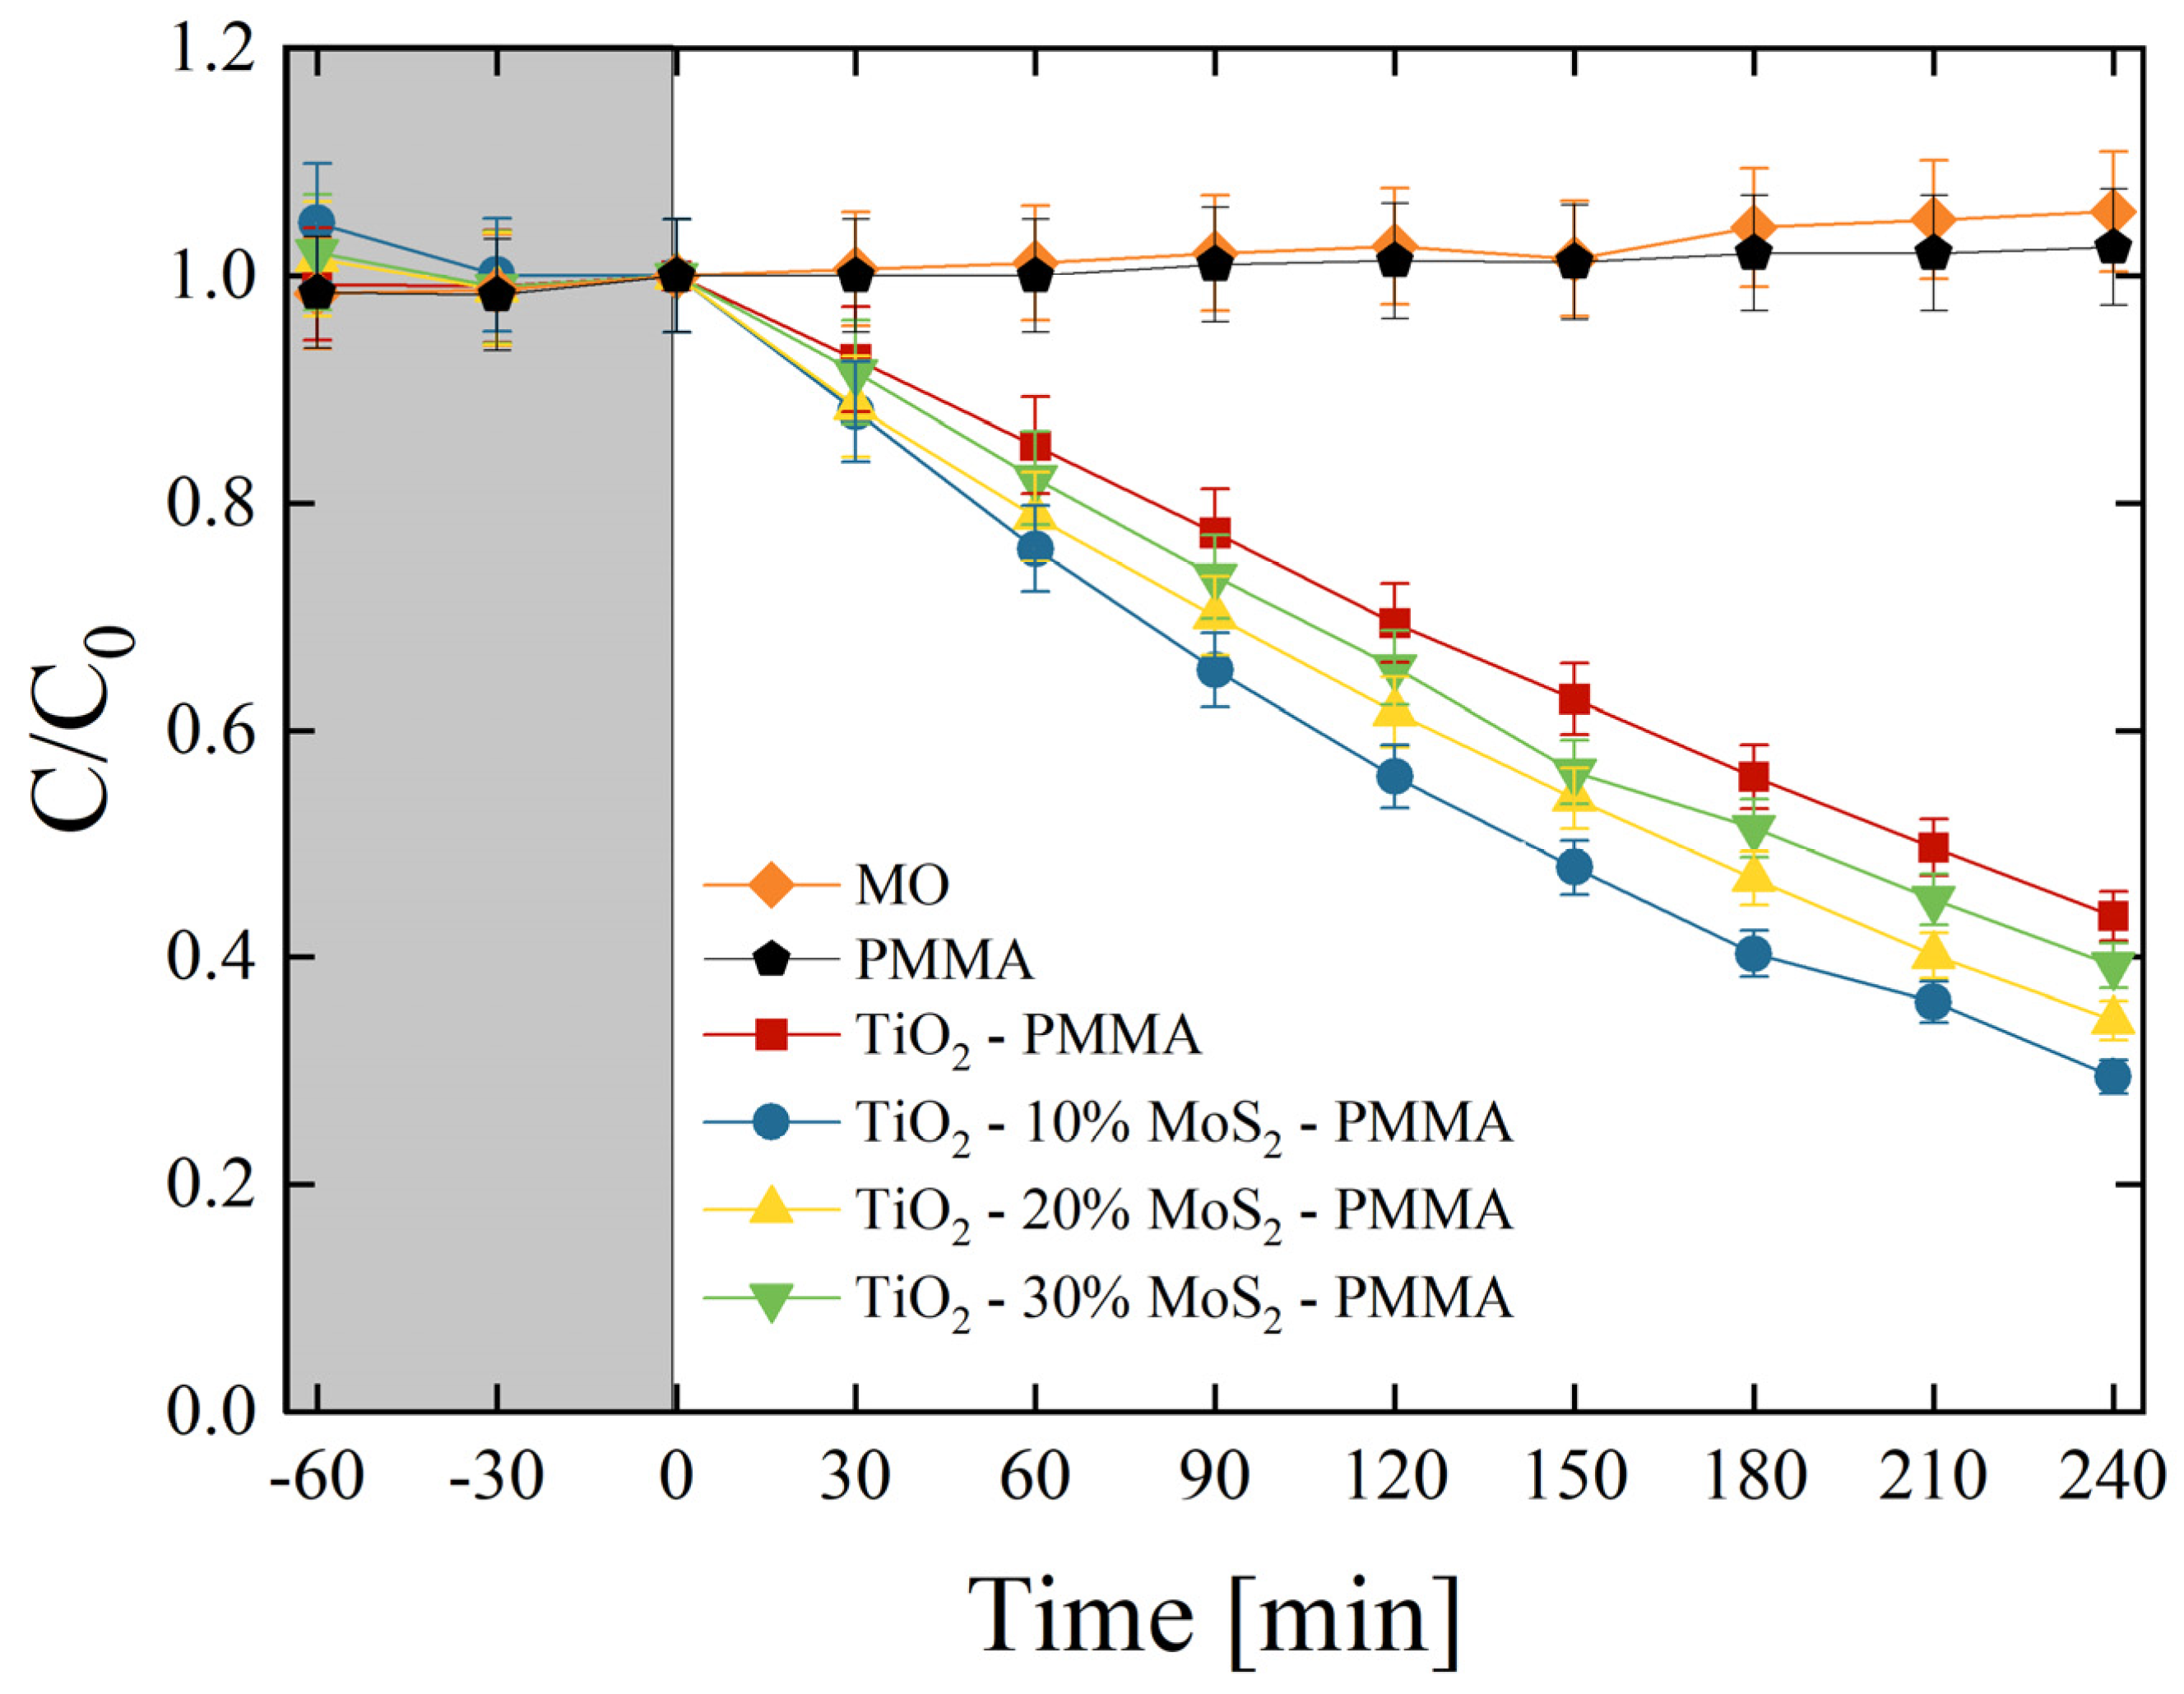
 Figure 7. C is the concentration of MO at the irradiation time t, while C0 is the starting concentration of MO (as detailed in the Section 2). The preliminary test led in the dark (grey area in Figure 7) allowed an estimation of the adsorption of MO on the surfaces of the samples and on the walls of the cylindrical vessels. The adsorption result was negligible. Under UV light irradiation, the mere MO solution and the MO solution in the presence of only PMMA did not show any variation, as expected. On the other hand, the TiO2 P 25 induced a significant degradation of the dye (~55% of the dye is degraded after 240 min of irradiation under UV light). The degradation efficiency is further increased thanks to the presence of MoS2 nanoflakes. We observed that the best photocatalyst result was in the TiO2—10% MoS2—PMMA composite, which is the material with the smallest amount of MoS2 (~70% of the dye is degraded after 4 h of UV light irradiation).
In order to quantify the photo-degradation process, the reaction rates (k) were estimated by applying the Langmuir–Hinshelwood model, as detailed in the Section 2 [7]. Table 4 reports the photo-degradation reaction rates for all the investigated samples. In detail, the reaction rate increased from (1.51 ± 0.08) × 10−3 min−1 of the TiO2—PMMA composite to (2.20 ± 0.11) × 10−3 min−1 of the TiO2—10% MoS2—PMMA composite with a remarkable increase of about 50% thanks to the presence of MoS2 co-catalyst.
The photonic efficiency (ξ) was calculated (the reader can refer to the Section 2 for the details) for all the investigated samples and is reported in Table 5. The photonic efficiency values in the case of MO (ξMO) indicated again the TiO2—10% MoS2—PMMA as the best performing material, in agreement with the results reported in Figure 5.
The potential leak of the nanomaterials from the polymeric support was investigated by removing the samples from the MO solutions after 240 min under UV lamp. The mere solutions were then irradiated with the UV light for 1 h and no reduction of MO concentration was observed. This experiment demonstrated that not enough nanomaterials were released in the MO solution giving a detectable photo-degradation.
The produced materials were also tested for the degradation of diclofenac. Diclofenac is an emerging contaminant commonly used as an analgesic for humans, livestock, and domestic animals in the treatment of inflammation and pain in pathologies [45]. The global consumption of diclofenac was estimated at around 940 tons per year, with an average of 65% of this pharmaceutical being released through the urine in the environment [46]. Diclofenac can be toxic for several organisms according to its concentration [47]. It is consequently important to find effective methodologies for the degradation of this drug. Figure 8 reports the photo-degradation of diclofenac by the investigated composites. As expected, no variations in the drug concentration were observed under UV irradiation for the mere diclofenac solution and for the diclofenac solution in the presence of only PMMA. The test evidenced the role of MoS2 as a co-catalyst of TiO2; indeed, the samples enriched with the MoS2 nanoflakes clearly showed an enhanced photocatalytic aptitude with respect to the TiO2—PMMA sample. More specifically, the best sample resulted in the TiO2—10% MoS2—PMMA one (~50% of the drug is degraded after 4 h of UV light irradiation), as in the case of MO degradation (see Figure 7).
The photo-degradation reaction rates (k) were estimated for all the studied samples and reported in Table 6. The reaction rate raised from (0.64 ± 0.03) × 10−3 min−1 of the TiO2—PMMA composite to (1.15 ± 0.60) × 10−3 min−1 of the TiO2—10% MoS2—PMMA composite with an increase of about 80% thanks to the presence of MoS2 co-catalyst.
The photonic efficiency for diclofenac (ξdiclofenac) was also calculated via Equation (2). Table 7 reports the photon efficiencies of the composites at various wt.% of MoS2. Also, for this pollutant, the TiO2—10% MoS2—PMMA composite showed the highest efficiency compared to all the other samples.
It is worth noting, by comparing the data of Table 4 and Table 6 and Table 5 and Table 7, that the photo-degradation is, in general, lower in the case of diclofenac than MO, surely due to the recalcitrant nature of diclofenac [48].
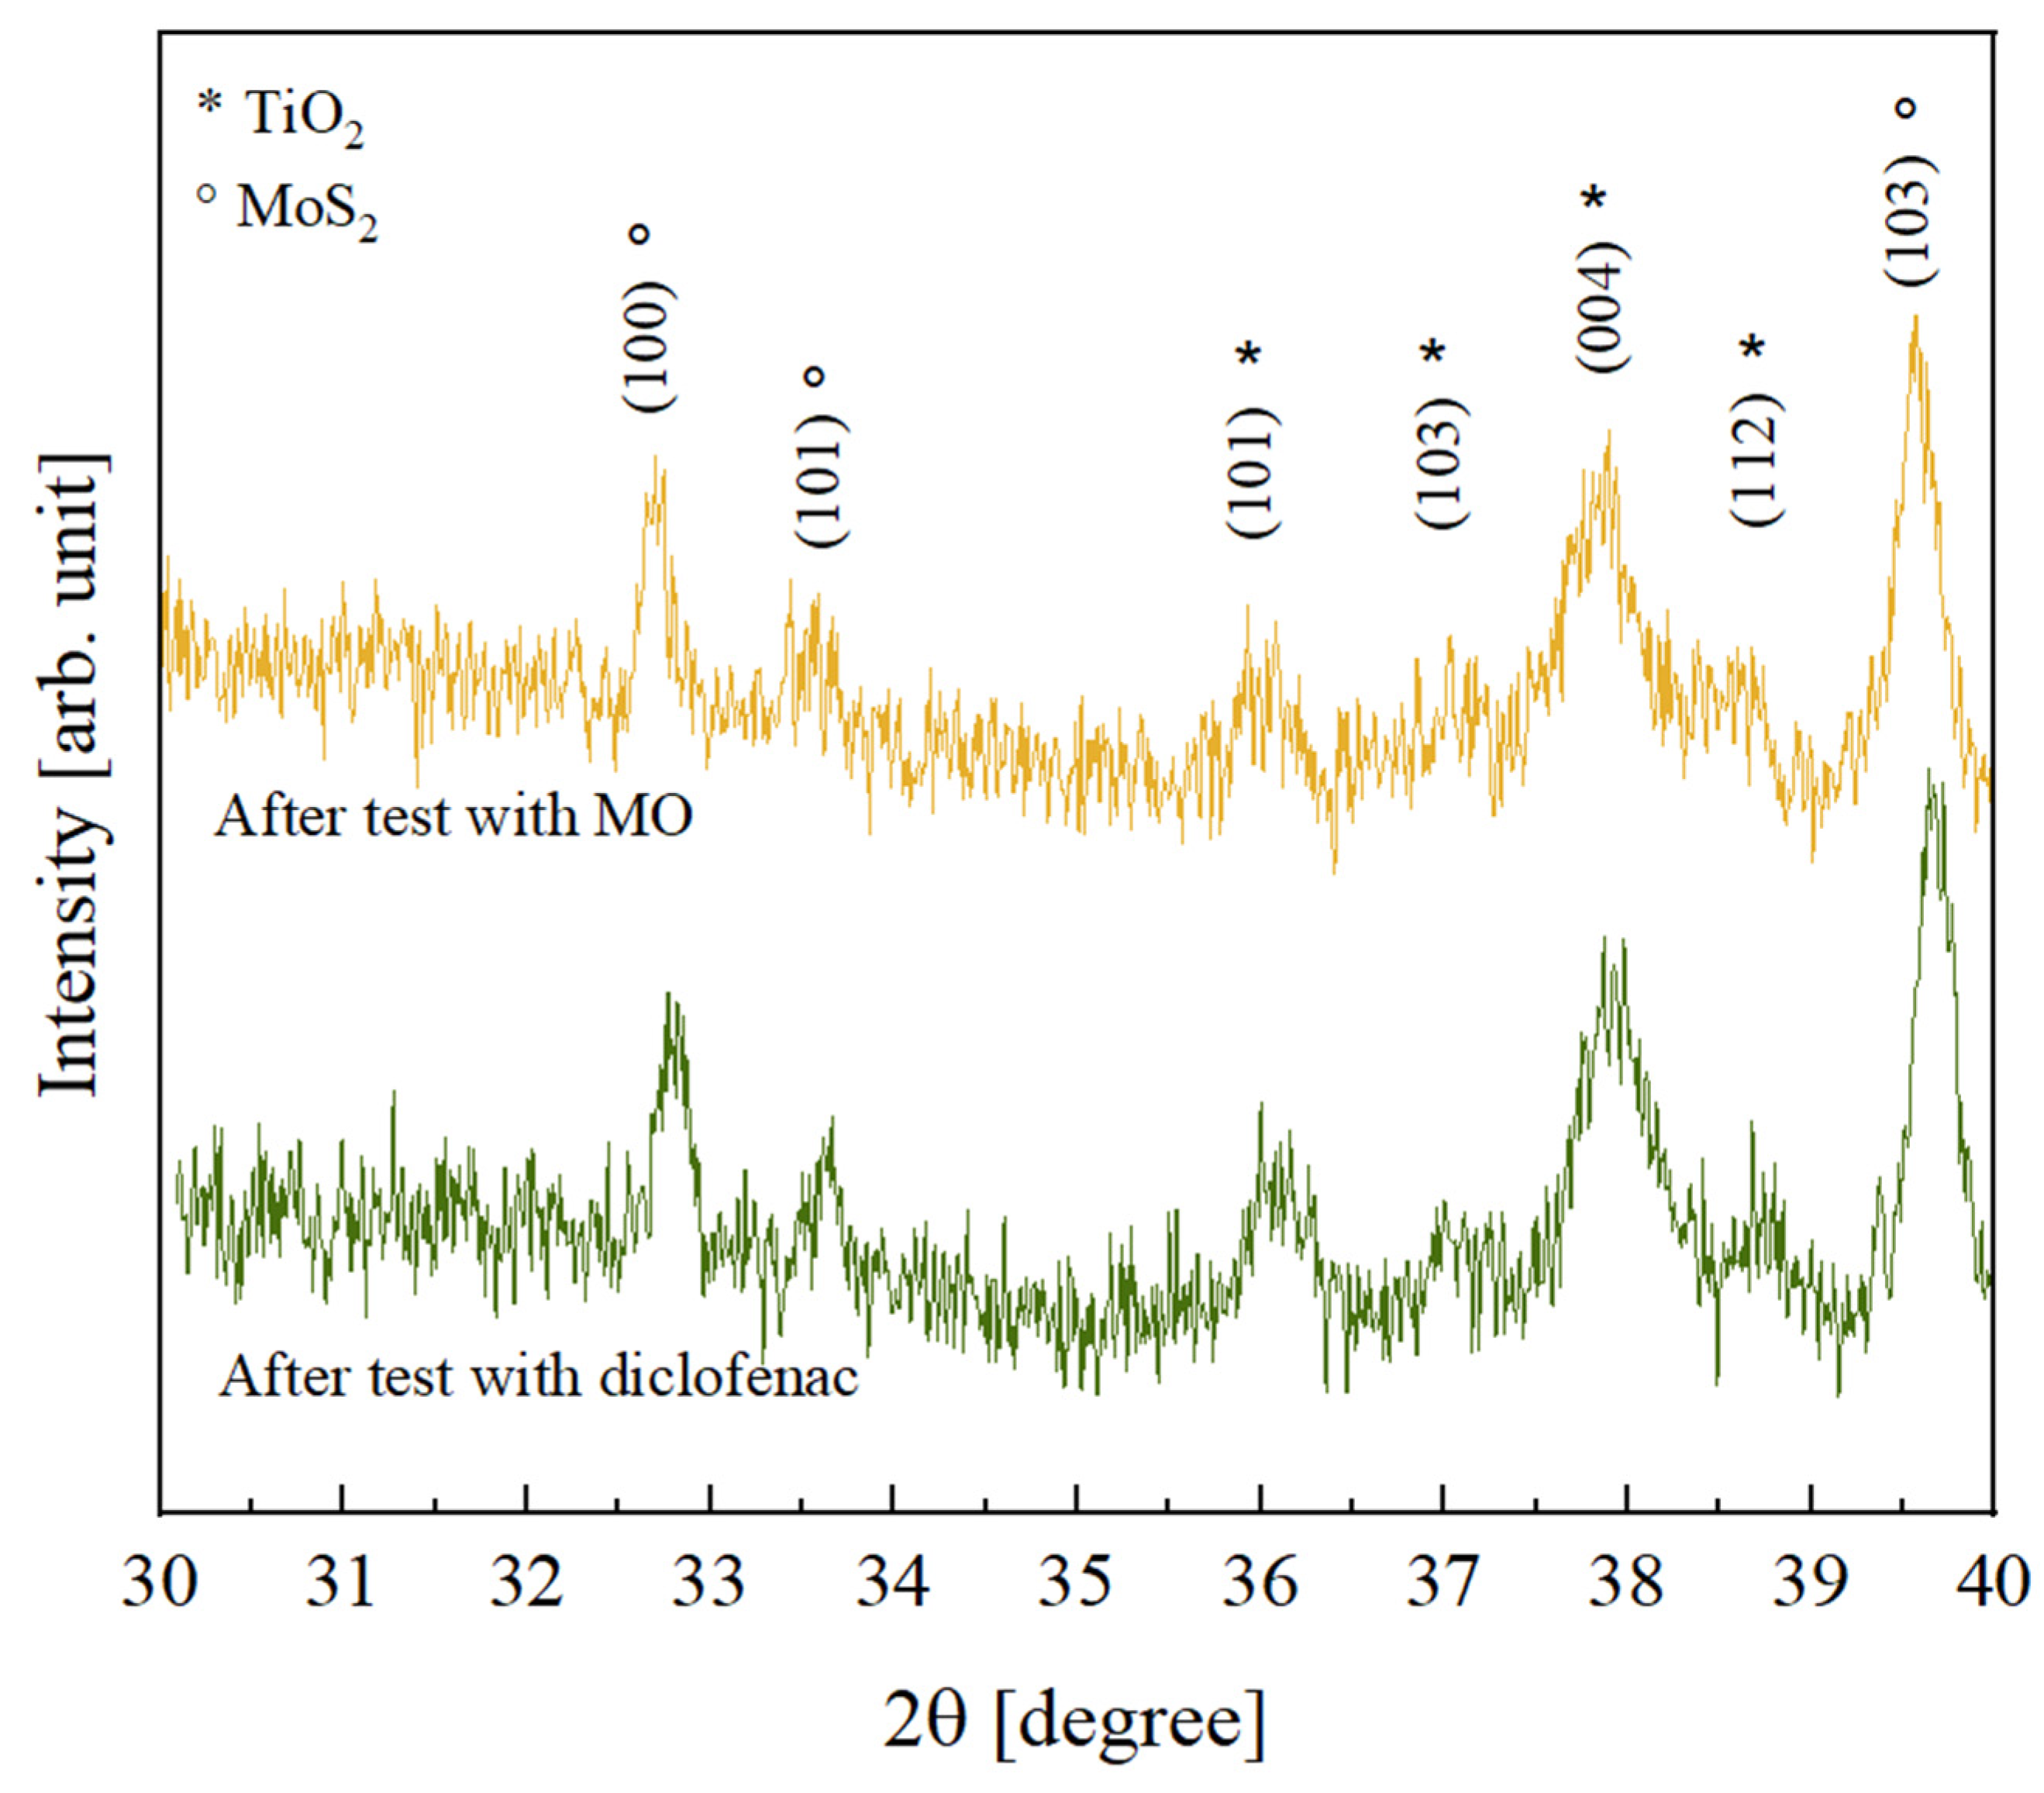
In order to investigate the possible effects of the photocatalytic process on the crystallinity of the inorganic components, the TiO2—10% MoS2—PMMA samples after the photocatalytic degradation tests with MO and diclofenac were analyzed by XRD. The results obtained, shown in Figure 9, revealed that no variation was registered; the peaks are indeed comparable to the peaks observed before the photocatalysis (see Figure 3).
The photocatalytic performance of MoS2 was also tested under visible light; no activity was revealed surely due to the small band-gap of the material that causes a rapid recombination of the photo-generated electrons and holes.
Combining all the obtained results, we can deduce the crucial effect of MoS2 nanoflakes in improving the photocatalytic efficiency of TiO2. Indeed, excluding any different role of the various samples’ surfaces (as demonstrated by the contact angle measurements, see Table 3), the observed photocatalytic activity is surely driven by the presence of MoS2. 
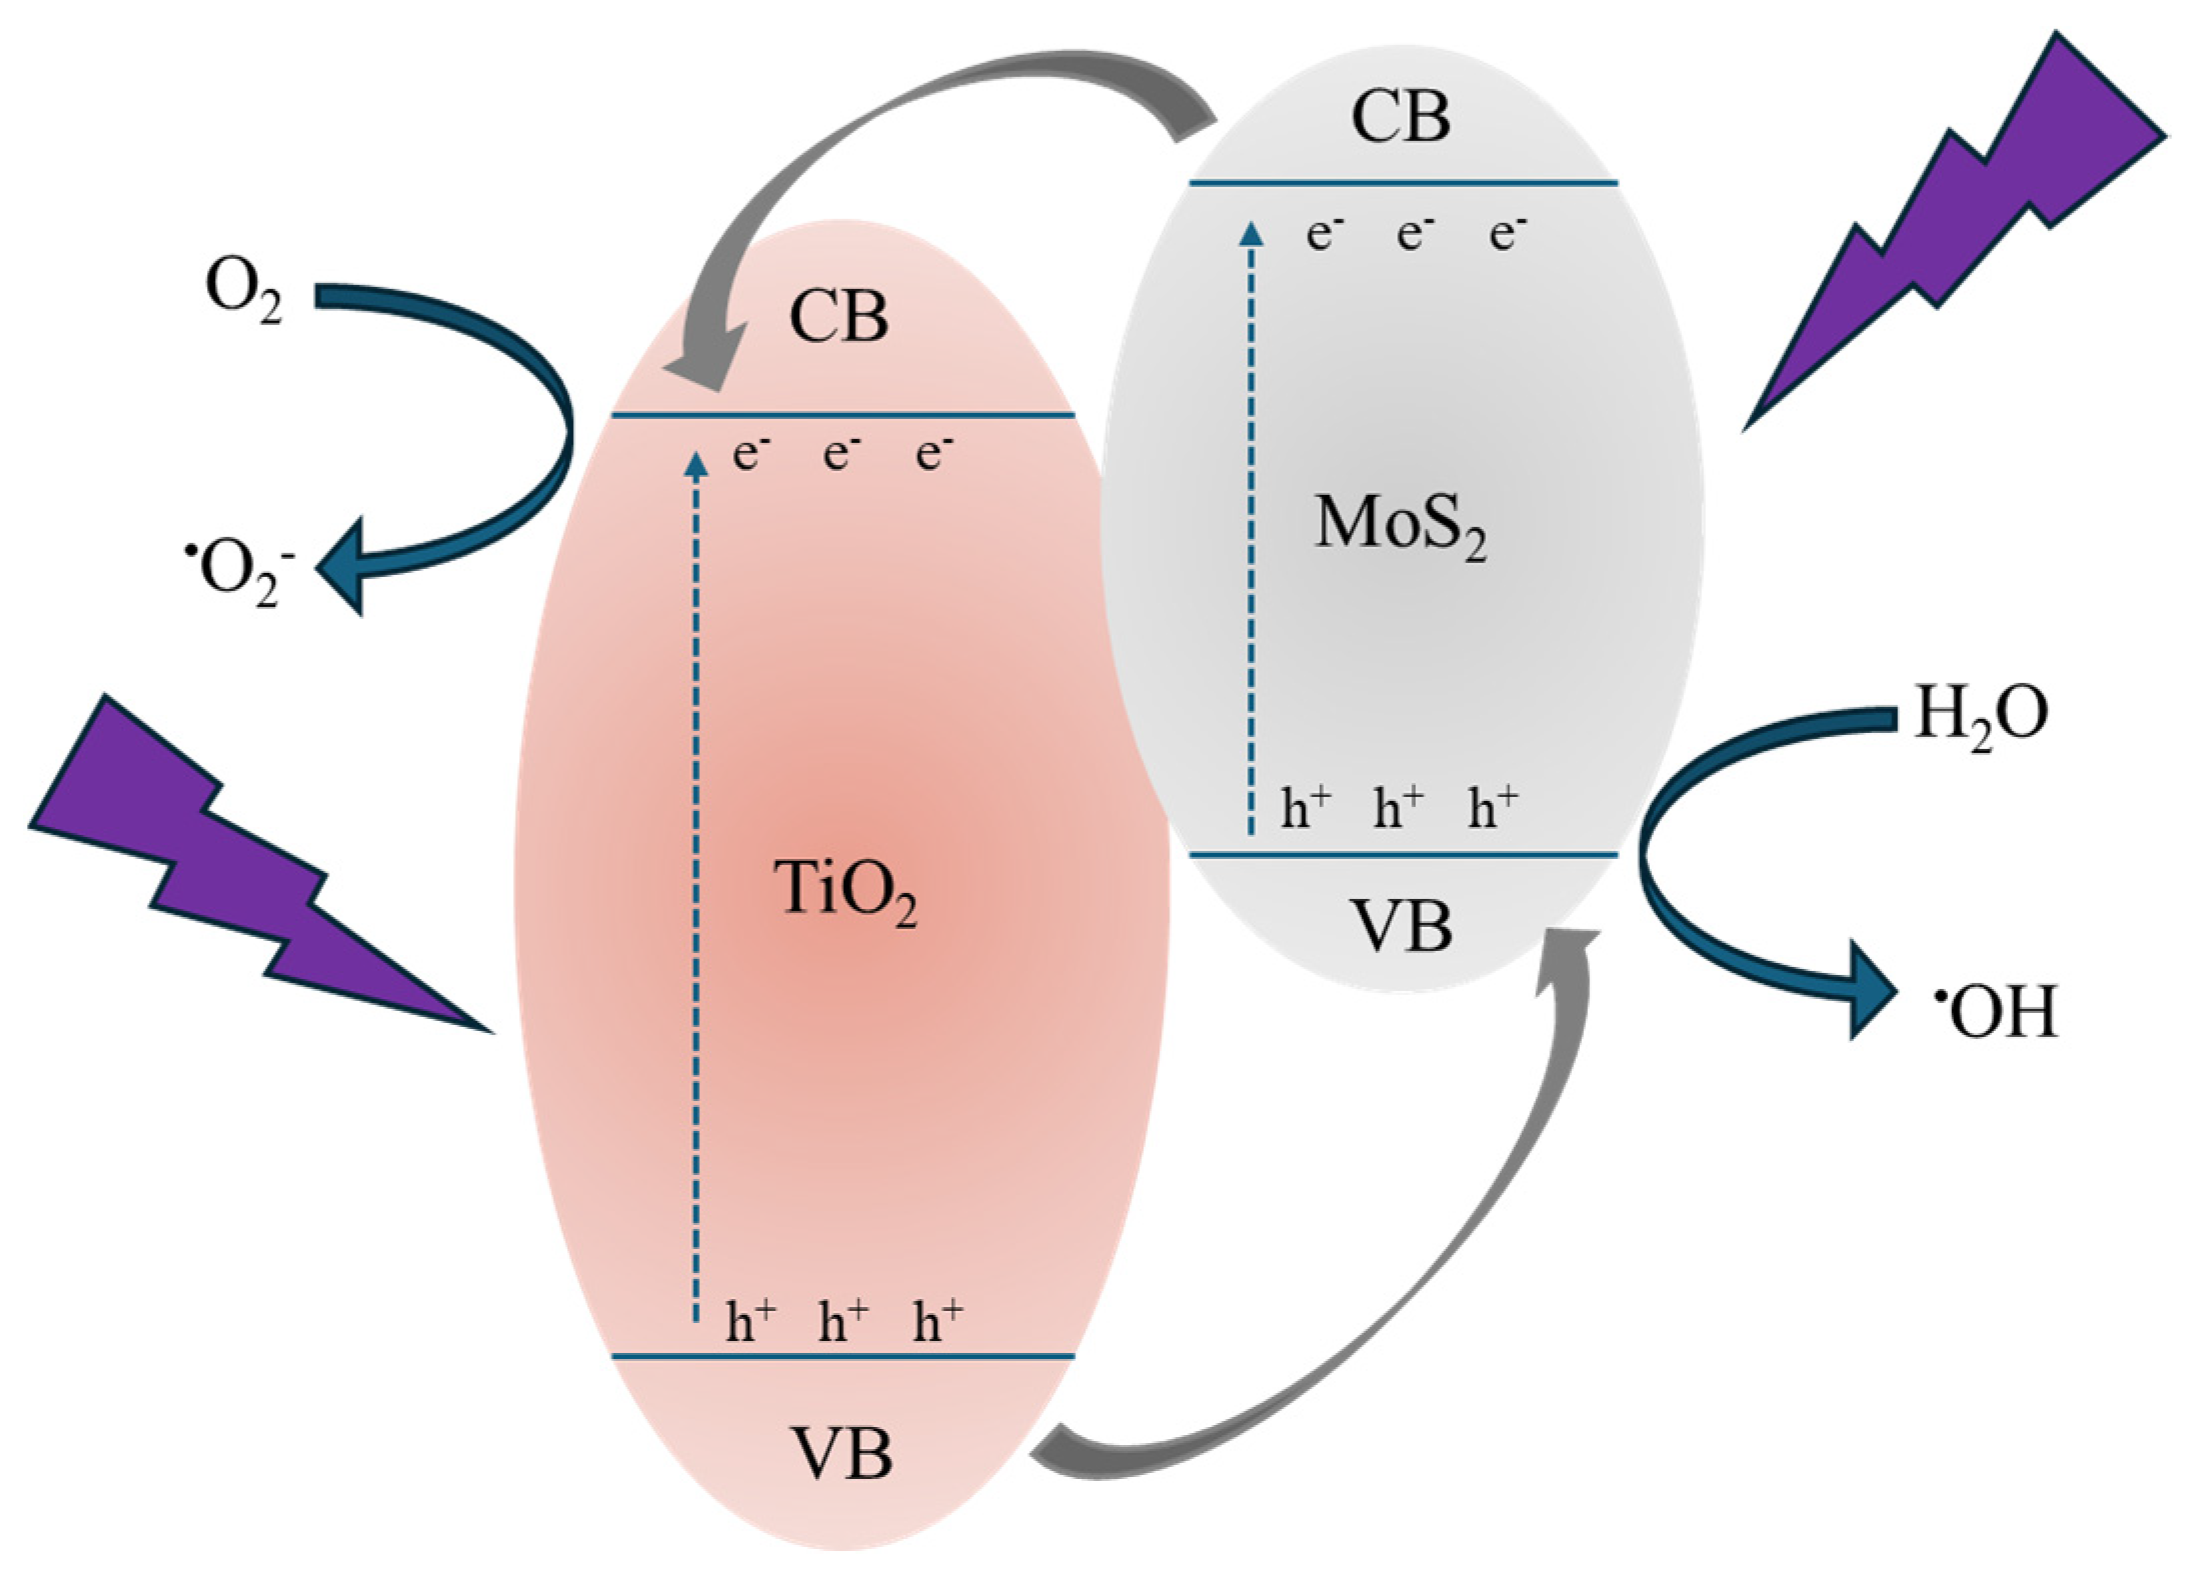
Figure 10 reports a tentative description of the acting mechanism. The MoS2 can control the electron–hole pair recombination by charge carrier trapping. As reported in the literature [49], the conduction band (CB) and valence band (VB) positions of MoS2 are quite higher than those of TiO2; as a consequence, under UV irradiation, the photo-excited electrons are transferred from the CB of the MoS2 to the CB of the TiO2, while the photo-generated holes are transferred from the VB of the TiO2 to the VB of the MoS2 (see Figure 10). In this way, the recombination of the charge carriers is drastically reduced, obtaining higher photocatalytic performances [50]. Thus, the electrons and holes able to reach the surfaces of the two materials (i.e., TiO2 and MoS2) initiate a series of redox reactions with oxygen and water molecules adsorbed on the surface, forming reactive radicals (mainly •OH and •O2) that react with the organic pollutants, in our tests MO and diclofenac, starting their degradation. The decrease in photocatalytic efficiency with the MoS2 powders amount could be understood considering the excessive coverage of the TiO2 P 25 surface by the MoS2 nanoflakes, which invalidates the photocatalysis process. Indeed, the photocatalytic efficiency of the whole system is driven by a compromise between the MoS2 action in separating the charge carriers and the coverage of the TiO2 surface resulting from the presence of MoS2 nanoflakes that negatively affect the photocatalytic performance of the composites [21,51].

4. Conclusions

In this work, we presented TiO2—MoS2—PMMA nanocomposites obtained by casting from solution. The Evonik Aeroxide® TiO2 P 25 photocatalyst was coupled with MoS2 nanoflakes as a co-catalyst with the aim of improving the photocatalytic performance of the titania. PMMA was used as a supporting matrix to avoid the release of the nanomaterials in the environment. A detailed TEM characterization demonstrated the intimate contact between the two nanomaterials, TiO2 and MoS2, which is crucial to improving the photocatalytic aptitude of the titania. The created junction between TiO2 and MoS2 produces materials with an outstanding photocatalytic performance for the degradation of MO dye and diclofenac drug. The presence of MoS2 induces an increment in the photocatalytic activity higher than 50%. In conclusion, the reported results demonstrate that the TiO2—MoS2—PMMA nanocomposites are promising materials that, overcoming the post-recovery step of nanoparticles after the water treatment, can find applications in wastewater remediation on a large scale.

Supplementary Materials

The following supporting information can be downloaded at: https://www.mdpi.com/article/10.3390/polym16091200/s1, Figure S1: (100-Reflectance)% spectra of TiO2—10% MoS2—PMMA (a), and TiO2—20% MoS2—PMMA (b) sample. The insets of the figures show the Tauc-plots (continuous line) and the relative fit (dashed line) for all the samples; Figure S2: XPS spectra recorded for (a) C1s for all studied samples; (b) Mo3d for the commercial MoS2; (c) S2p for the commercial MoS2.

Author Contributions

V.S.: Data curation, Investigation, Writing—original draft; M.C.: Data curation, Investigation; M.Z.: Investigation; F.G.: Data curation, Investigation; G.S.: Data curation, Investigation; G.N.: Data curation, Investigation; A.A.: Data curation, Investigation; S.S.: Data curation, Investigation; L.V.: Data curation, Investigation; S.C.C.: Data curation; G.I.: Funding acquisition, Supervision, Writing—original draft. All authors have read and agreed to the published version of the manuscript.

Funding

This work was partially funded by the European Union (NextGeneration EU) through the MUR-PNRR project SAMOTHRACE (ECS00000022) and by the MUR-PRIN 2022 project WATERONIC (CUP: B53D23015190006). The TEM characterization was carried out using the facilities of the Italian Infrastructure Materials and Processes Beyond Nanoscale (BeyondNano). The XPS analyses were partially supported by the national project Beyond Nano Upgrade (CUP G66J17000350007).

Data Availability Statement

The raw data supporting the conclusions of this article will be made available by the authors on request.

Acknowledgments

The authors wish to thank Giuseppe Pantè and Markus Italia (CNR-IMM) for technical assistance. G.S. and G.N. gratefully acknowledge Marco Torrisi (STMicroelectronics) for trimmer and coater access.

Conflicts of Interest

The authors declare no conflicts of interest.

References

  1. The water crisis is worsening. Researchers must tackle it together. Nature 2023, 613, 611–612. [CrossRef] [PubMed]
  2. Michalak, A.M.; Xia, J.; Brdjanovic, D.; Mbiyozo, A.-N.; Sedlak, D.; Pradeep, T.; Lall, U.; Rao, N.; Gupta, J. The Frontiers of Water and Sanitation. Nat. Water 2023, 1, 10–18. [Google Scholar] [CrossRef]
  3. Wang, J.; Chen, H. Catalytic Ozonation for Water and Wastewater Treatment: Recent Advances and Perspective. Sci. Total Environ. 2020, 704, 135249. [Google Scholar] [CrossRef] [PubMed]
  4. Shannon, M.A.; Bohn, P.W.; Elimelech, M.; Georgiadis, J.G.; Marĩas, B.J.; Mayes, A.M. Science and Technology for Water Purification in the Coming Decades. Nature 2008, 452, 301–310. [Google Scholar] [CrossRef] [PubMed]
  5. Wang, J.L.; Xu, J. Advanced Oxidation Processes for Wastewater Treatment: Formation of Hydroxyl Radical and Application. Crit. Rev. Environ. Sci. Technol. 2012, 42, 251–325. [Google Scholar] [CrossRef]
  6. Giwa, A.; Yusuf, A.; Balogun, H.A.; Sambudi, N.S.; Bilad, M.R.; Adeyemi, I.; Chakraborty, S.; Curcio, S. Recent Advances in Advanced Oxidation Processes for Removal of Contaminants from Water: A Comprehensive Review. Process Saf. Environ. Prot. 2021, 146, 220–256. [Google Scholar] [CrossRef]
  7. Chong, M.N.; Jin, B.; Chow, C.W.K.; Saint, C. Recent Developments in Photocatalytic Water Treatment Technology: A Review. Water Res. 2010, 44, 2997–3027. [Google Scholar] [CrossRef]
  8. Teoh, W.Y.; Scott, J.A.; Amal, R. Progress in Heterogeneous Photocatalysis: From Classical Radical Chemistry to Engineering Nanomaterials and Solar Reactors. J. Phys. Chem. Lett. 2012, 3, 629–639. [Google Scholar] [CrossRef] [PubMed]
  9. Li, X.; Yu, J.; Jaroniec, M. Hierarchical Photocatalysts. Chem. Soc. Rev. 2016, 45, 2603–2636. [Google Scholar] [CrossRef]
  10. Gaya, U.I.; Abdullah, A.H. Heterogeneous Photocatalytic Degradation of Organic Contaminants over Titanium Dioxide: A Review of Fundamentals, Progress and Problems. J. Photochem. Photobiol. C Photochem. Rev. 2008, 9, 1–12. [Google Scholar] [CrossRef]
  11. Chen, X.; Mao, S.S. Titanium Dioxide Nanomaterials: Synthesis, Properties, Modifications and Applications. Chem. Rev. 2007, 107, 2891–2959. [Google Scholar] [CrossRef] [PubMed]
  12. Akpan, U.G.; Hameed, B.H. Parameters Affecting the Photocatalytic Degradation of Dyes Using TiO2-Based Photocatalysts: A Review. J. Hazard. Mater. 2009, 170, 520–529. [Google Scholar] [CrossRef] [PubMed]
  13. Zhao, Y.; Linghu, X.; Shu, Y.; Zhang, J.; Chen, Z.; Wu, Y.; Shan, D.; Wang, B. Classification and Catalytic Mechanisms of Heterojunction Photocatalysts and the Application of Titanium Dioxide (TiO2)-Based Heterojunctions in Environmental Remediation. J. Environ. Chem. Eng. 2022, 10, 108077. [Google Scholar] [CrossRef]
  14. Huang, X.; Zeng, Z.; Zhang, H. Metal Dichalcogenide Nanosheets: Preparation, Properties and Applications. Chem. Soc. Rev. 2013, 42, 1934–1946. [Google Scholar] [CrossRef] [PubMed]
  15. Wei, Z.; Li, B.; Xia, C.; Cui, Y.; He, J.; Xia, J.B.; Li, J. Various Structures of 2D Transition-Metal Dichalcogenides and Their Applications. Small Methods 2018, 2, 1800094. [Google Scholar] [CrossRef]
  16. Kite, S.V.; Kadam, A.N.; Sathe, D.J.; Patil, S.; Mali, S.S.; Hong, C.K.; Lee, S.W.; Garadkar, K.M. Nanostructured TiO2 Sensitized with MoS2 Nanoflowers for Enhanced Photodegradation Efficiency toward Methyl Orange. ACS Omega 2021, 6, 17071–17085. [Google Scholar] [CrossRef] [PubMed]
  17. Ren, Y.; Dong, Y.; Feng, Y.; Xu, J. Compositing Two-Dimensional Materials with TiO2 for Photocatalysis. Catalysts 2018, 8, 590. [Google Scholar] [CrossRef]
  18. Chen, B.; Meng, Y.; Sha, J.; Zhong, C.; Hu, W.; Zhao, N. Preparation of MoS2/TiO2 Based Nanocomposites for Photocatalysis and Rechargeable Batteries: Progress, Challenges, and Perspective. Nanoscale 2018, 10, 34–68. [Google Scholar] [CrossRef] [PubMed]
  19. Narayan, R. Use of Nanomaterials in Water Purification. Mater. Today 2010, 13, 44–46. [Google Scholar] [CrossRef]
  20. Scuderi, V.; Impellizzeri, G.; Zimbone, M.; Sanz, R.; Di Mauro, A.; Buccheri, M.A.; Miritello, M.; Terrasi, A.; Rappazzo, G.; Nicotra, G.; et al. Rapid Synthesis of Photoactive Hydrogenated TiO2 Nanoplumes. Appl. Catal. B 2016, 183, 328–334. [Google Scholar] [CrossRef]
  21. Scuderi, V.; Impellizzeri, G.; Romano, L.; Scuderi, M.; Brundo, M.V.; Bergum, K.; Zimbone, M.; Sanz, R.; Buccheri, M.A.; Simone, F.; et al. An Enhanced Photocatalytic Response of Nanometric TiO2 wrapping of Au Nanoparticles for Eco-Friendly Water Applications. Nanoscale 2014, 6, 11189–11195. [Google Scholar] [CrossRef] [PubMed]
  22. Scuderi, V.; Impellizzeri, G.; Romano, L.; Scuderi, M.; Nicotra, G.; Bergum, K.; Irrera, A.; Svensson, B.G.; Privitera, V. TiO2-Coated Nanostructures for Dye Photo-Degradation in Water. Nanoscale Res. Lett. 2014, 9, 458. [Google Scholar] [CrossRef] [PubMed]
  23. Giuffrida, F.; Calcagno, L.; Leonardi, A.A.; Cantarella, M.; Zimbone, M.; Impellizzeri, G. Enhancing the Photocatalytic Properties of Doped TiO2 Nanowires Grown by Seed-Assisted Thermal Oxidation. Thin Solid Film 2023, 771, 139783. [Google Scholar] [CrossRef]
  24. Ohtani, B.; Prieto-Mahaney, O.O.; Li, D.; Abe, R. What Is Degussa (Evonic) P25? Crystalline Composition Analysis, Reconstruction from Isolated Pure Particles and Photocatalytic Activity Test. J. Photochem. Photobiol. A Chem. 2010, 216, 179–182. [Google Scholar] [CrossRef]
  25. Alipoori, S.; Rouhi, H.; Linn, E.; Stumpfl, H.; Mokarizadeh, H.; Esfahani, M.R.; Koh, A.; Weinman, S.T.; Wujcik, E.K. Polymer-Based Devices and Remediation Strategies for Emerging Contaminants in Water. ACS Appl. Polym. Mater. 2021, 3, 549–577. [Google Scholar] [CrossRef]
  26. Cantarella, M.; Impellizzeri, G.; Di Mauro, A.; Privitera, V.; Carroccio, S.C. Innovative Polymeric Hybrid Nanocomposites for Application in Photocatalysis. Polymers 2021, 13, 1184. [Google Scholar] [CrossRef] [PubMed]
  27. Cantarella, M.; Sanz, R.; Buccheri, M.A.; Ruffino, F.; Rappazzo, G.; Scalese, S.; Impellizzeri, G.; Romano, L.; Privitera, V. Immobilization of Nanomaterials in PMMA Composites for Photocatalytic Removal of Dyes, Phenols and Bacteria from Water. J. Photochem. Photobiol. A Chem. 2016, 321, 1–11. [Google Scholar] [CrossRef]
  28. Ali, U.; Karim, K.J.B.A.; Buang, N.A. A Review of the Properties and Applications of Poly (Methyl Methacrylate) (PMMA). Polym. Rev. 2015, 55, 678–705. [Google Scholar] [CrossRef]
  29. Bhatt, A.; Singh, V.; Bamola, P.; Aswal, D.; Rawat, S.; Rana, S.; Dwivedi, C.; Singh, B.; Sharma, H. Enhanced Piezoelectric Response Using TiO2/MoS2 Heterostructure Nanofillers in PVDF Based Nanogenerators. J. Alloys Compd. 2023, 960, 170664. [Google Scholar] [CrossRef]
  30. Chang, Z.; Sun, X.; Liao, Z.; Liu, Q.; Han, J. Design and Preparation of Polyimide/TiO2@MoS2 Nanofibers by Hydrothermal Synthesis and Their Photocatalytic Performance. Polymers 2022, 14, 3230. [Google Scholar] [CrossRef]
  31. Li, Y.; Wang, Z.; Zhao, H.; Huang, X.; Yang, M. 3D MoS2@TiO2@poly(Methyl Methacrylate) Nanocomposite with Enhanced Photocatalytic Activity. J. Colloid Interface Sci. 2019, 557, 709–721. [Google Scholar] [CrossRef] [PubMed]
  32. Cantarella, M.; Gorrasi, G.; Di Mauro, A.; Scuderi, M.; Nicotra, G.; Fiorenza, R.; Scirè, S.; Scalisi, M.E.; Brundo, M.V.; Privitera, V.; et al. Mechanical Milling: A Sustainable Route to Induce Structural Transformations in MoS2 for Applications in the Treatment of Contaminated Water. Sci. Rep. 2019, 9, 974. [Google Scholar] [CrossRef] [PubMed]
  33. Makuła, P.; Pacia, M.; Macyk, W. How To Correctly Determine the Band Gap Energy of Modified Semiconductor Photocatalysts Based on UV-Vis Spectra. J. Phys. Chem. Lett. 2018, 9, 6814–6817. [Google Scholar] [CrossRef] [PubMed]
  34. Serpone, N.; Salinaro, A. Terminology, Relative Photonic Efficiencies and Quantum Yields in Heterogeneous Photocatalysis. Part I: Suggested Protocol. Pure Appl. Chem. 1999, 71, 303–320. [Google Scholar] [CrossRef]
  35. Serpone, N. Relative Photonic Efficiencies and Quantum Yields in Heterogeneous Photocatalysis. J. Photochem. Photobiol. A Chem. 1997, 104, 1–12. [Google Scholar] [CrossRef]
  36. Howard, C.J.; Sabine, T.M.; Dickson, F. Structural and Thermal Parameters for Rutile and Anatase. Acta Crystallogr. Sect. B 1978, 34, 462–468. [Google Scholar] [CrossRef]
  37. Schonfeld, B.B.; Huang, J.J.; Moss, S.C. The XRAY System. Z. Anorg. Allg. Chem. 1965, 338, 404–407. [Google Scholar]
  38. Liu, B.; Han, X.; Wu, Y.; Xue, Y.; Shi, H. Facile Synthesis of Controllable Carbonate-Doped TiO2 Microspheres for Visible Light Photocatalytic Applications. J. Mater. Sci. Mater. Electron. 2019, 30, 7940–7949. [Google Scholar] [CrossRef]
  39. Liu, B.; Liu, L.M.; Lang, X.F.; Wang, H.Y.; Lou, X.W.; Aydil, E.S. Doping High-Surface-Area Mesoporous TiO2 Microspheres with Carbonate for Visible Light Hydrogen Production. Energy Environ. Sci. 2014, 7, 2592–2597. [Google Scholar] [CrossRef]
  40. Mak, K.F.; Lee, C.; Hone, J.; Shan, J.; Heinz, T.F. Atomically Thin MoS2: A New Direct-Gap Semiconductor. Phys. Rev. Lett. 2010, 105, 136805. [Google Scholar] [CrossRef]
  41. Wang, X.; Pehkonen, S.O.; Rämö, J.; Väänänen, M.; Highfield, J.G.; Laasonen, K. Experimental and Computational Studies of Nitrogen Doped Degussa P25 TiO2: Application to Visible-Light Driven Photo-Oxidation of As(Iii). Catal. Sci. Technol. 2012, 2, 784–793. [Google Scholar] [CrossRef]
  42. Ferriol, M.; Gentilhomme, A.; Cochez, M.; Oget, N.; Mieloszynski, J.L. Thermal Degradation of Poly(Methyl Methacrylate) (PMMA): Modelling of DTG and TG Curves. Polym. Degrad. Stab. 2003, 79, 271–281. [Google Scholar] [CrossRef]
  43. Law, K.Y. Definitions for Hydrophilicity, Hydrophobicity, and Superhydrophobicity: Getting the Basics Right. J. Phys. Chem. Lett. 2014, 5, 686–688. [Google Scholar] [CrossRef] [PubMed]
  44. Farhan Hanafi, M.; Sapawe, N. A Review on the Water Problem Associate with Organic Pollutants Derived from Phenol, Methyl Orange, and Remazol Brilliant Blue Dyes. Mater. Today Proc. 2020, 31, A141–A150. [Google Scholar] [CrossRef]
  45. Alessandretti, I.; Rigueto, C.V.T.; Nazari, M.T.; Rosseto, M.; Dettmer, A. Removal of Diclofenac from Wastewater: A Comprehensive Review of Detection, Characteristics and Tertiary Treatment Techniques. J. Environ. Chem. Eng. 2021, 9, 106743. [Google Scholar] [CrossRef]
  46. Zhang, Y.; Geißen, S.U.; Gal, C. Carbamazepine and Diclofenac: Removal in Wastewater Treatment Plants and Occurrence in Water Bodies. Chemosphere 2008, 73, 1151–1161. [Google Scholar] [CrossRef] [PubMed]
  47. Brozinski, J.M.; Lahti, M.; Meierjohann, A.; Oikari, A.; Kronberg, L. The Anti-Inflammatory Drugs Diclofenac, Naproxen and Ibuprofen Are Found in the Bile of Wild Fish Caught Downstream of a Wastewater Treatment Plant. Environ. Sci. Technol. 2013, 47, 342–348. [Google Scholar] [CrossRef] [PubMed]
  48. Naddeo, V.; Belgiorno, V.; Ricco, D.; Kassinos, D. Degradation of Diclofenac during Sonolysis, Ozonation and Their Simultaneous Application. Ultrason. Sonochem. 2009, 16, 790–794. [Google Scholar] [CrossRef] [PubMed]
  49. Menon, H.; Gopakumar, G.; Sankaranarayanan Nair, V.; Nair, S.V.; Shanmugam, M. 2D-Layered MoS2-Incorporated TiO2-Nanofiber- Based Dye-Sensitized Solar Cells. ChemistrySelect 2018, 3, 5801–5807. [Google Scholar] [CrossRef]
  50. Fu, Y.; Ren, Z.; Wu, J.; Li, Y.; Liu, W.; Li, P.; Xing, L.; Ma, J.; Wang, H.; Xue, X. Direct Z-Scheme Heterojunction of ZnO/MoS2 Nanoarrays Realized by Flowing-Induced Piezoelectric Field for Enhanced Sunlight Photocatalytic Performances. Appl. Catal. B 2021, 285, 119785. [Google Scholar] [CrossRef]
  51. Armelao, L.; Barreca, D.; Bottaro, G.; Gasparotto, A.; Maccato, C.; Maragno, C.; Tondello, E.; Štangar, U.L.; Bergant, M.; Mahne, D. Photocatalytic and Antibacterial Activity of TiO2 and Au/TiO2 Nanosystems. Nanotechnology 2007, 18, 375709. [Google Scholar] [CrossRef]
Figure 1. Pictures of the prepared composites: PMMA, TiO2—PMMA, TiO2—10% MoS2—PMMA, TiO2—20% MoS2—PMMA, TiO2—30% MoS2—PMMA.
Polymers 16 01200 g001
Figure 2. HAADF S-TEM picture of the TiO2—10% MoS2—PMMA sample (a); Ti (yellow), O (green), Mo (cyan), and S (blue) elemental distribution extracted by the fitting of EELS spectra collected in SI mode (b); diffraction patterns of the TiO2—10% MoS2—PMMA sample showing diffraction spots from anatase-TiO2 (a-TiO2), rutile TiO2 (r-TiO2), and MoS2 (c).
Polymers 16 01200 g002
Figure 3. X-ray diffractograms of TiO2—PMMA (red curve) and TiO2—10% MoS2—PMMA (blue curve). The peaks corresponding to TiO2 and MoS2, respectively, are specified.
Polymers 16 01200 g003
Figure 4. XPS spectra recorded for (a) Ti2p, (b) O1s, (c) Mo3d, and (d) S2p for the different samples.
Polymers 16 01200 g004
Figure 5. (100-Reflectance)% spectra of MoS2 (a), TiO2—PMMA (b), and TiO2—30% MoS2—PMMA (c) sample. The insets of the figures show the Tauc-plots (continuous line) and the relative fit (dashed line) for all the samples.
Polymers 16 01200 g005
Figure 6. (a) Thermogravimetry (TGA) and (b) derivative thermogravimetry (DTG) thermograms of the studied samples. The number 1, 2 and 3 represent typical three-step decomposition of PMMA.
Polymers 16 01200 g006
Figure 7. MO photo-degradation under UV light irradiation for six aqueous solutions with MO (diamonds), MO with PMMA (pentagons), MO with TiO2—PMMA composite (squares), MO with TiO2—10% MoS2—PMMA composite (circles), MO with TiO2—20% MoS2—PMMA composite (up-triangles), MO with TiO2—30% MoS2—PMMA composite (down-triangles). The grey region indicates the preliminary adsorption test in the dark.
Polymers 16 01200 g007
Figure 8. Diclofenac photo-degradation under UV light irradiation for six aqueous solutions with diclofenac (diamonds), diclofenac with PMMA (pentagons), diclofenac with TiO2—PMMA composite (squares), diclofenac with TiO2—10% MoS2—PMMA composite (circles), diclofenac with TiO2—20% MoS2—PMMA composite (up-triangles), diclofenac with TiO2—30% MoS2—PMMA composite (down-triangles). The grey region indicates the preliminary adsorption test in the dark.
Polymers 16 01200 g008
Figure 9. XRD patterns of TiO2—10% MoS2—PMMA samples after the photocatalytic degradation test of MO (yellow curve) and after the photocatalytic degradation test of diclofenac (green curve).
Polymers 16 01200 g009
Figure 10. Schematic illustration of the photocatalytic process in the presence of MoS2 as co-catalyst.
Polymers 16 01200 g010
Table 1. Peak position and phase identification taken from the diffraction patterns in Figure 3.
Sample2θ (°)Interplanar Distance (nm)Phase
TiO2—PMMA35.990.249Rutile (101)
37.080.242Anatase (103)
37.840.238Anatase (004)
38.740.232Anatase (112)
TiO2—10% MoS2—PMMA32.780.273MoS2 (100)
33.600.267MoS2 (101)
35.960.250Rutile (101)
37.830.238Anatase (004)
38.740.232Anatase (112)
39.620.227MoS2 (103)
Table 2. Onset temperature (Tonset), weight loss, peak temperature (Tpeak), and residue at 600 °C of the analyzed samples.
Sample Tonset [°C]Weight Loss [%]Tpeak [°C]Residue [%]
PMMA and TiO2—PMMA(1)1444.61631.2
(2)25934.6311
(3)34059.6395
TiO2—10% MoS2—PMMA(1)1466.81784.8
(2)25528.9300
(3)32159.5388
TiO2—20% MoS2—PMMA(1)1456.61955.9
(2)25029.6298
(3)31957.9385
TiO2—30% MoS2—PMMA(1)1485.51967.9
(2)24226.9295
(3)32359.7389
Table 3. Values of the contact angles for all the studied samples: PMMA, TiO2—PMMA, TiO2—10% MoS2—PMMA, TiO2—20% MoS2—PMMA, TiO2—30% MoS2—PMMA.
SampleContact Angle (°)
PMMA82 ± 7
TiO2—PMMA78 ± 8
TiO2—10% MoS2—PMMA 77 ± 8
TiO2—20% MoS2—PMMA 76 ± 7
TiO2—30% MoS2—PMMA 87 ± 9
Table 4. Degradation rates of MO at different percentages (0–30%) of MoS2 in the samples.
SamplekMO (min−1)
TiO2—PMMA(1.51 ± 0.08) × 10−3
TiO2—10% MoS2—PMMA (2.20 ± 0.11) × 10−3
TiO2—20% MoS2—PMMA (1.91 ± 0.10) × 10−3
TiO2—30% MoS2—PMMA (1.71 ± 0.09) × 10−3
Table 5. Photonic efficiency for the MO degradation at different percentages (0–30%) of MoS2 in the samples.
SampleξMO (%)
TiO2—PMMA0.0144 ± 0.001
TiO2—10% MoS2—PMMA 0.0172 ± 0.001
TiO2—20% MoS2—PMMA 0.0163 ± 0.001
TiO2—30% MoS2—PMMA 0.0151 ± 0.001
Table 6. Degradation rates of diclofenac at different percentages (0–30%) of MoS2 in the samples.
Samplekdiclofenac (min−1)
TiO2—PMMA(0.64 ± 0.03) × 10−3
TiO2—10% MoS2—PMMA (1.15 ± 0.60) × 10−3
TiO2—20% MoS2—PMMA (1.04 ± 0.06) × 10−3
TiO2—30% MoS2—PMMA (0.97 ± 0.05) × 10−3
Table 7. Photonic efficiency for the diclofenac degradation at different percentages (0–30%) of MoS2 in the samples.
Sampleξdiclofenac (%)
TiO2—PMMA0.0071 ± 0.001
TiO2—10% MoS2—PMMA 0.0098 ± 0.001
TiO2—20% MoS2—PMMA 0.0093 ± 0.001
TiO2—30% MoS2—PMMA 0.0088 ± 0.001
Disclaimer/Publisher’s Note: The statements, opinions and data contained in all publications are solely those of the individual author(s) and contributor(s) and not of MDPI and/or the editor(s). MDPI and/or the editor(s) disclaim responsibility for any injury to people or property resulting from any ideas, methods, instructions or products referred to in the content.

