
Towards the Effectiveness of 3D Printing on Tactile Content Creation for Visually Impaired Users

Abstract
:1. Introduction
2. Tactile Content Manufacturing
3. Methodology
3.1. Material Selection
- Pine cardboard: white cardboard, thought, solid, thin, and sold by weight. It has two faces with different textures and colors. One, lighter, is also rougher than the other (Figure 1f,g).
- Lisolene: found and known by this name in commerce, it was later discovered to be a polyethylene laminate, one of the simplest, most produced, and lowest-priced synthetic polymers. It has two faces with different textures: one is completely smooth (Figure 1a3), and the other has a pattern of small dots that do not reach the smooth side (Figure 1a2). It was acquired in two colors, transparent and opaque black (Figure 1a1), to analyze the hypothesis that color affects thermal energy exchange and, consequently, adhesion.
- TNT: non-woven fabric or not woven, are agglomerated fibers without the formation of a mesh (Figure 1c). In a later discovery, it was found that the fibers are fixed by a polypropylene resin, the second-most commonly produced synthetic polymer. The density of the acquired sample was 80 g/m2.
- EVA: ethylene vinyl acetate is sold as a sheet of soft and flexible synthetic polymer. It is usually specified by the thickness of the sheet. The one used was purchased as 2.5 mm thick (Figure 1b).
- Blackout/Transparent/Lamicel: sold under these different names, several samples were purchased only to discover later that it is the same material, polyvinyl chloride, abbreviated as PVC. In this case, it is presented as transparent, smooth, and flexible sheets that, when folded, form and maintain a rounded crease (Figure 1i).
- Vergé paper: similar to sulfite paper, but with visible internal horizontal lines resulting from the manufacturing process. The sample used had a density of 120 g/m2 (Figure 1h).
3.2. Tests Methodology
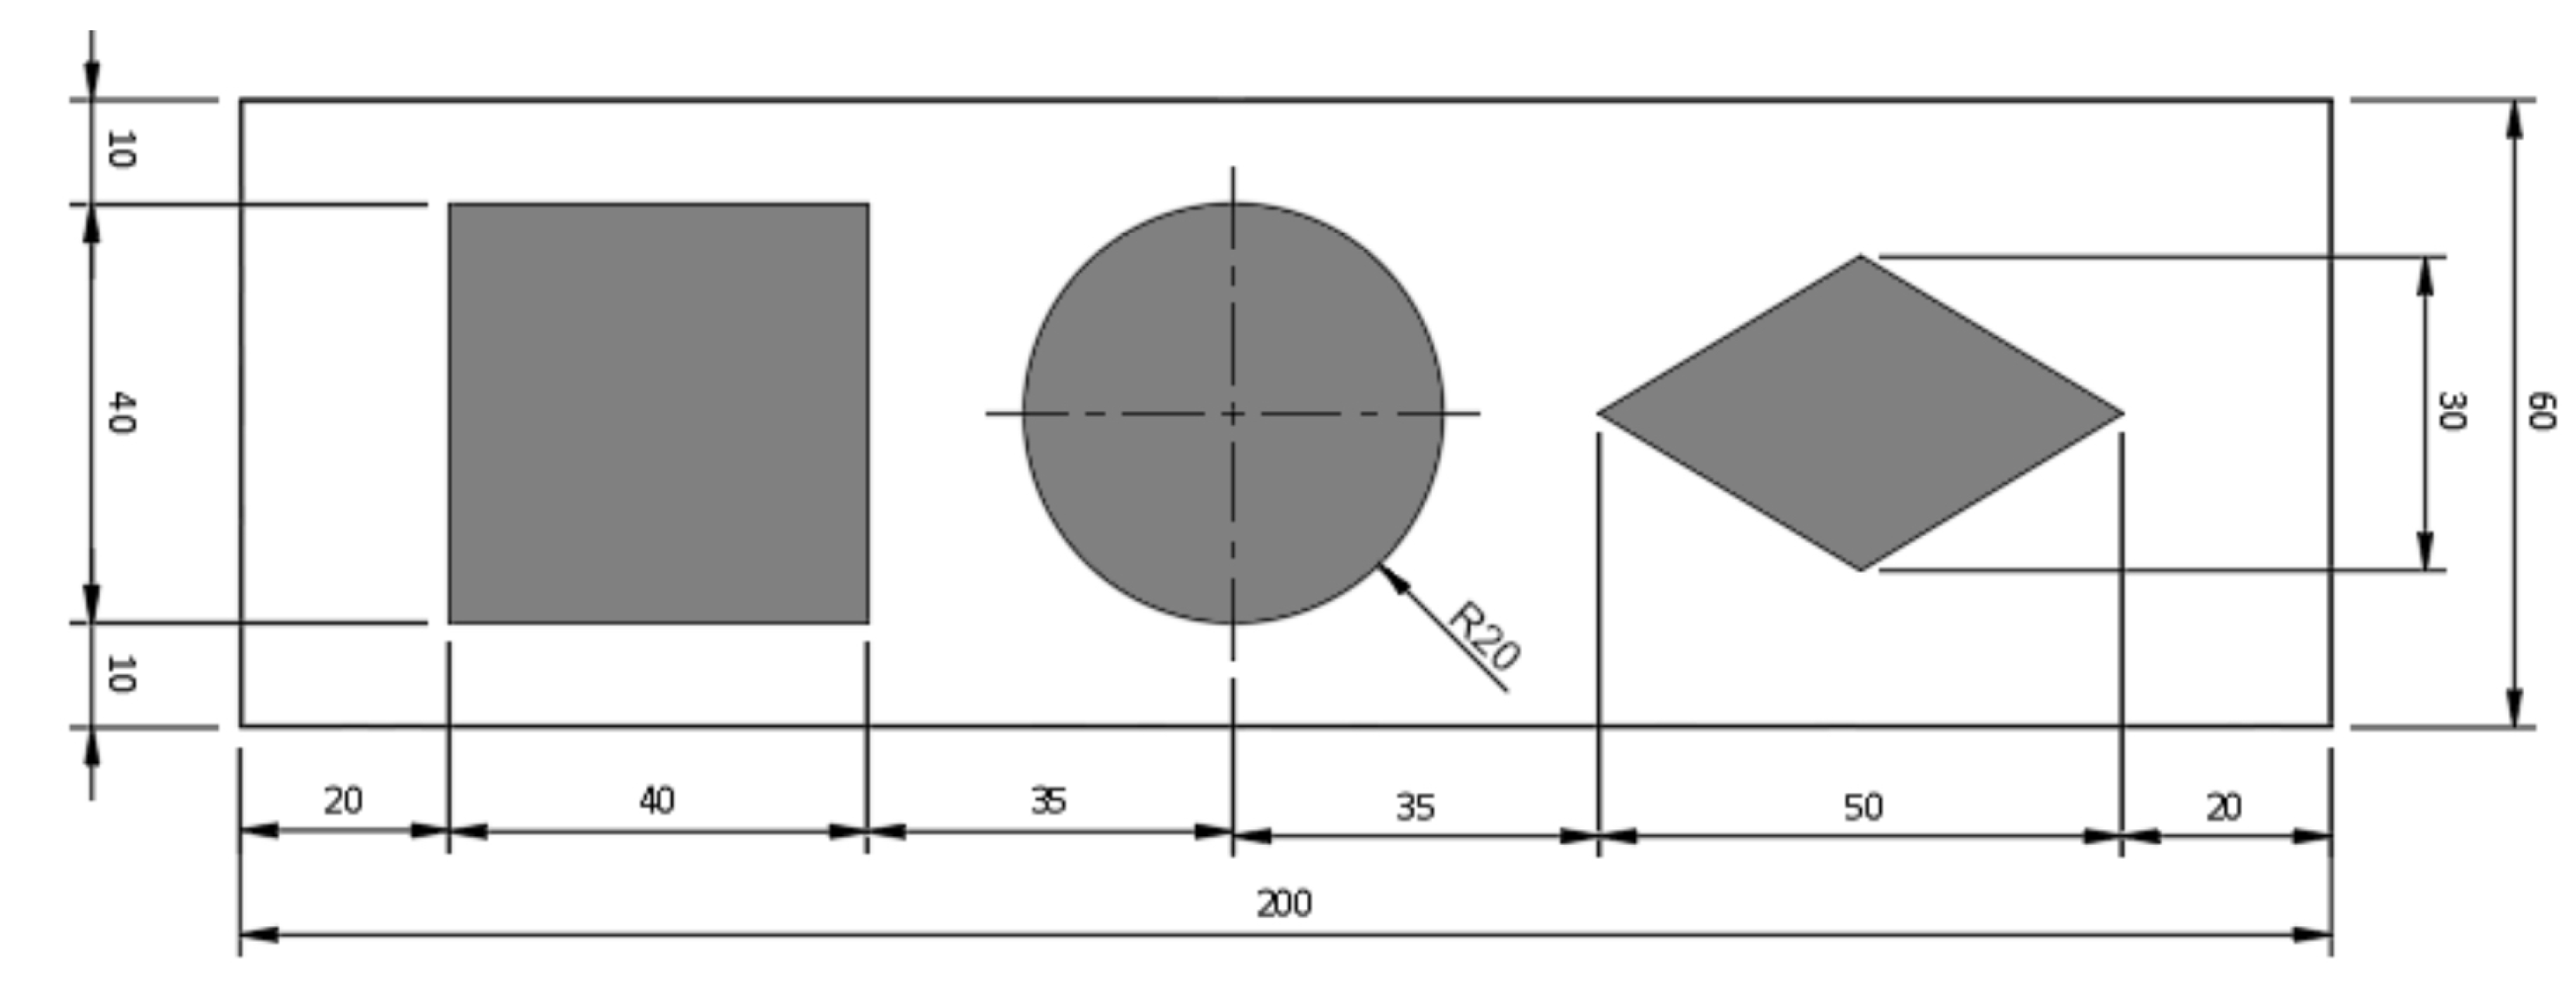
- 1.
- The material to be tested was cut into rectangles of the same size for each test set and labeled for discrimination.
- 2.
- The rectangle was then fixed to the bottom left corner (from a top view) of the printer table (coordinate x = 0, y = 0) with adhesive tape.
- 3.
- The desired shapes were printed onto the rectangles.
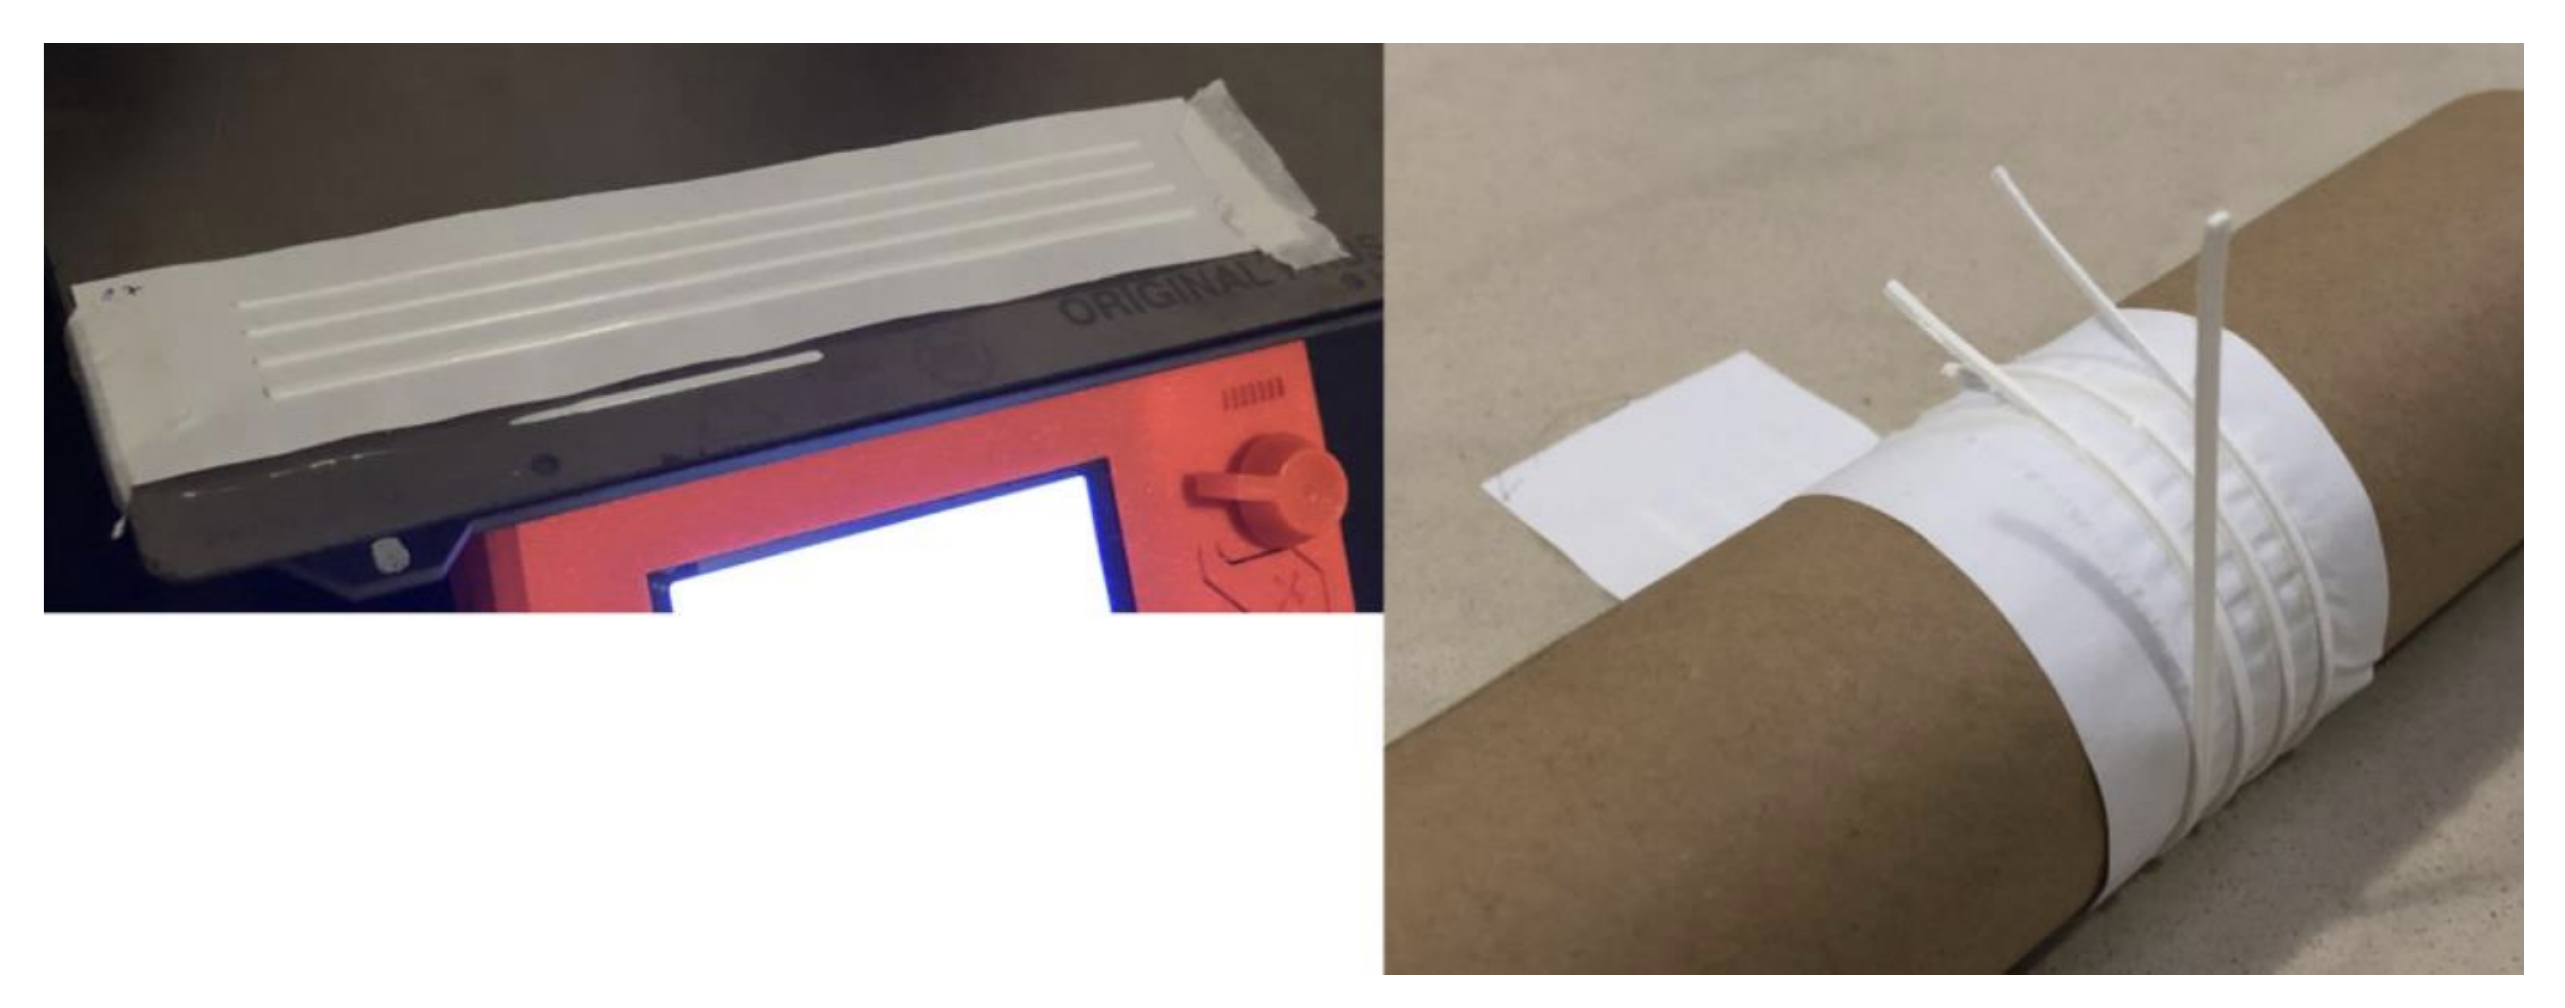
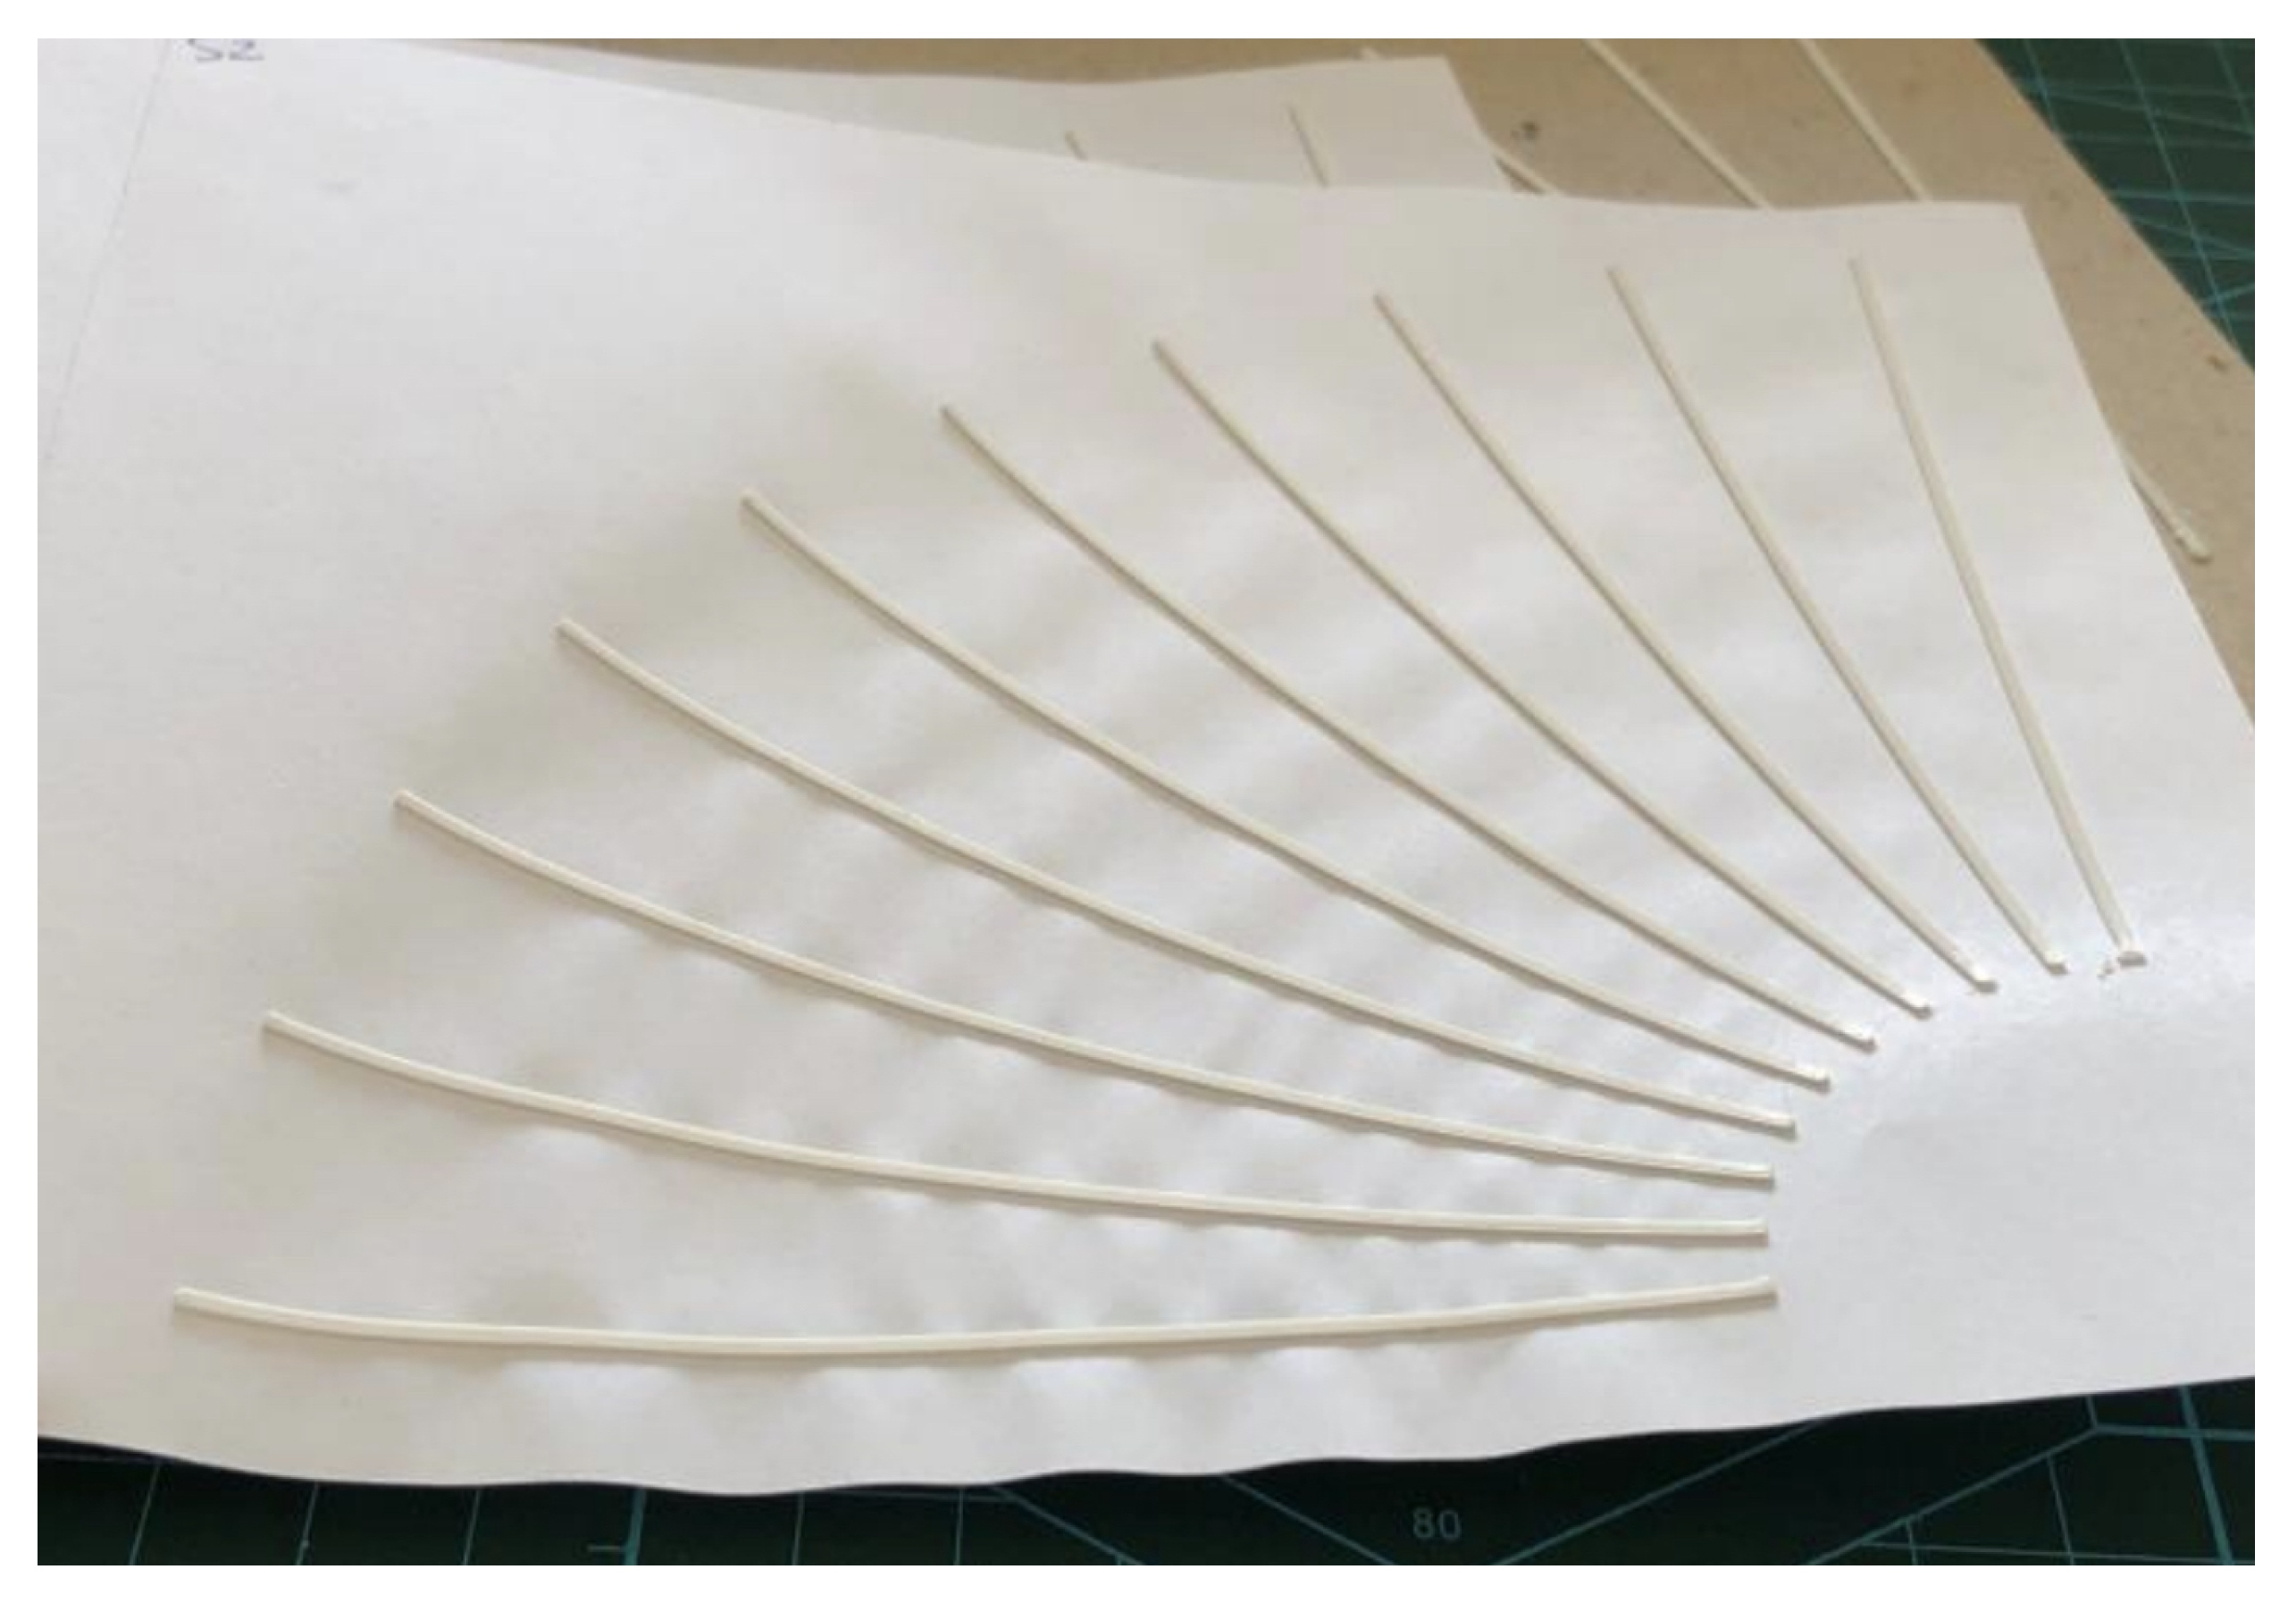
- 4.
- After the printed sample was cooled, the rectangle was removed and fixed with adhesive tape to a cylinder with a radius of 22.85 mm.
- 5.
- The set was rested on a flat and rigid surface so that the printed figure faced downwards.
- 6.
- The cylinder was then rolled, causing the support material and, consequently, the printed material to roll around it.
- 7.
- When the rotation was completed, the tape was released and the material was guided forward to allow it to continue rolling to the end without rolling over itself, as the circumference of the cylinder was smaller than the length of some samples.
- 8.
- It was then removed from the cylinder, and the adhesion of the printed material was analyzed.
- 9.
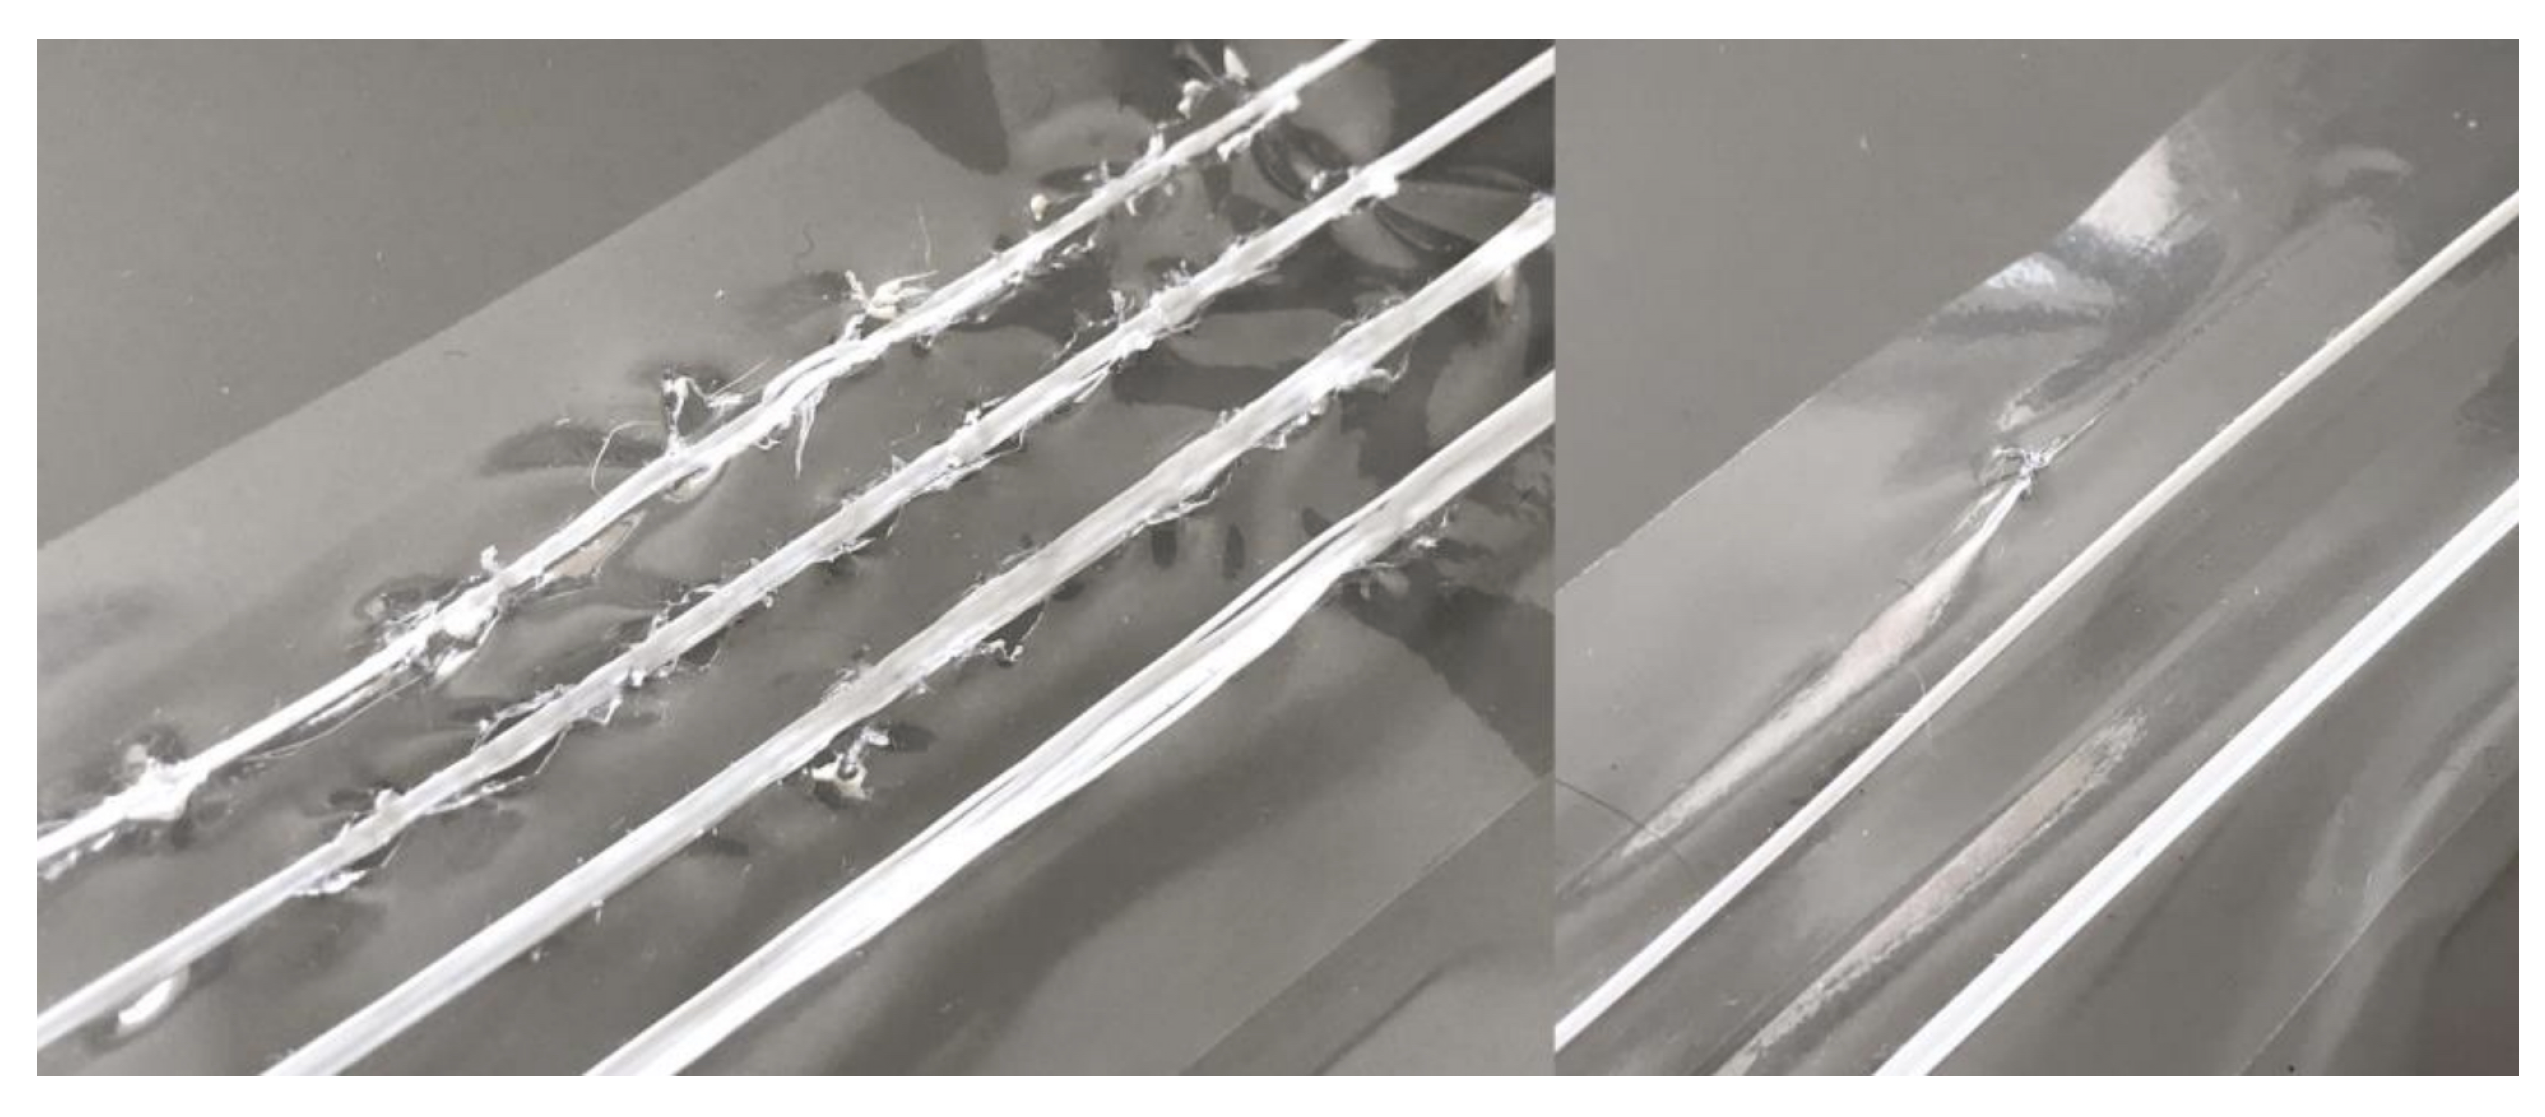
- If there was any detachment, the distance in a straight line from the detached end of the printed piece to the point where it was still fixed was measured (Figure 2).
- 10.
- The material was then removed and fixed again to the cylinder, now on the opposite side to that used in the previous step, and the rolling and measurement process was repeated, thus using the opposite direction of rotation for a second measurement.
- 11.
- The two measurements were recorded in a spreadsheet.
4. Tests
4.1. Adhesion
4.2. Angles
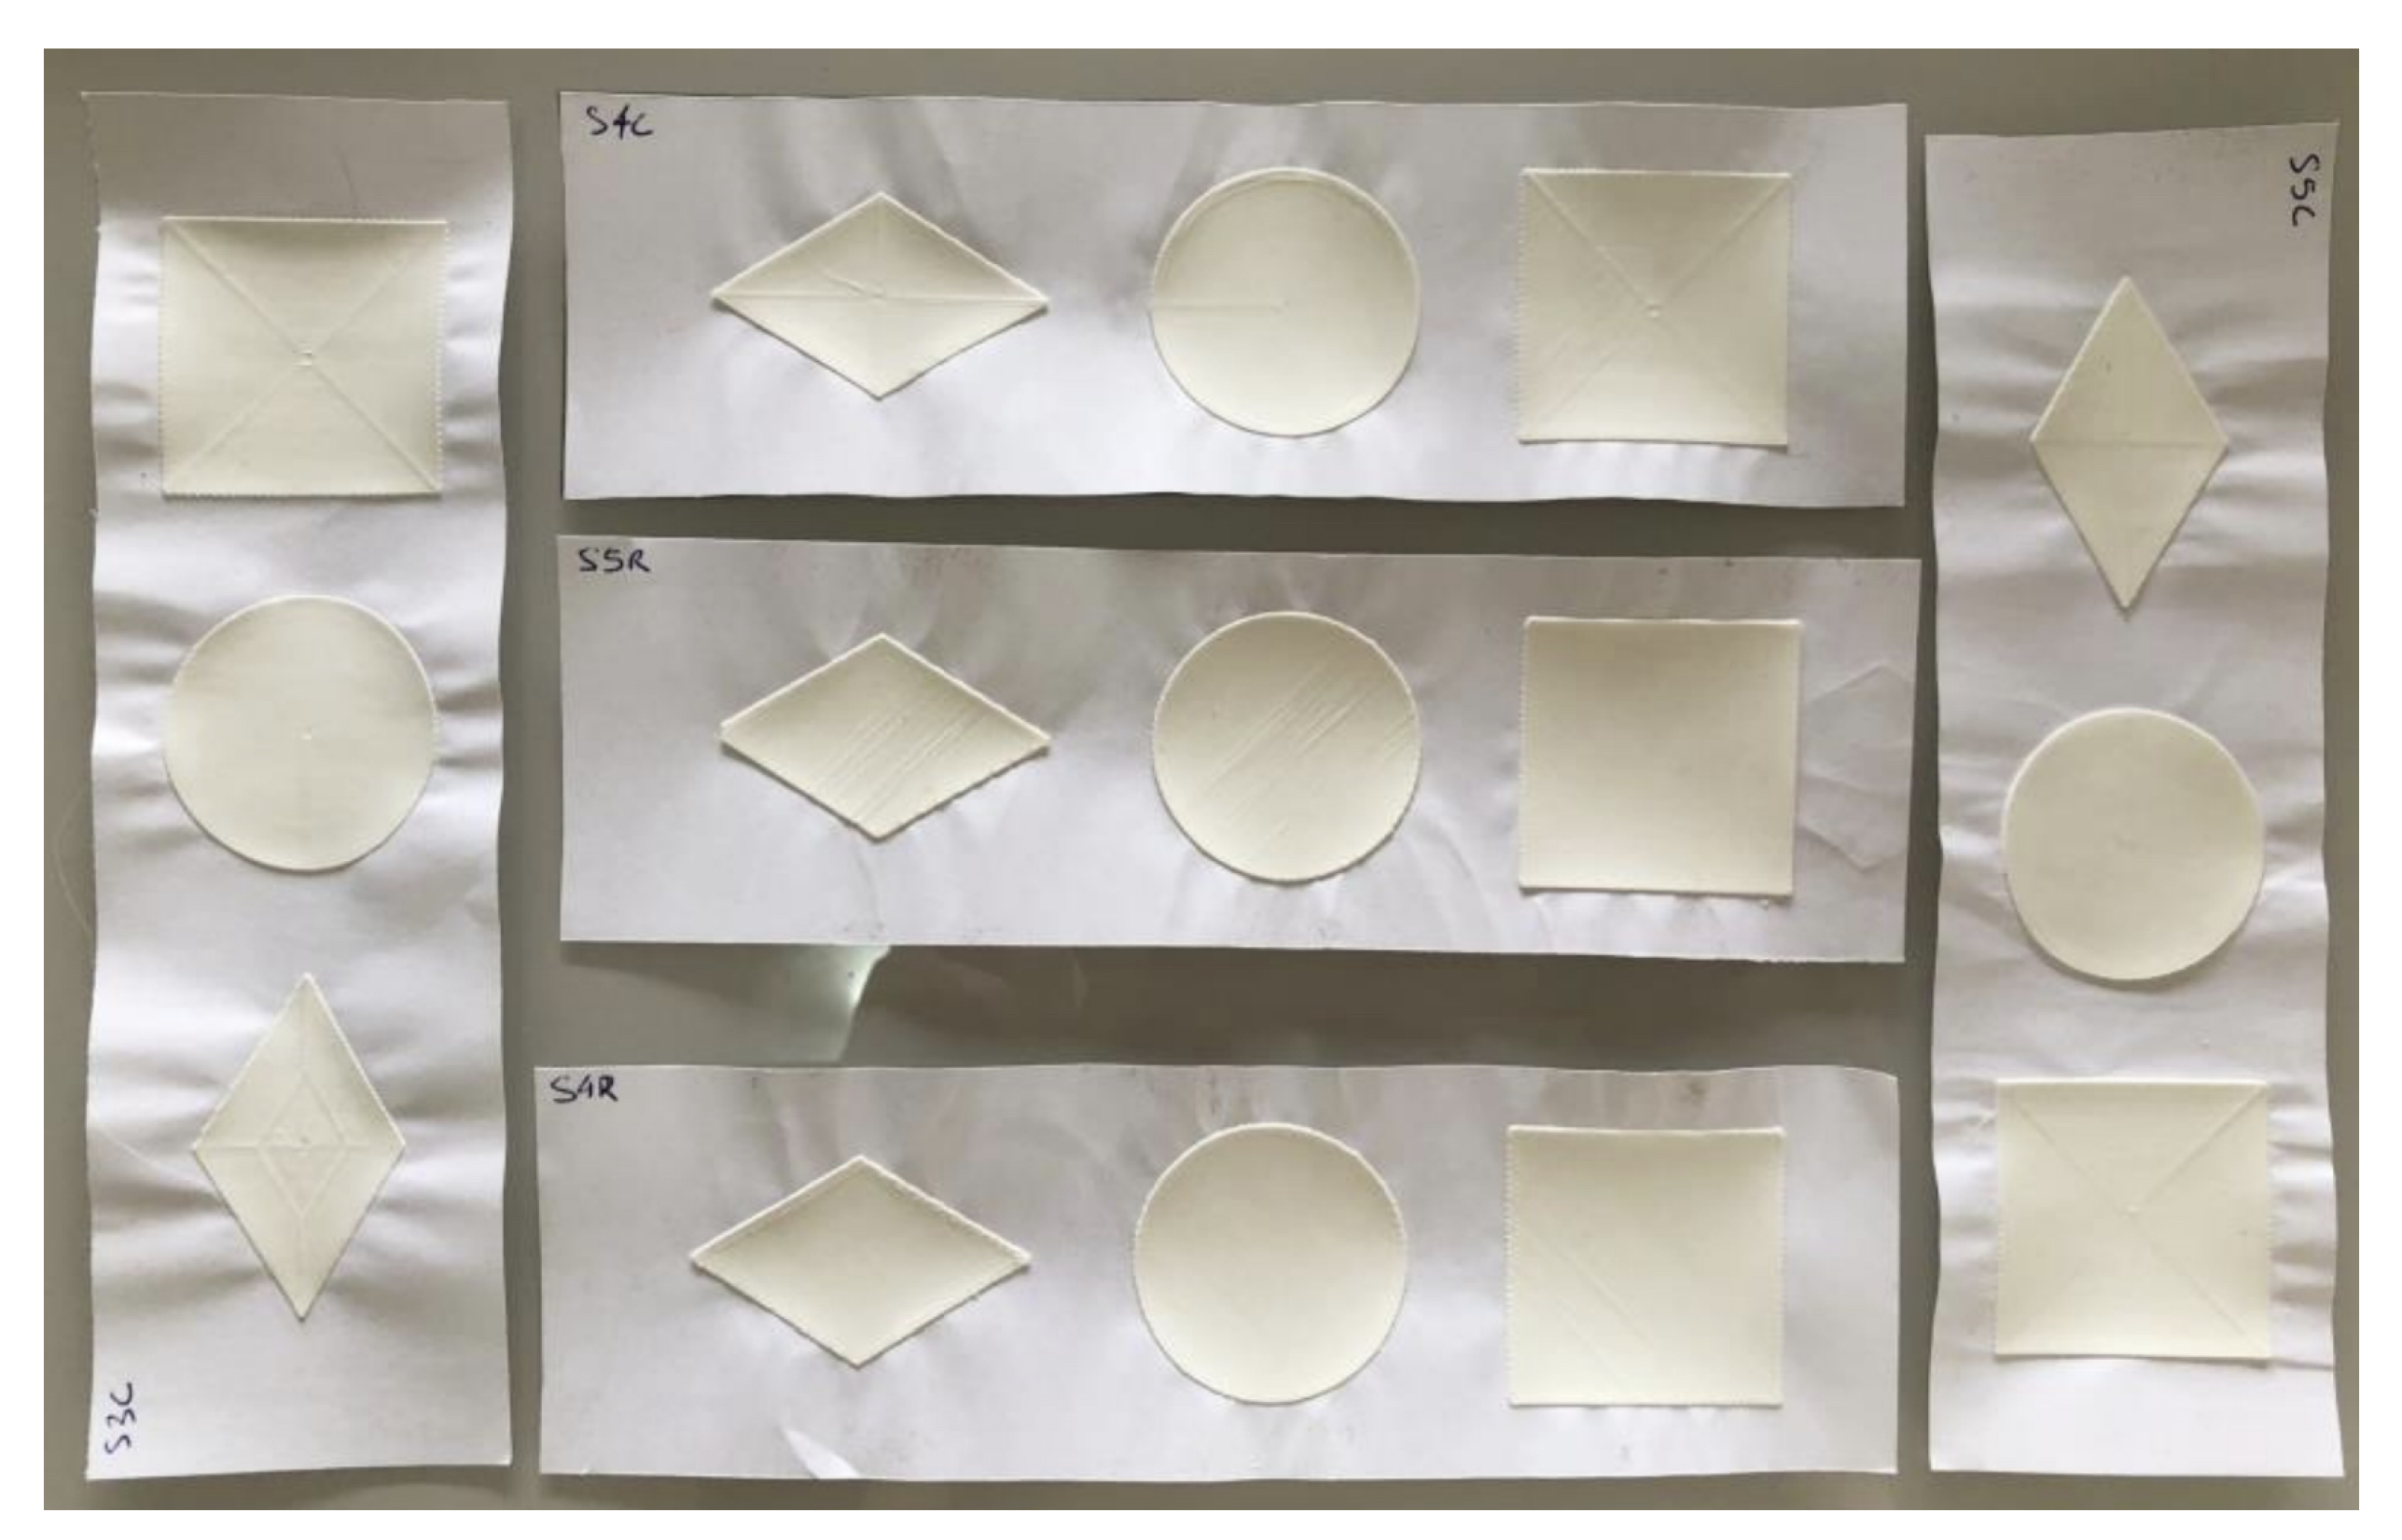
4.3. Surfaces and Shapes
5. Results and Analysis
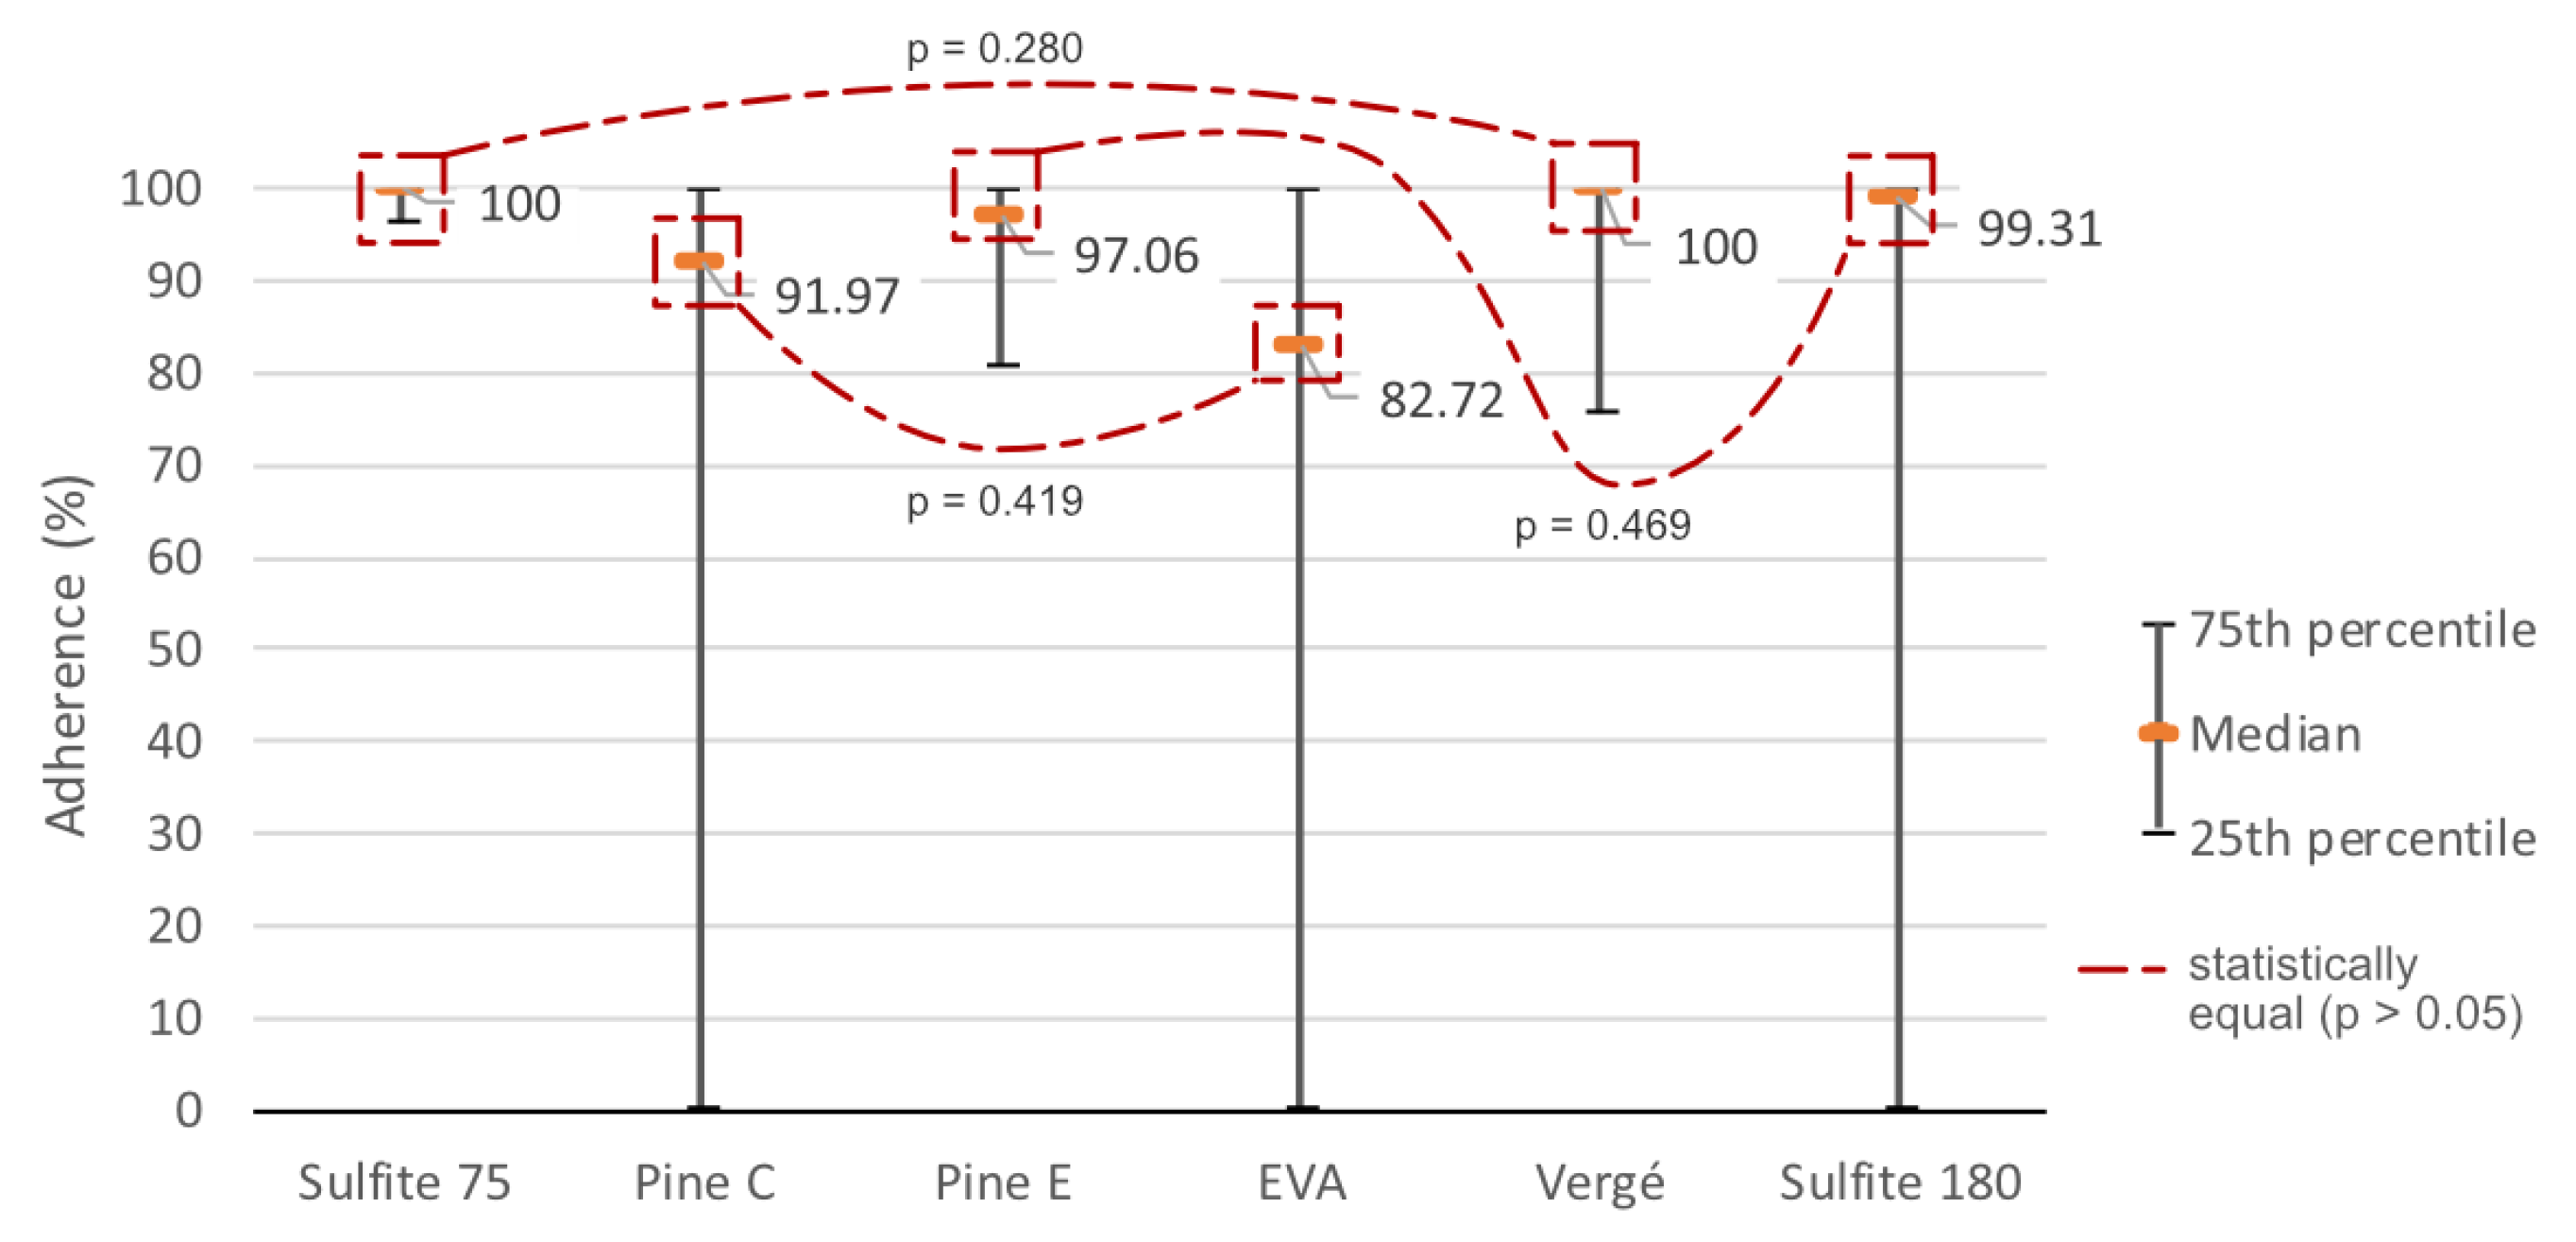
5.1. Material Adhesion
- 75 g/m2 sulfite paper
- Lisolene (polyethylene)
- 80 g/m2 TNT
- Pine cardboard
- EVA
- Lamicel (PVC)
- Vergé paper 120 g/m2
- Sulfite paper 180 g/m2
- Behaviors and Performance
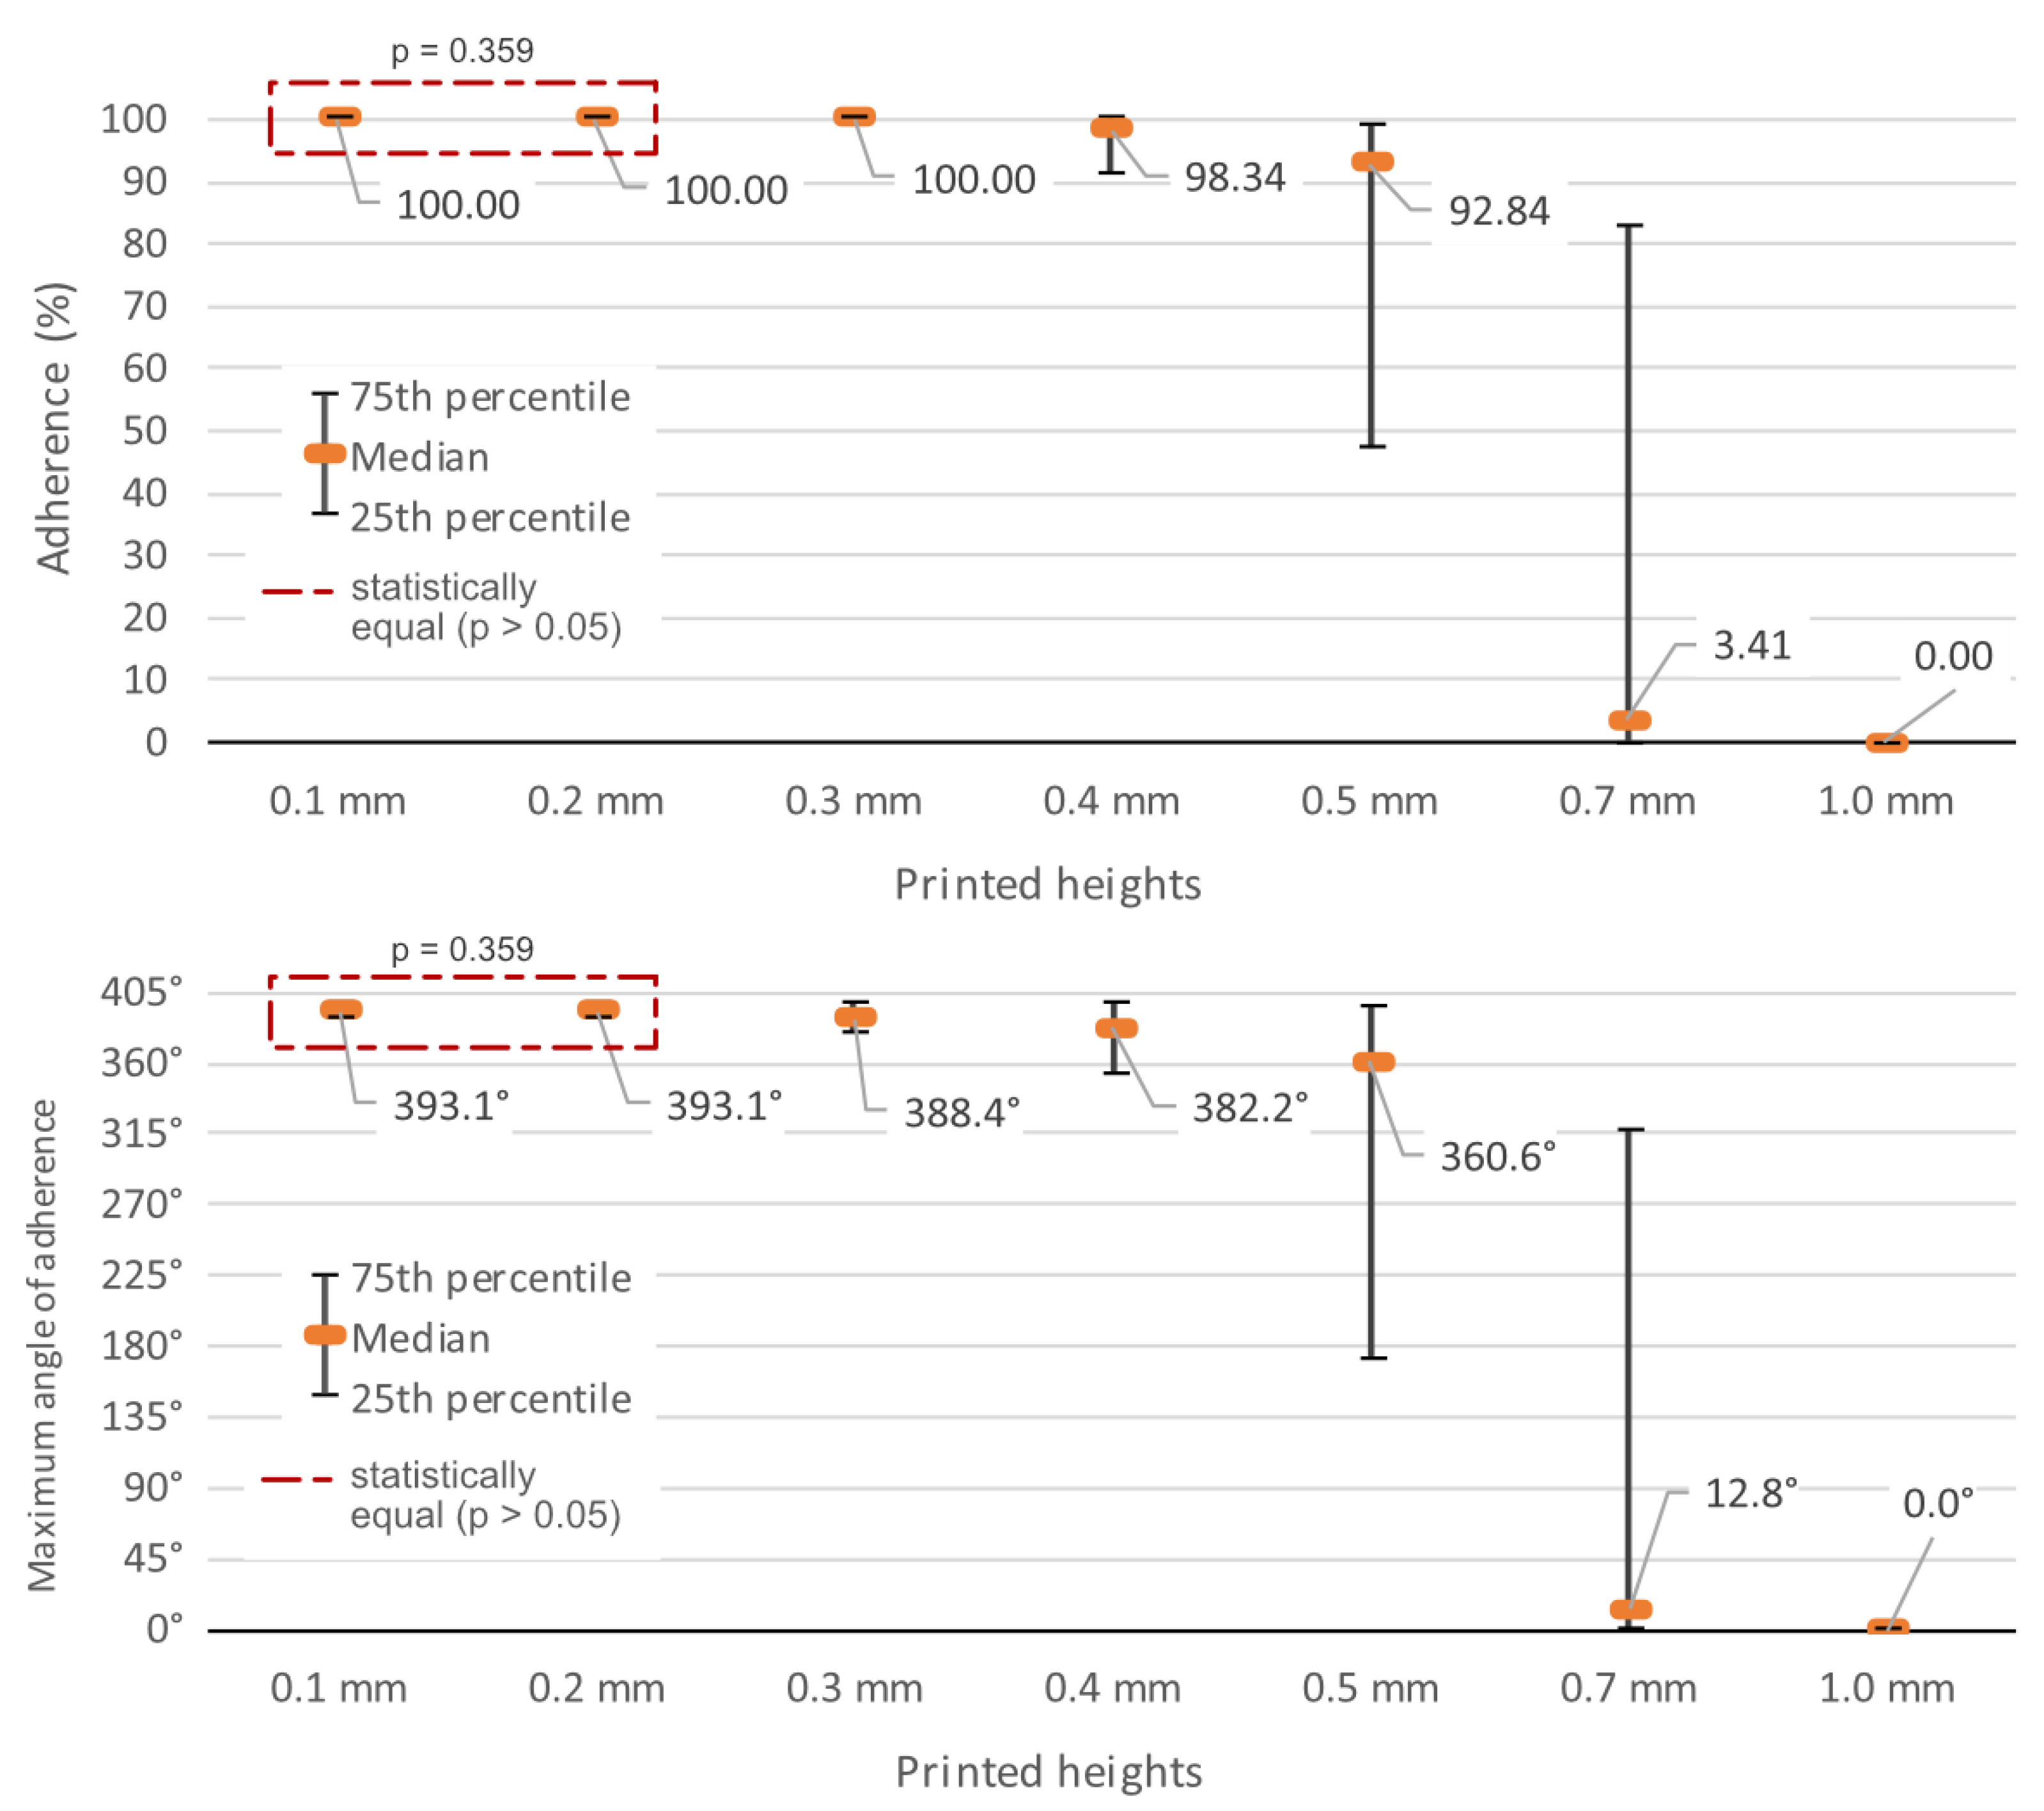
5.2. Height
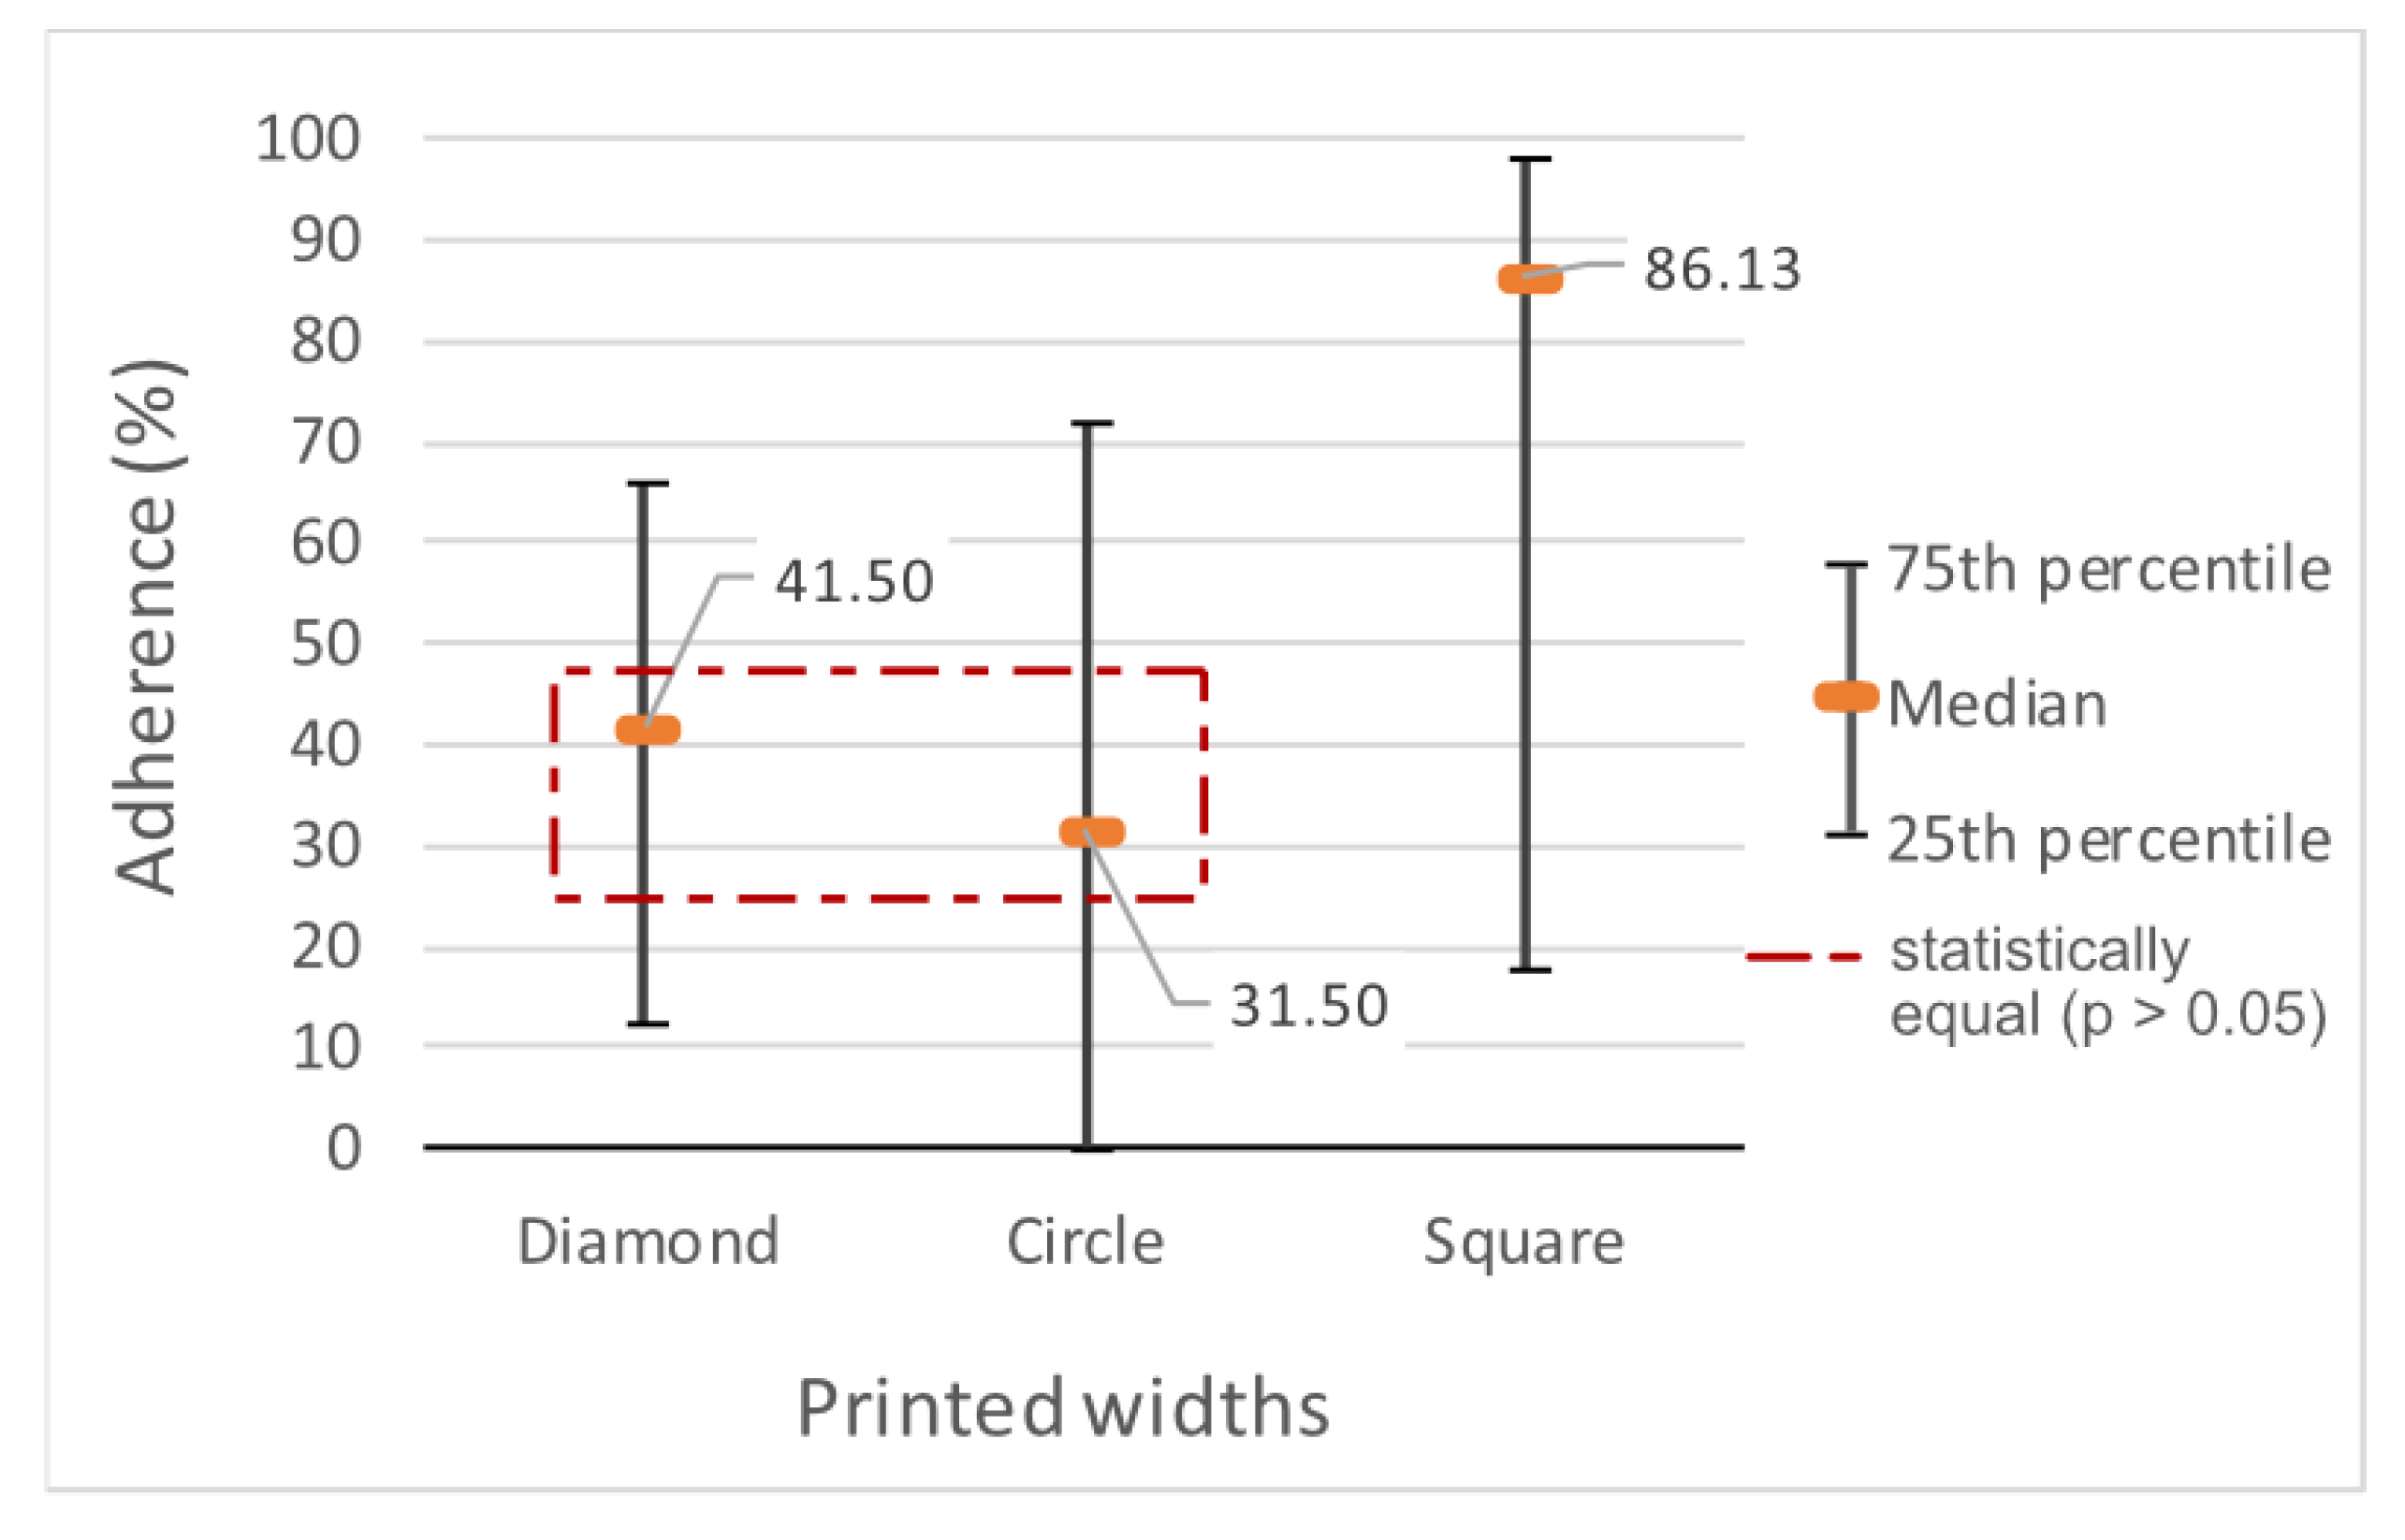
5.3. Width
5.4. Twist Angle
5.5. Shapes
5.6. Surfaces
6. Conclusions
Author Contributions
Funding
Institutional Review Board Statement
Informed Consent Statement
Data Availability Statement
Conflicts of Interest
References
- Upcraft, S.; Fletcher, R. The rapid prototyping technologies. Assem. Autom. 2003, 23, 318–330. [Google Scholar] [CrossRef]
- Sachs, E.; Cima, M.; Cornie, J.; Brancazio, D.; Bredt, J.; Curodeau, A.; Fan, T.; Khanuja, S.; Lauder, A.; Lee, J.; et al. Three-dimensional printing: The physics and implications of additive manufacturing. CIRP Ann. 1993, 42, 257–260. [Google Scholar] [CrossRef]
- Yan, X.; Gu, P. A review of rapid prototyping technologies and systems. Comput.-Aided Des. 1996, 28, 307–318. [Google Scholar] [CrossRef]
- Shahrubudin, N.; Lee, T.C.; Ramlan, R. An overview on 3D printing technology: Technological, materials, and applications. Procedia Manuf. 2019, 35, 1286–1296. [Google Scholar] [CrossRef]
- Ngo, T.D.; Kashani, A.; Imbalzano, G.; Nguyen, K.T.; Hui, D. Additive manufacturing (3D printing): A review of materials, methods, applications and challenges. Compos. Part B Eng. 2018, 143, 172–196. [Google Scholar] [CrossRef]
- Kantaros, A.; Piromalis, D. Employing a low-cost desktop 3D printer: Challenges, and how to overcome them by tuning key process parameters. Int. J. Mech. Appl. 2021, 10, 11–19. [Google Scholar]
- Oropallo, W.; Piegl, L.A. Ten challenges in 3D printing. Eng. Comput. 2016, 32, 135–148. [Google Scholar] [CrossRef]
- Murphy, S.V.; Atala, A. 3D bioprinting of tissues and organs. Nat. Biotechnol. 2014, 32, 773–785. [Google Scholar] [CrossRef]
- Kantaros, A. Bio-Inspired Materials: Exhibited Characteristics and Integration Degree in Bio-Printing Operations. Am. J. Eng. Appl. Sci. 2022, 15, 255–263. [Google Scholar] [CrossRef]
- Kondiah, P.J.; Kondiah, P.P.; Choonara, Y.E.; Marimuthu, T.; Pillay, V. A 3D bioprinted pseudo-bone drug delivery scaffold for bone tissue engineering. Pharmaceutics 2020, 12, 166. [Google Scholar] [CrossRef] [PubMed]
- Wong, J.Y. 3D printing applications for space missions. Aerosp. Med. Hum. Perform. 2016, 87, 580–582. [Google Scholar] [CrossRef] [PubMed]
- Yamaura, H. exiii Inc. Website. Available online: http://exiii.jp (accessed on 30 April 2023).
- Machado, A.P.F.; Medeiros, D.P. O design de sinalização auxiliando na mobilidade de pessoas com deficiência visual no transporte público. Rev. Vincci-Periódico Científico Do UniSATC 2019, 4, 48–80. [Google Scholar]
- Dillon, M. Unseen Art. Available online: http://www.indiegogo.com/projects/unseen-art-experiencing-art-for-the-first-time (accessed on 30 April 2023).
- del Prado, M. Touching the Prado. Available online: http://www.museodelprado.es/en/whats-on/exhibition/touching-the-prado/0d94a9bf-07d7-491a-866a-37976169f929 (accessed on 30 April 2023).
- Gurinder, J.O. The Swedish library of talking books and Braille (TPB). INSPEL 1985, 19, 258–264. [Google Scholar]
- Hasper, E.; Windhorst, R.A.; Hedgpeth, T.; Van Tuyl, L.; Gonzales, A.; Martinez, B.; Yu, H.; Farkas, Z.; Baluch, D.P. Methods for creating and evaluating 3D tactile images to teach STEM courses to the visually impaired. J. Coll. Sci. Teach. 2015, 44, 92–99. [Google Scholar] [CrossRef]
- Sanatgar, R.H.; Campagne, C.; Nierstrasz, V. Investigation of the adhesion properties of direct 3D printing of polymers and nanocomposites on textiles: Effect of FDM printing process parameters. Appl. Surf. Sci. 2017, 403, 551–563. [Google Scholar] [CrossRef]
- Turner, B.N.; Strong, R.; Gold, S.A. A review of melt extrusion additive manufacturing processes: I. Process design and modeling. Rapid Prototyp. J. 2014, 20, 192–204. [Google Scholar] [CrossRef]
- Pan, A.Q.; Huang, Z.F.; Guo, R.J.; Liu, J. Effect of FDM process on adhesive strength of polylactic acid (PLA) filament. Key Eng. Mater. 2016, 667, 181–186. [Google Scholar] [CrossRef]
- Kuznetsov, V.E.; Solonin, A.N.; Urzhumtsev, O.D.; Schilling, R.; Tavitov, A.G. Strength of PLA components fabricated with fused deposition technology using a desktop 3D printer as a function of geometrical parameters of the process. Polymers 2018, 10, 313. [Google Scholar] [CrossRef]
- Shapiro, S.S.; Wilk, M.B. An analysis of variance test for normality (complete samples). Biometrika 1965, 52, 591–611. [Google Scholar] [CrossRef]
- Lunet, N.; Severo, M.; Barros, H. Desvio padrão ou erro padrão. Arq. Med.-Porto 2006, 20, 55. [Google Scholar]
- Kruskal, W.H.; Wallis, W.A. Use of ranks in one-criterion variance analysis. J. Am. Stat. Assoc. 1952, 47, 583–621. [Google Scholar] [CrossRef]
- Dunn, O.J. Multiple comparisons among means. J. Am. Stat. Assoc. 1961, 56, 52–64. [Google Scholar] [CrossRef]
- Peck, R.; Olsen, C.; Devore, J.L. Introduction to Statistics and Data Analysis; Cengage Learning: Boston, MA, USA, 2015. [Google Scholar]
- Team, J. Jasp 0.16. Available online: http://jasp-stats.org (accessed on 30 April 2023).
- Mann, H.B.; Whitney, D.R. On a test of whether one of two random variables is stochastically larger than the other. Ann. Math. Stat. 1947, 18, 50–60. [Google Scholar] [CrossRef]


| Material | Thickness (mm) | Price per Square Meter (R$) |
|---|---|---|
| Sulfite paper 75 g/m2 | 0.1 | 0.74 |
| Lisolene (polyethylene) | 0.1 | 1.33 |
| TNT 80 g/m2 | 0.43 | 3 |
| Cardboard | 0.75 | 2.86 |
| EVA (ethylene vinyl acetate) | 2.6 | 7 |
| Lamicel (PVC) | 0.1 | 2.5 |
| Verge paper 120 g/m2 | 0.2 | 3.7 |
| Sulfite paper 180 g/m2 | 0.2 | 0.42 |
| Parameter | Element |
|---|---|
| Height of the first layer | 0.1 mm |
| Height of the remaining layers | 0.1 mm |
| Perimeter lines | 2 |
| Lines on the skirt | 0 |
| Temperature of the first layer | 210 °C |
| Temperature of the remaining layers | 205 °C |
| Temperature of the bed | 60 °C |
| Cooling fan speed for printed filament (min./max.) (Fan speed) | 0%/50% |
| Number of layers with the fan turned off (Disable fan for the first) | 1 |
| Layer at which the fan will reach maximum speed (Full fan speed at layer) | 4 |
| Initial 3D printing height (Z-Offset): | Material thickness (see Table 1) |
| Contour filament 3D printing speed (perimeters) | 50 mm/s |
| Solid infill 3D printing speed | 50 mm/s |
| Top solid infill layer 3D printing speed | 50 mm/s |
| Inter-filament gap 3D printing speed | 50 mm/s |
| Parameter | Element |
|---|---|
| Temperature of the first layer | 200 °C |
| Temperature of the other layers | 200 °C |
| Cooling fan speed for printed filament (min./max.) (Fan speed) | 50%/100% |
| Number of layers with fan turned off (Disable fan for the first) | 0 |
| Layer at which the fan will reach maximum speed (Full fan speed at layer) | 2 |
| Filament contour 3D printing speed (perimeters) | 100 mm/s |
| Solid infill 3D printing speed | 100 mm/s |
| Top solid infill 3D printing speed | 100 mm/s |
| Interfilament filling speed (gap) | 100 mm/s |
Disclaimer/Publisher’s Note: The statements, opinions and data contained in all publications are solely those of the individual author(s) and contributor(s) and not of MDPI and/or the editor(s). MDPI and/or the editor(s) disclaim responsibility for any injury to people or property resulting from any ideas, methods, instructions or products referred to in the content. |
© 2023 by the authors. Licensee MDPI, Basel, Switzerland. This article is an open access article distributed under the terms and conditions of the Creative Commons Attribution (CC BY) license (https://creativecommons.org/licenses/by/4.0/).
Share and Cite
Barros, G.; Correia, W.; Teixeira, J.M. Towards the Effectiveness of 3D Printing on Tactile Content Creation for Visually Impaired Users. Polymers 2023, 15, 2180. https://doi.org/10.3390/polym15092180
Barros G, Correia W, Teixeira JM. Towards the Effectiveness of 3D Printing on Tactile Content Creation for Visually Impaired Users. Polymers. 2023; 15(9):2180. https://doi.org/10.3390/polym15092180
Chicago/Turabian StyleBarros, Gutenberg, Walter Correia, and João Marcelo Teixeira. 2023. "Towards the Effectiveness of 3D Printing on Tactile Content Creation for Visually Impaired Users" Polymers 15, no. 9: 2180. https://doi.org/10.3390/polym15092180