
Mechanical Properties Degradation of Fiberglass Tubes during Biaxial Proportional Cyclic Loading

Abstract
:1. Introduction
2. Material and Methods
2.1. Material
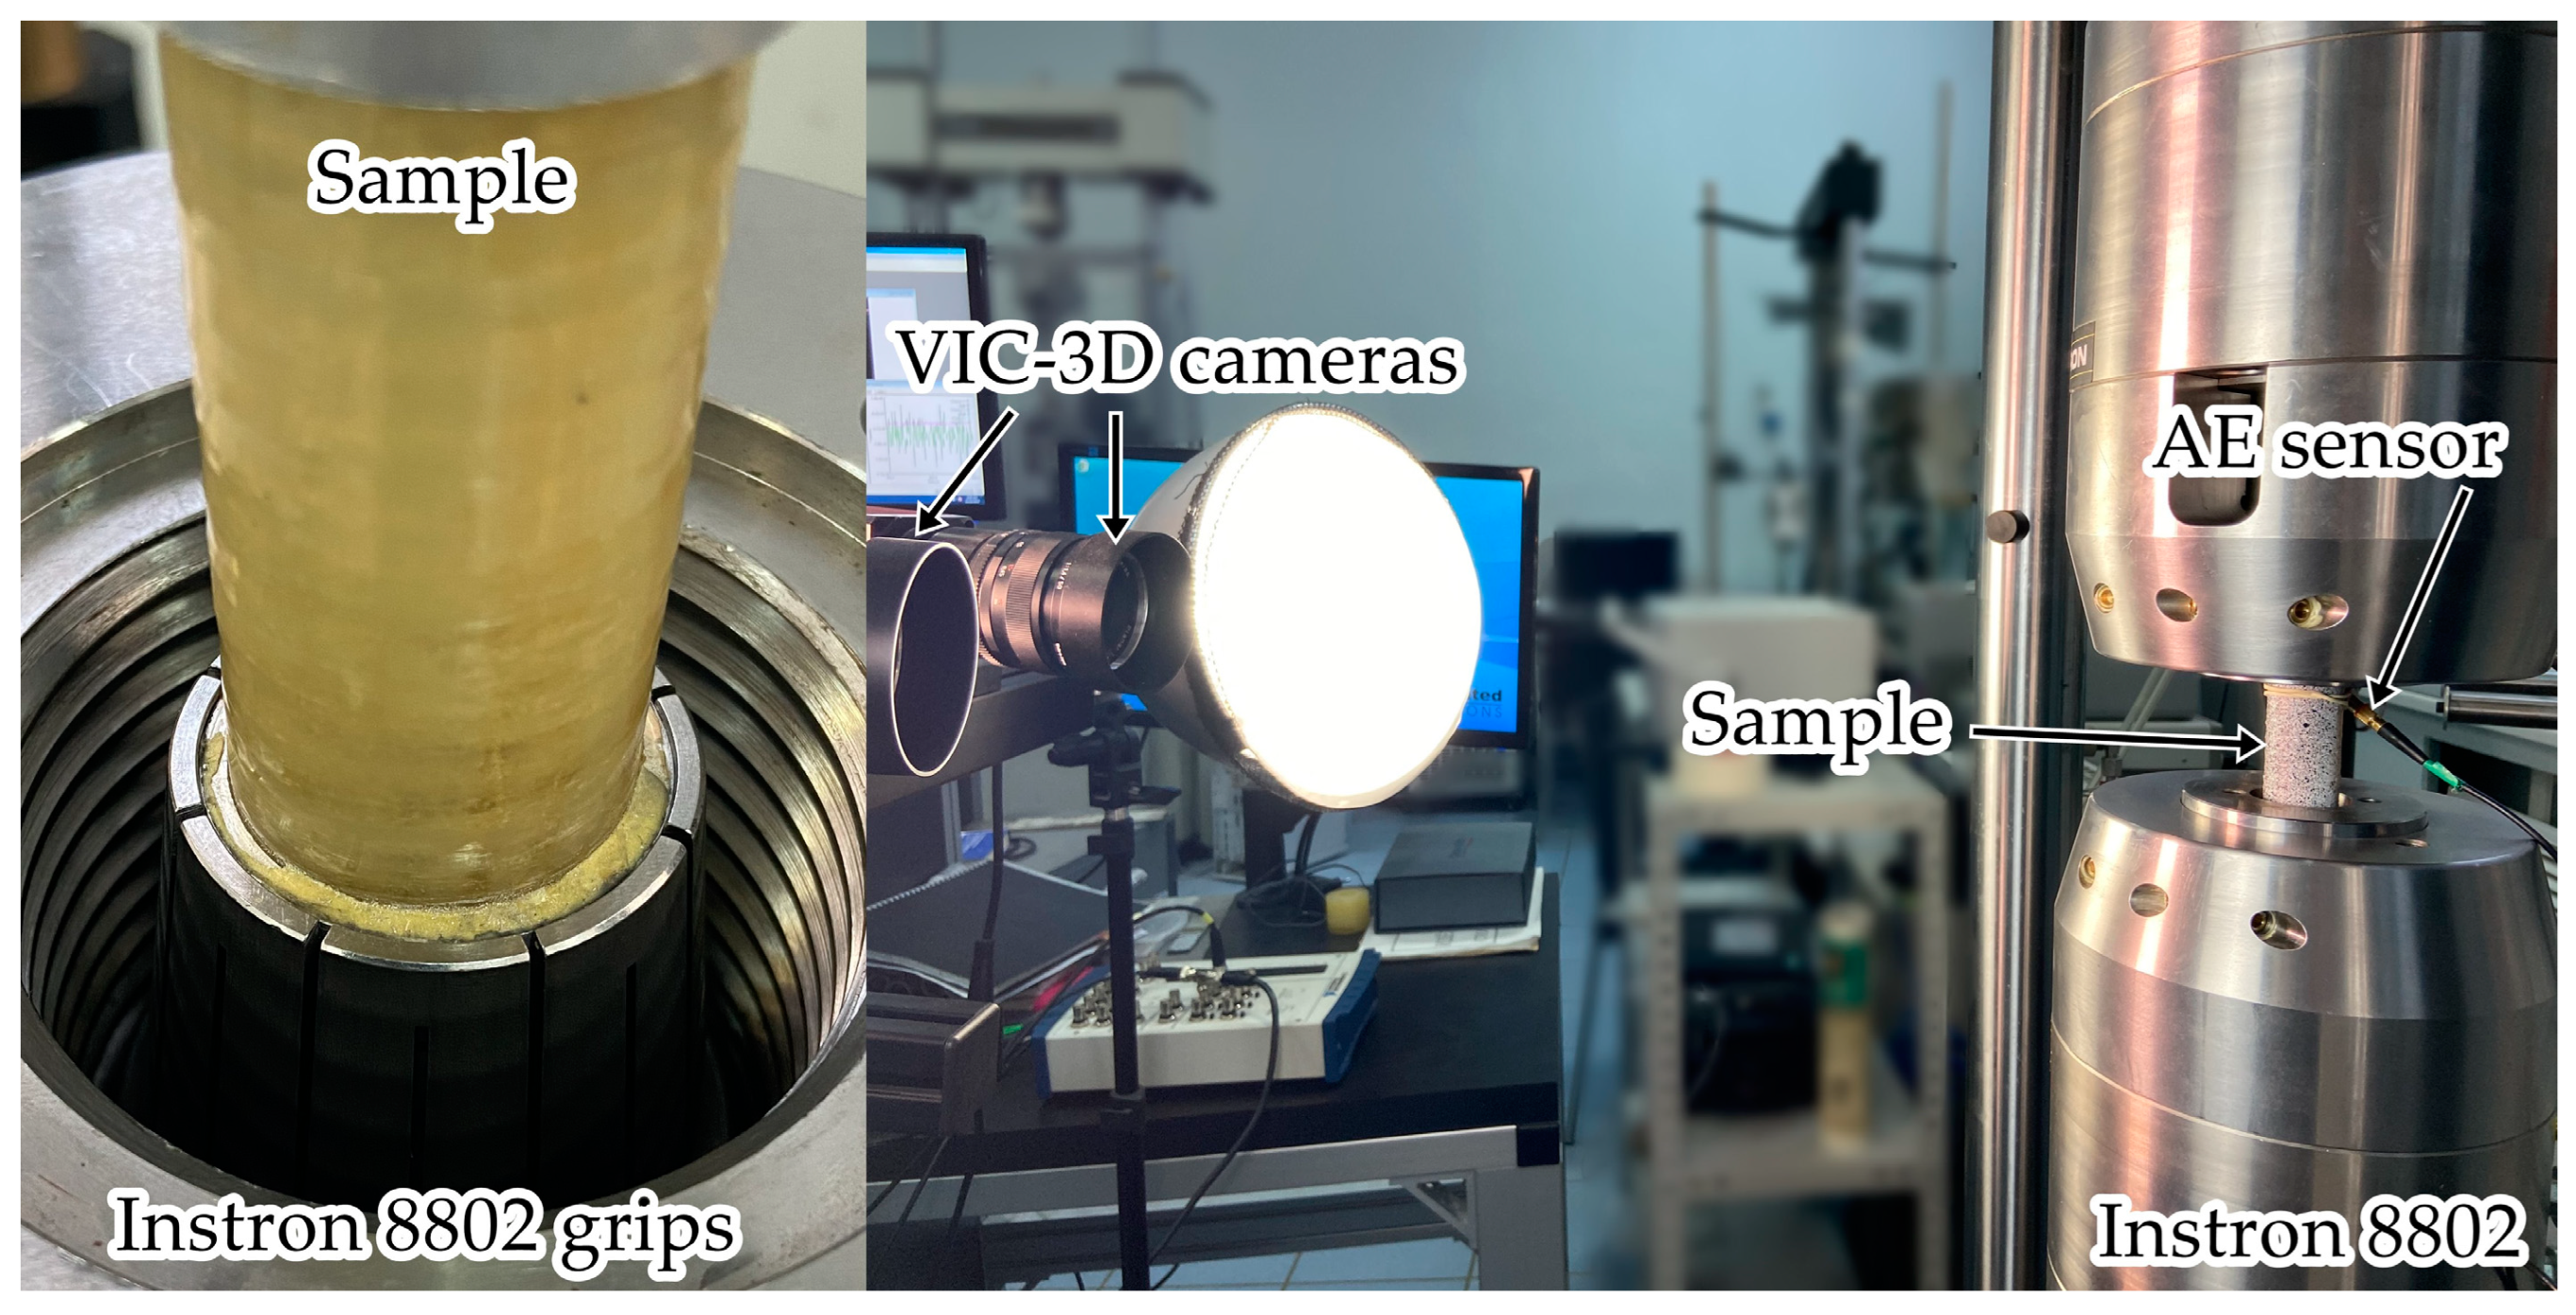
2.2. Equipment
2.3. Methods
2.4. Approximation Models
3. Results and Discussion
3.1. Static Loading
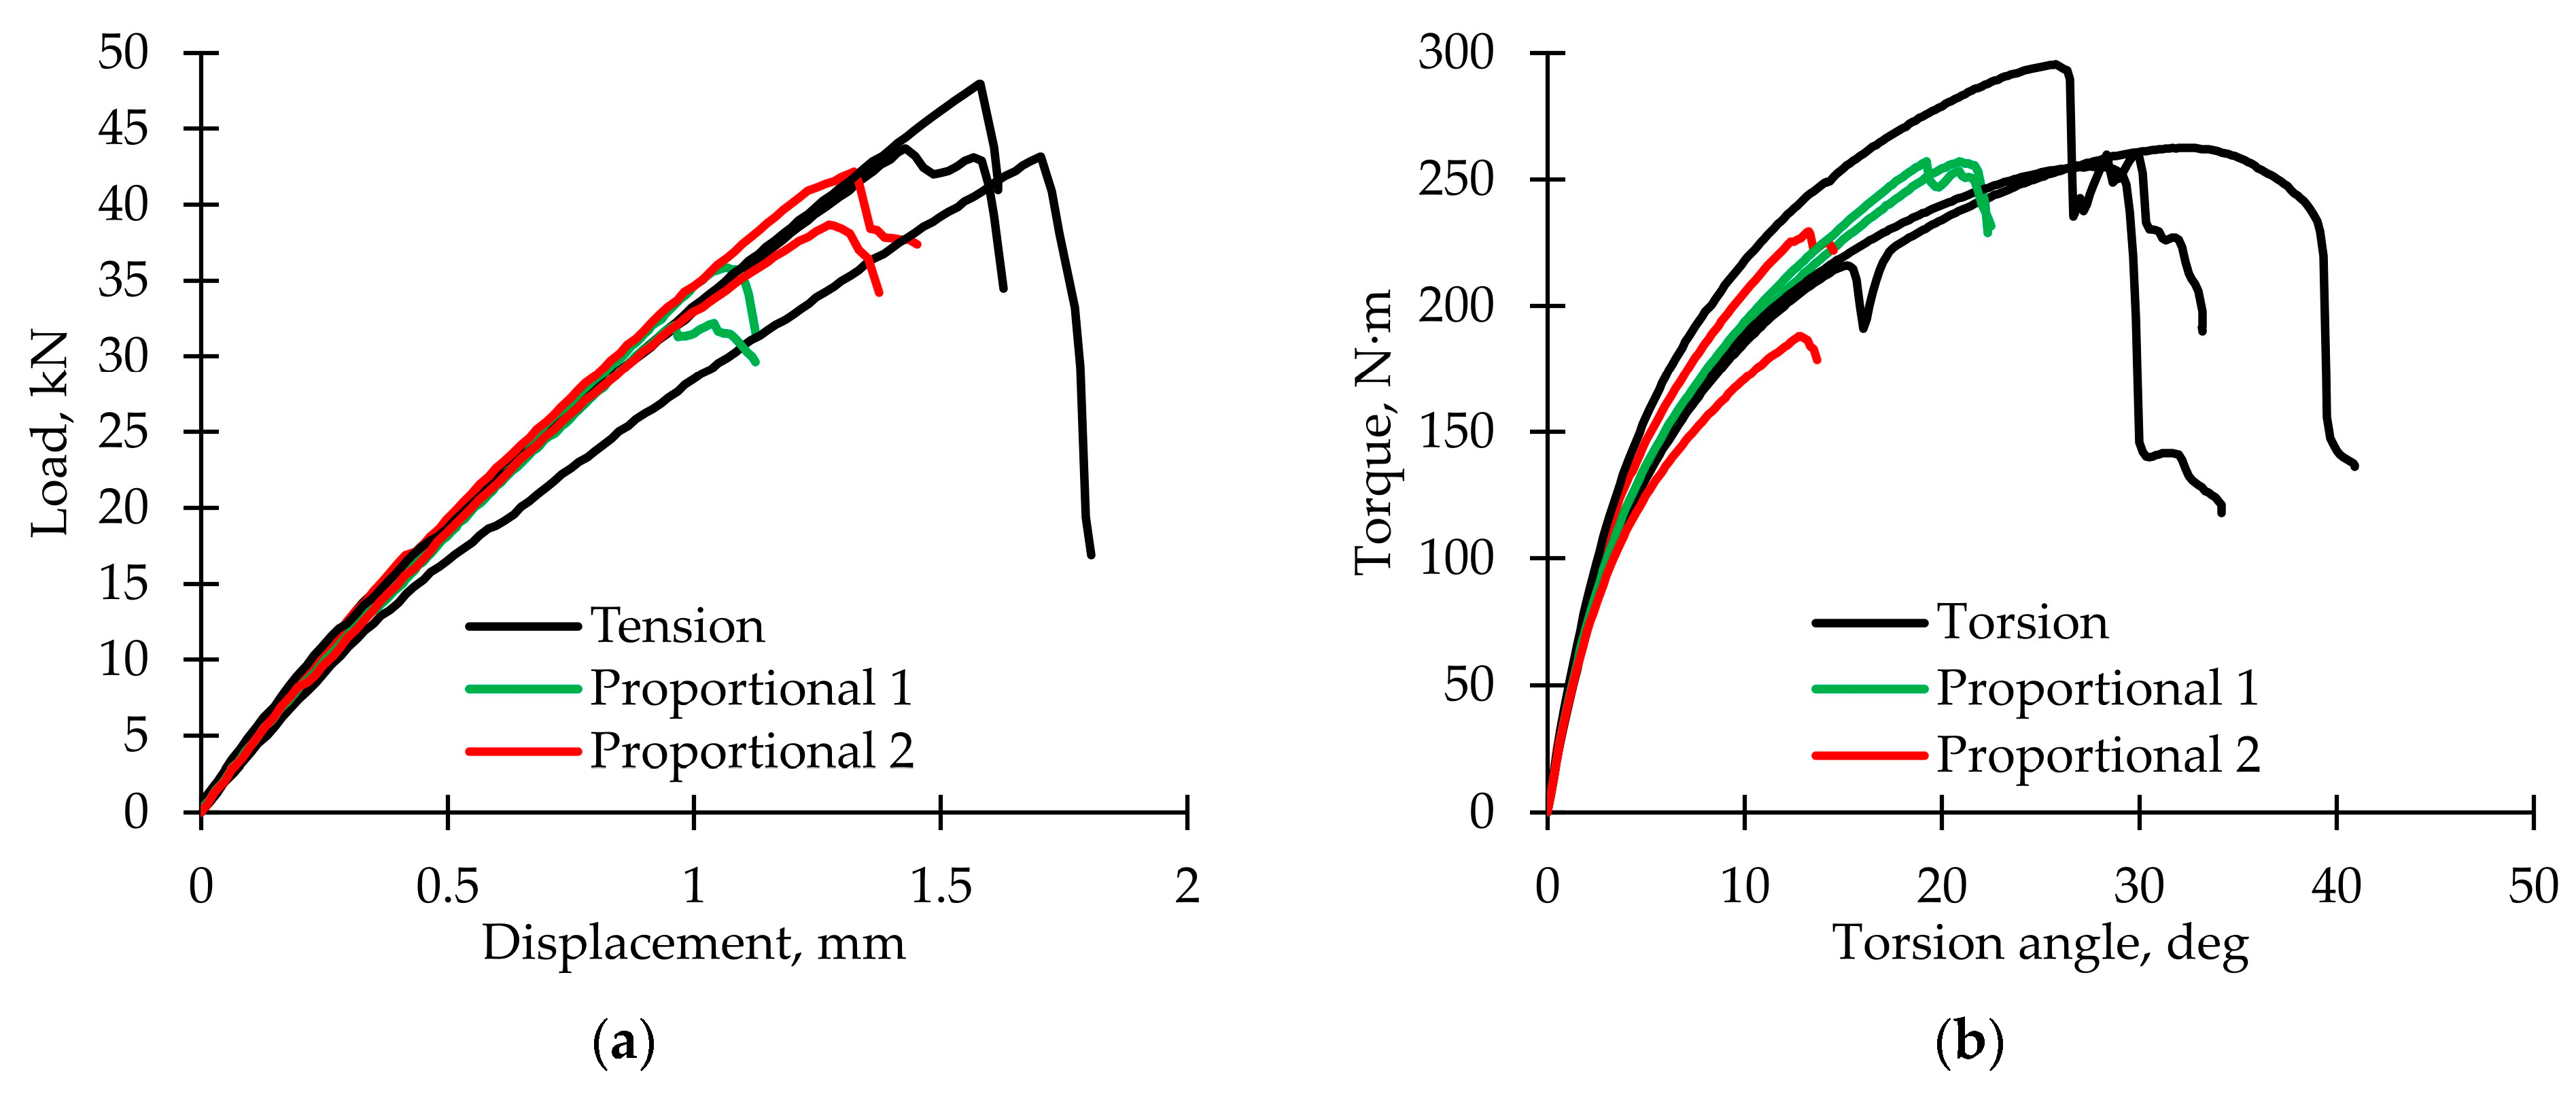
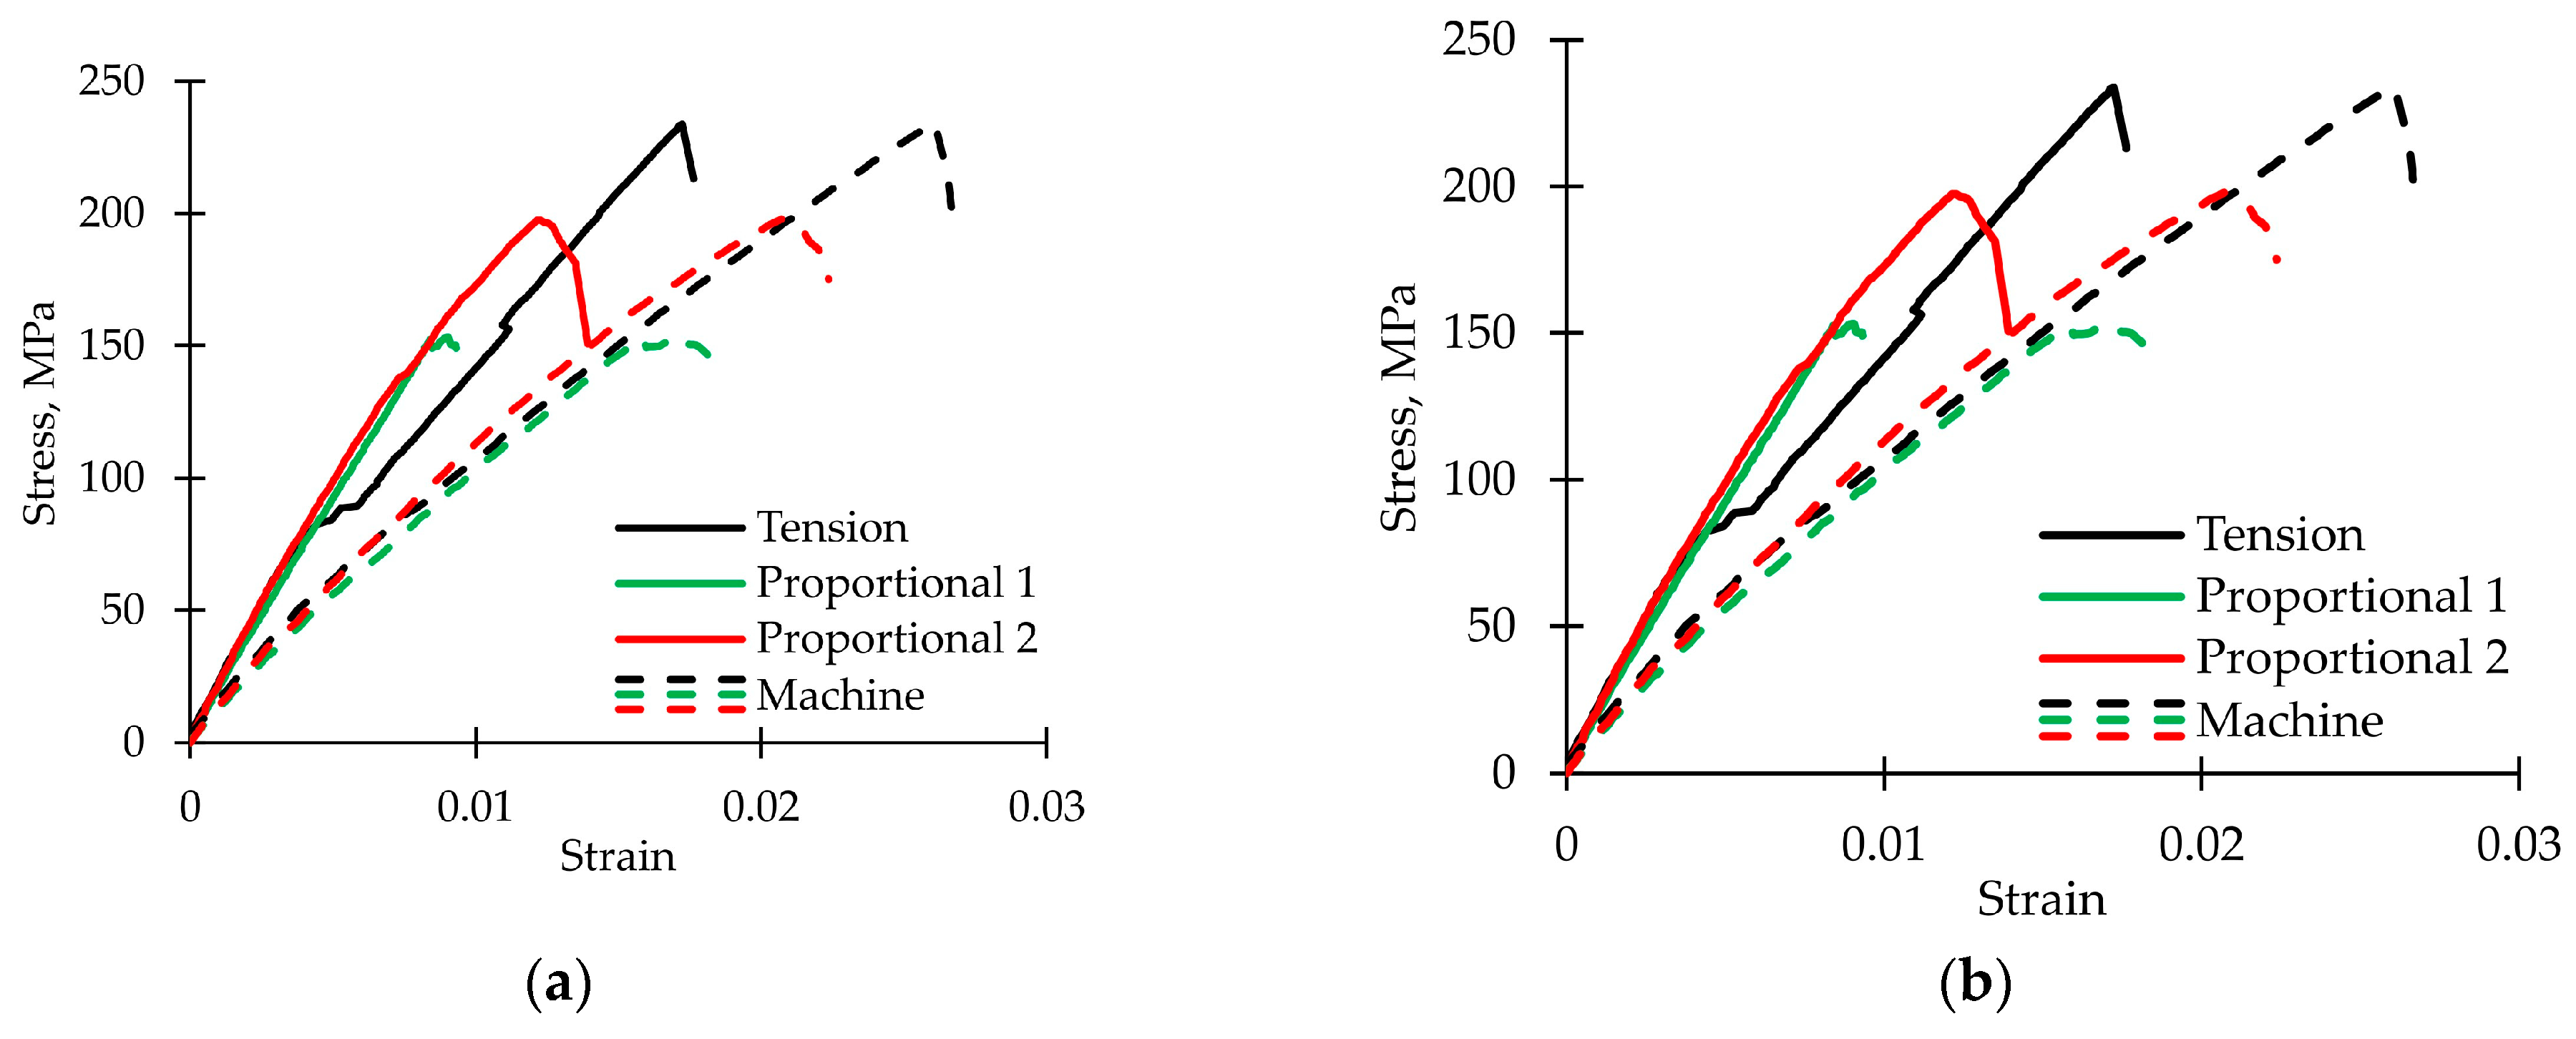
3.1.1. Loading Curves
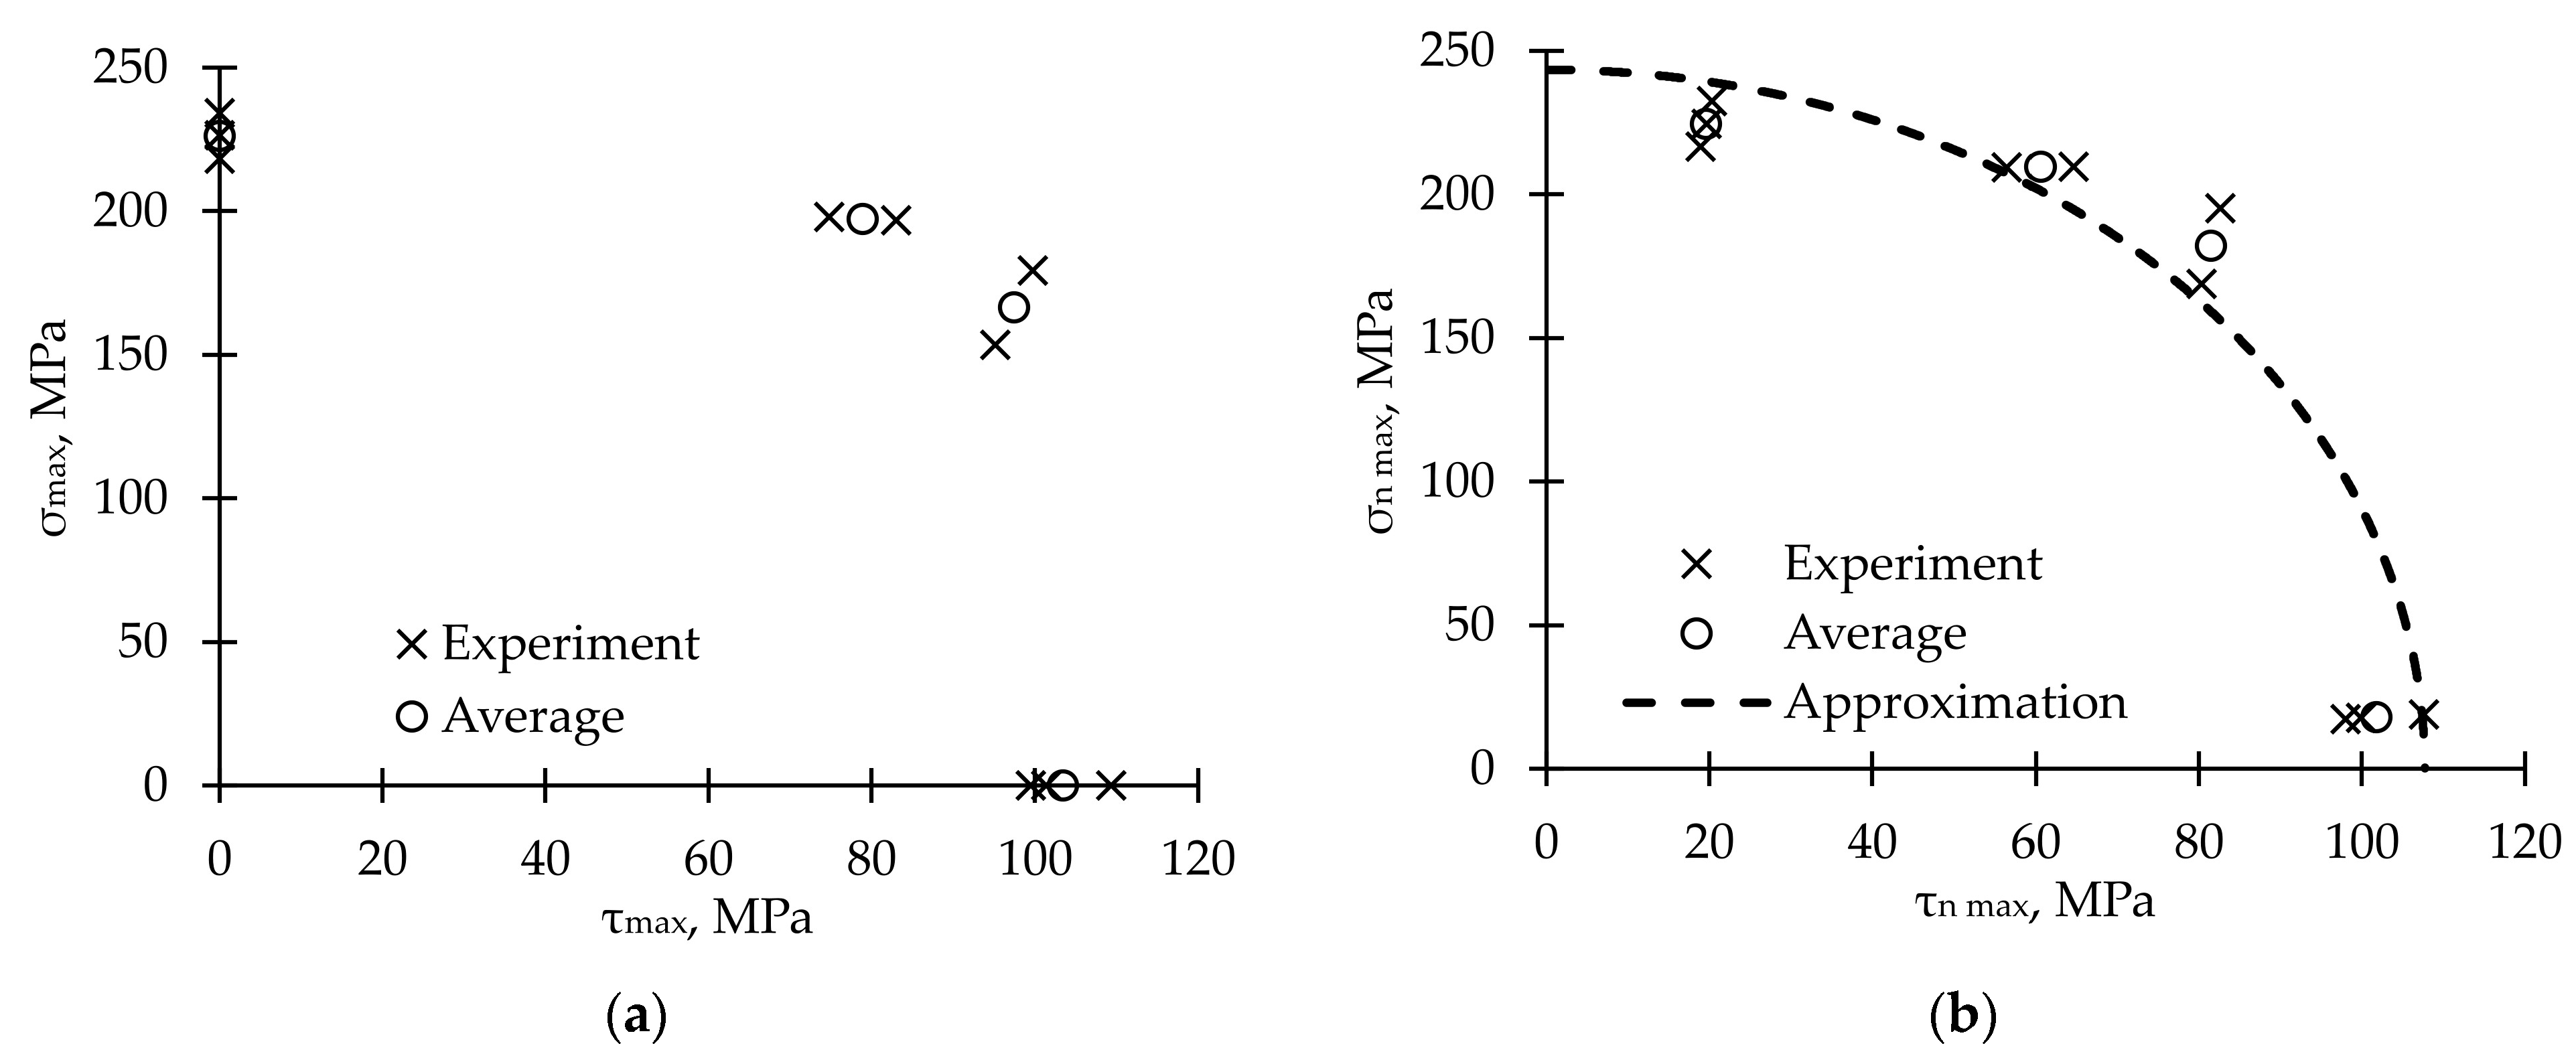
3.1.2. Failure Criterion
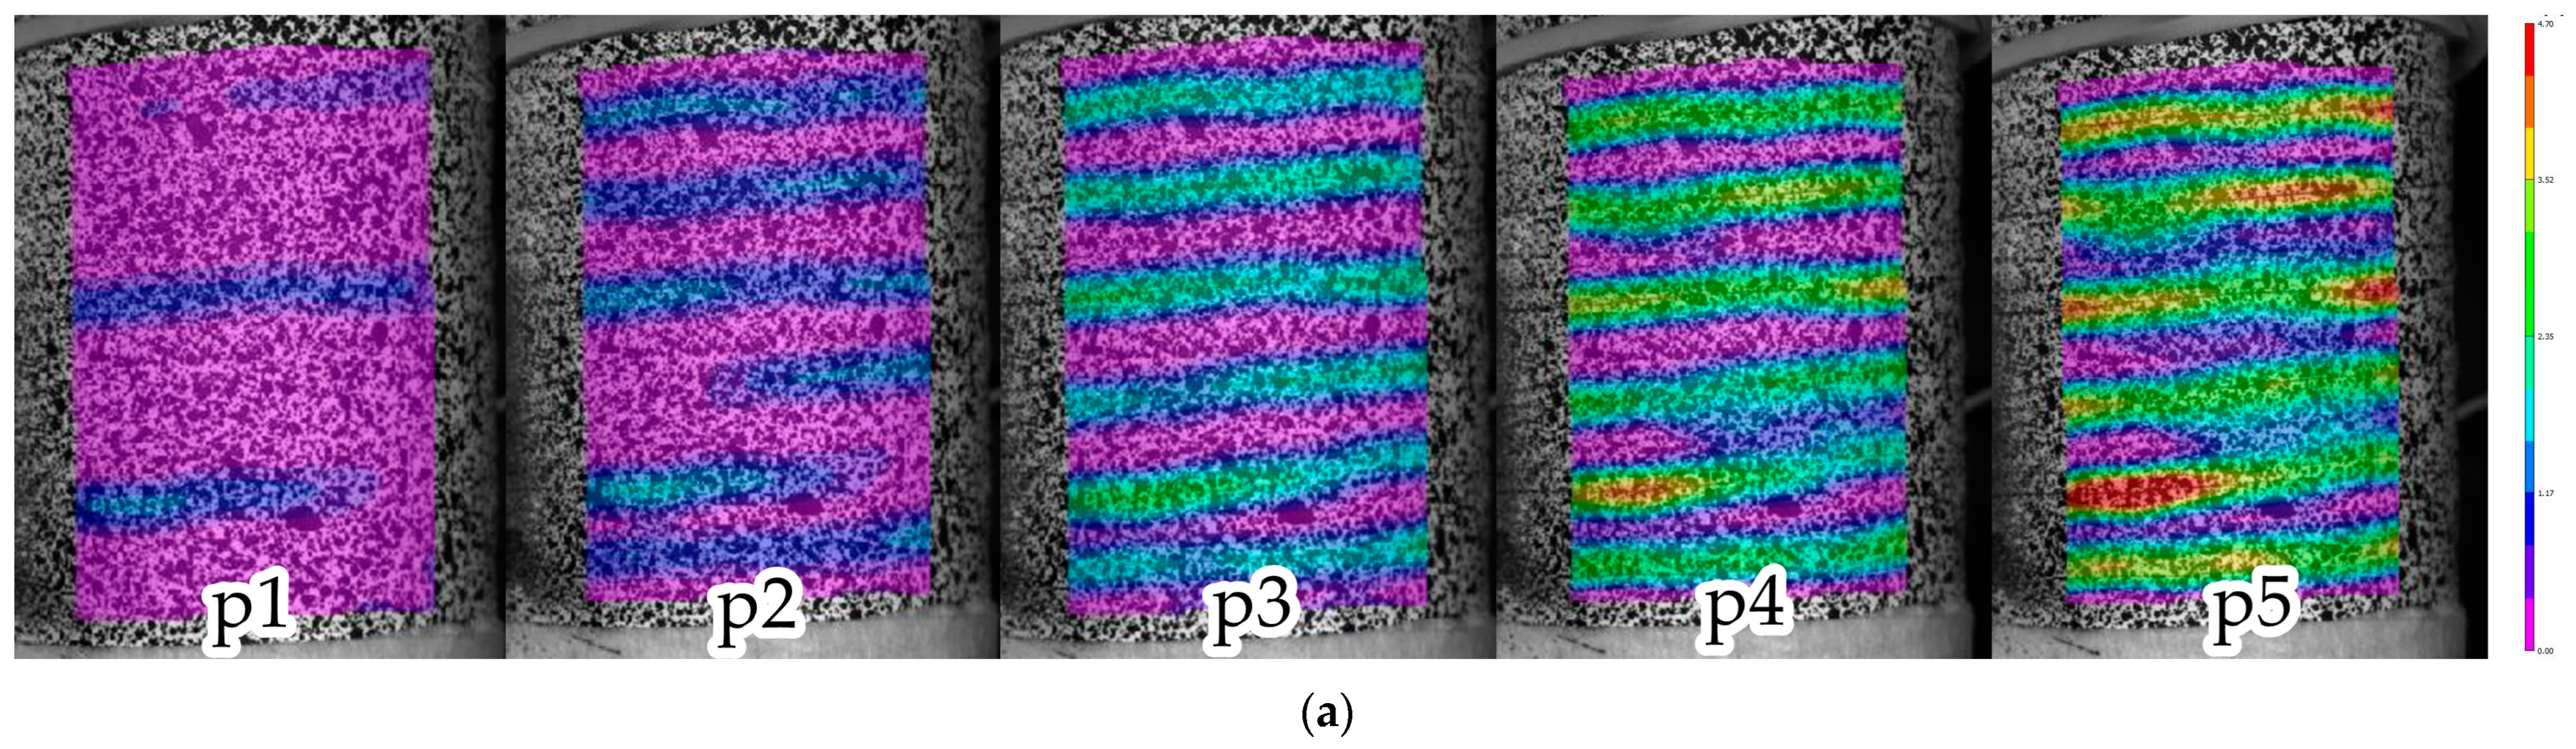
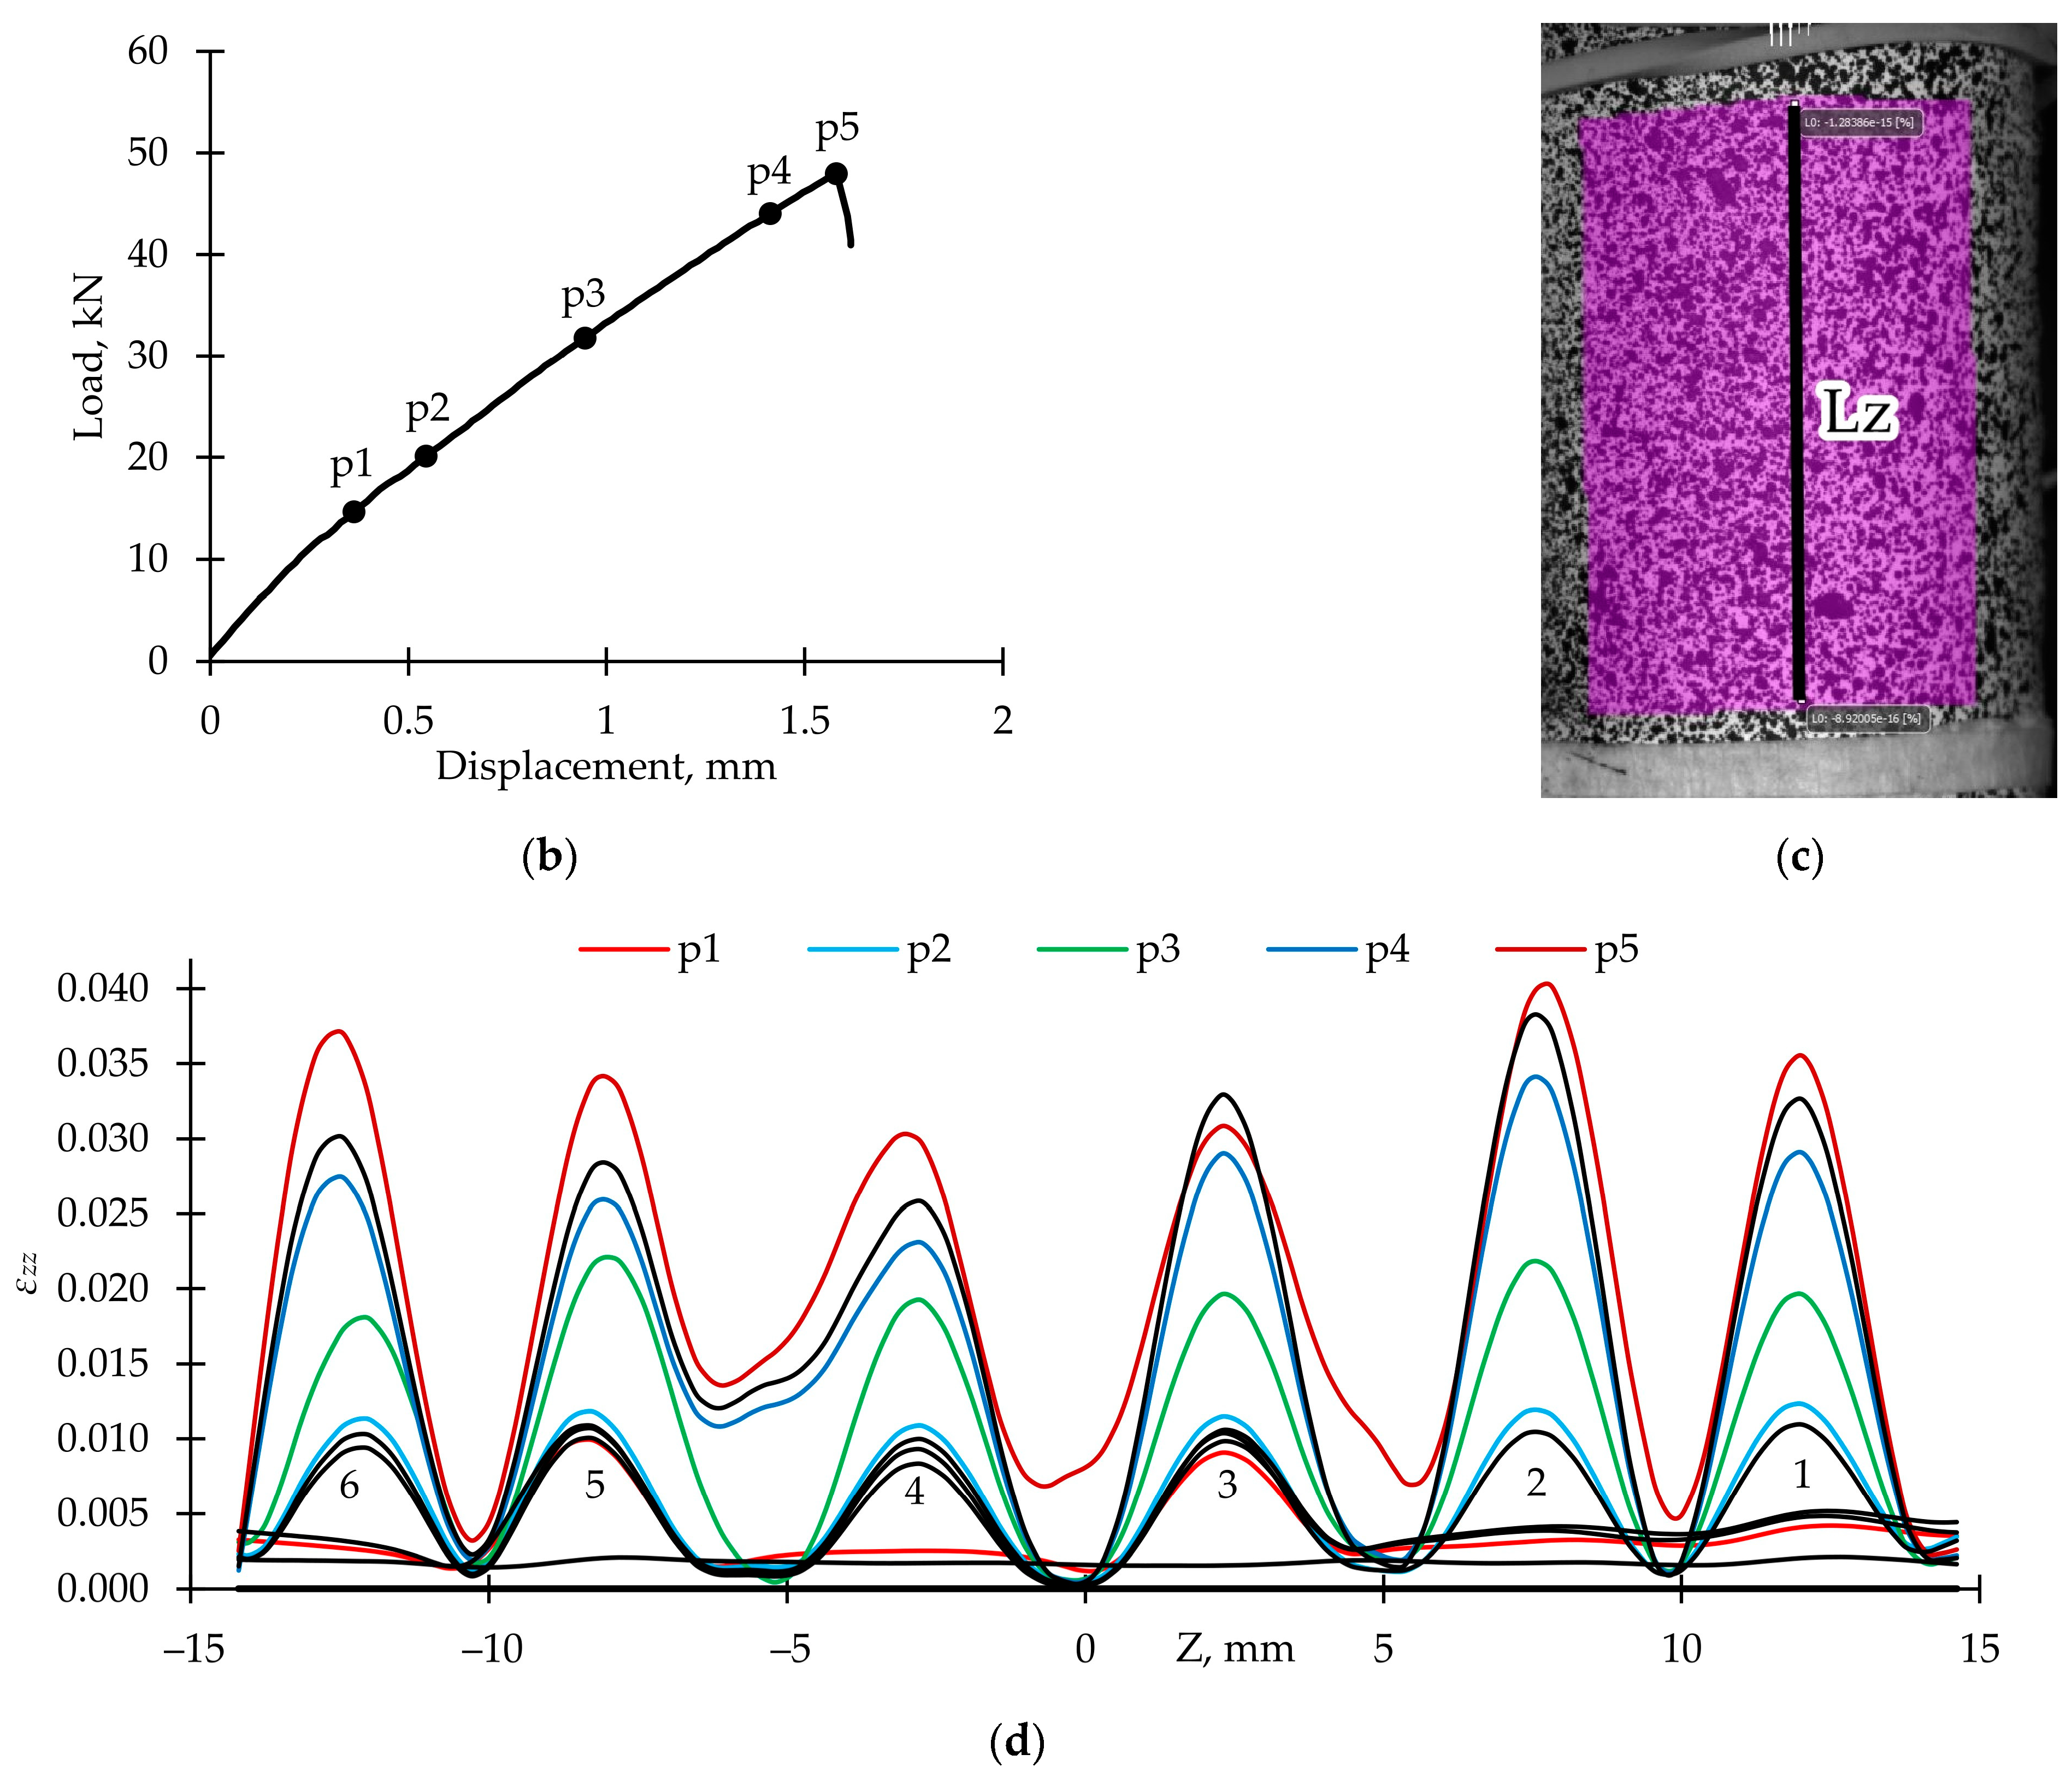
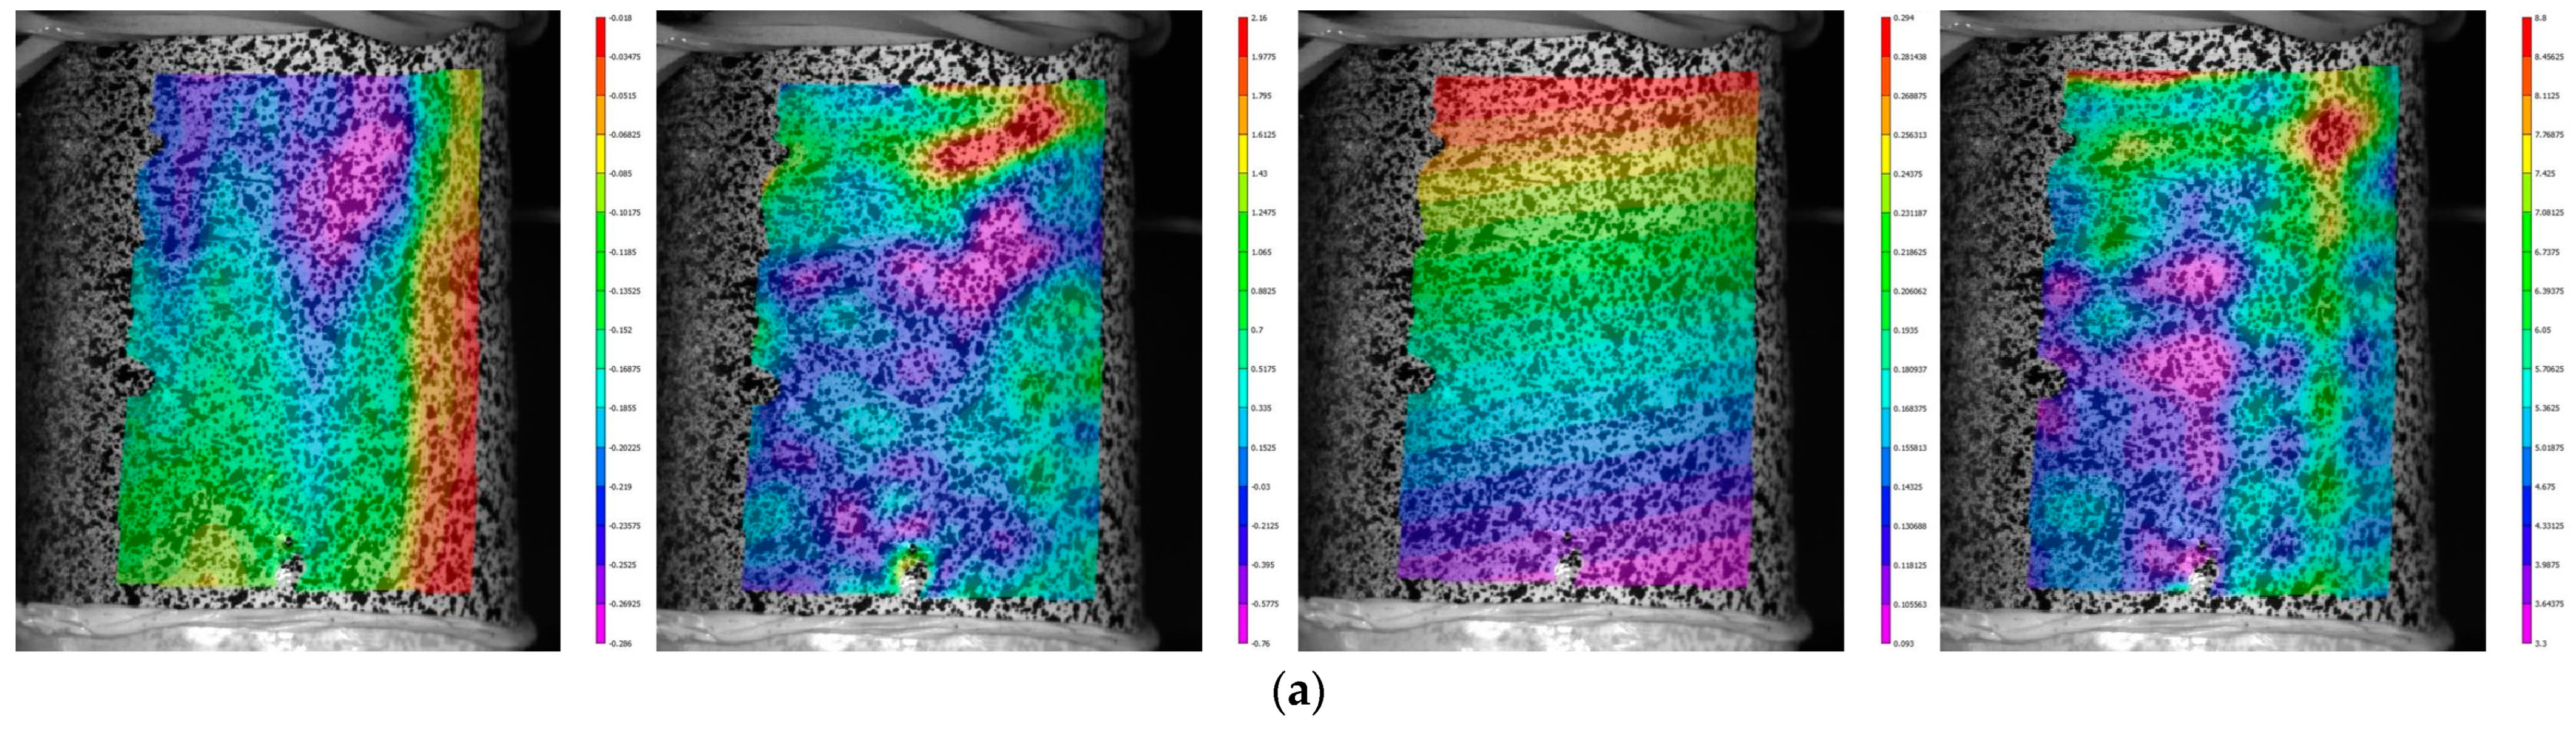
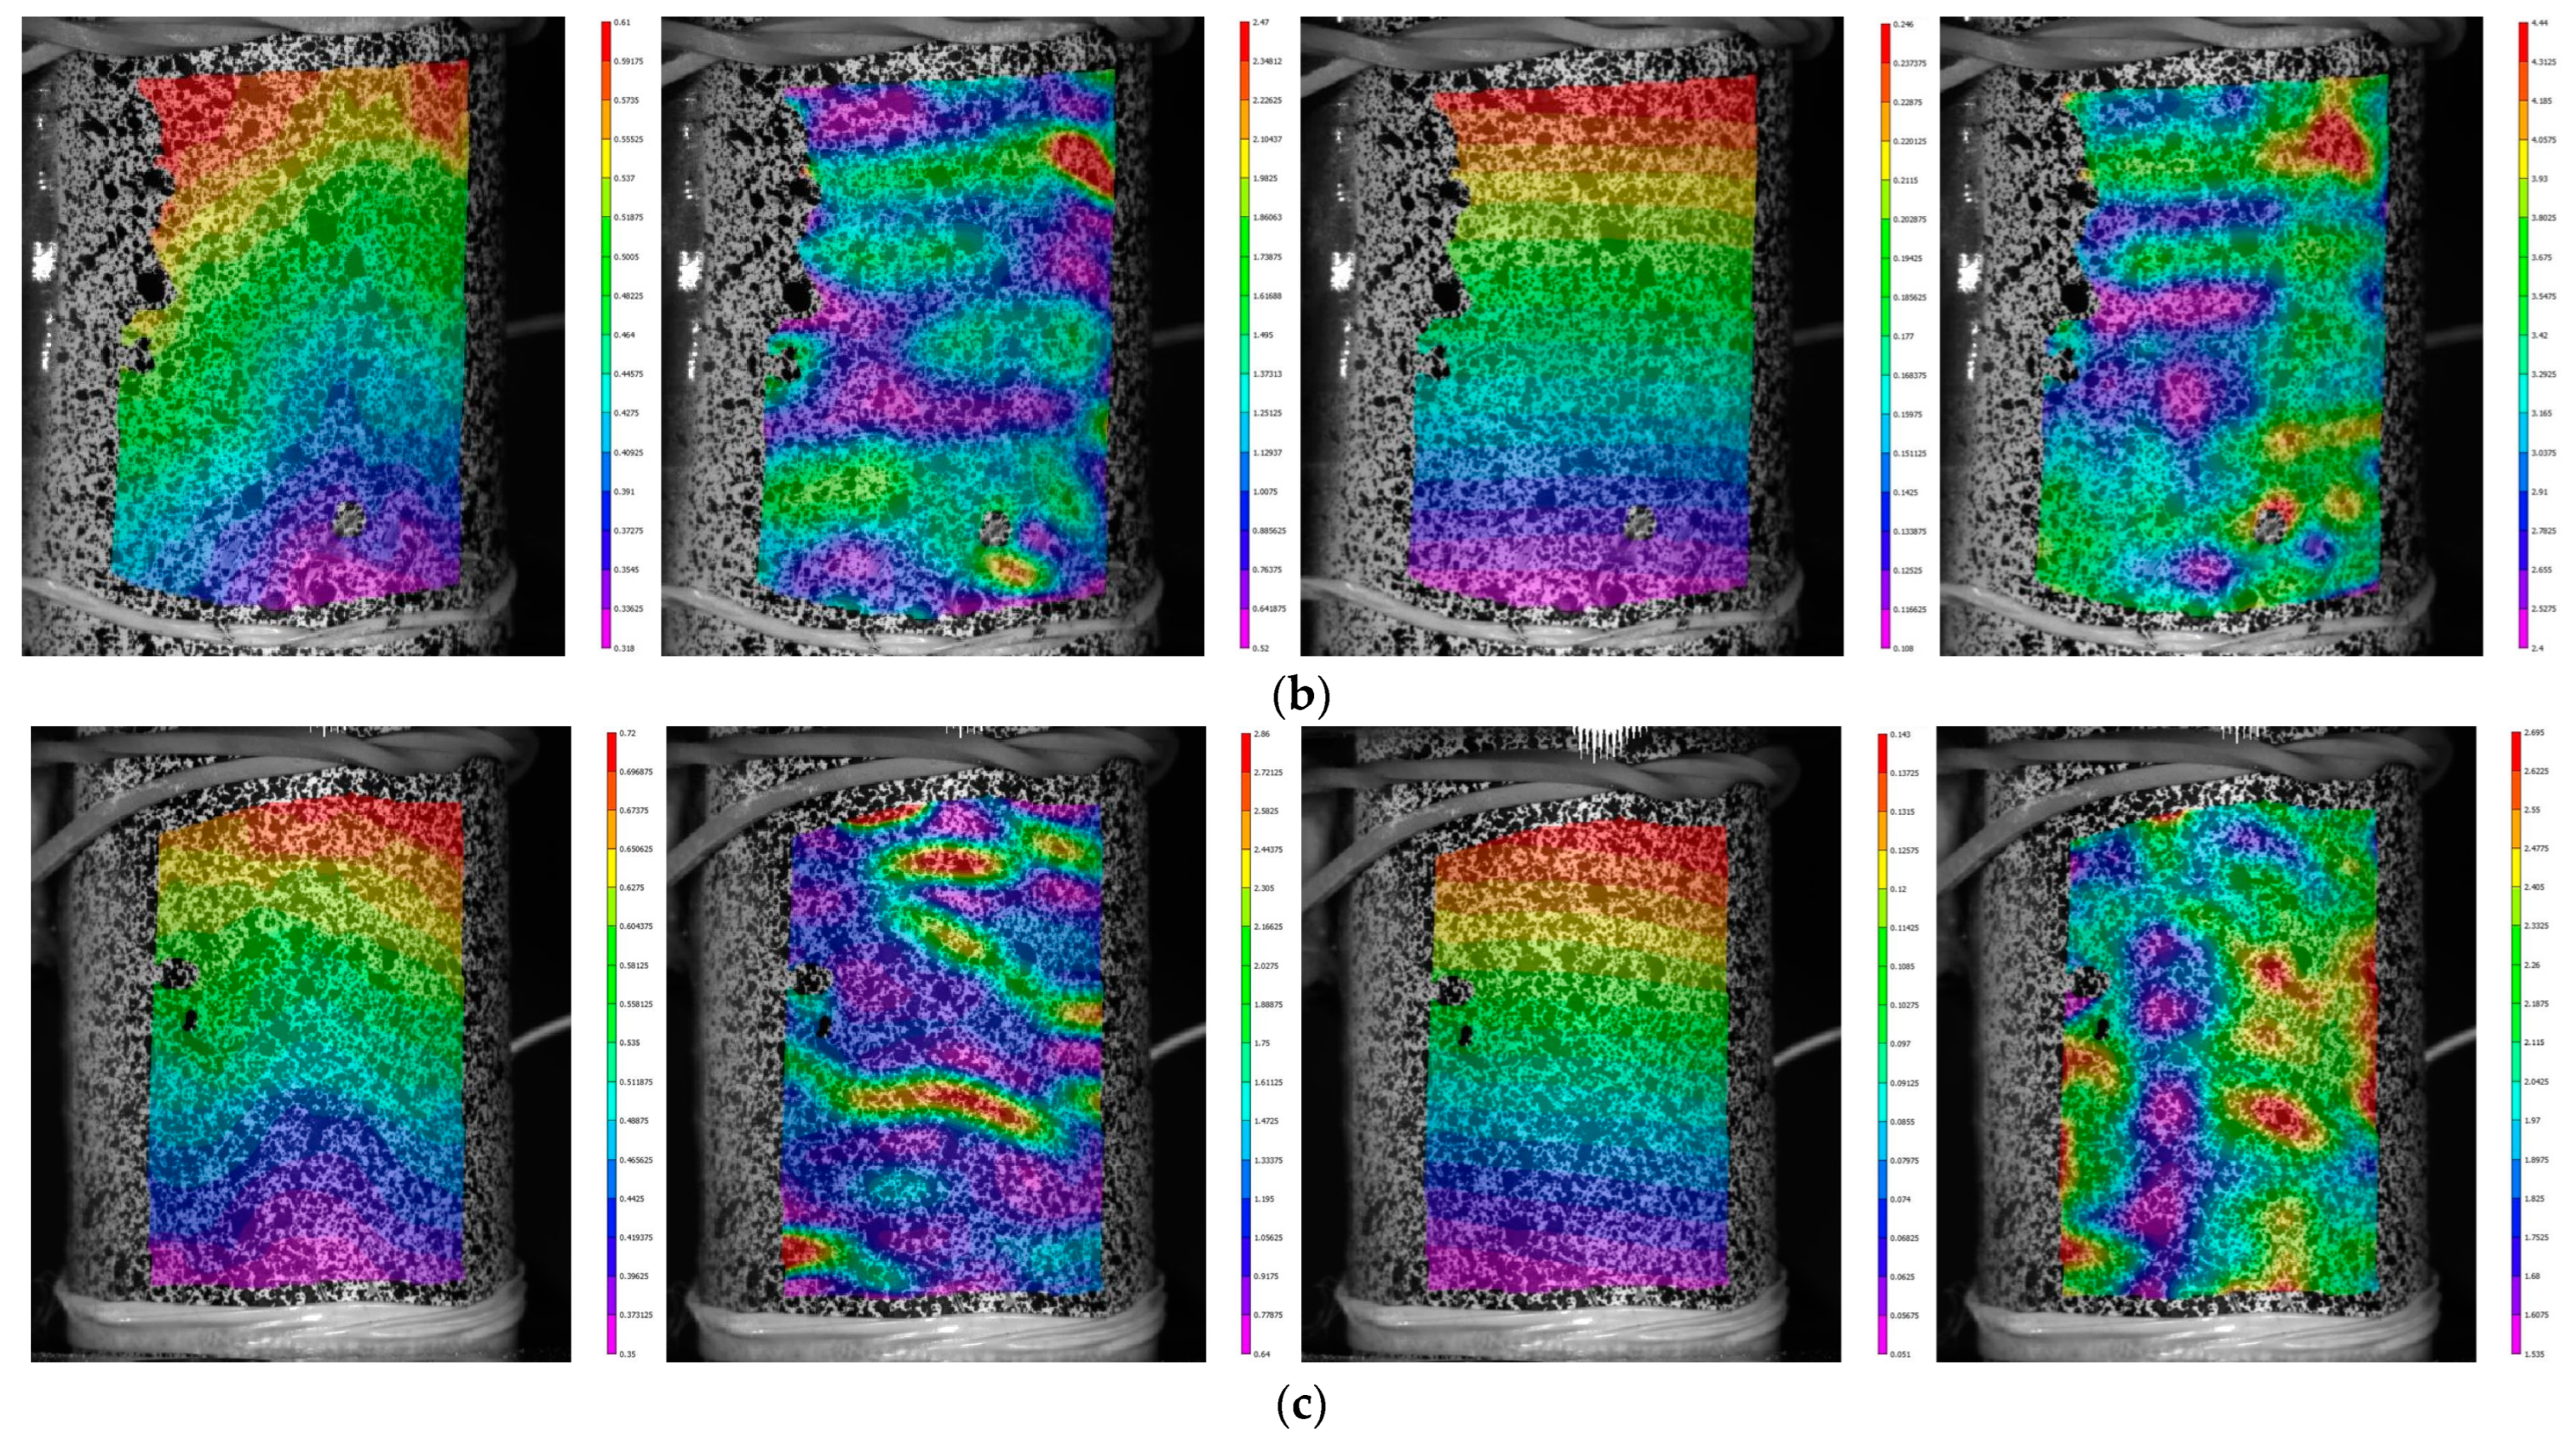
3.1.3. Inhomogeneous Displacement and Strain Field Analysis
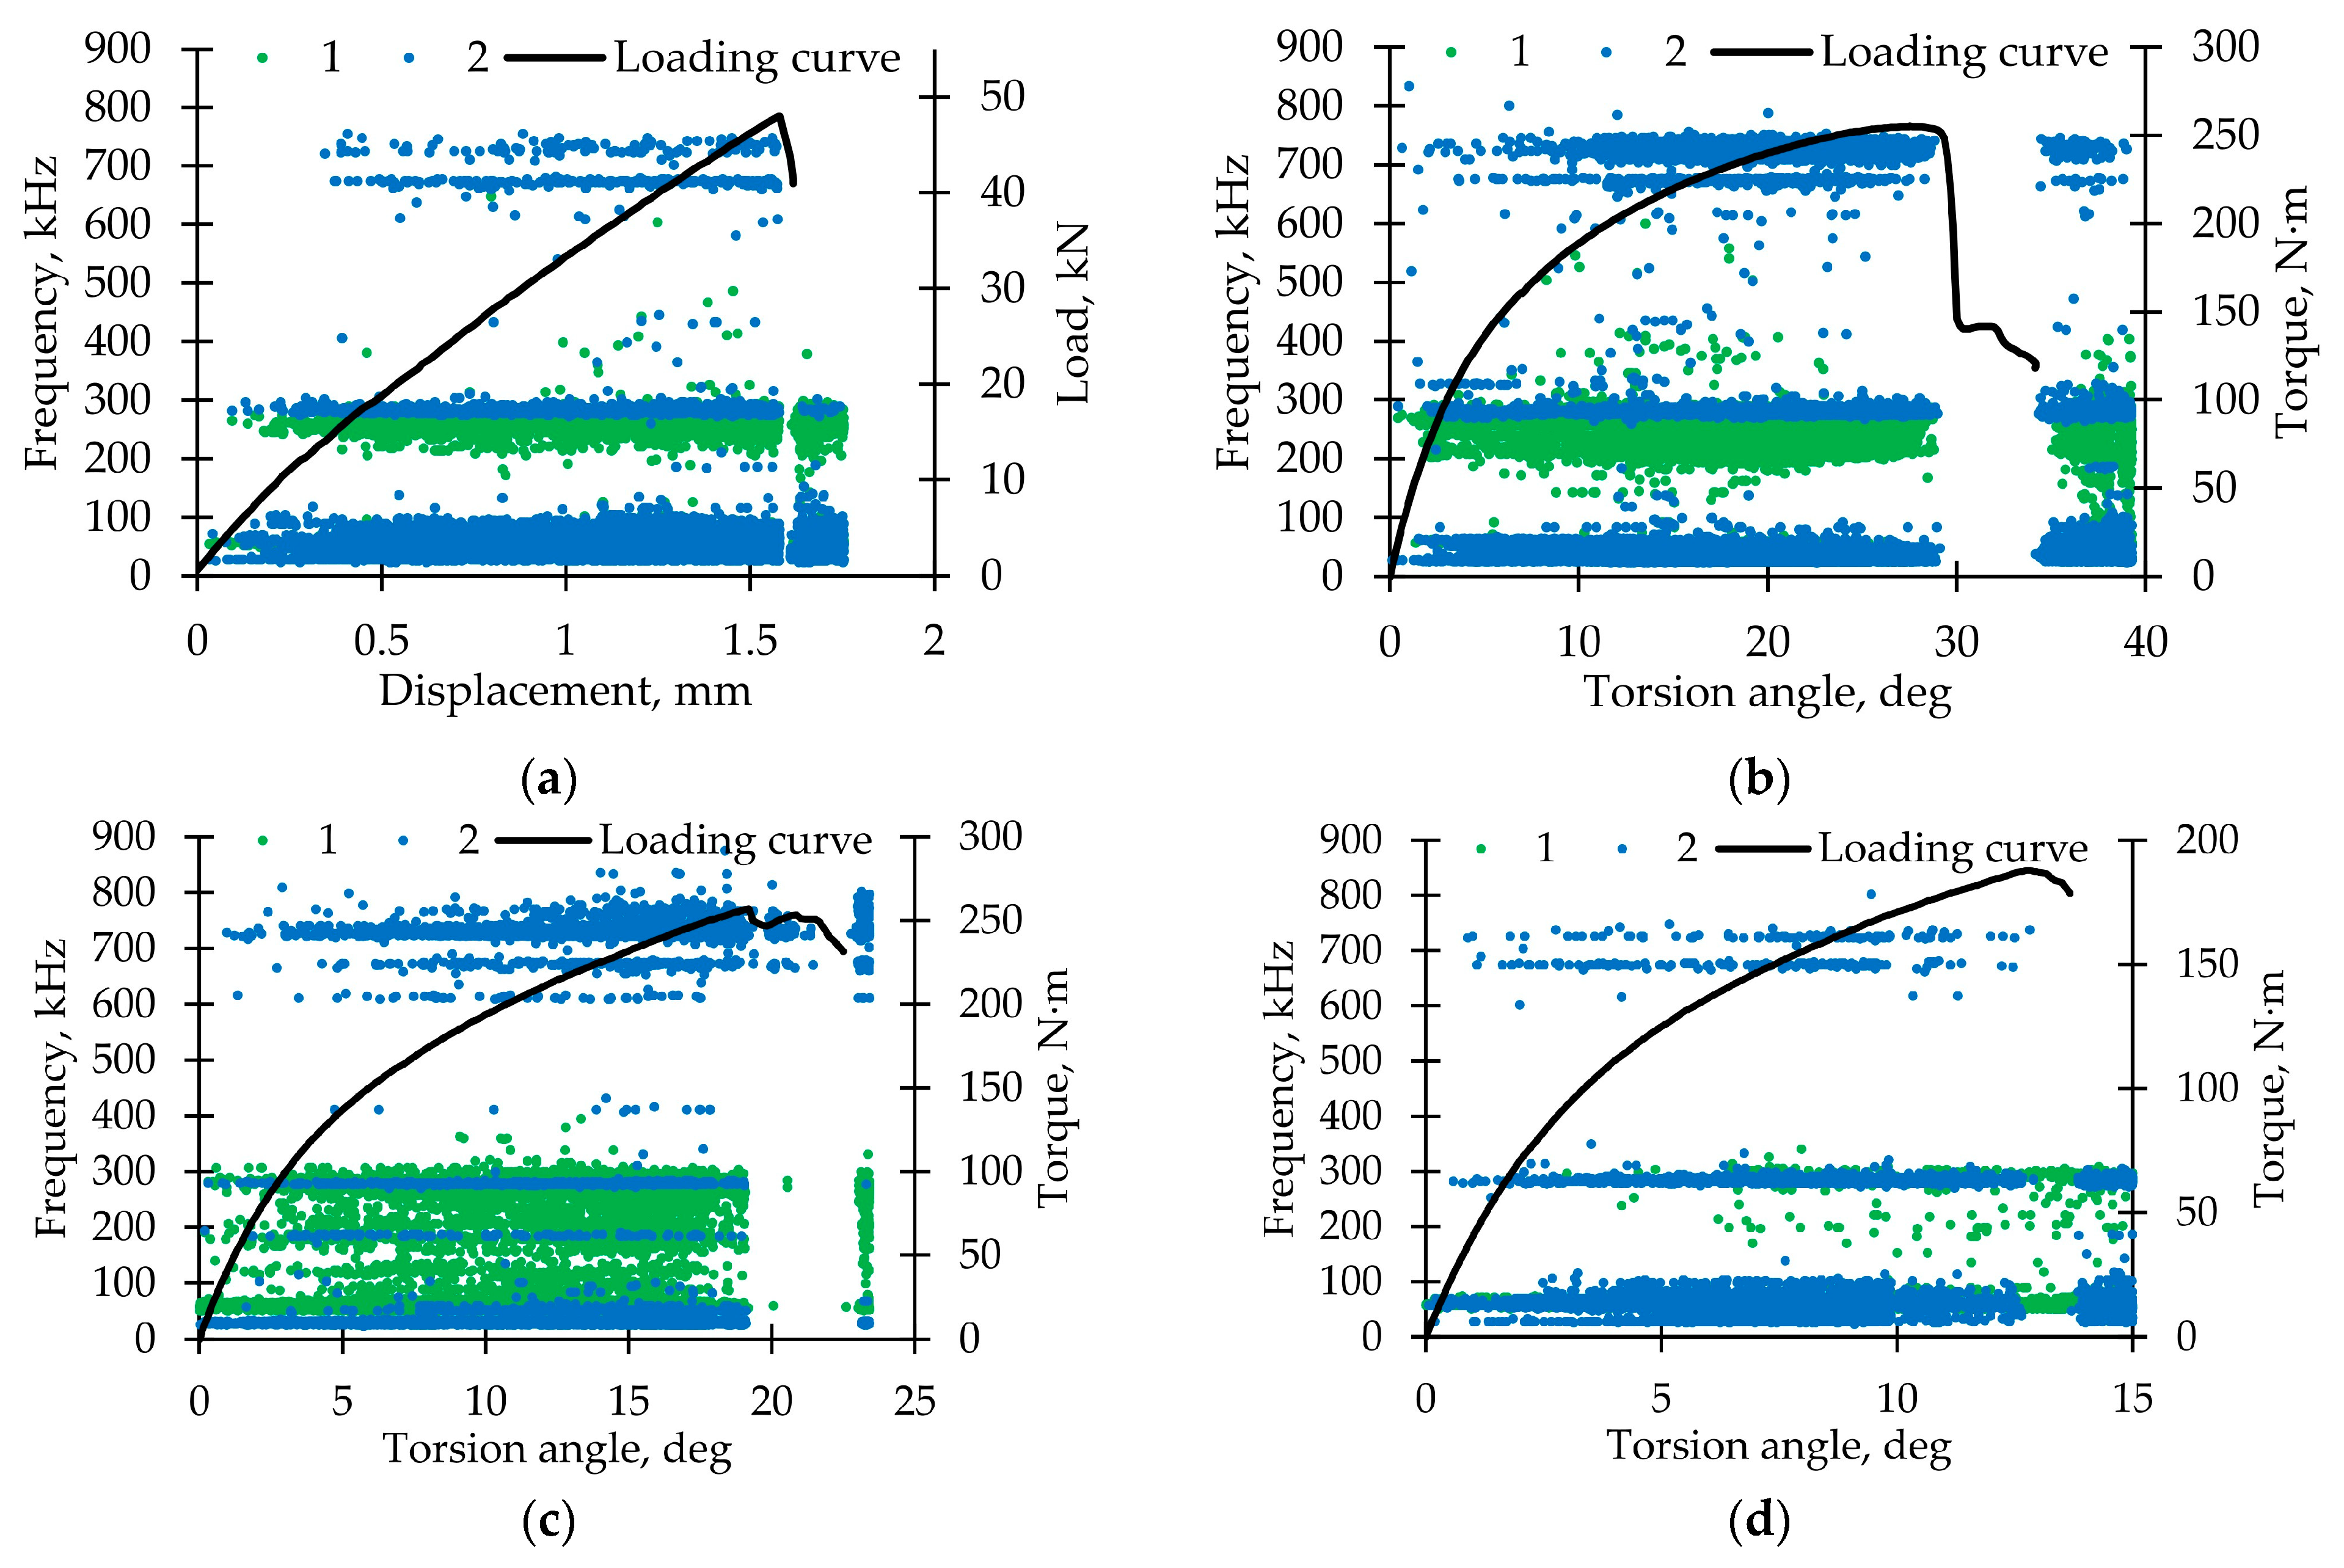
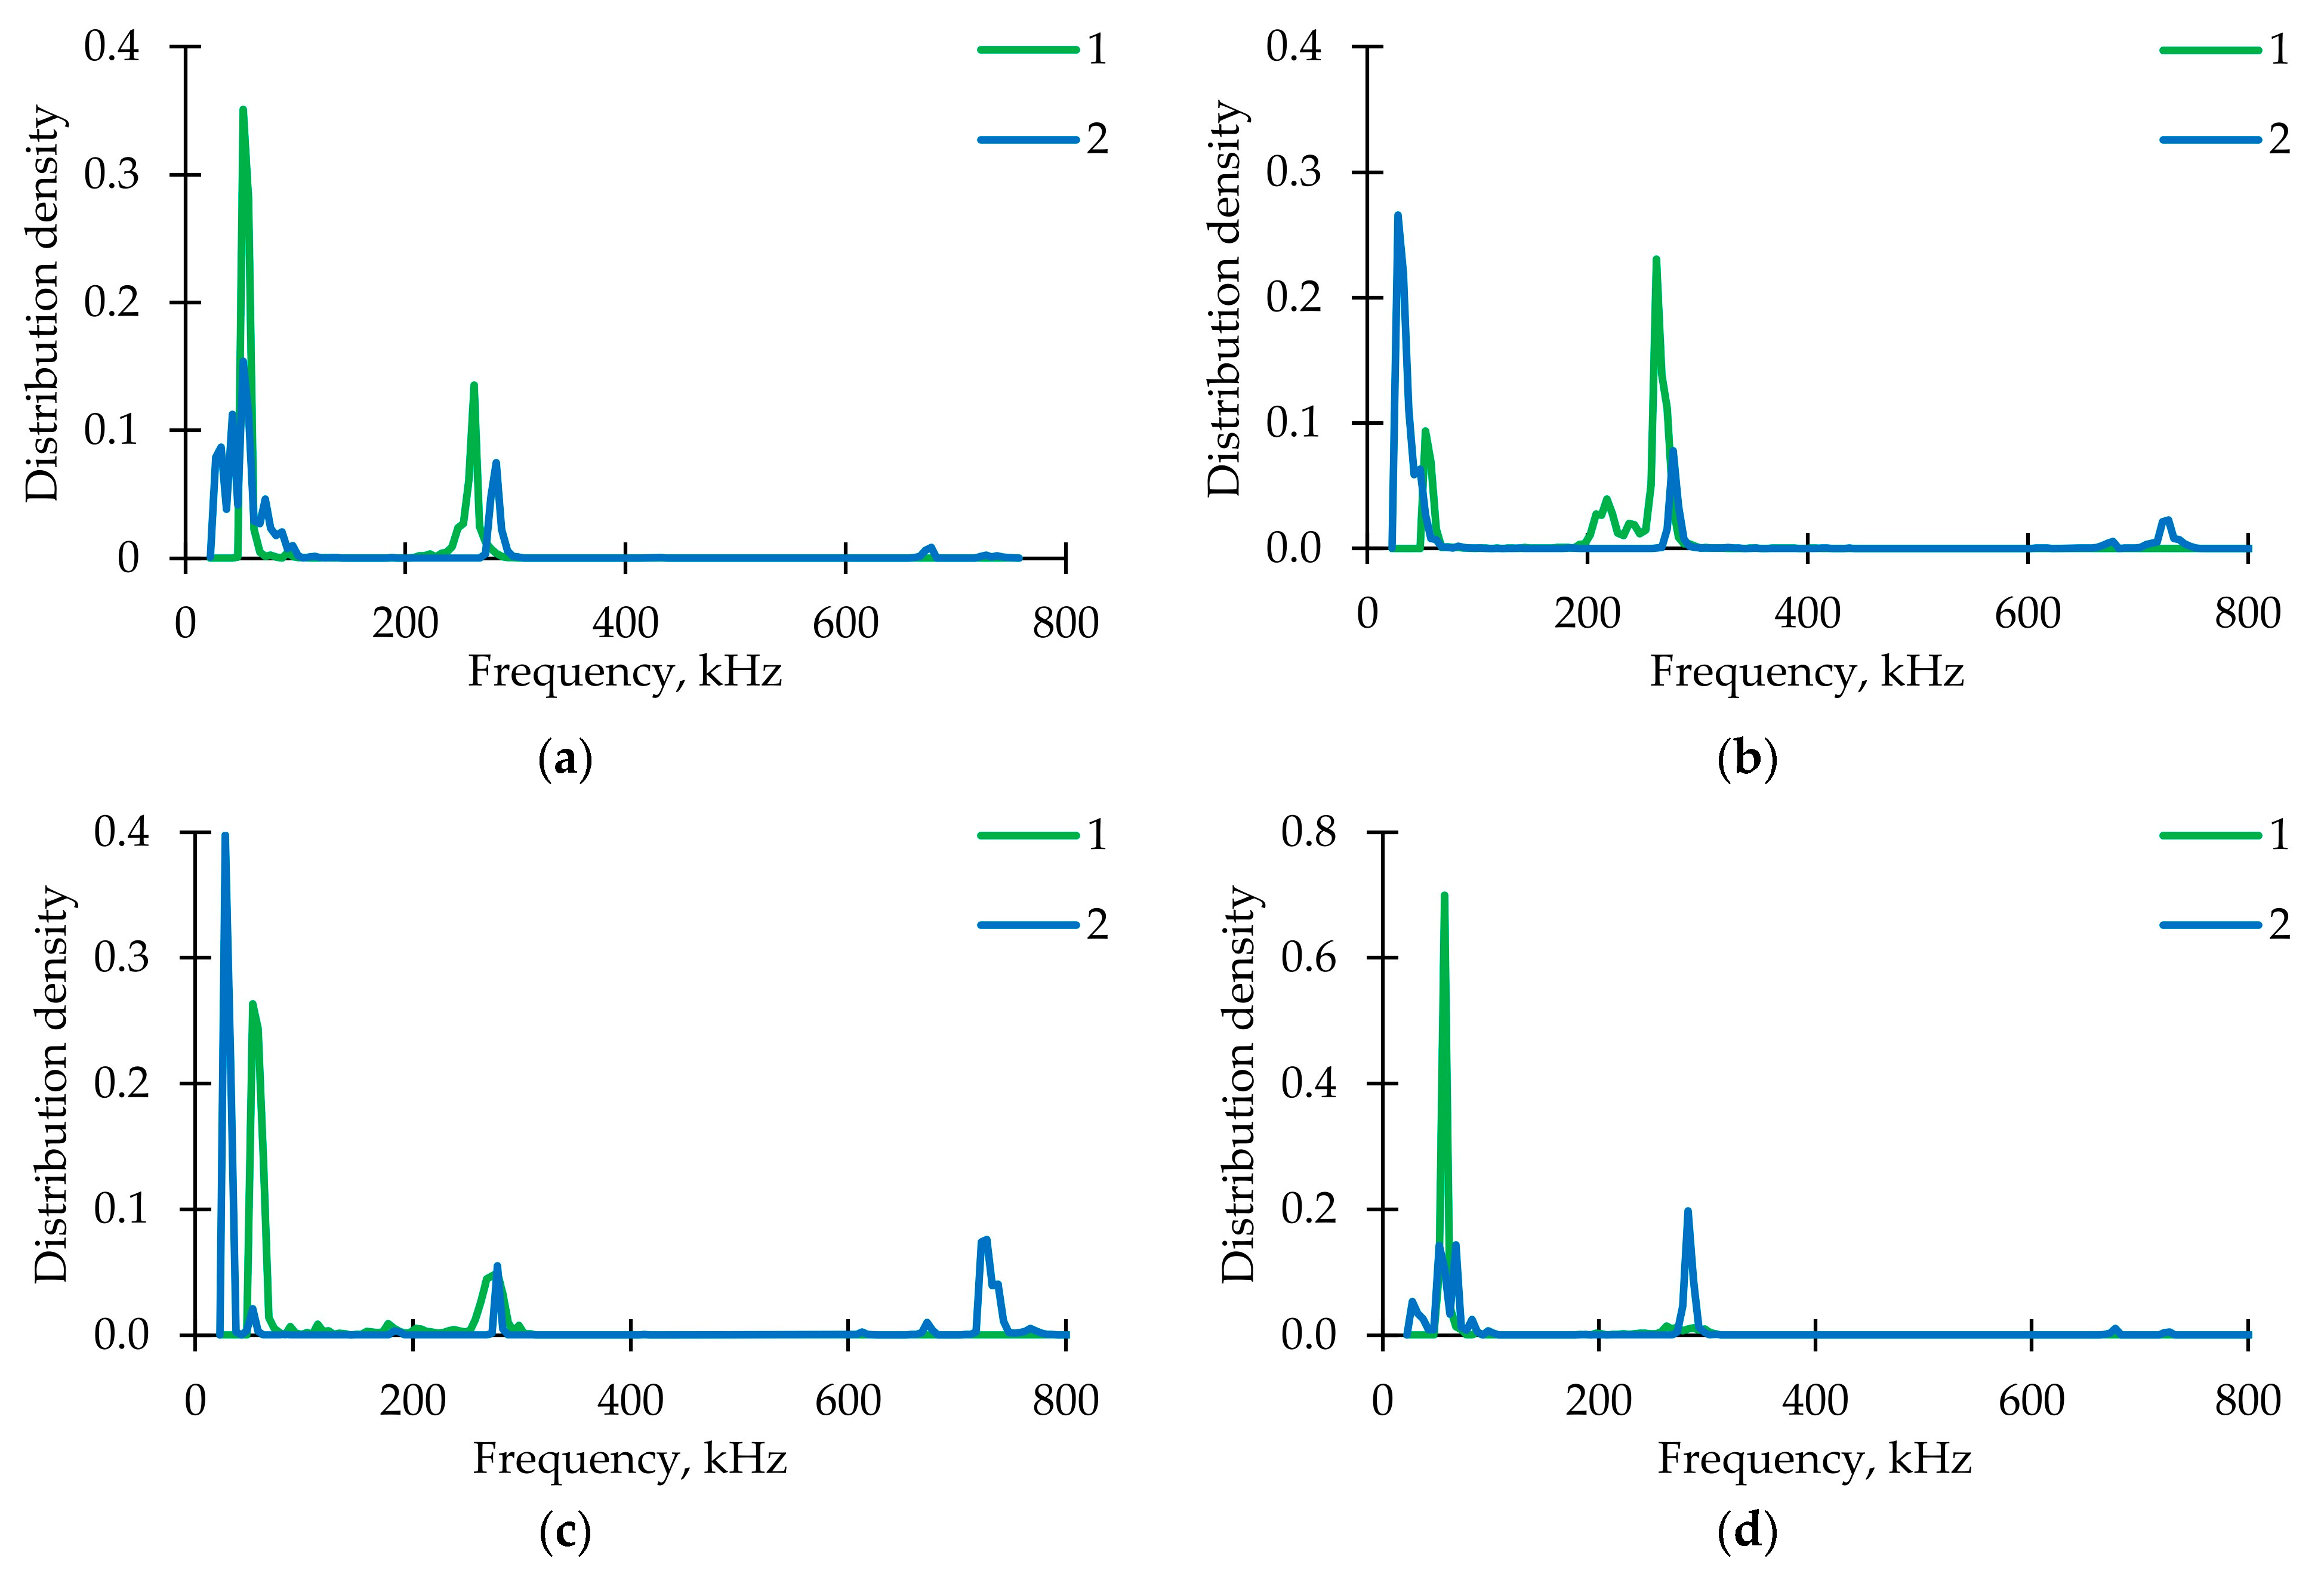
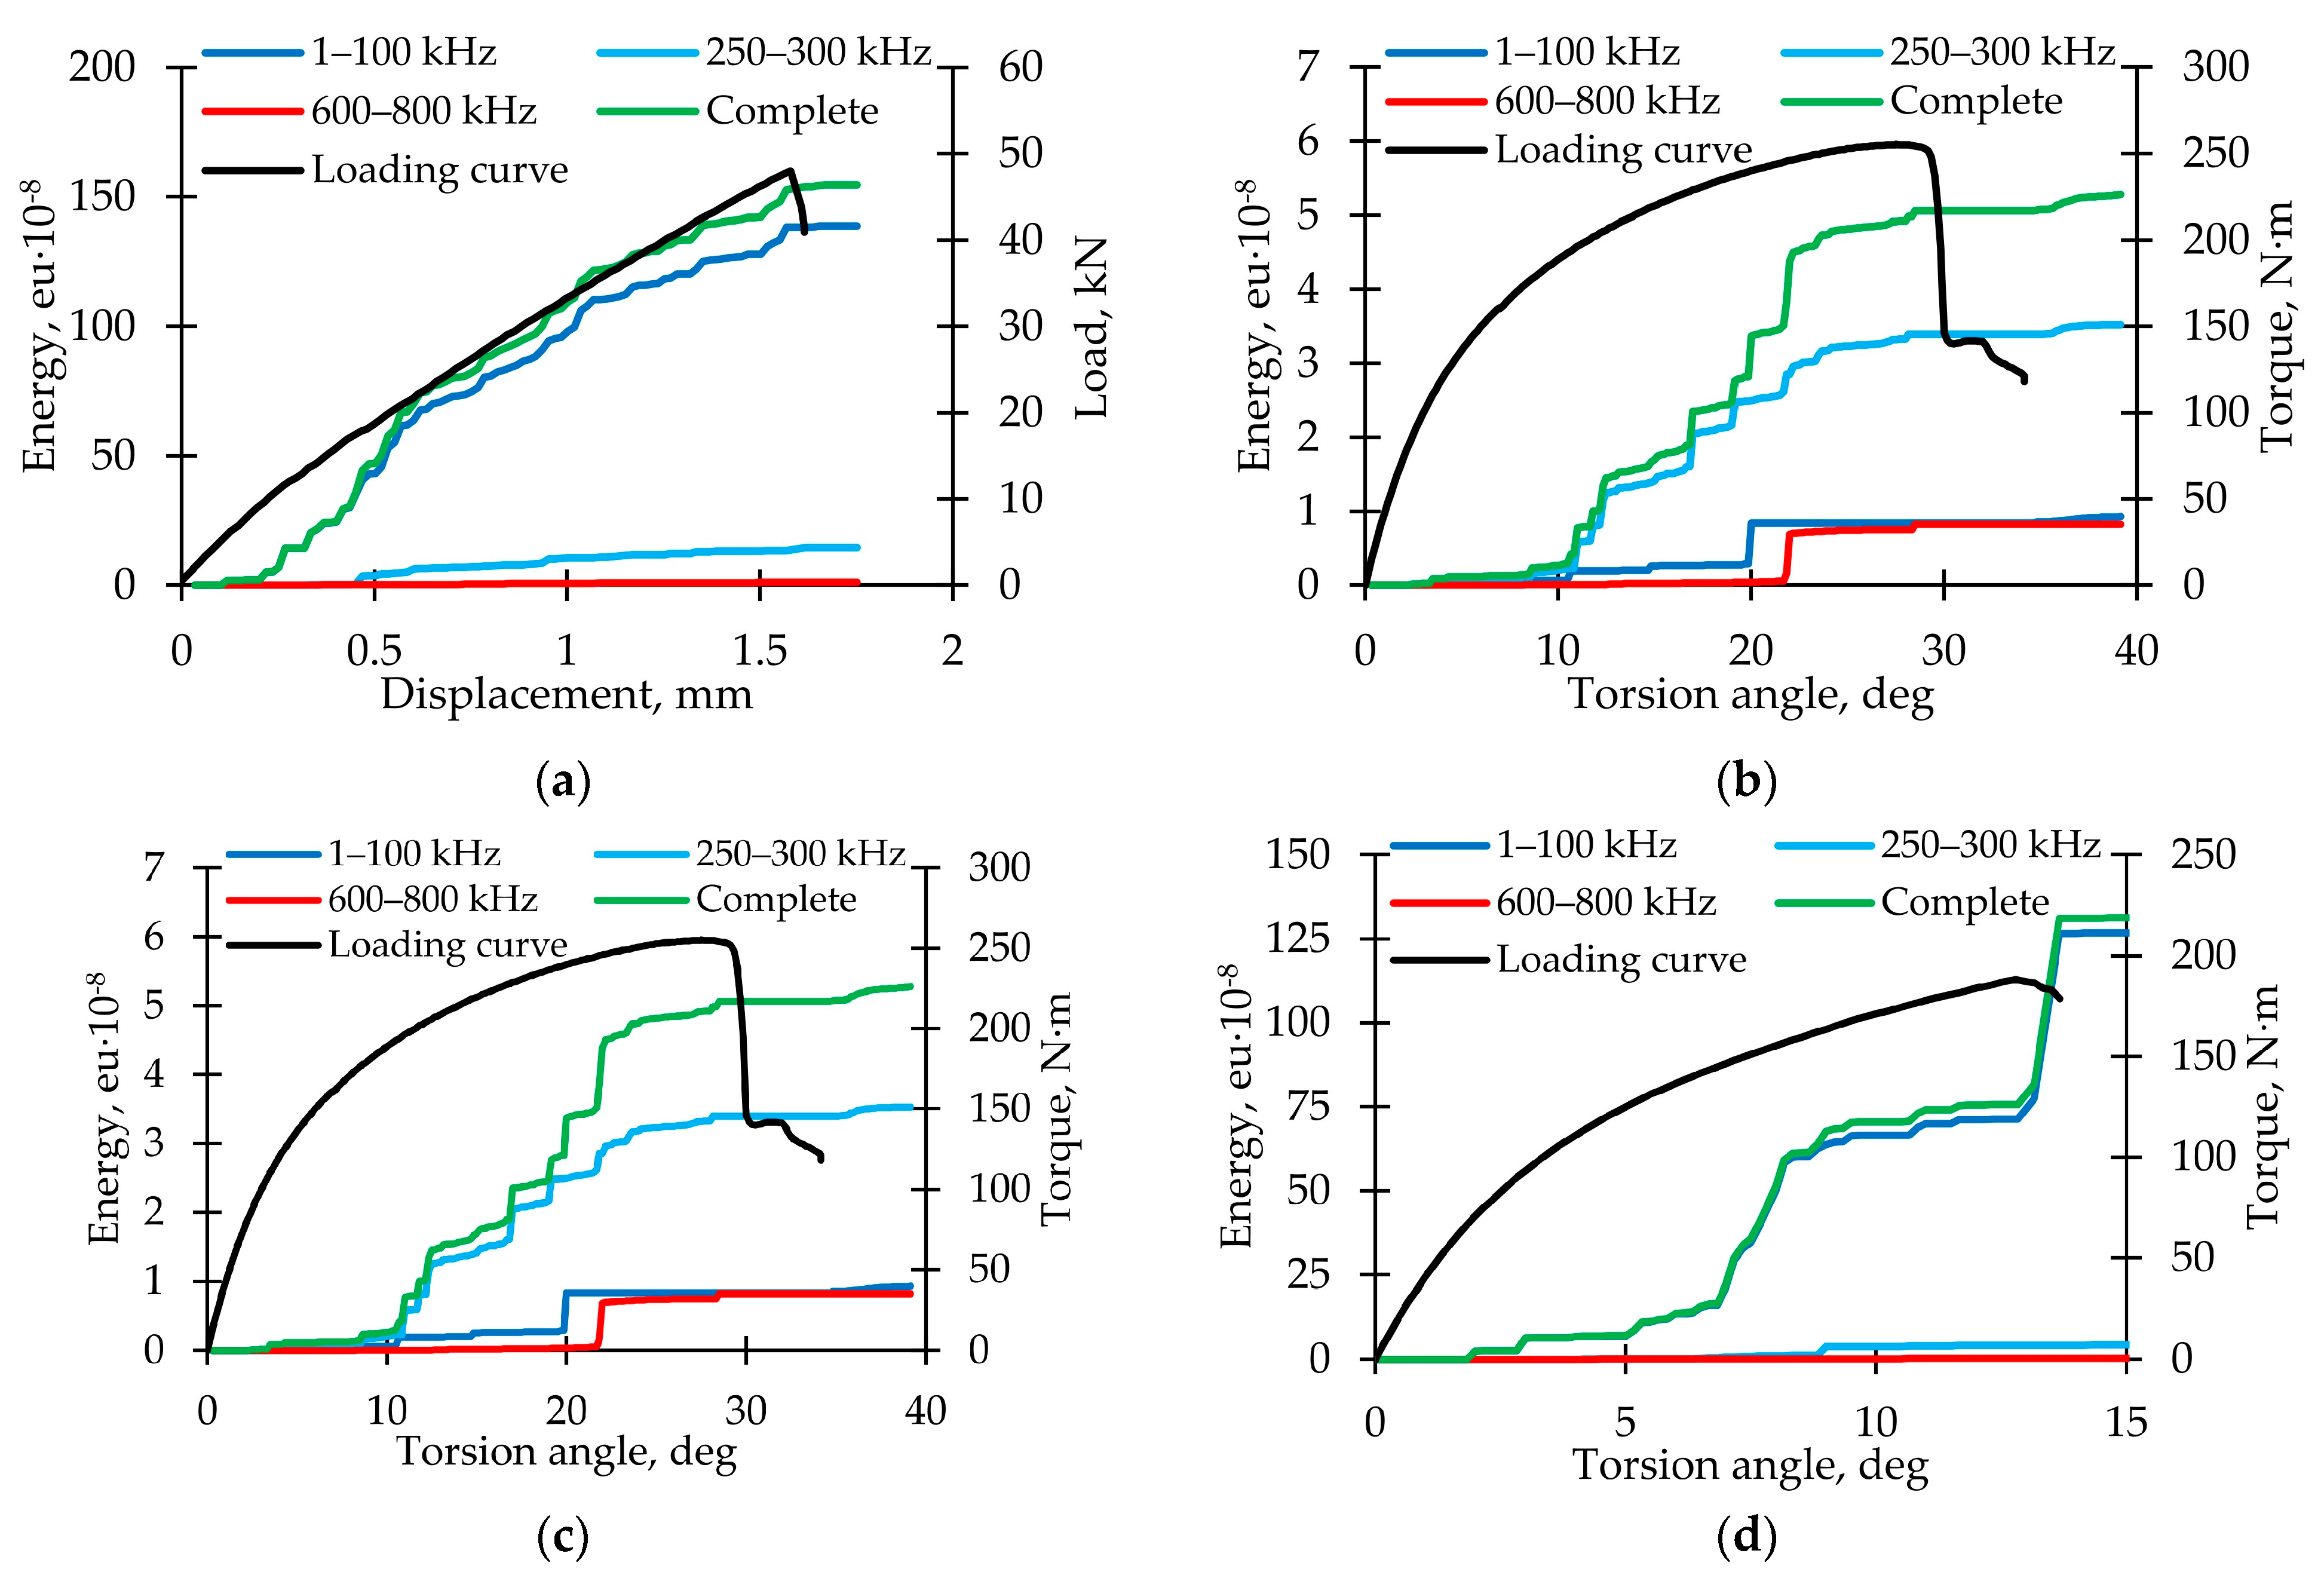
3.1.4. Analysis of Acoustic Emission Signals
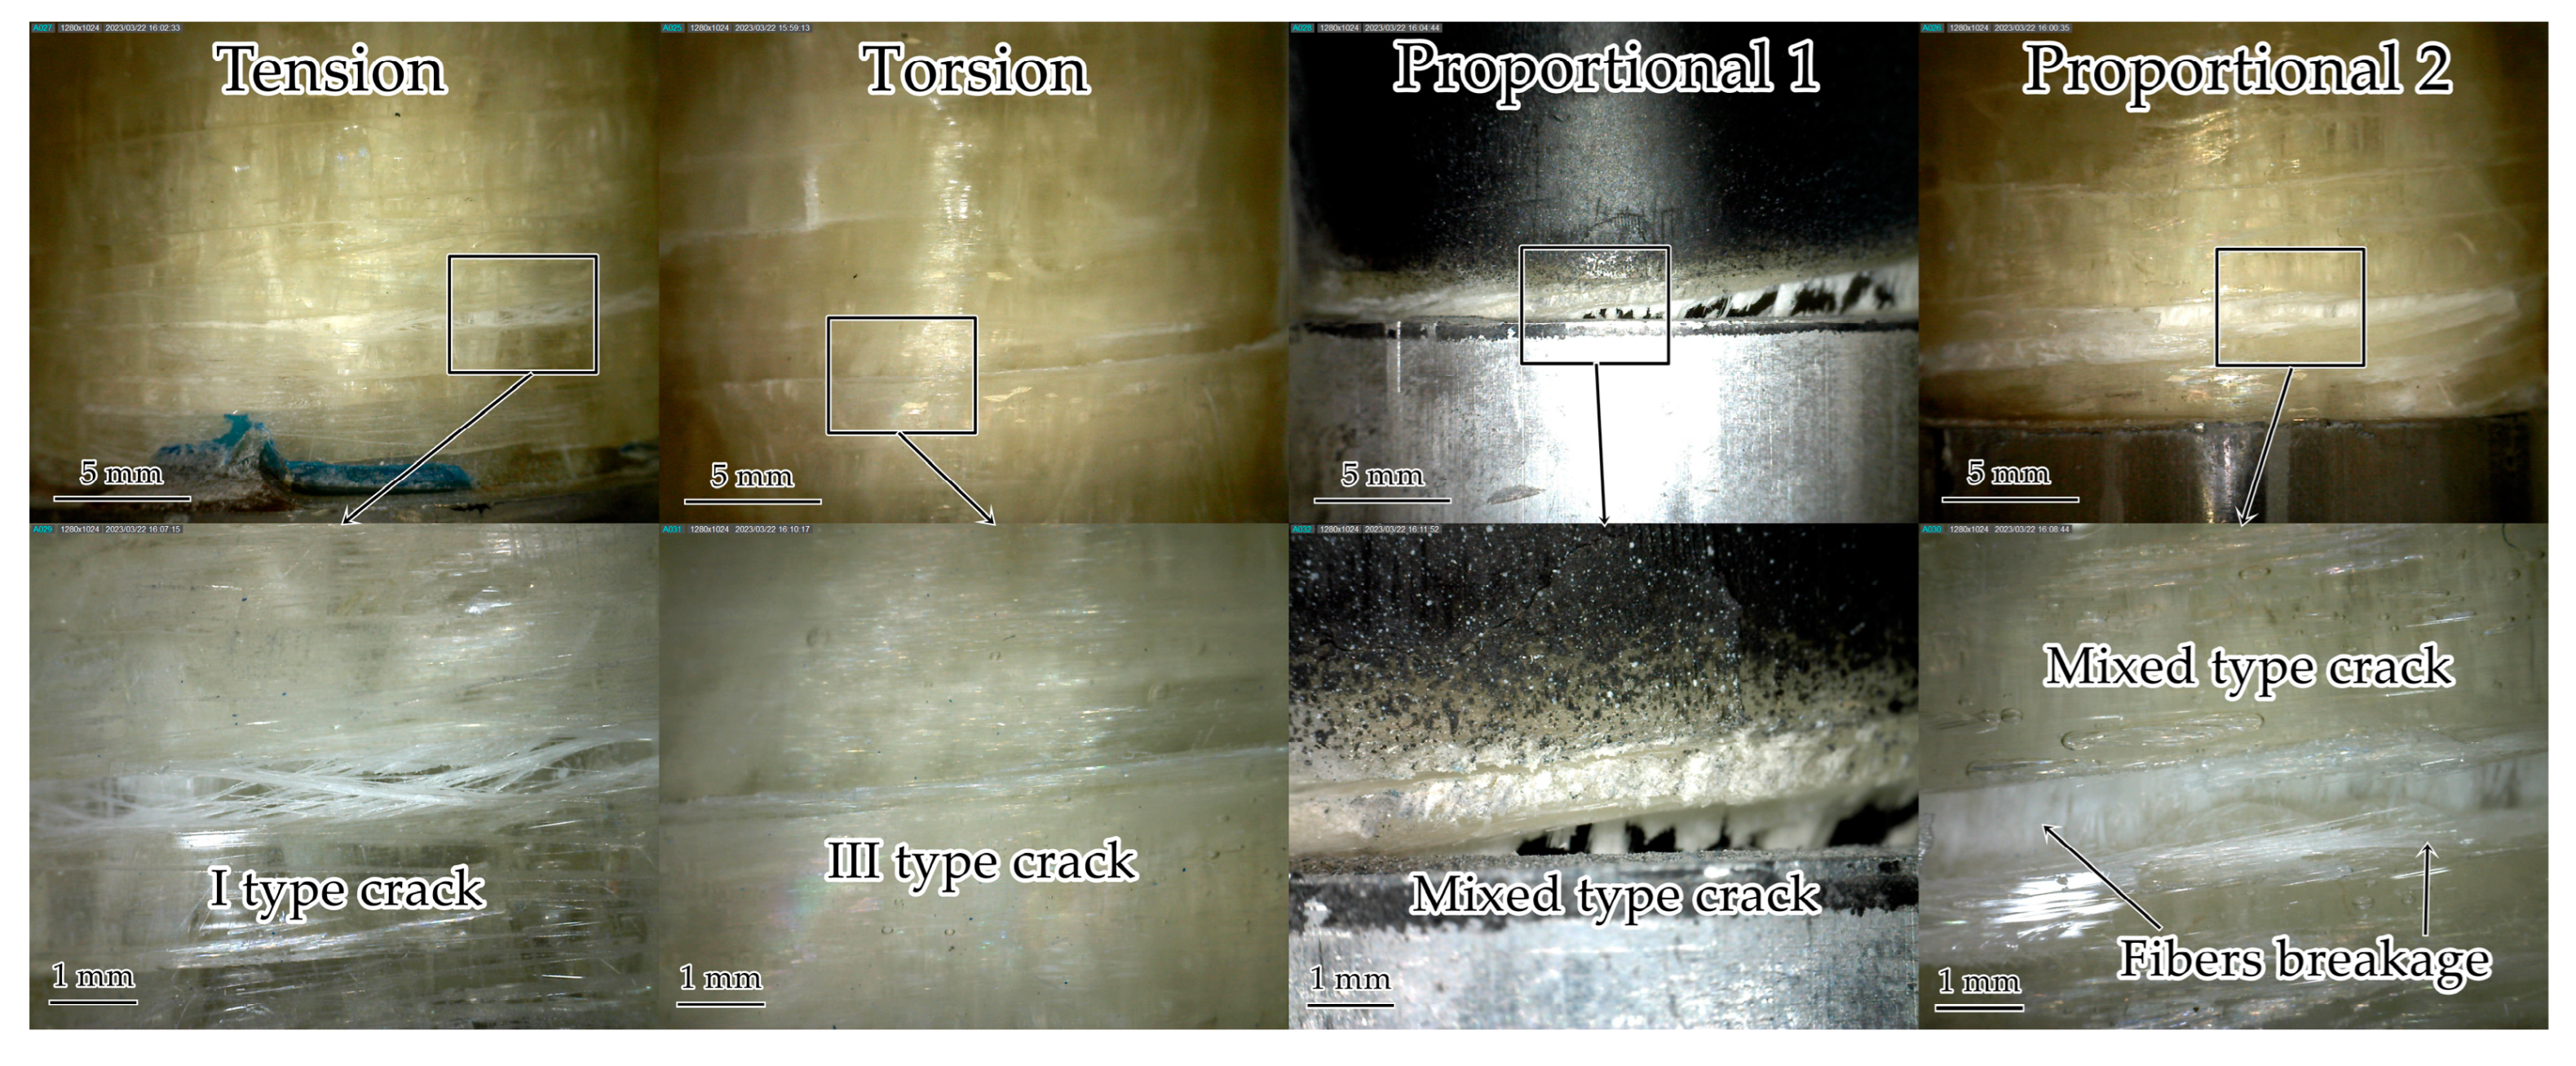
3.1.5. Surface Defects after Static Failure
3.2. Cyclic Loading
3.2.1. Fatigue Test Results
3.2.2. Approximation and Analysis of Fatigue Sensitivity Curves
3.2.3. Analysis of Acoustic Emission Signals
3.2.4. Surface Defects after Fatigue Failure
4. Conclusions
Author Contributions
Funding
Institutional Review Board Statement
Data Availability Statement
Acknowledgments
Conflicts of Interest
References
- Geier, N.; Patra, K.; Anand, R.; Ashworth, S.; Balázs, B.Z.; Lukács, T.; Magyar, G.; Tamás-Bényei, P.; Xu, J.; Davim, J.P. A critical review on mechanical micro-drilling of glass and carbon fibre reinforced polymer (GFRP and CFRP) composites. Compos. Part B Eng. 2023, 254, 110589. [Google Scholar] [CrossRef]
- Gao, H.; Sun, Y.; Jian, J.; Dong, Y.; Liu, H. Study on mechanical properties and application in communication pole line engineering of glass fiber reinforced polyurethane composites (GFRP). Case Stud. Constr. Mater. 2023, 18, e01942. [Google Scholar] [CrossRef]
- Liu, Y.; Zhang, H.; Tafsirojjaman, T.; Dogar, A.R.; AlAjarmeh, O.; Yue, Q.; Manalo, A. A novel technique to improve the compressive strength and ductility of glass fiber reinforced polymer (GFRP) composite bars. Constr. Build. Mater. 2022, 326, 126782. [Google Scholar] [CrossRef]
- Sarfraz, M.S.; Hong, H.; Kim, S.S. Recent developments in the manufacturing technologies of composite components and their cost-effectiveness in the automotive industry: A review study. Compos. Struct. 2021, 266, 113864. [Google Scholar] [CrossRef]
- Collinson, M.G.; Bower, M.P.; Swait, T.J.; Atkins, C.P.; Hayes, S.A.; Nuhiji, B. Novel composite curing methods for sustainable manufacture: A review. Compos. Part C Open Access 2022, 9, 100293. [Google Scholar] [CrossRef]
- Hunt, C.J.; Morabito, F.; Grace, C.; Zhao, Y.; Woods, B.K. A review of composite lattice structures. Compos. Struct. 2022, 284, 115120. [Google Scholar] [CrossRef]
- Cheng, X.; Gong, Y.; Liu, Y.; Wu, Z.; Hu, X. Prediction of residual mechanical properties in flexure-after-impact of woven composite beams through electrical resistance measurement. Compos. Struct. 2020, 240, 112066. [Google Scholar] [CrossRef]
- Shim, V.P.W.; Yang, L.M. Characterization of the residual mechanical properties of woven fabric reinforced composites after low-velocity impact. Int. J. Mech. Sci. 2005, 47, 647–665. [Google Scholar] [CrossRef]
- Whitworth, H.A. Evaluation of the residual strength degradation in composite laminates under fatigue loading. Compos. Struct. 2000, 48, 261–264. [Google Scholar] [CrossRef]
- Staroverov, O.; Lobanov, D. Estimation of residual fatigue life of polymer composites after preliminary low-velocity impact. Proc. Struct. Integr. 2022, 37, 804–810. [Google Scholar] [CrossRef]
- Mirbagheri, M.; Rahmani, O.; Mirbagheri, Y. Estimation of residual tensile strength of composite laminate after low-velocity impact using visually inspection. Eng. Fail. Anal. 2022, 131, 105898. [Google Scholar] [CrossRef]
- Staroverov, O.; Lobanov, D.; Strungar, E.; Lunegova, E. Evaluation of the influence of preliminary low-velocity impacts on the residual fatigue life of CFRP composites. Int. J. Struct. Integr. 2023, 14, 44–56. [Google Scholar] [CrossRef]
- Vassilopoulos, A.P. Fatigue Life Prediction of Composites and Composite Structures, 2nd ed.; Woodhead Publishing: Sawston, UK, 2019. [Google Scholar]
- Kaminski, M.; Laurin, F.; Maire, F.J.; Rakotoarisoa, C.; Hemon, E. Fatigue damage modeling of composite structures: The ONERA viewpoint. AerospaceLab 2015, 9, 1–12. [Google Scholar] [CrossRef]
- Philippidis, T.P.; Passipoularidis, V.A. Residual strength after fatigue in composites: Theory vs. experiment. Int. J. Fatigue 2007, 29, 2104–2116. [Google Scholar] [CrossRef]
- Shiri, S.; Yazdani, M.; Pourgol-Mohammad, M. A fatigue damage accumulation model based on stiffness degradation of composite materials. Mater. Des. 2015, 88, 1290–1295. [Google Scholar] [CrossRef]
- Khoshmanesh, S.; Watson, S.J.; Zarouchas, D. The effect of the fatigue damage accumulation process on the damping and stiffness properties of adhesively bonded composite structures. Compos. Struct. 2022, 287, 115328. [Google Scholar] [CrossRef]
- Gao, J.; Zhu, P.; Yuan, Y.; Wu, Z.; Xu, R. Strength and stiffness degradation modeling and fatigue life prediction of composite materials based on a unified fatigue damage model. Eng. Fail. Anal. 2022, 137, 106290. [Google Scholar] [CrossRef]
- Vassilopoulos, A.P. The history of fiber-reinforced polymer composite laminate fatigue. Int. J. Fatigue 2020, 134, 105512. [Google Scholar] [CrossRef]
- Liu, T.; Shi, X.; Zhang, J.; Fei, B. Crack initiation and propagation of 30CrMnSiA steel under uniaxial and multiaxial cyclic loading. Int. J. Fatigue 2019, 122, 240–255. [Google Scholar] [CrossRef]
- Wang, Q.; Xin, C.; Sun, Q.; Xiao, L.; Sun, J. Biaxial fatigue behavior of gradient structural purity titanium under in-phase and out-of-phase loading. Int. J. Fatigue 2018, 116, 602–609. [Google Scholar] [CrossRef]
- Zhang, J.; Shi, X.; Fei, B. High cycle fatigue and fracture mode analysis of 2A12-T4 aluminum alloy under out-of-phase axial-torsion constant amplitude loading. Int. J. Fatigue 2012, 38, 144–154. [Google Scholar] [CrossRef]
- Wang, Y.; Yao, W. A multiaxial fatigue criterion for various metallic materials under proportional and nonproportional loading. Int. J. Fatigue 2006, 28, 401–408. [Google Scholar] [CrossRef]
- Pejkowski, L.; Skibicki, D.; Seyda, J. Stress-strain response and fatigue life of a material subjected to asynchronous loadings. AIP Conf. Proc. 2018, 2028, 020016. [Google Scholar] [CrossRef]
- Skibicki, D.; Pejkowski, L. Low-cycle multiaxial fatigue behaviour and fatigue life prediction for CuZn37 brass using the stress-strain models. Int. J. Fatigue 2017, 102, 18–36. [Google Scholar] [CrossRef]
- Gates, N.R.; Fatemi, A. On the consideration of normal and shear stress interaction in multiaxial fatigue damage analysis. Int. J. Fatigue 2017, 100, 322–336. [Google Scholar] [CrossRef]
- Gu, A.; Luo, Y.; Xu, B. Continuous condition monitoring of reinforced concrete using an active diagnosis method. Struct. Health Monit. 2016, 15, 104–111. [Google Scholar] [CrossRef]
- Papuga, J.; Halama, R. Mean stress effect in multiaxial fatigue limit criteria. Arch. Appl. Mech. 2018, 89, 823–834. [Google Scholar] [CrossRef]
- Sines, G. Failure of Materials under Combined Repeated Stresses with Superimposed Static Stress; National Advisory Committee for Aeronautics: Washington, DC, USA, 1955.
- Mitukiewicz, G.; Głogowski, M.; Stelmach, J.; Leyko, J.; Dimitrova, Z.; Batory, D. Strengthening of cruciform sample arms for large strains during biaxial stretching. Mater. Today Commun. 2019, 21, 100692. [Google Scholar] [CrossRef]
- Serna Moreno, M.C.; Muñoz, S.H. Elastic stability in biaxial testing with cruciform specimens subjected to compressive loading. Compos. Struct. 2020, 234, 111697. [Google Scholar] [CrossRef]
- Mateen, M.A.; Ravi Shankar, D.V.; Hussain, M.M. A Review on Cruciform Shaped FRP Composites Laminates under Biaxial Testing. Mater. Today Proc. 2018, 5, 20837–20841. [Google Scholar] [CrossRef]
- Fang, P.; Xu, Y.; Gao, Y.; Ali, L.; Bai, Y. Mechanical responses of a fiberglass flexible pipe subject to tension & internal pressure. Thin-Walled Struct. 2022, 181, 110107. [Google Scholar] [CrossRef]
- Lee, P.A.; Kim, S.; Stakenborghs, B.; Suh, Y.; Choi, S. Development of hydro-axial tension method for whole pipe butt-fusion joint tensile test. Polym. Test. 2022, 109, 107553. [Google Scholar] [CrossRef]
- Du, F.; Wang, J.J.; Tan, T. Using Spiral Notch Torsional Test to Investigate Fracture of Unidirectional Fiber Reinforced Composites. In Reference Module in Materials Science and Materials Engineering; Elsevier: Amsterdam, The Netherlands, 2023. [Google Scholar] [CrossRef]
- Capela, C.; Ferreira, J.A.M.; Febra, T.; Costa, J.D. Fatigue strength of tubular carbon fibre composites under bending/torsion loading. Int. J. Fatigue 2015, 70, 216–222. [Google Scholar] [CrossRef]
- Wang, Y.; Wang, Y.; Hou, C.; Zhou, X.; Deng, R.; Lan, Y.; Luo, W.; Kong, W. Combined compression-bending-torsion behaviour of CFST columns confined by CFRP for marine structures. Compos. Struct. 2020, 242, 112181. [Google Scholar] [CrossRef]
- Demiral, M.; Abbassi, F.; Muhammad, R.; Akpinar, S. Service Life Modelling of Single Lap Joint Subjected to Cyclic Bending Load. Aerospace 2023, 10, 8. [Google Scholar] [CrossRef]
- Armanfard, A.; Melenka, G.W. Experimental evaluation of carbon fibre, fibreglass and aramid tubular braided composites under combined tension–torsion loading. Compos. Struct. 2021, 269, 114049. [Google Scholar] [CrossRef]
- Chang, Y.; Wen, W.; Xu, Y.; Cui, H.; Xu, Y. Quasi-static mechanical behavior of filament wound composite thin-walled tubes: Tension, torsion, and multi-axial loading. Thin-Walled Struct. 2022, 177, 109361. [Google Scholar] [CrossRef]
- Tableau, N.; Aboura, Z.; Khellil, K.; Laurin, F.; Schneider, J. Multiaxial loading on a 3D woven carbon fiber reinforced plastic composite using tensile-torsion tests: Identification of the first damage envelope and associated damage mechanisms. Compos. Struct. 2019, 227, 111305. [Google Scholar] [CrossRef]
- Hinton, M.; Kaddour, A. Triaxial test results for fibre-reinforced composites: The Second World-Wide Failure Exercise benchmark data. J. Compos. Mater. 2012, 47, 653–678. [Google Scholar] [CrossRef]
- Kawakami, H.; Fujii, T.J.; Morita, Y. Fatigue Degradation and Life Prediction of Glass Fabric Polymer Composite under Tension/Torsion Biaxial Loadings. J. Reinf. Plast. Compos. 1996, 15, 183–195. [Google Scholar] [CrossRef]
- Quaresimin, M.; Susmel, L.; Talreja, R. Fatigue behavior and live assessment of composite laminates under multiaxial loadings. Int. J. Fatigue 2010, 32, 2–16. [Google Scholar] [CrossRef]
- Wil’deman, V.E.; Staroverov, O.A.; Lobanov, D.S. Diagram and parameters of fatigue sensitivity for evaluating the residual strength of layered GFRP composites after preliminary cyclic loadings. Mech. Compos. Mater. 2018, 54, 313–320. [Google Scholar] [CrossRef]
- Wildemann, V.E.; Staroverov, O.A.; Yankin, A.S.; Mugatarov, A.I. Description of fatigue sensitivity curves and transition to critical states of polymer composites by cumulative distribution functions. Frat. Integrita Strutt. 2023, 17, 91–99. [Google Scholar] [CrossRef]
- Wu, Z.; Fang, G.; Fu, M.; Chen, X.; Liang, J.; Lv, D. Random fatigue damage accumulation analysis of composite thin-wall structures based on residual stiffness method. Compos. Struct. 2019, 211, 546–556. [Google Scholar] [CrossRef]
- Lu, W.; Gao, Z.; Adluru, H.K.; Hoos, K.H.; Seneviratne, W.P.; Mollenhauer, D.H.; Iarve, E.V. Fatigue damage modeling in laminated composite by using Rx-FEM and strength tracking method. Compos. Part A Appl. Sci. Manuf. 2022, 163, 107199. [Google Scholar] [CrossRef]
- Guo, R.; Li, C.; Niu, Y.; Xian, G. The fatigue performances of carbon fiber reinforced polymer composites—A review. J. Mater. Res. Technol. 2022, 21, 4773–4789. [Google Scholar] [CrossRef]
- Joosten, M.W.; Dávila, C.G.; Yang, Q. Predicting fatigue damage in composites subjected to general loading conditions. Compos. Part A Appl. Sci. Manuf. 2022, 156, 106862. [Google Scholar] [CrossRef]
- Yadav, I.N.; Thapa, K.B. Strain-based theoretical fatigue damage model of woven glass-epoxy fabric composite material. Compos. Part C Open Access 2020, 3, 100067. [Google Scholar] [CrossRef]
- Mao, H.; Mahadevan, S. Fatigue damage modelling of composite materials. Compos. Struct. 2002, 58, 405–410. [Google Scholar] [CrossRef]
- Gu, Y.; Zhang, D.; Zhang, Z.; Sun, J.; Yue, S.; Li, G.; Qian, K. Torsion damage mechanisms analysis of two-dimensional braided composite tubes with digital image correction and X-ray micro-computed tomography. Compos. Struct. 2021, 256, 113020. [Google Scholar] [CrossRef]
- Xu, D.H.; Cerbu, C.; Wang, H.W.; Rosca, I.C. Analysis of the hybrid composite materials reinforced with natural fibers considering digital image correlation (DIC) measurements. Mech. Mater. 2019, 135, 46–56. [Google Scholar] [CrossRef]
- Azadi, M.; Saeedi, M.; Mokhtarishirazabad, M.; Lopez-Crespo, P. Effects of loading rate on crack growth behavior in carbon fiber reinforced polymer composites using digital image correlation technique. Compos. Part B Eng. 2019, 175, 107161. [Google Scholar] [CrossRef]
- Wildemann, V.V.; Tretyakova, T.V.; Strungar, E.M.; Tretyakov, M.P. Deformation and failure of carbon fiber composite specimens with embedded defects during tension-torsion test. Frat. Integrita Strutt. 2018, 46, 295–305. [Google Scholar] [CrossRef]
- Pankow, M.; Justusson, B.; Riosbaas, M.; Waas, A.M.; Yen, C.F. Effect of fiber architecture on tensile fracture of 3D woven textile composites. Compos. Struct. 2019, 225, 111139. [Google Scholar] [CrossRef]
- Kovács, L.; Romhány, G. Derivation of ply specific stiffness parameters of fiber reinforced polymer laminates via inverse solution of classical laminate theory. Period Polytech Mech. Eng. 2018, 62, 158–164. [Google Scholar] [CrossRef]
- Strungar, E.; Lobanov, D.; Wildemann, V. Evaluation of the Sensitivity of Various Reinforcement Patterns for Structural Carbon Fibers to Open Holes during Tensile Tests. Polymers 2021, 13, 4287. [Google Scholar] [CrossRef]
- Harizi, W.; Chaki, S.; Bourse, G.; Ourak, M. Damage mechanisms assessment of Glass Fiber-Reinforced Polymer (GFRP) composites using multivariable analysis methods applied to acoustic emission data. Compos. Struct. 2022, 289, 115470. [Google Scholar] [CrossRef]
- Rishikesan, V.; Bhagyesh, C.; Arunachalam, N. Characterisation of drilling-induced damage in GFRP Honeycomb Sandwich Composites using Acoustic Emission. Procedia Manuf. 2021, 53, 664–672. [Google Scholar] [CrossRef]
- Kishore Kumar, P.; Kuppan, P. Online monitoring of delamination mechanisms in drilling of Mwcnts reinforced Gfrp nanocomposites by acoustic emission. Mater. Today Proc. 2018, 5, 13036–13047. [Google Scholar] [CrossRef]
- Friedrich, L.; Colpo, A.; Maggi, A.; Becker, T.; Lacidogna, G.; Iturrioz, I. Damage process in glass fiber reinforced polymer specimens using acoustic emission technique with low frequency acquisition. Compos. Struct. 2021, 256, 113105. [Google Scholar] [CrossRef]
- Ichenihi, A.; Li, W.; Gao, Y.; Rao, Y. Feature selection and clustering of damage for pseudo-ductile unidirectional carbon/glass hybrid composite using acoustic emission. Appl. Acoust. 2021, 182, 108184. [Google Scholar] [CrossRef]
- Lobanov, D.S.; Zubova, E.M. Damage accumulation after temperature aging in structural GFRP in interlayer shear tests. IOP Conf. Ser. Mater. Sci. Eng. 2021, 1093, 012019. [Google Scholar] [CrossRef]
- Wildemann, V.E.; Staroverov, O.A.; Strungar, E.M.; Lunegova, E.M.; Mugatarov, A.I. Stability of Postcritical Deformation of CFRP under Static ±45° Tension with Vibrations. Polymers 2022, 14, 4502. [Google Scholar] [CrossRef]
- Taheri-Behrooz, F.; Moghaddam, H.S. Nonlinear numerical analysis of the V-notched rail shear test specimen. Polym. Test. 2018, 65, 44–53. [Google Scholar] [CrossRef]
- Fallahi, H.; Taheri-Behrooz, F.; Asadi, A. Nonlinear Mechanical Response of Polymer Matrix Composites: A Review. Polym. Rev. 2020, 60, 42–85. [Google Scholar] [CrossRef]
- Fallahi, H.; Taheri-Behrooz, F. Phenomenological Constitutive Modeling of the Non-Linear Loading-Unloading Response of UD Fiber-Reinforced Polymers. Compos. Struct. 2022, 292, 115671. [Google Scholar] [CrossRef]
- Polilov, A.N.; Tatus, N.A. Experimental substantiation of strength criteria for fibrous composites exhibiting directional characteristics of failure. PNRPU Mech. Bull. 2012, 2, 140–166. [Google Scholar]
- Hashin, Z. Failure Criteria for Unidirectional Fiber Composites. J. Appl. Mech. 1980, 47, 329–334. [Google Scholar] [CrossRef]
- Samareh-Mousavi, S.S.; Mandegarian, S.; Taheri-Behrooz, F. A nonlinear FE analysis to model progressive fatigue damage of cross-ply laminates under pin-loaded conditions. Int. J. Fatigue 2019, 119, 290–301. [Google Scholar] [CrossRef]
- Lobanov, D.S.; Lunegova, E.M.; Mugatarov, A.I. Influence of preliminary thermal aging on the residual interlayer strength and staging of damage accumulation in structural carbon plastic. PNRPU Mech. Bull. 2021, 1, 41–51. [Google Scholar] [CrossRef]
- Lobanov, D.S.; Lunegova, E.M. Evaluation of the thermal and moisture aging influence in aggressive environments on the change in the of the mechanical behavior of fiberglass by a short beam bending tests based on acoustic emission technique. PNRPU Mech. Bull. 2022, 4, 42–53. [Google Scholar] [CrossRef]


| Sample Number | Experiment Type | Loading | VIC-3D | AMSY-6 |
|---|---|---|---|---|
| 1 | Quasi-static | Tension | + | + |
| 2 | − | − | ||
| 3 | − | − | ||
| 4 | Torsion | + | + | |
| 5 | − | − | ||
| 6 | − | − | ||
| 7 | Proportional 1 | + | + | |
| 8 | − | − | ||
| 9 | Proportional 2 | + | + | |
| 10 | − | − | ||
| 11 | Cyclic | Tension | − | + |
| 12 | − | − | ||
| 13 | Torsion | − | + | |
| 14 | − | − | ||
| 15 | Proportional 1 | − | + | |
| 16 | − | − | ||
| 17 | Proportional 2 | − | + | |
| 18 | − | − |
| Sample Number | Loading | N0, Cycles |
|---|---|---|
| 11 | Tension | 49,681 |
| 12 | 30,828 | |
| 13 | Torsion | 29,306 |
| 14 | 30,638 | |
| 15 | Proportional 1 | 4274 |
| 16 | 3858 | |
| 17 | Proportional 2 | 11,523 |
| 18 | 20,525 |
Disclaimer/Publisher’s Note: The statements, opinions and data contained in all publications are solely those of the individual author(s) and contributor(s) and not of MDPI and/or the editor(s). MDPI and/or the editor(s) disclaim responsibility for any injury to people or property resulting from any ideas, methods, instructions or products referred to in the content. |
© 2023 by the authors. Licensee MDPI, Basel, Switzerland. This article is an open access article distributed under the terms and conditions of the Creative Commons Attribution (CC BY) license (https://creativecommons.org/licenses/by/4.0/).
Share and Cite
Wildemann, V.; Staroverov, O.; Strungar, E.; Mugatarov, A.; Kuchukov, A. Mechanical Properties Degradation of Fiberglass Tubes during Biaxial Proportional Cyclic Loading. Polymers 2023, 15, 2017. https://doi.org/10.3390/polym15092017
Wildemann V, Staroverov O, Strungar E, Mugatarov A, Kuchukov A. Mechanical Properties Degradation of Fiberglass Tubes during Biaxial Proportional Cyclic Loading. Polymers. 2023; 15(9):2017. https://doi.org/10.3390/polym15092017
Chicago/Turabian StyleWildemann, Valeriy, Oleg Staroverov, Elena Strungar, Artur Mugatarov, and Artur Kuchukov. 2023. "Mechanical Properties Degradation of Fiberglass Tubes during Biaxial Proportional Cyclic Loading" Polymers 15, no. 9: 2017. https://doi.org/10.3390/polym15092017