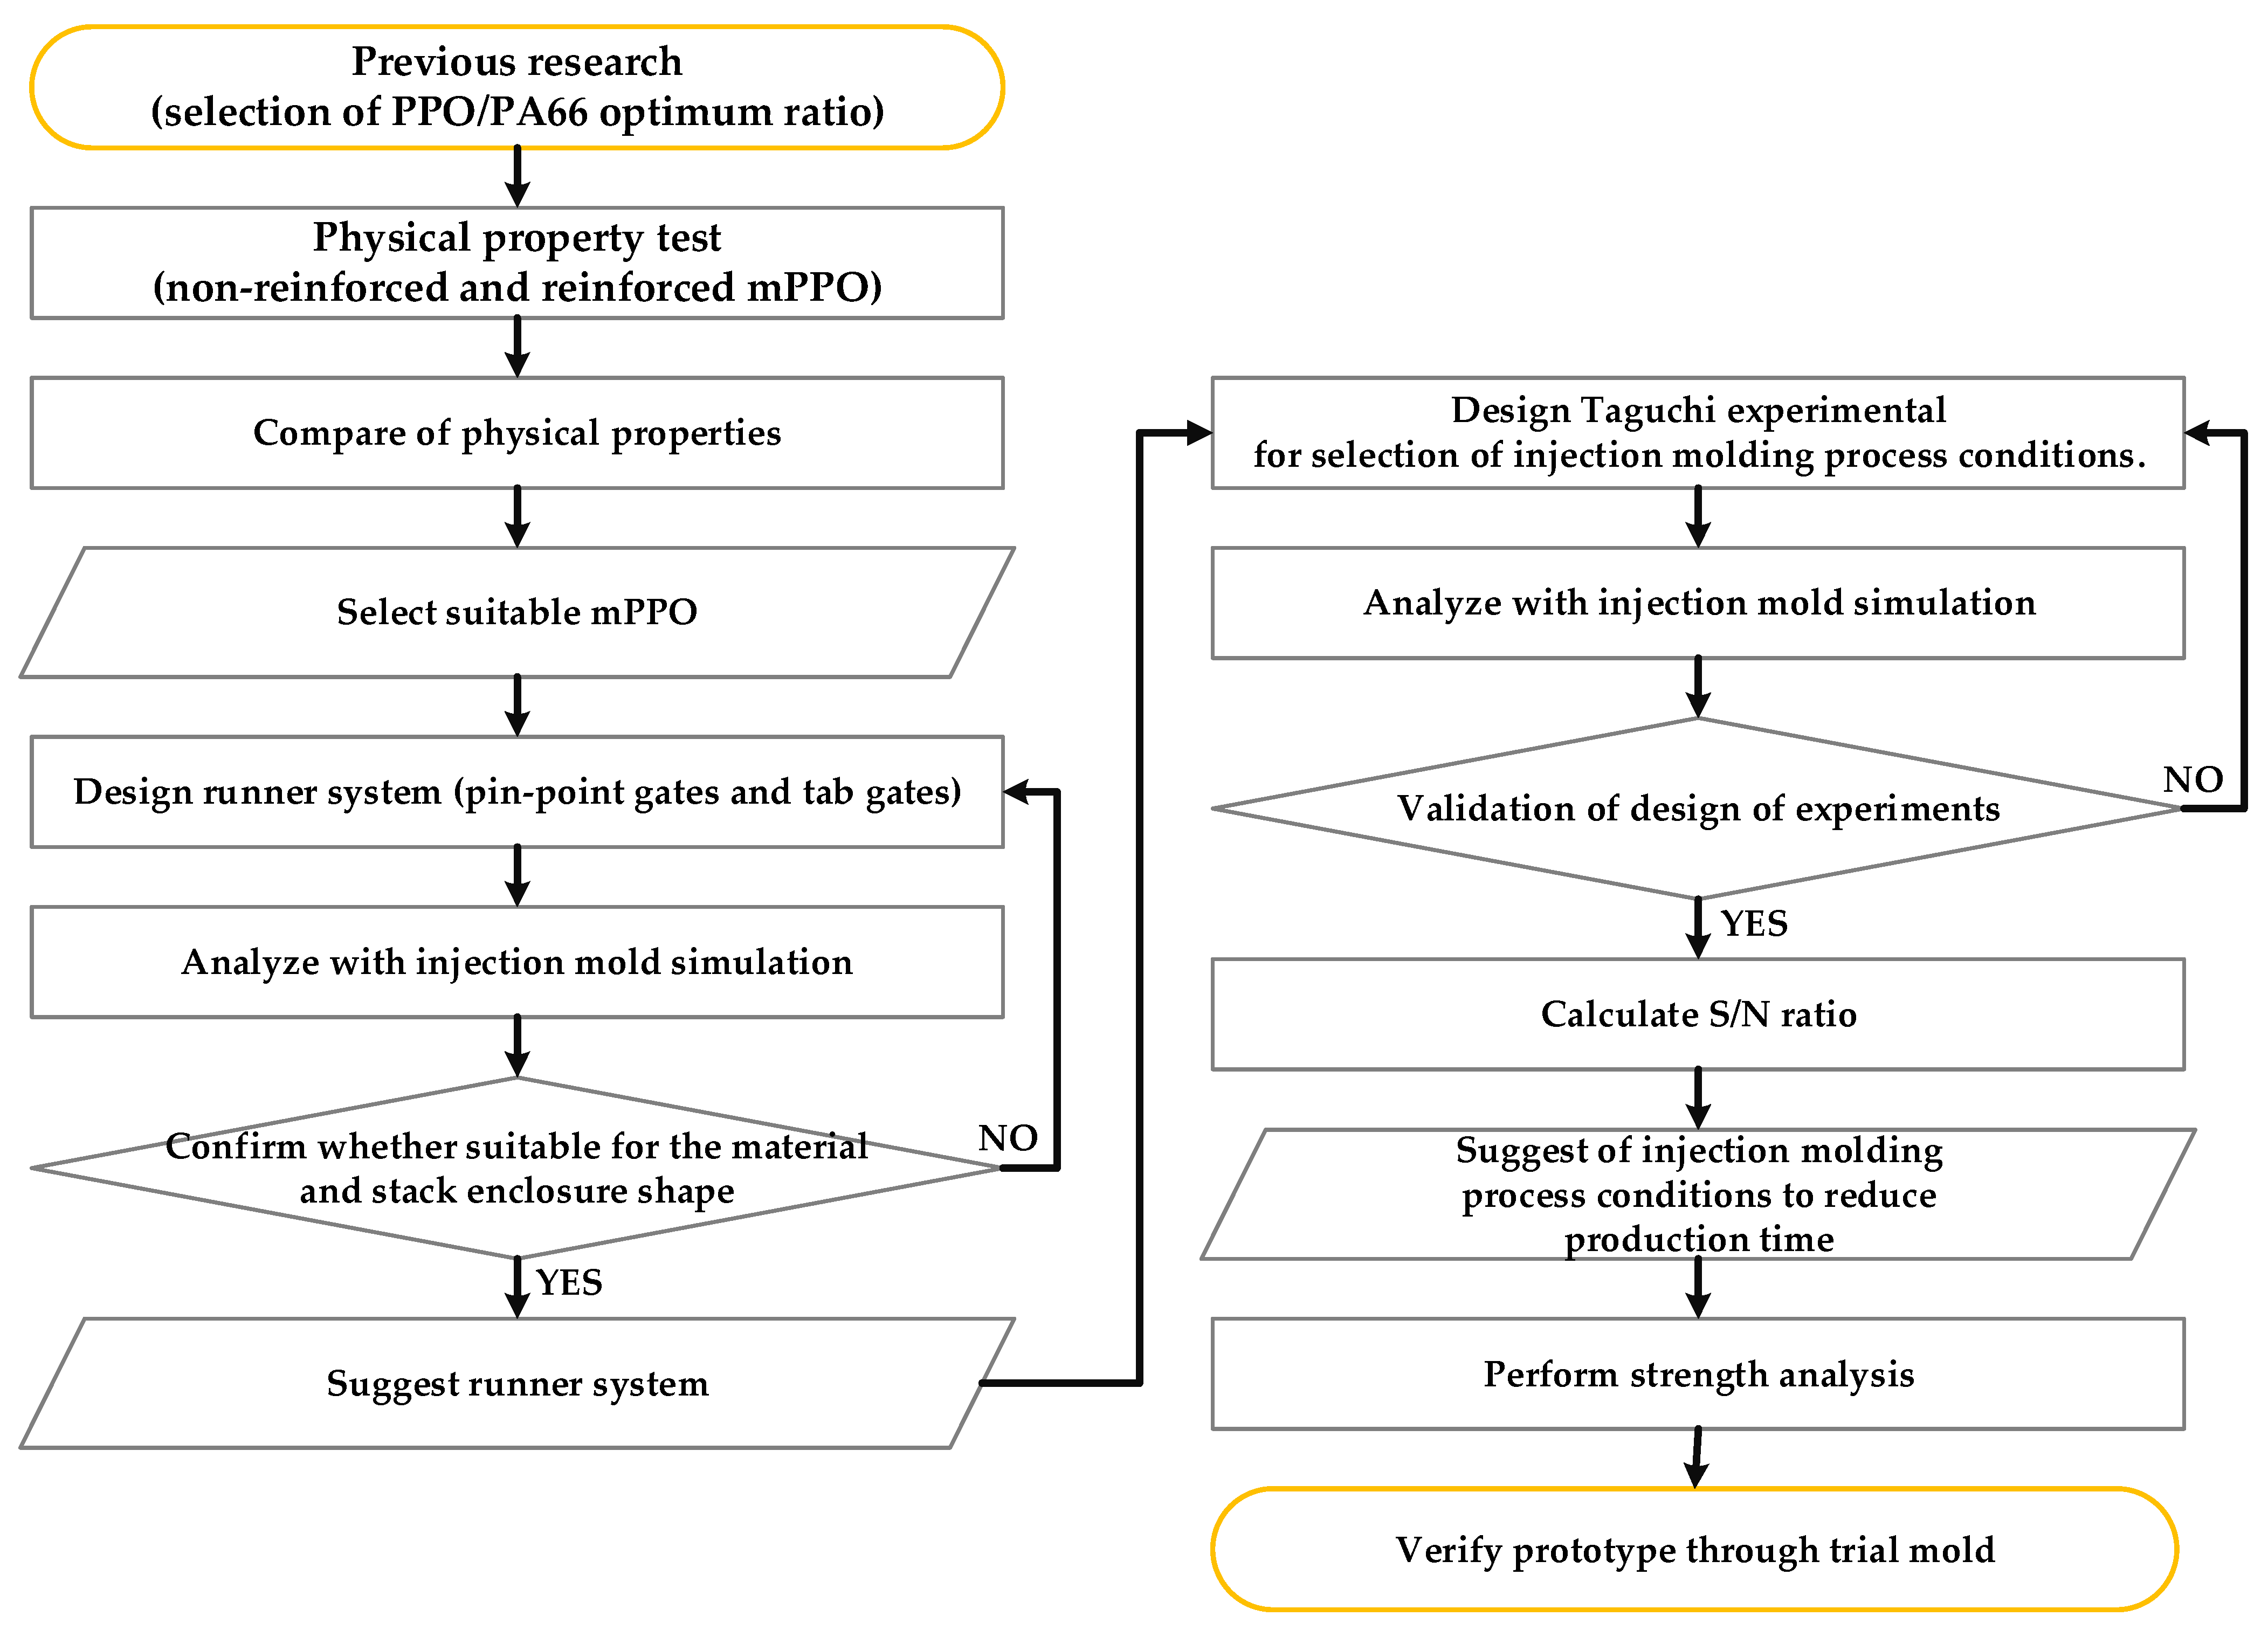
Figure 1.
Flow chart of the study.
Figure 1.
Flow chart of the study.
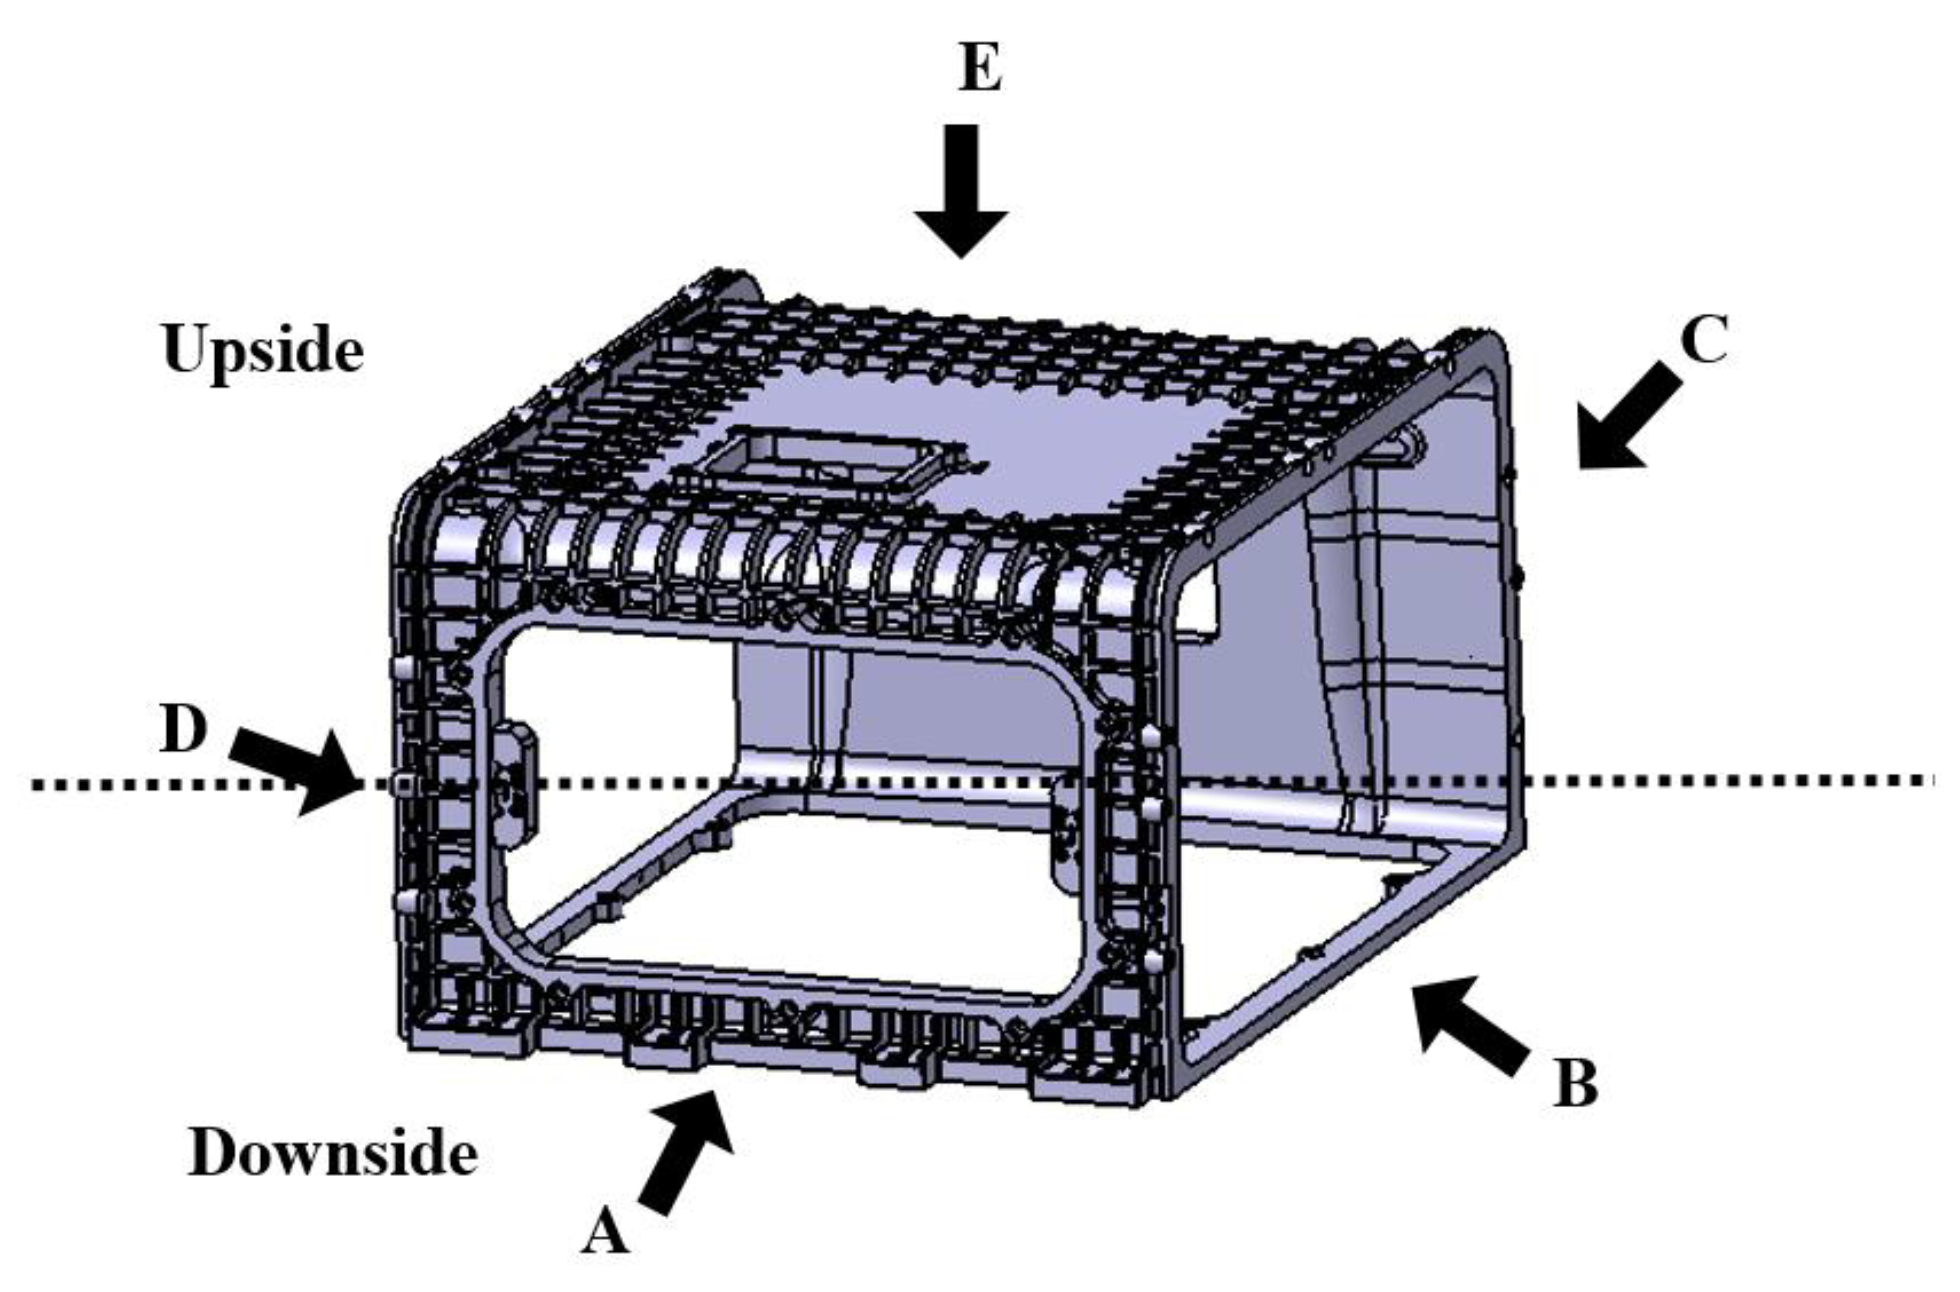
Figure 2.
Overall shape of stack enclosure indicated for each visual point of view with A, B, C, D, E, F, upside and downside.
Figure 2.
Overall shape of stack enclosure indicated for each visual point of view with A, B, C, D, E, F, upside and downside.
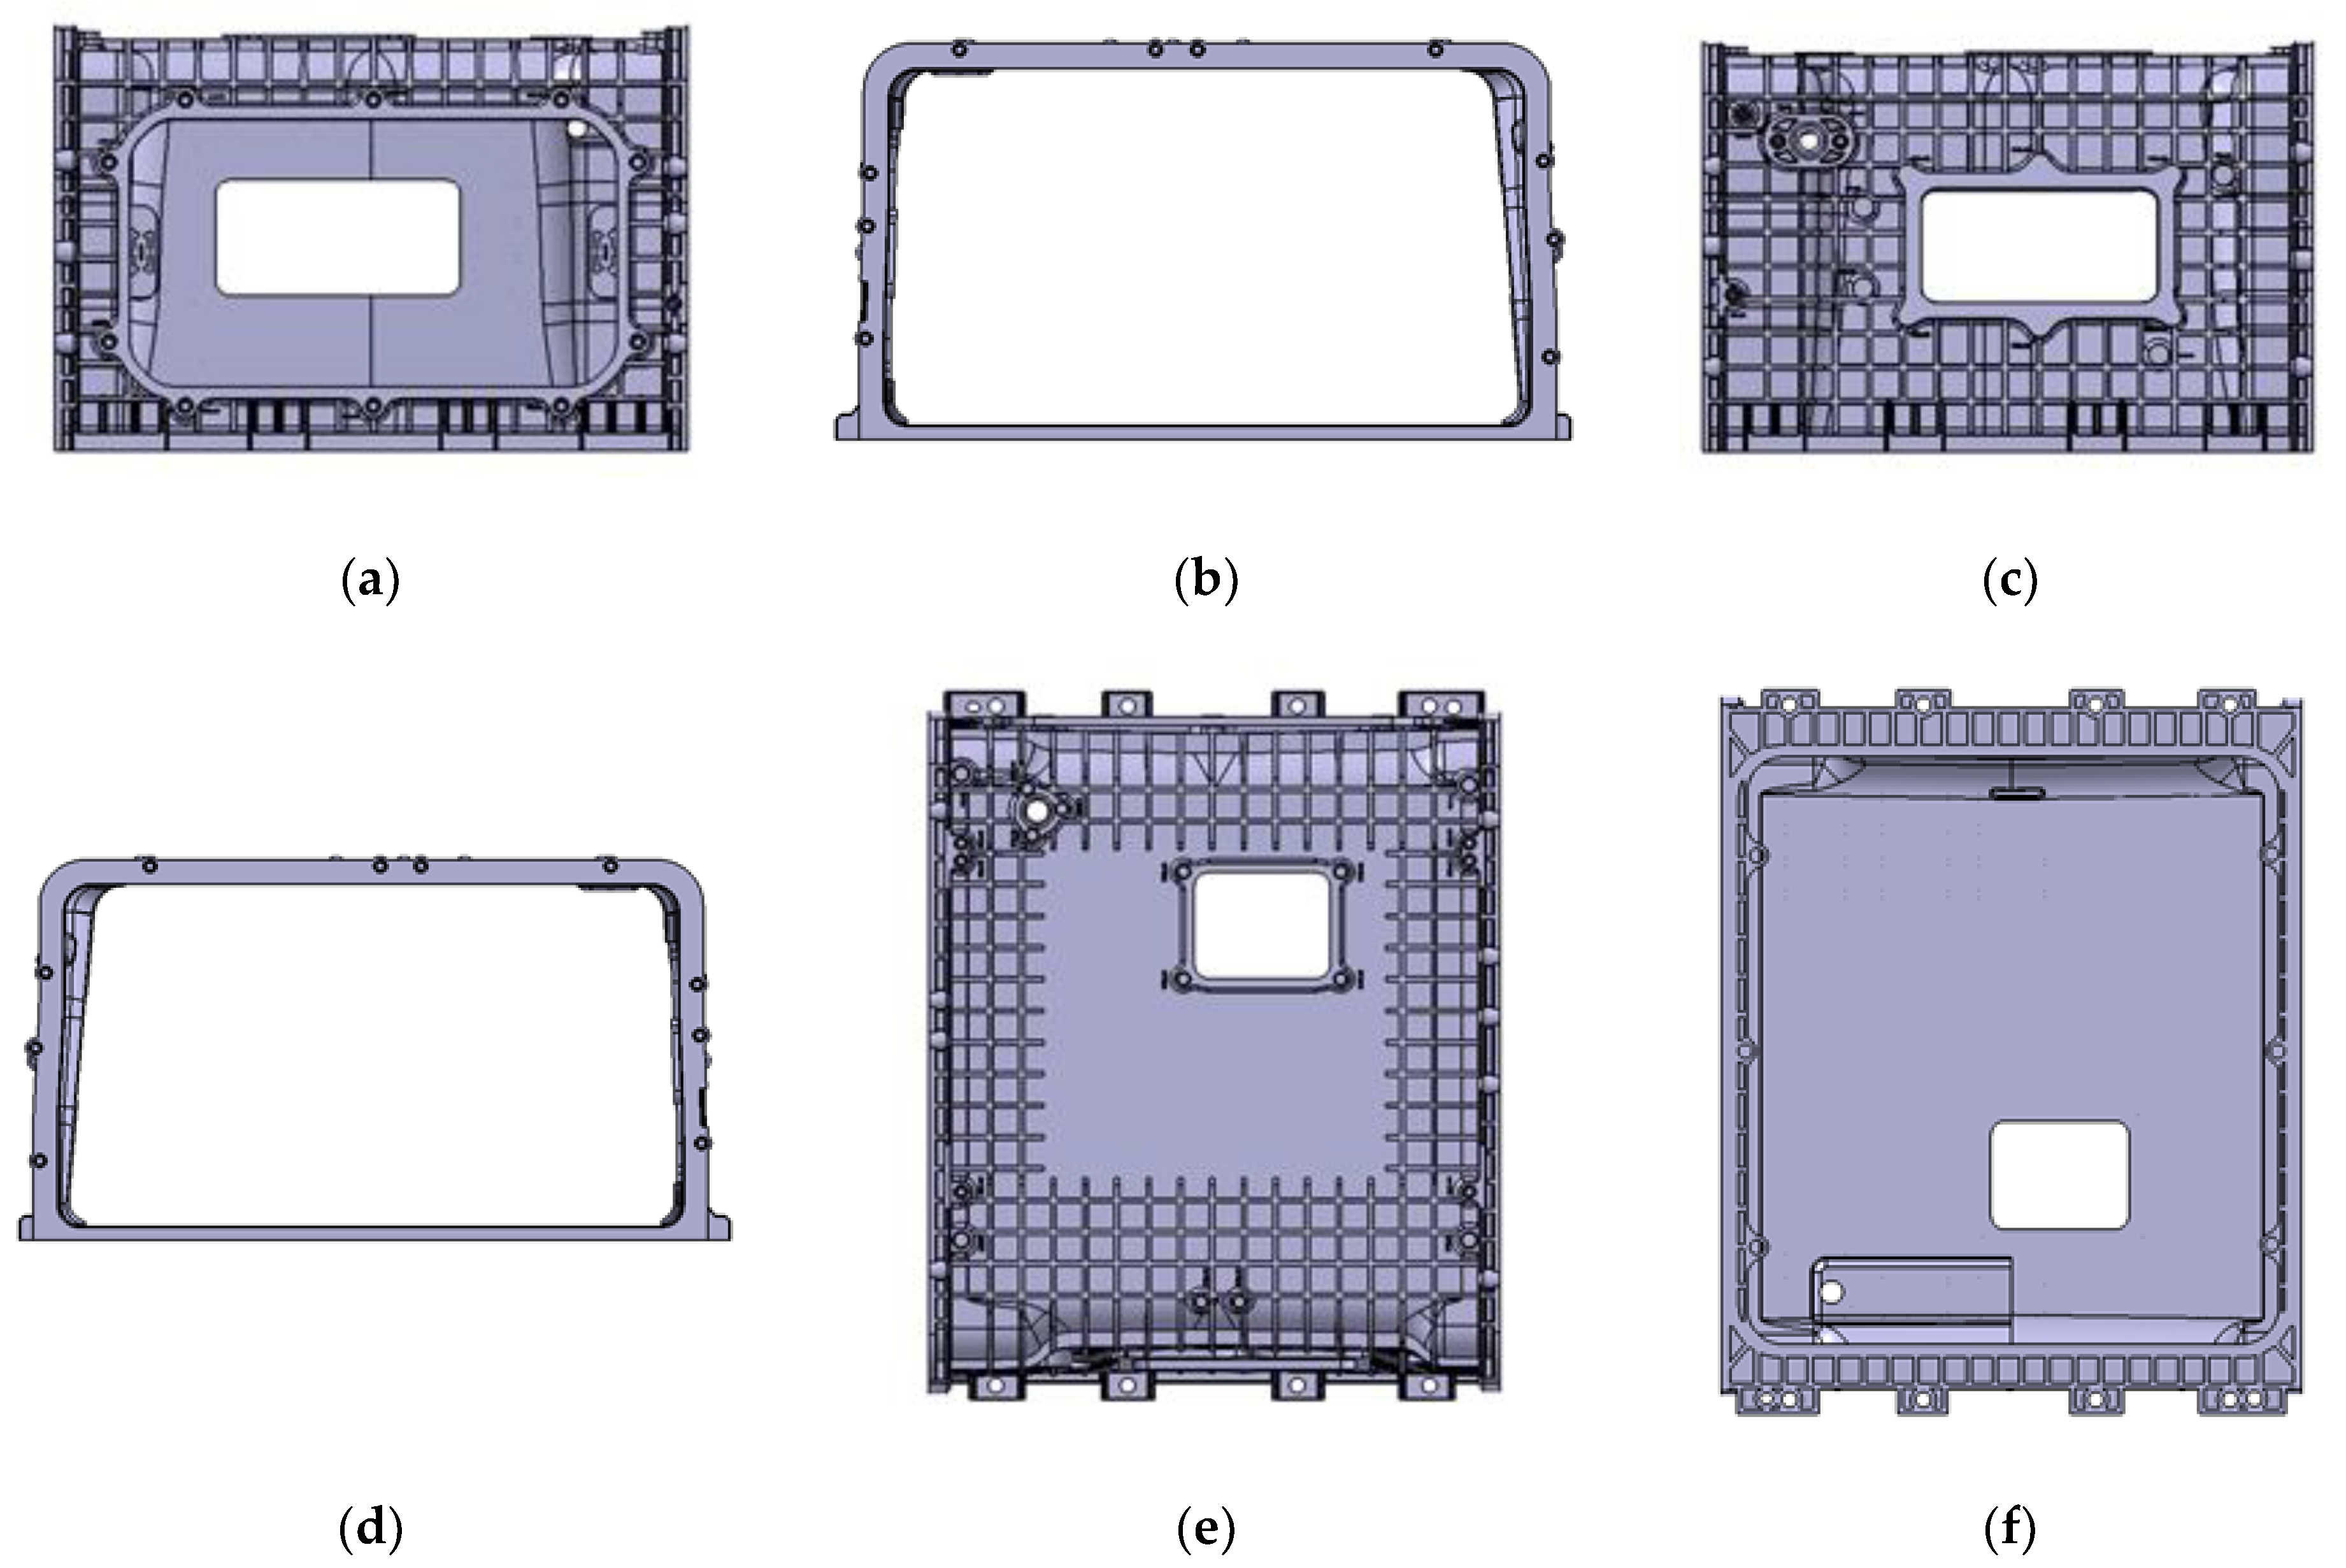
Figure 3.
Title of stack enclosure’s faces. (a) Face A: Front view; (b) Face B: Side view 1; (c) Face C: Back view; (d) Face D: Side view; (e) Face E: Upside view; and (f) Face F: Bottom view.
Figure 3.
Title of stack enclosure’s faces. (a) Face A: Front view; (b) Face B: Side view 1; (c) Face C: Back view; (d) Face D: Side view; (e) Face E: Upside view; and (f) Face F: Bottom view.
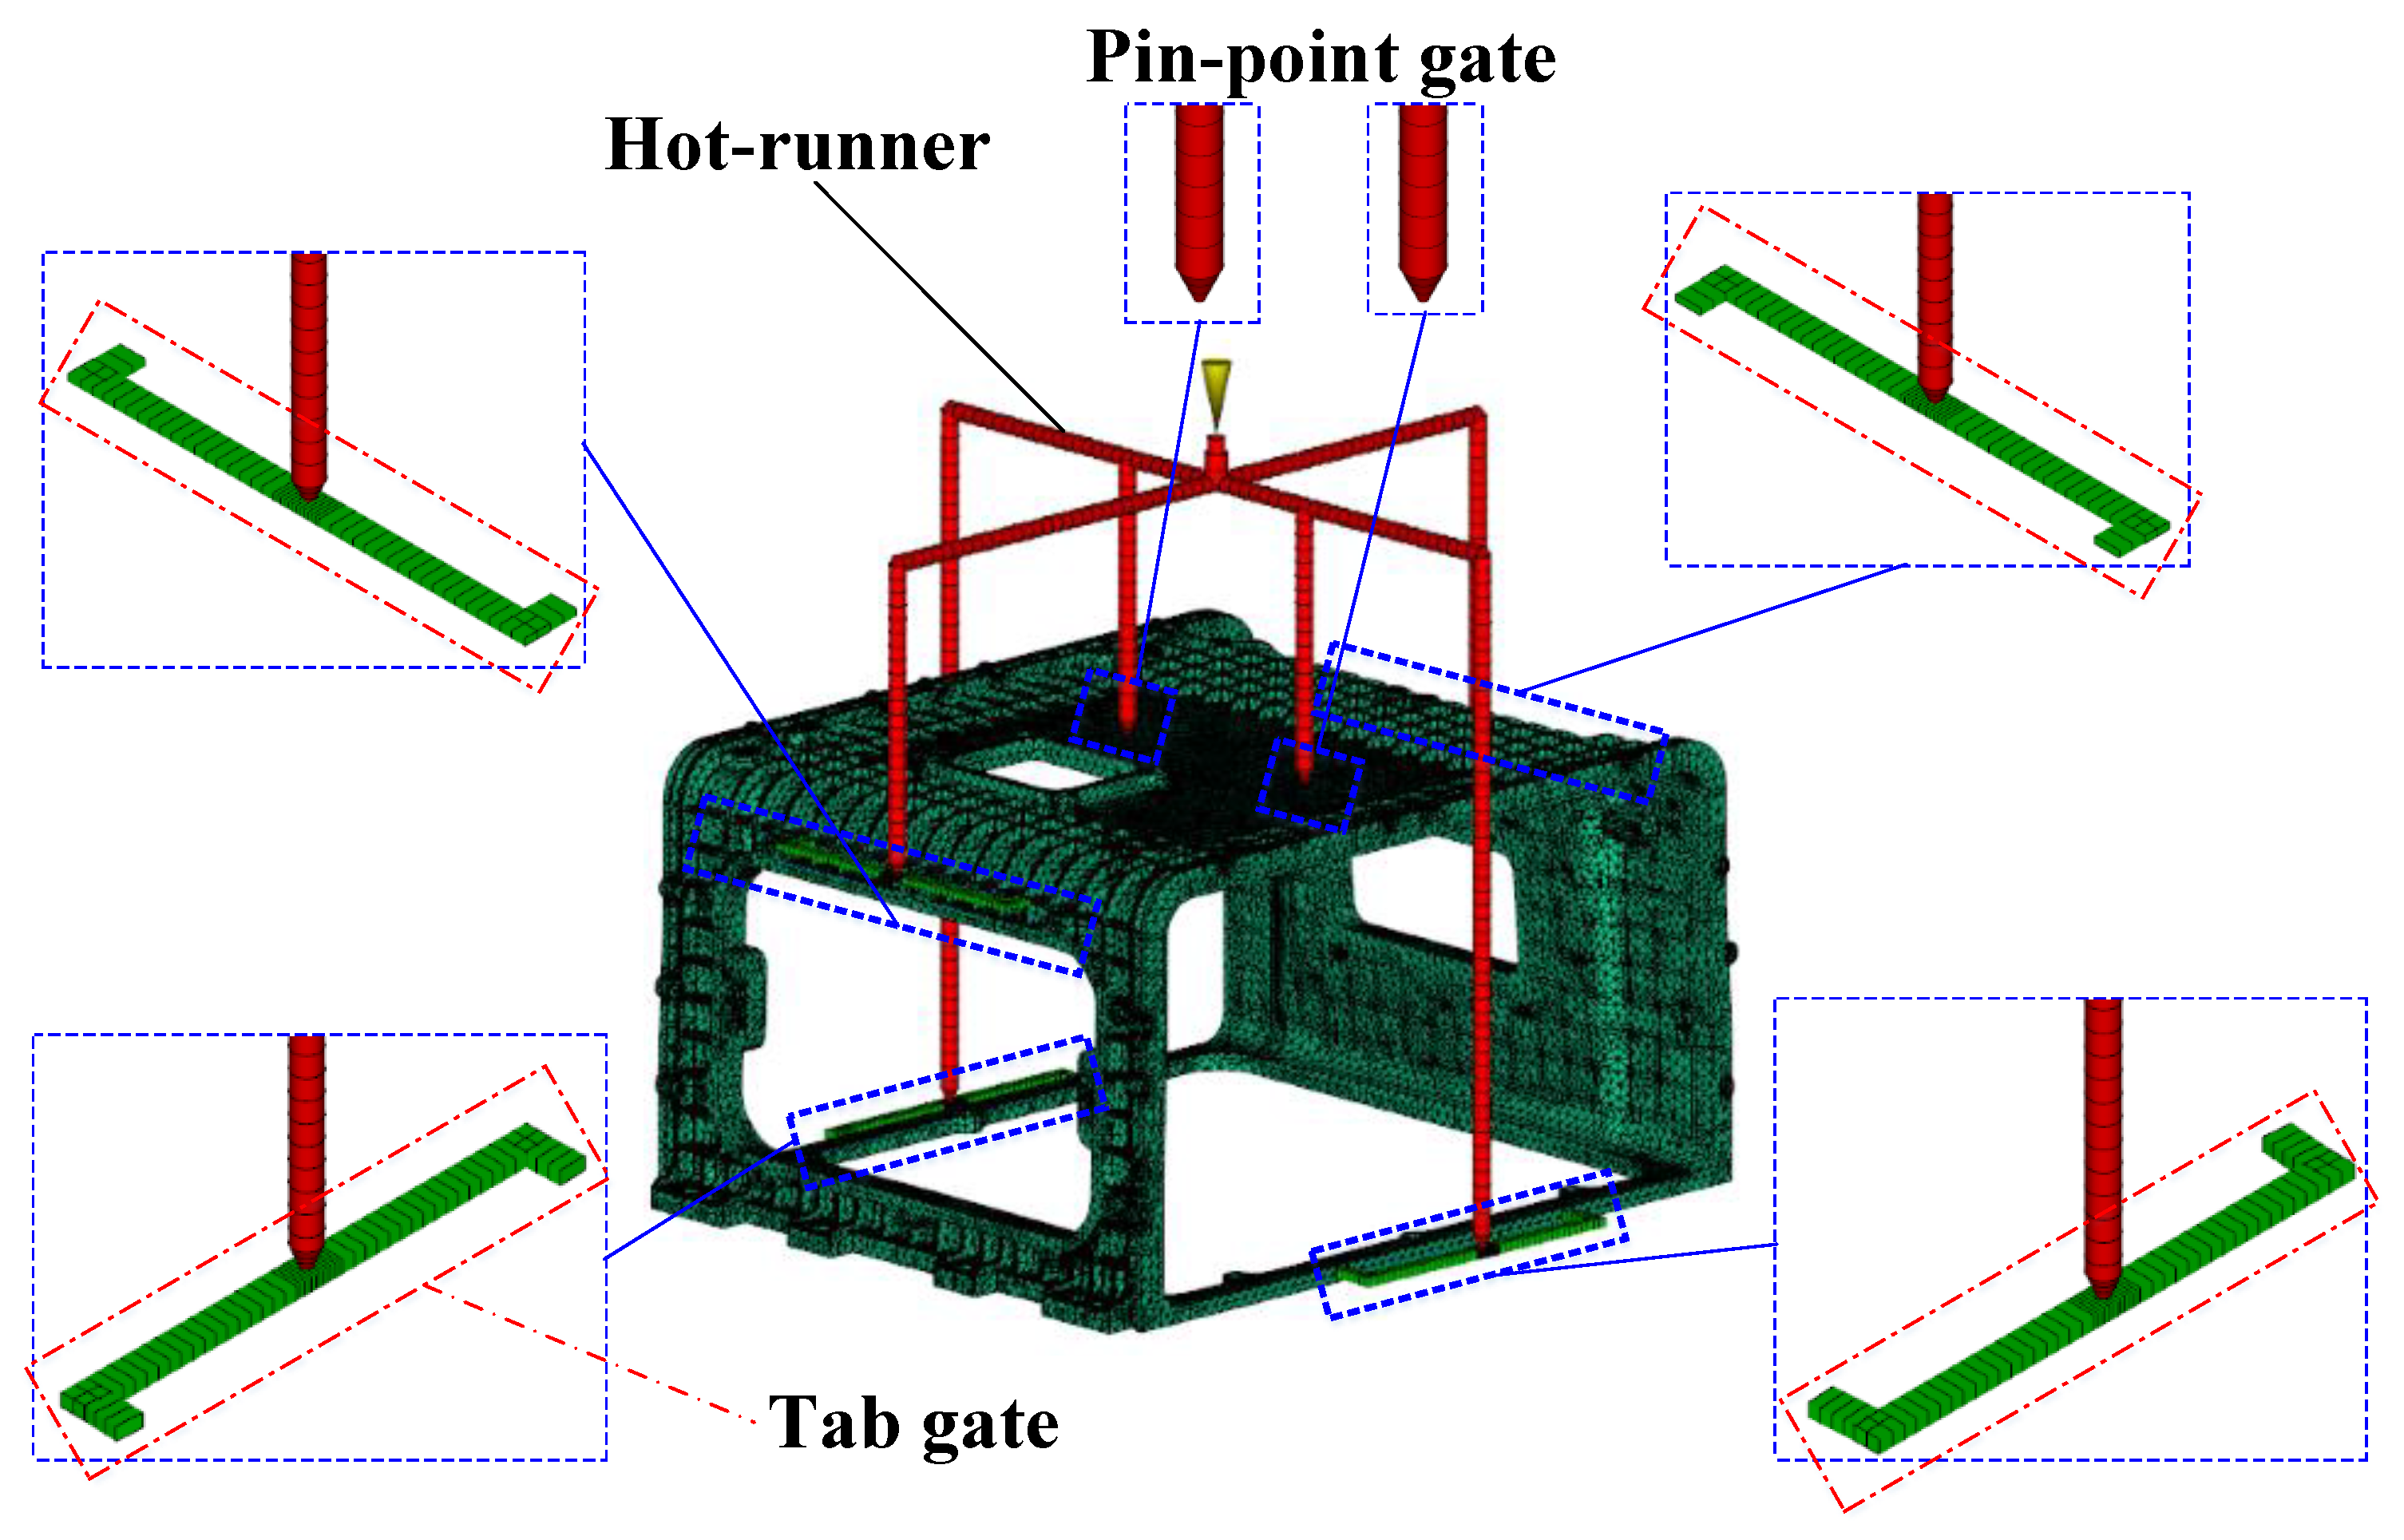
Figure 4.
Stack enclosure runner system design. Hot-runner, pin-point gates, and tab gates.
Figure 4.
Stack enclosure runner system design. Hot-runner, pin-point gates, and tab gates.
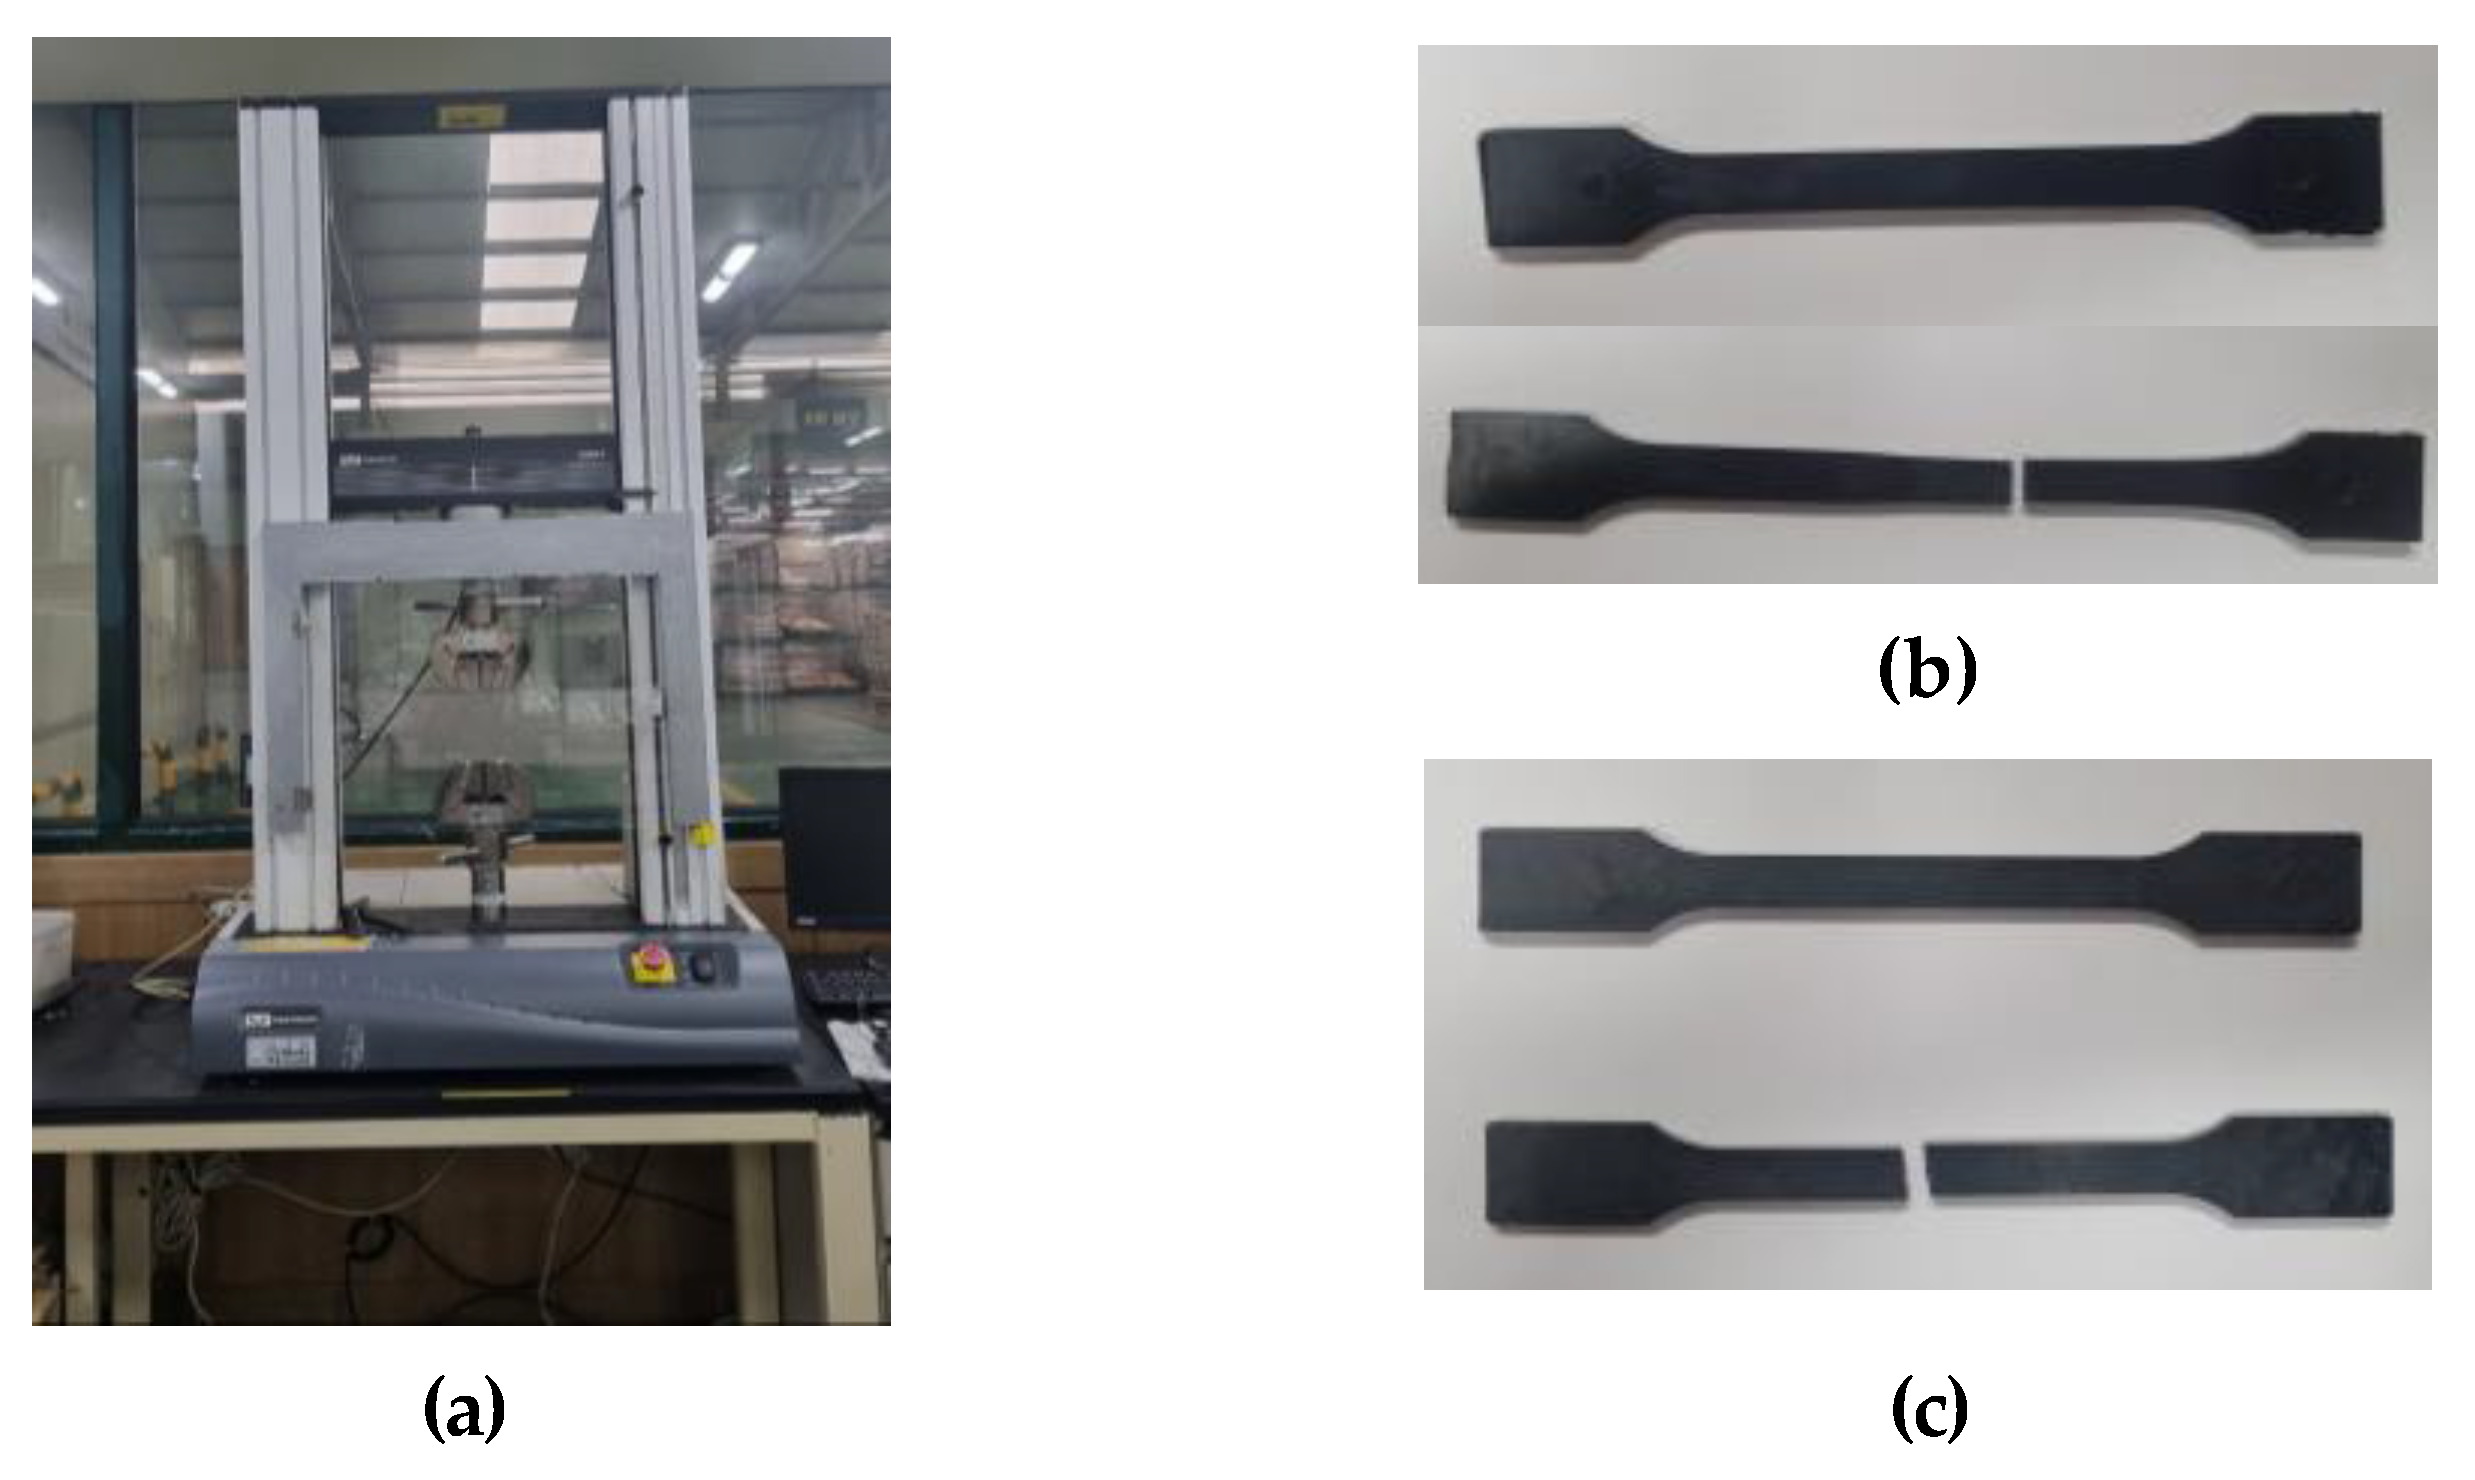
Figure 5.
Tensile test. (a) Universal testing machine, specimen test result of (b) non-reinforced mPPO and (c) reinforced mPPO.
Figure 5.
Tensile test. (a) Universal testing machine, specimen test result of (b) non-reinforced mPPO and (c) reinforced mPPO.
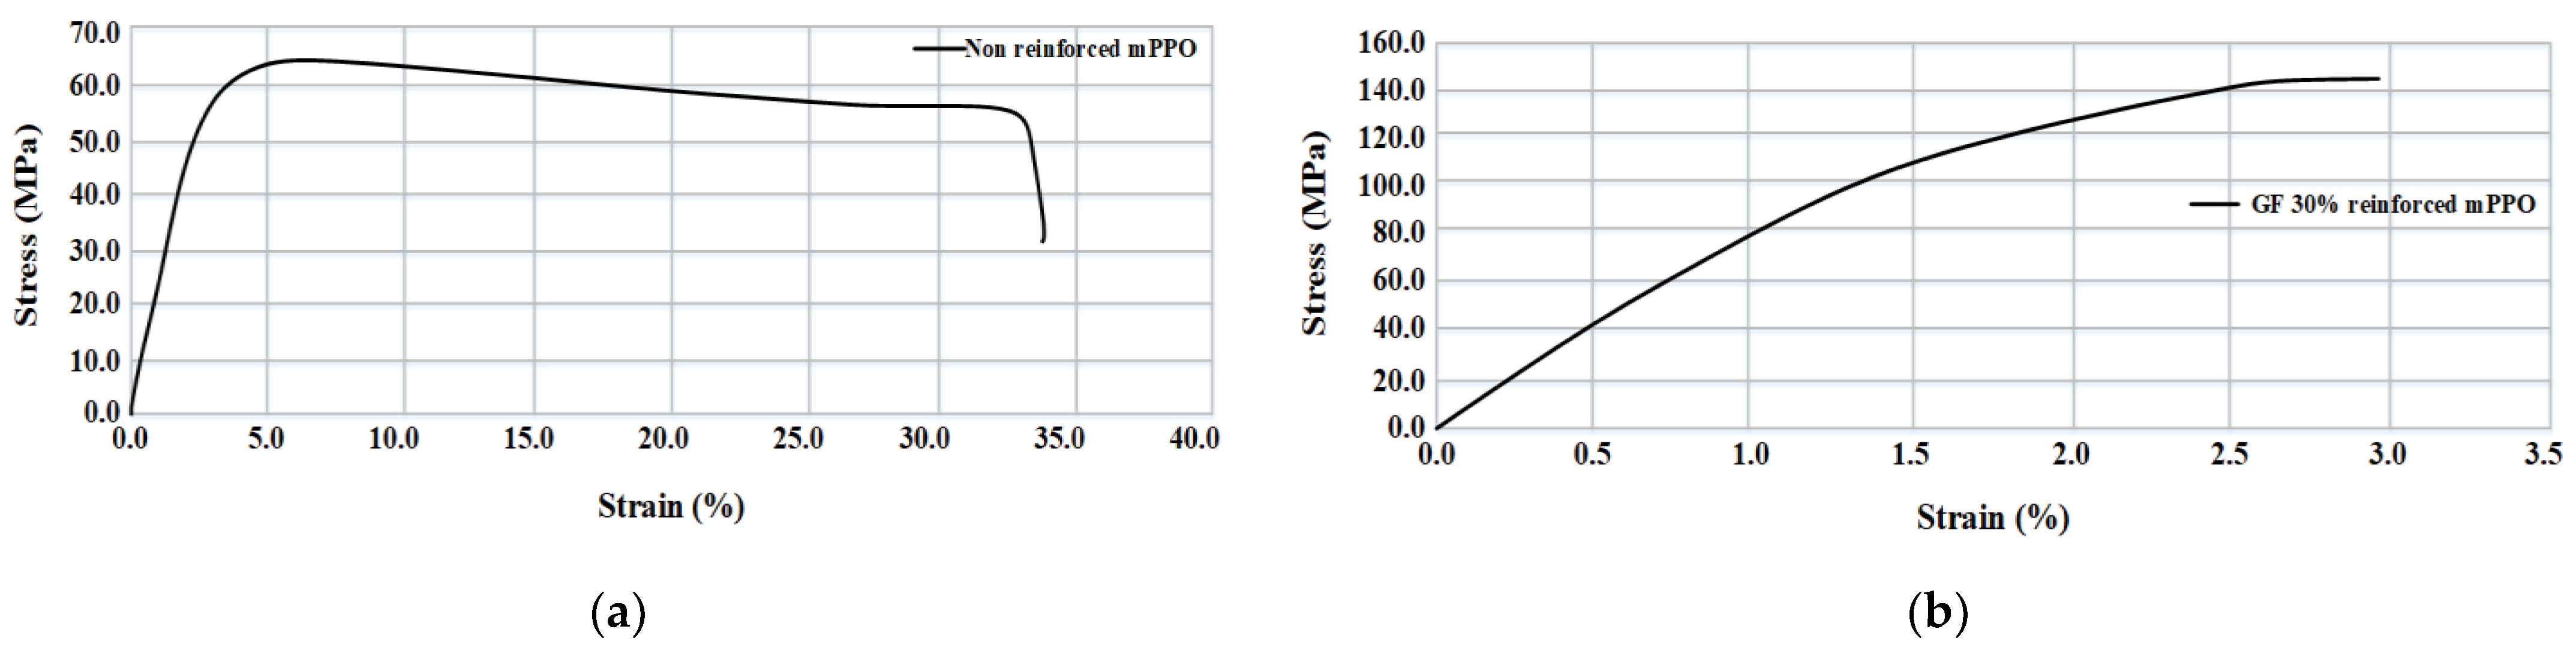
Figure 6.
Strain-stress curve. (a) Non-reinforced mPPO; (b) GF-reinforced mPPO.
Figure 6.
Strain-stress curve. (a) Non-reinforced mPPO; (b) GF-reinforced mPPO.
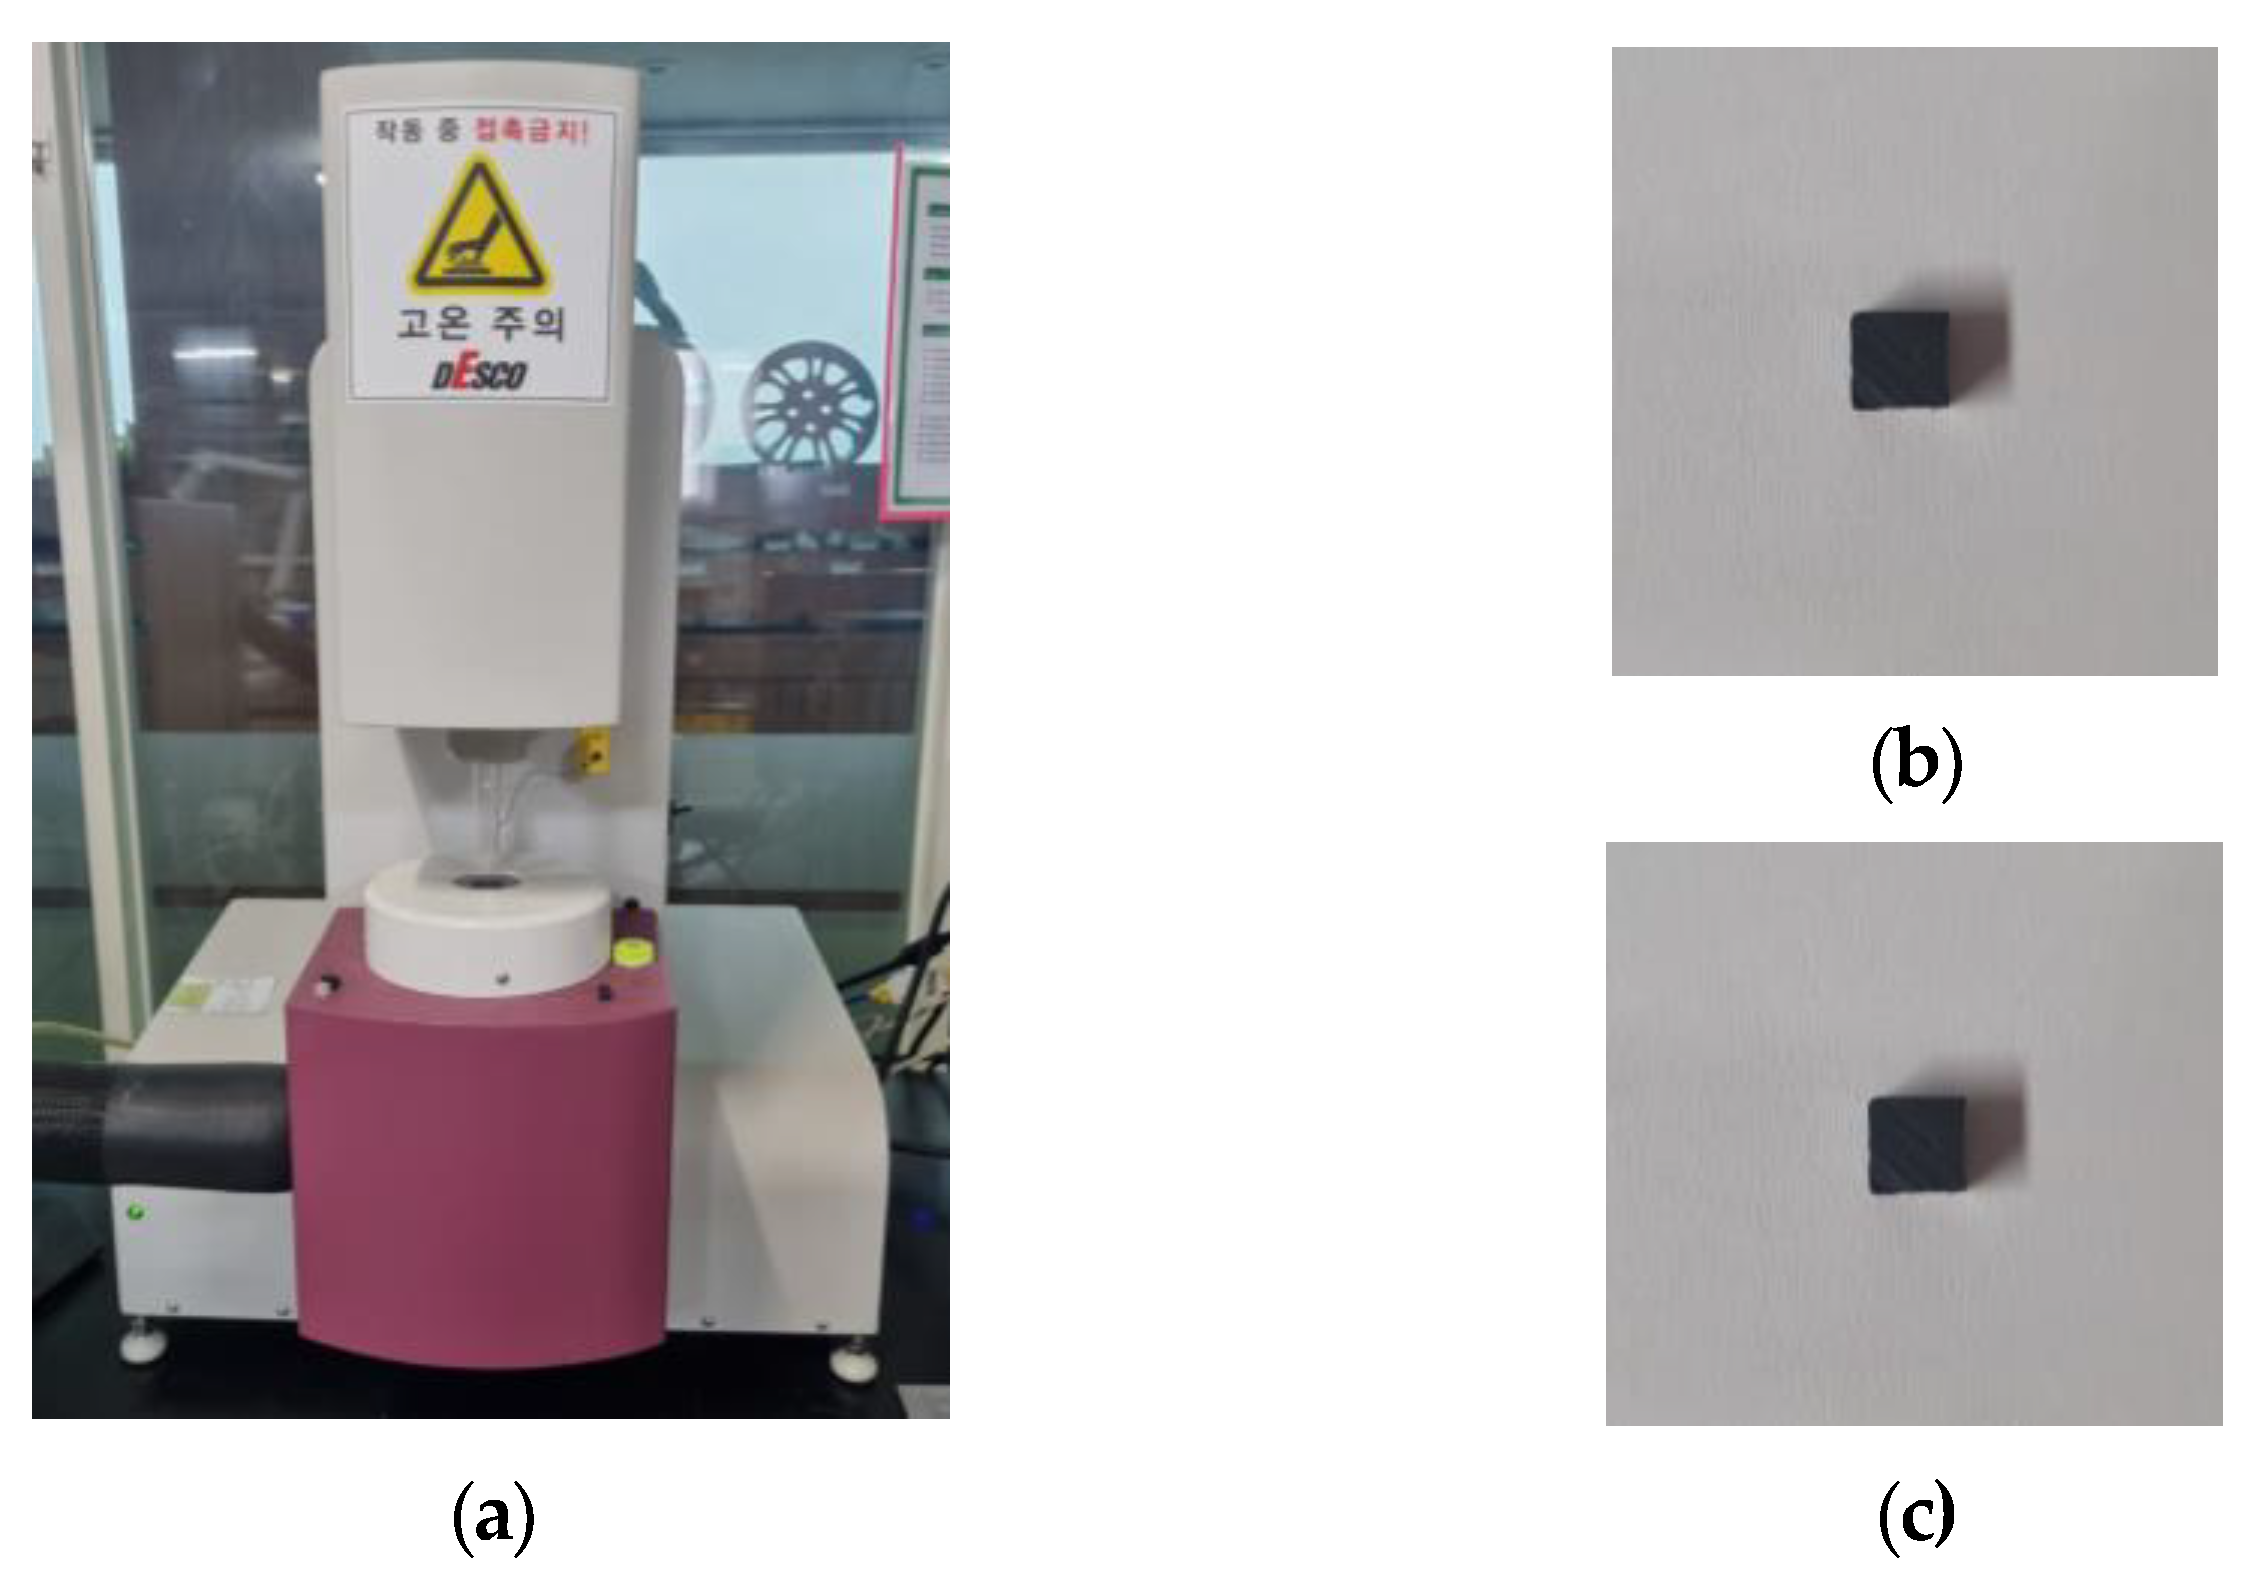
Figure 7.
Thermal expansion test. (a) Thermal melting analyzer, specimen test result of (b) non-reinforced mPPO, and (c) reinforced mPPO.
Figure 7.
Thermal expansion test. (a) Thermal melting analyzer, specimen test result of (b) non-reinforced mPPO, and (c) reinforced mPPO.
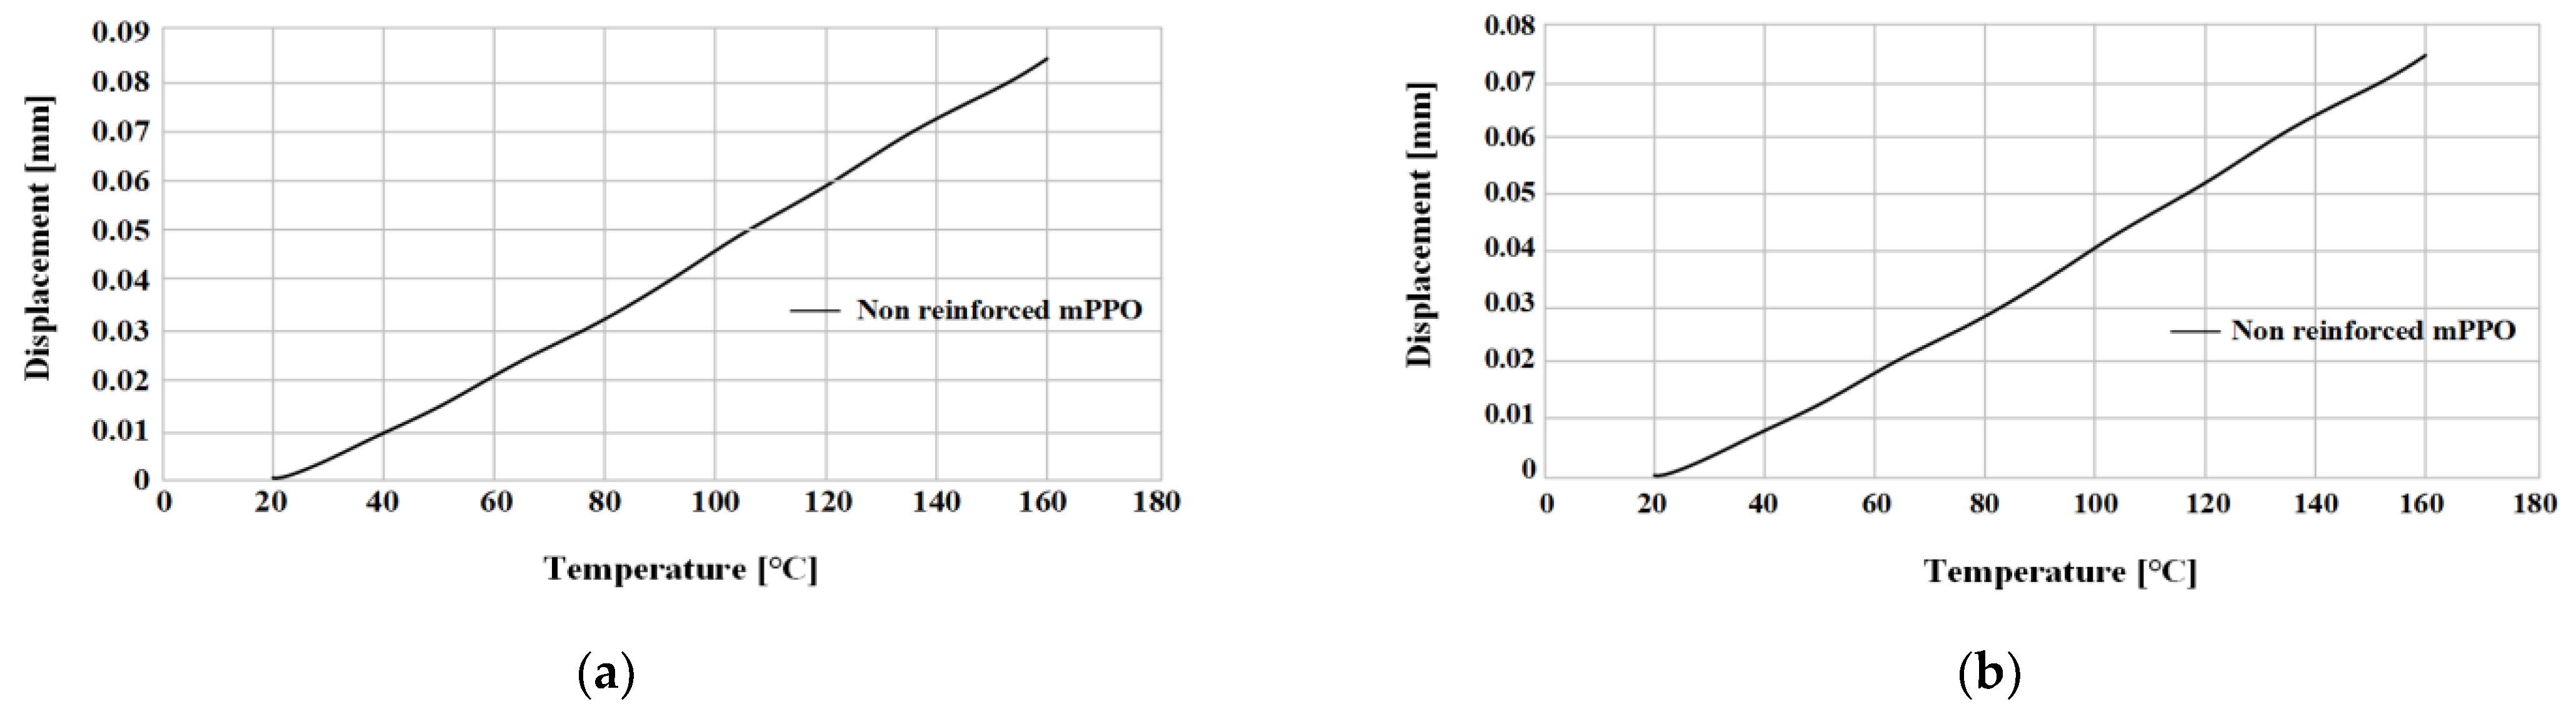
Figure 8.
Displacement by thermal expansion from 20 to 165 °C test. Non-reinforced mPPO: (a) Horizontal; (b) vertical.
Figure 8.
Displacement by thermal expansion from 20 to 165 °C test. Non-reinforced mPPO: (a) Horizontal; (b) vertical.
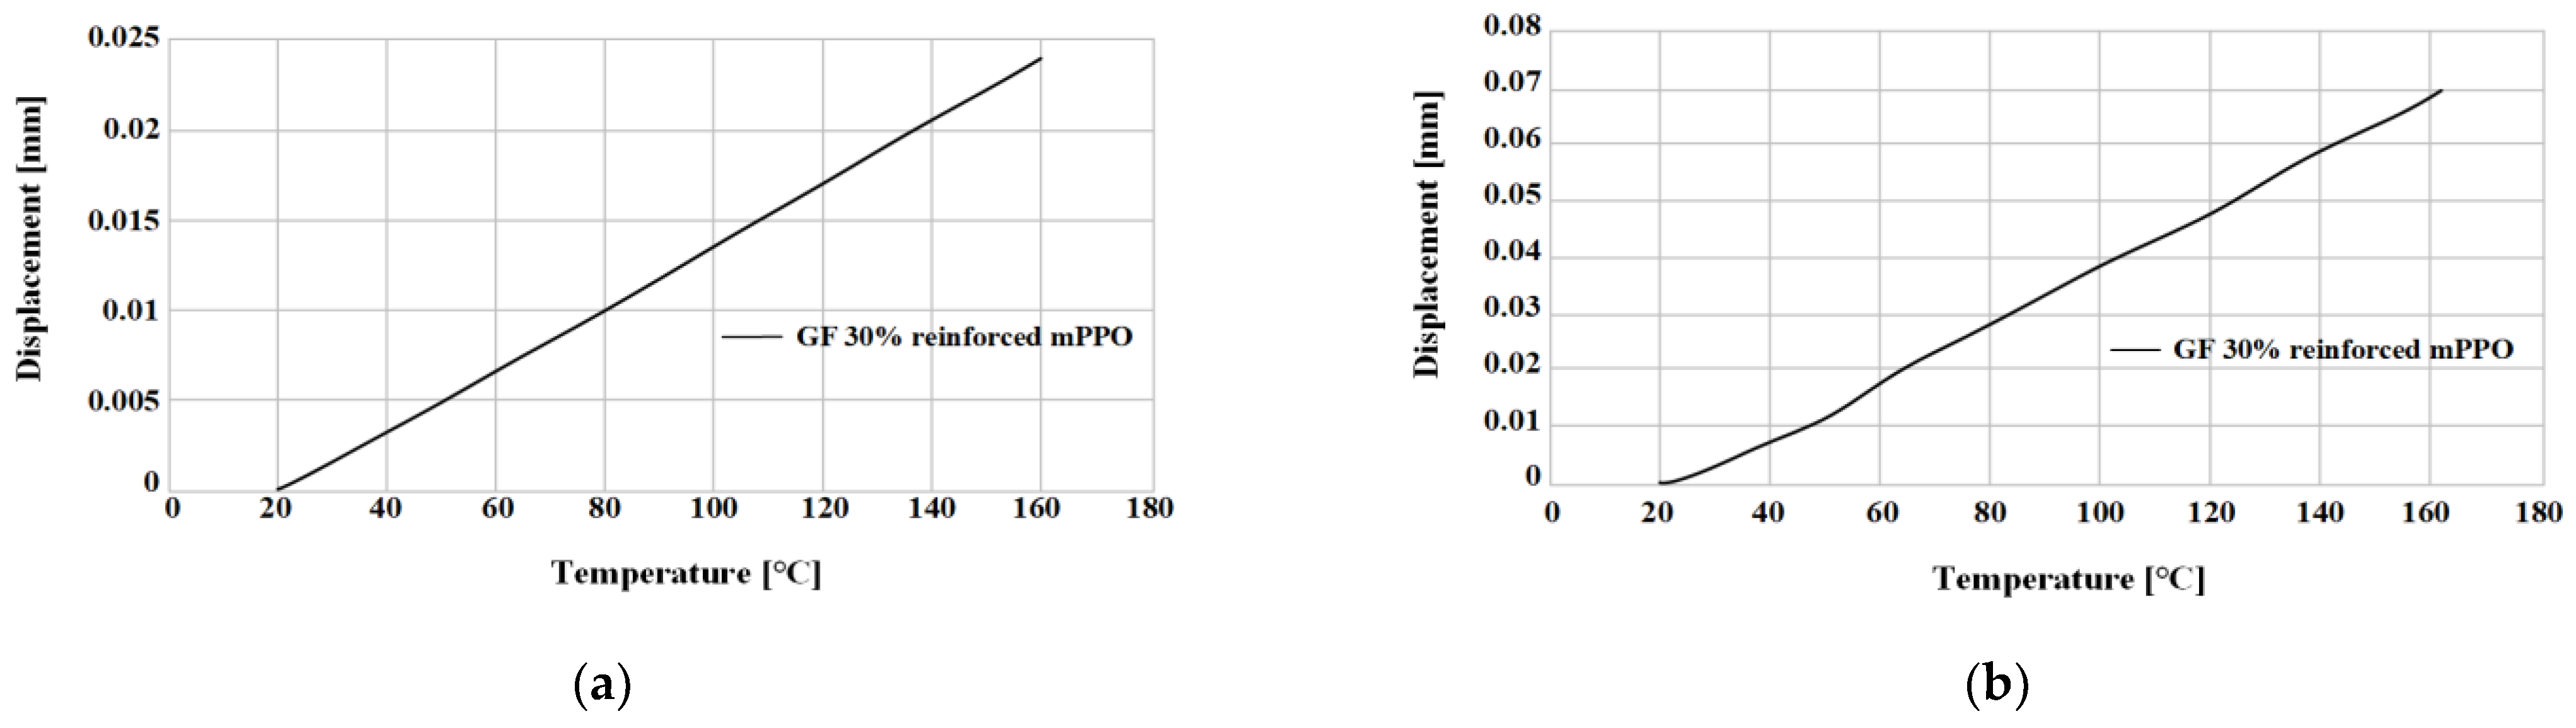
Figure 9.
Displacement by thermal expansion from 20 to 165 °C test. GF-reinforced mPPO: (a) Horizontal; (b) vertical.
Figure 9.
Displacement by thermal expansion from 20 to 165 °C test. GF-reinforced mPPO: (a) Horizontal; (b) vertical.
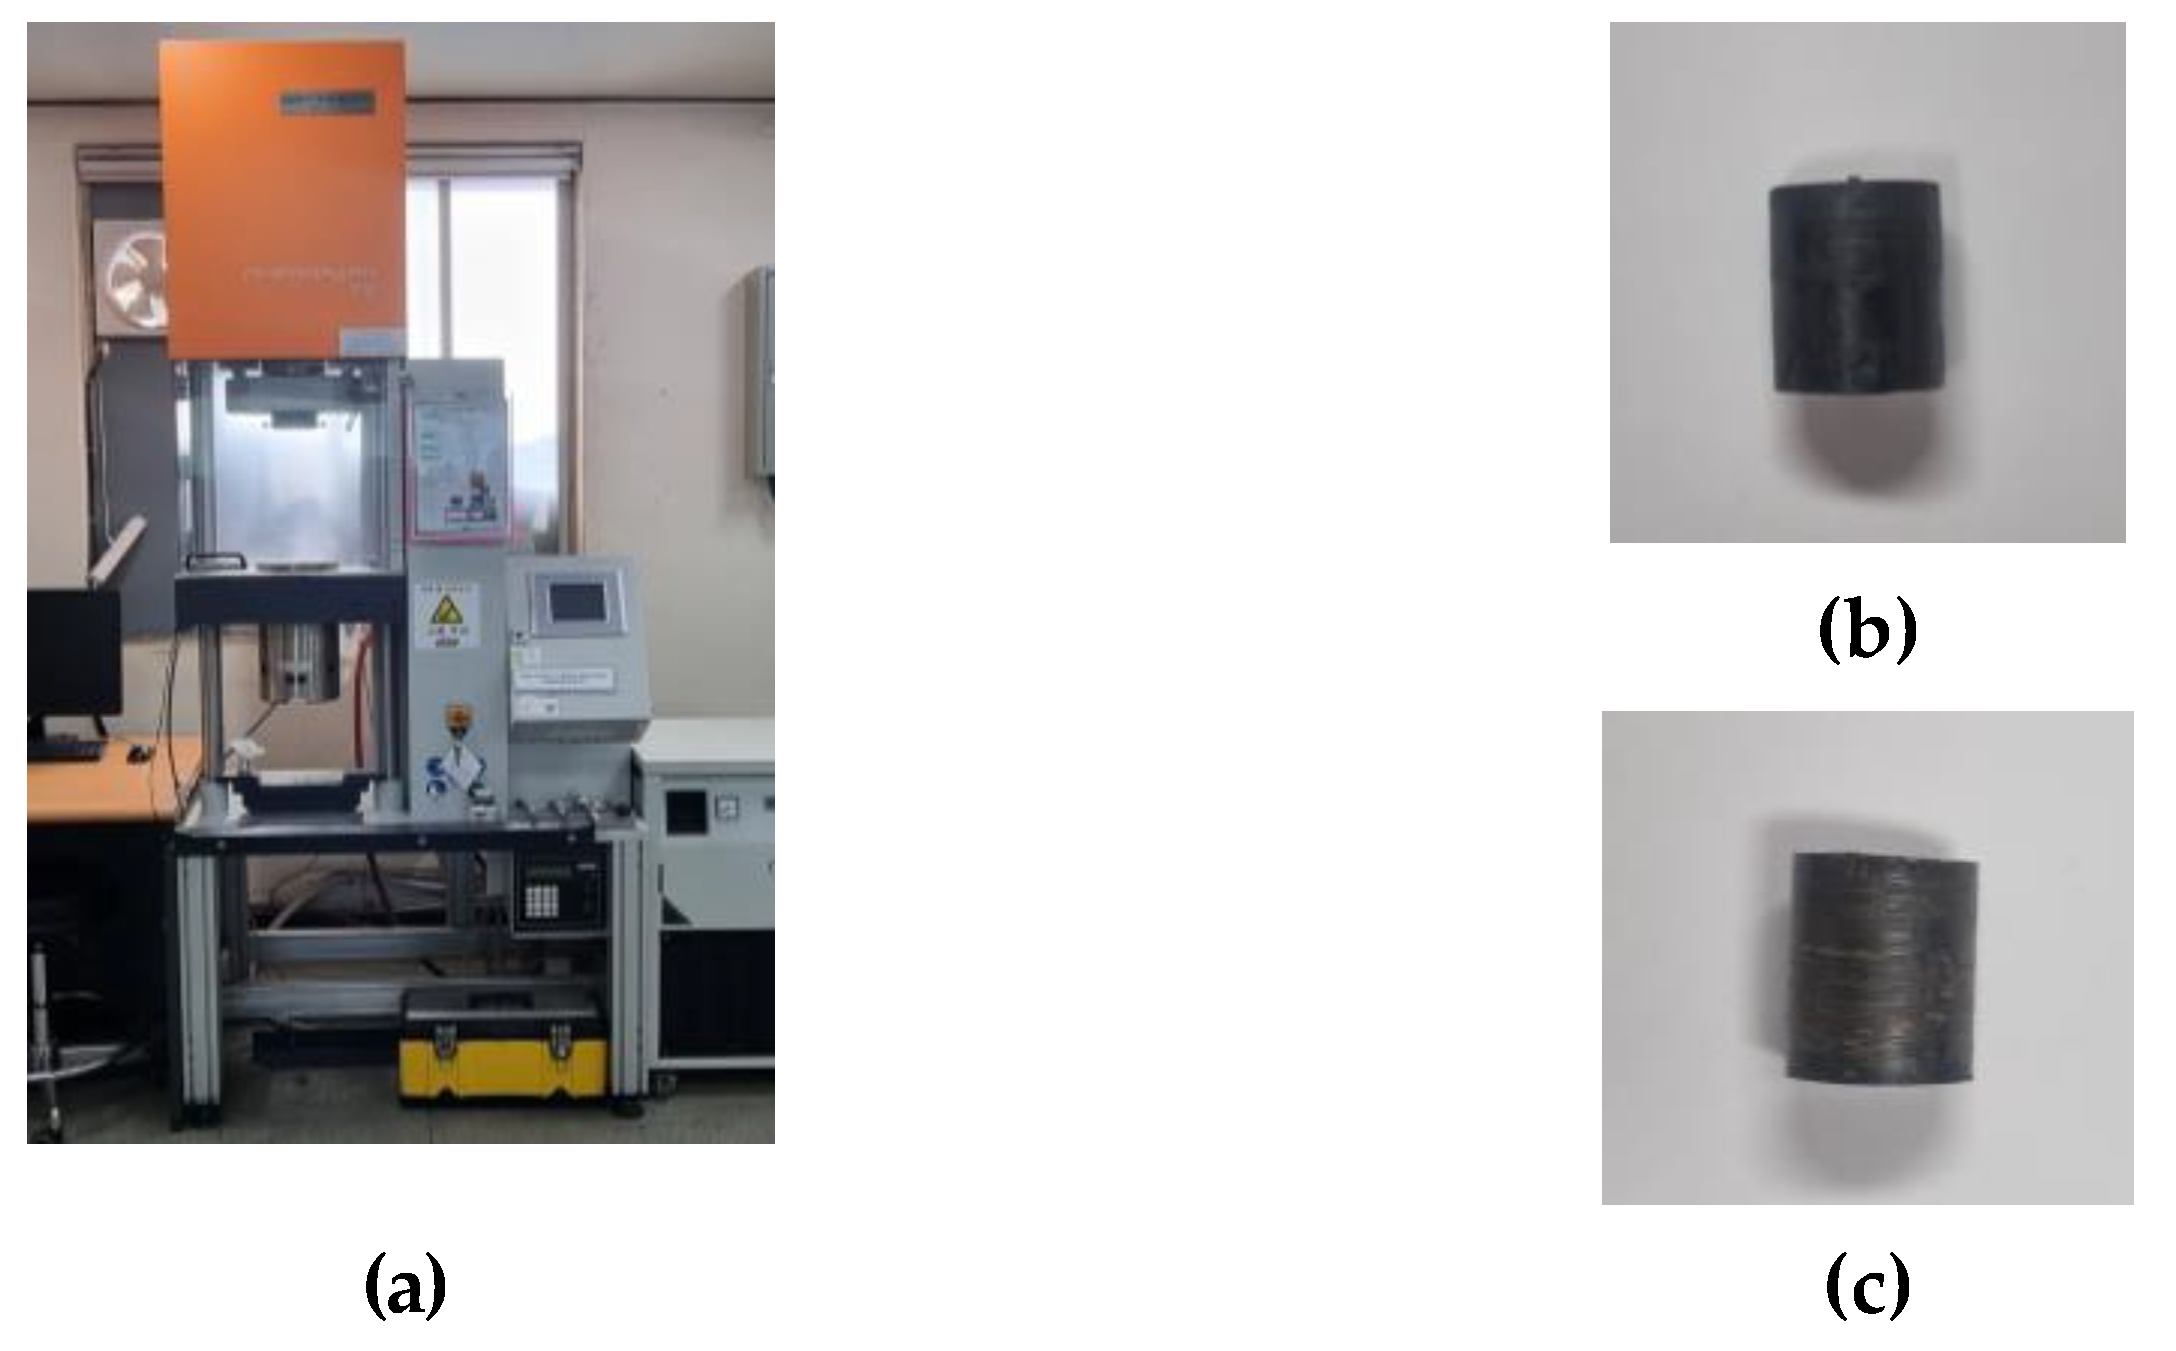
Figure 10.
The pvT test. (a) Rheograph for pvT and viscosity test, specimen test result of (b) non-reinforced mPPO and (c) reinforced mPPO.
Figure 10.
The pvT test. (a) Rheograph for pvT and viscosity test, specimen test result of (b) non-reinforced mPPO and (c) reinforced mPPO.
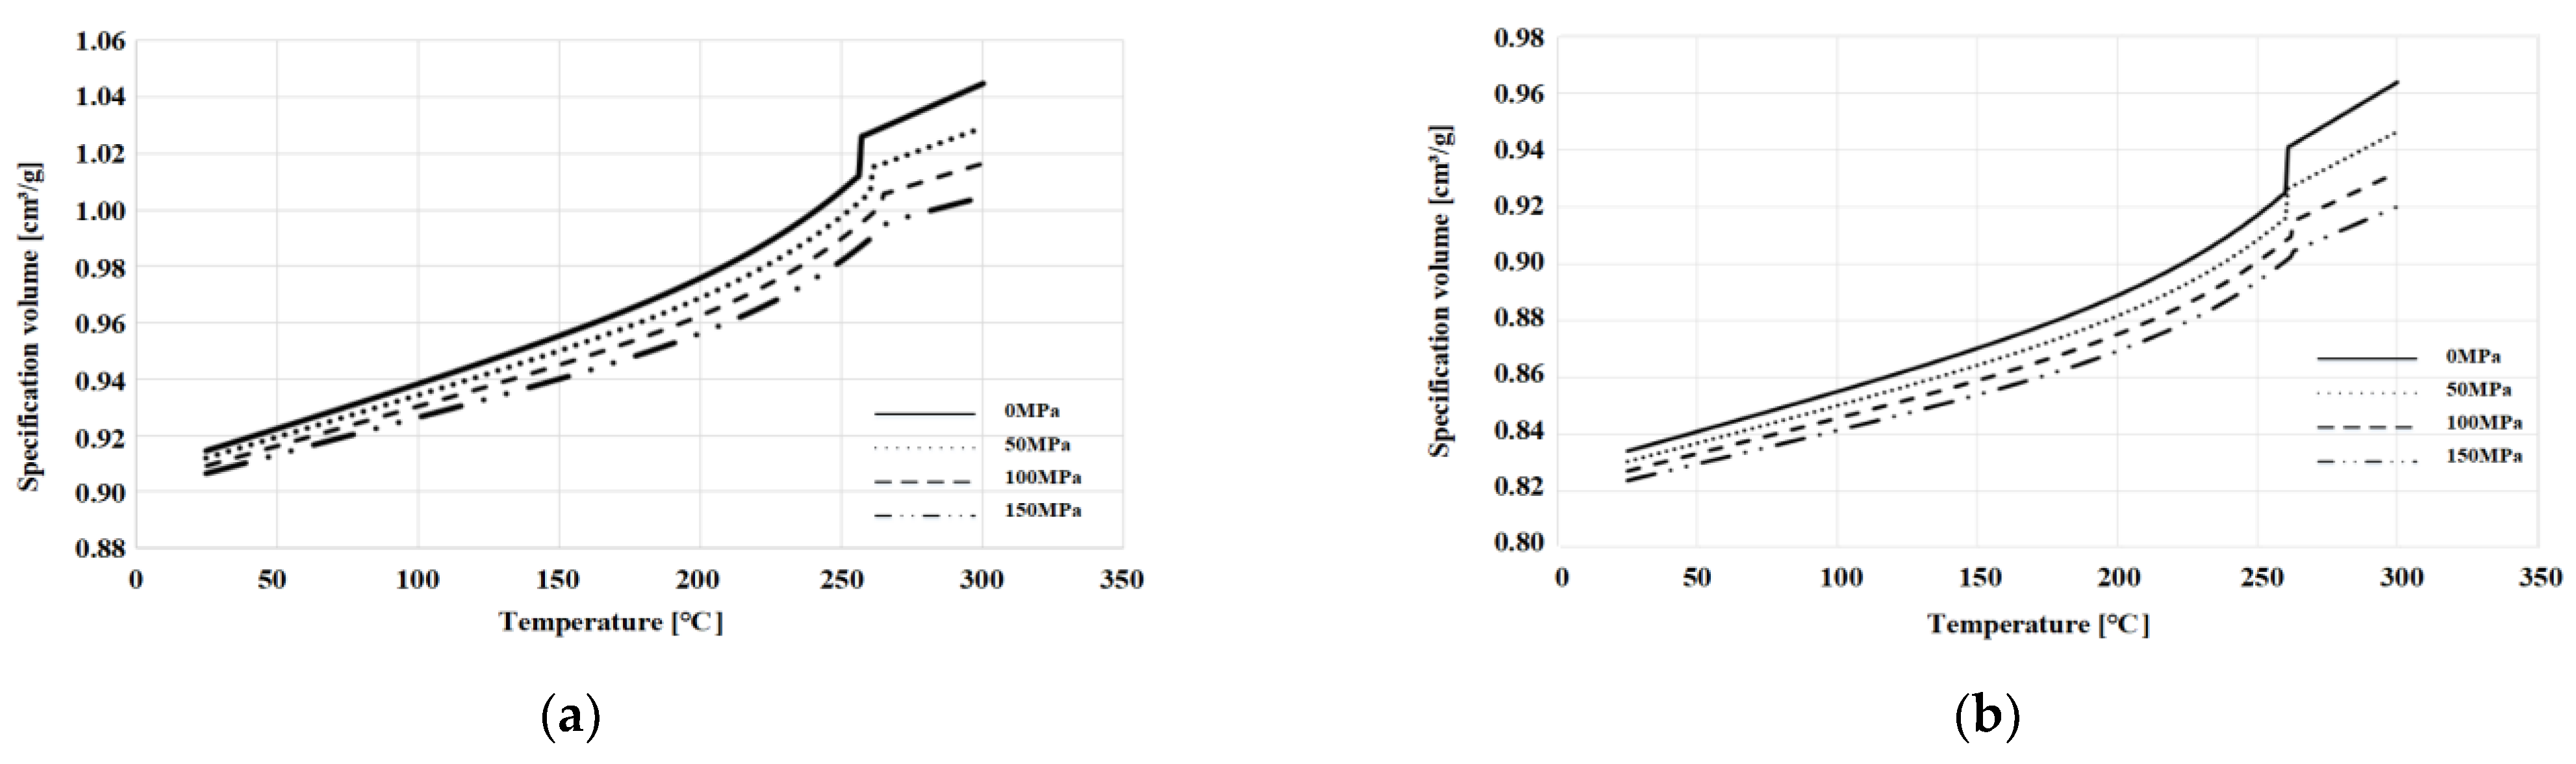
Figure 11.
The 2-domain modified Tait pvT model: 0, 50, 100, and 150 MPa for (a) non-reinforced mPPO; (b) GF-reinforced mPPO.
Figure 11.
The 2-domain modified Tait pvT model: 0, 50, 100, and 150 MPa for (a) non-reinforced mPPO; (b) GF-reinforced mPPO.
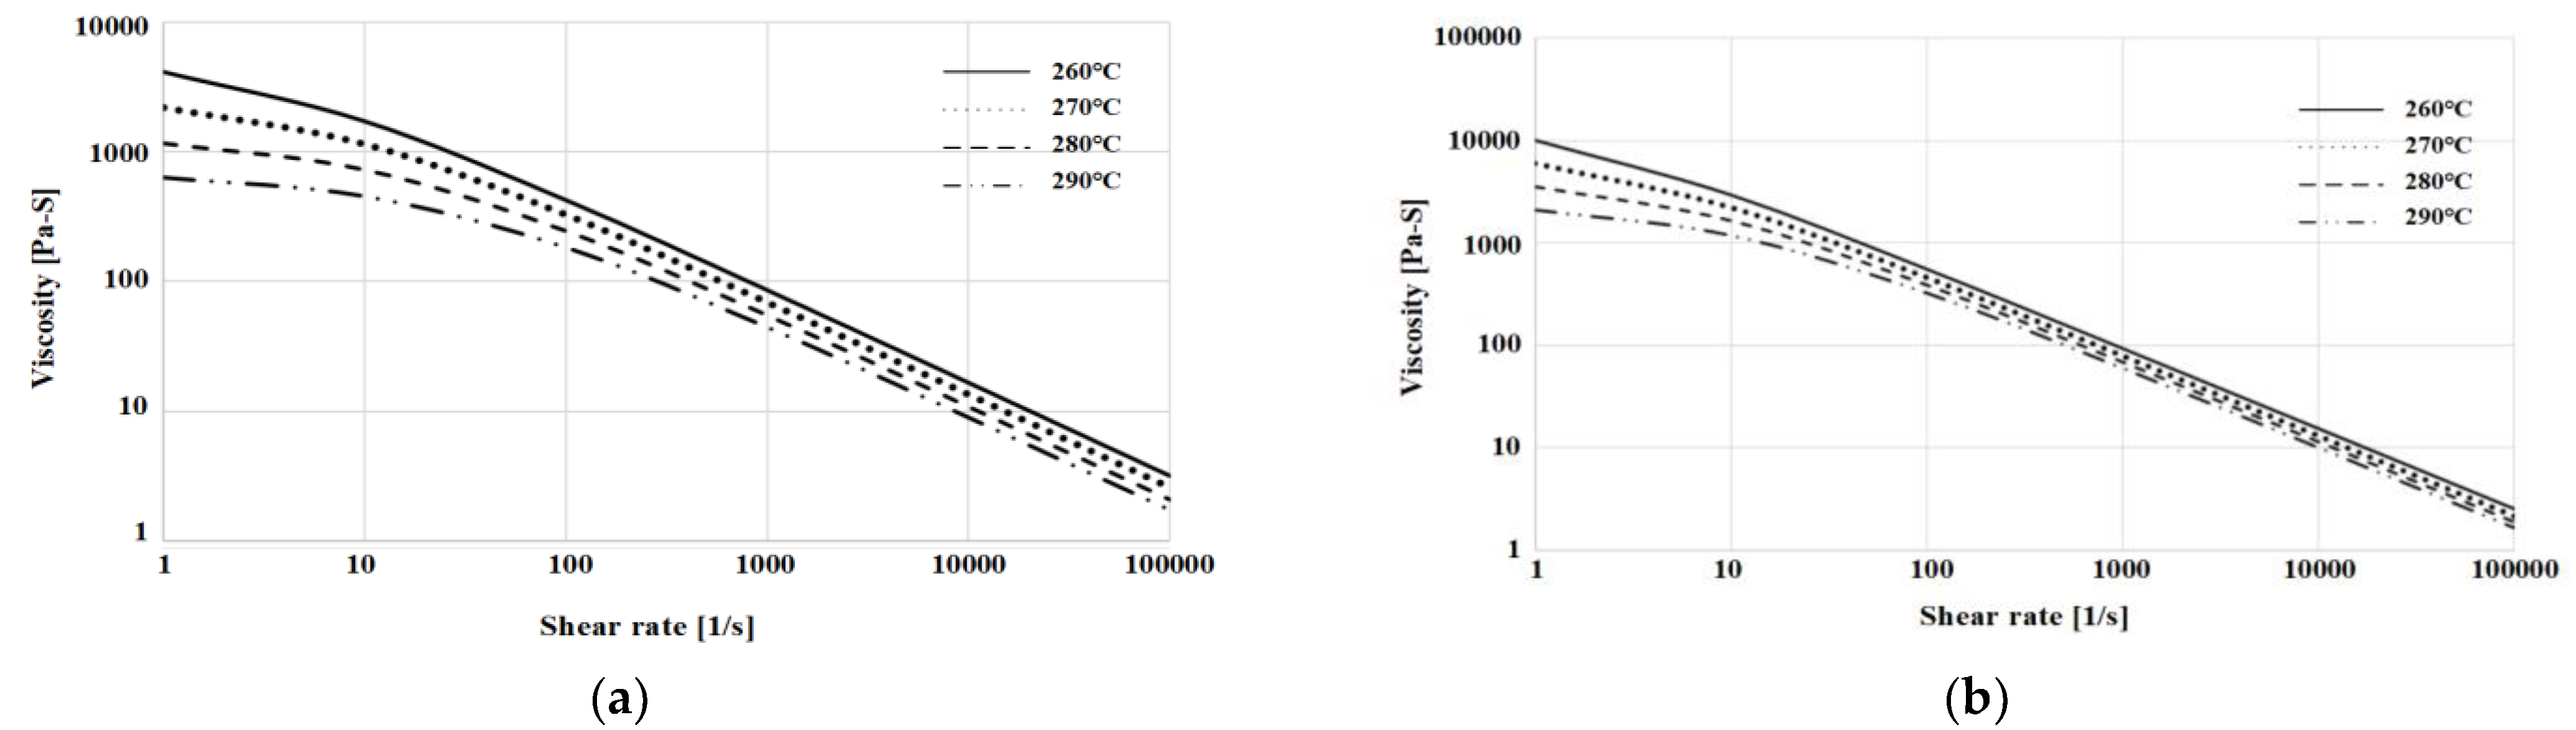
Figure 12.
Cross-WLF viscosity: 260, 270, 280, and 290 °C for (a) non-reinforced mPPO; (b) GF-reinforced mPPO.
Figure 12.
Cross-WLF viscosity: 260, 270, 280, and 290 °C for (a) non-reinforced mPPO; (b) GF-reinforced mPPO.
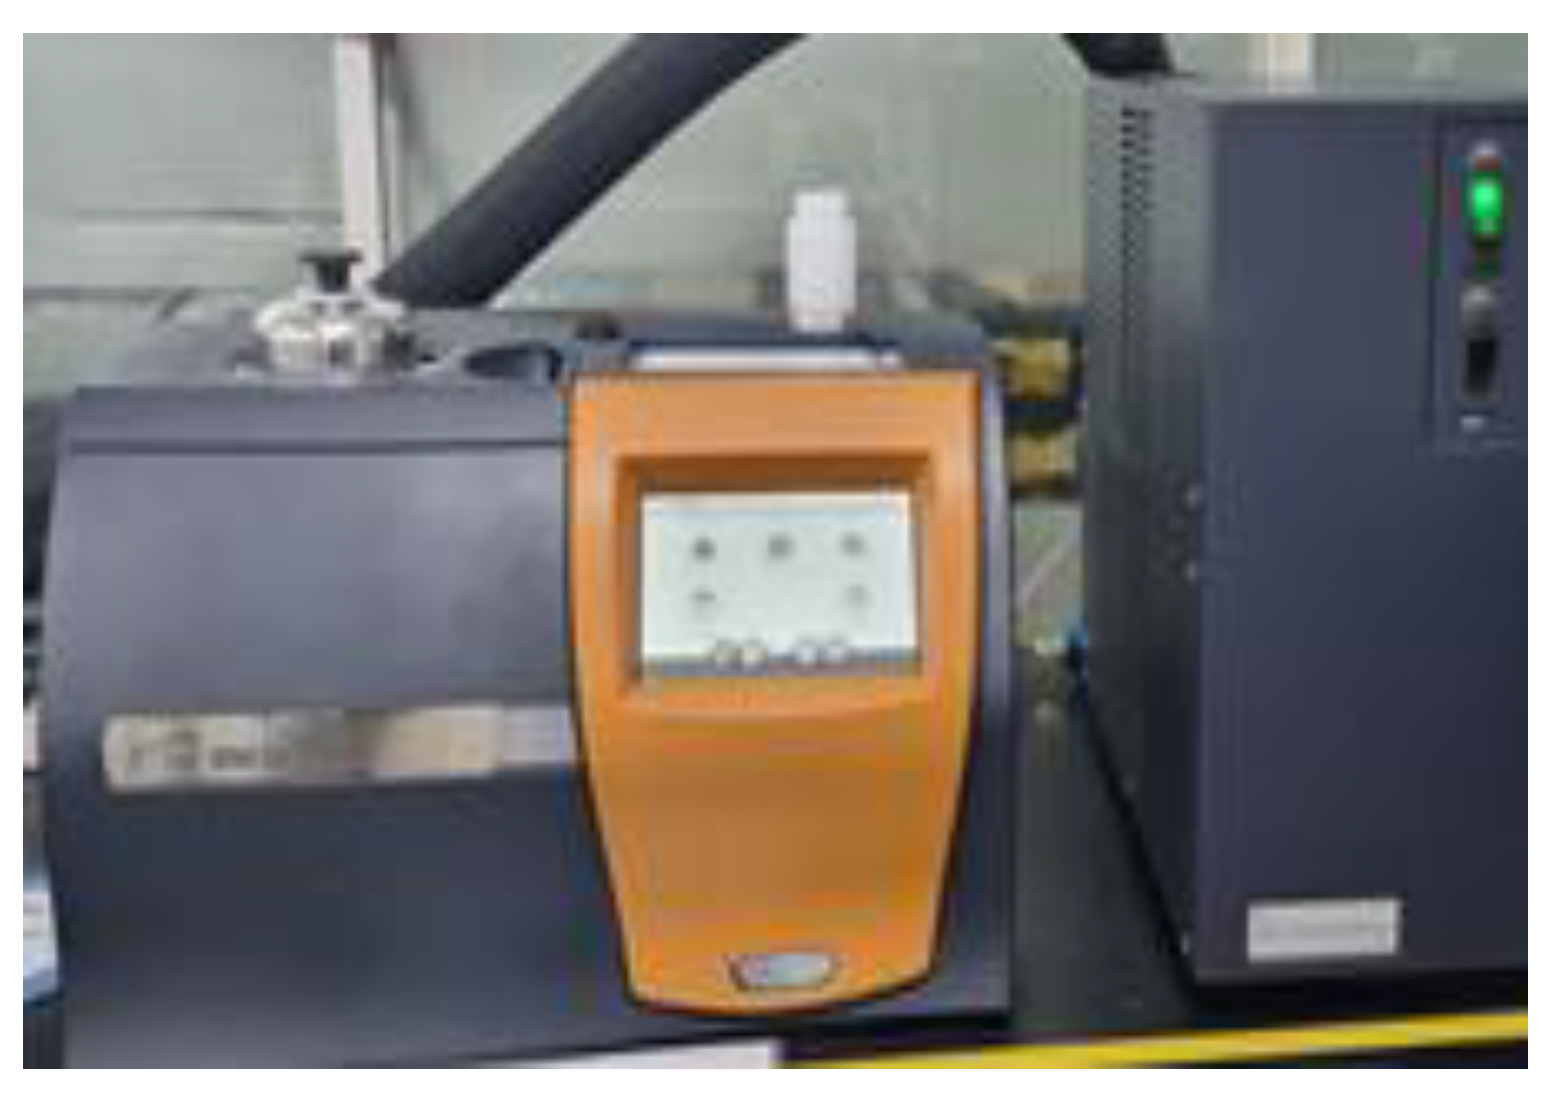
Figure 13.
Differential scanning calorimetry.
Figure 13.
Differential scanning calorimetry.
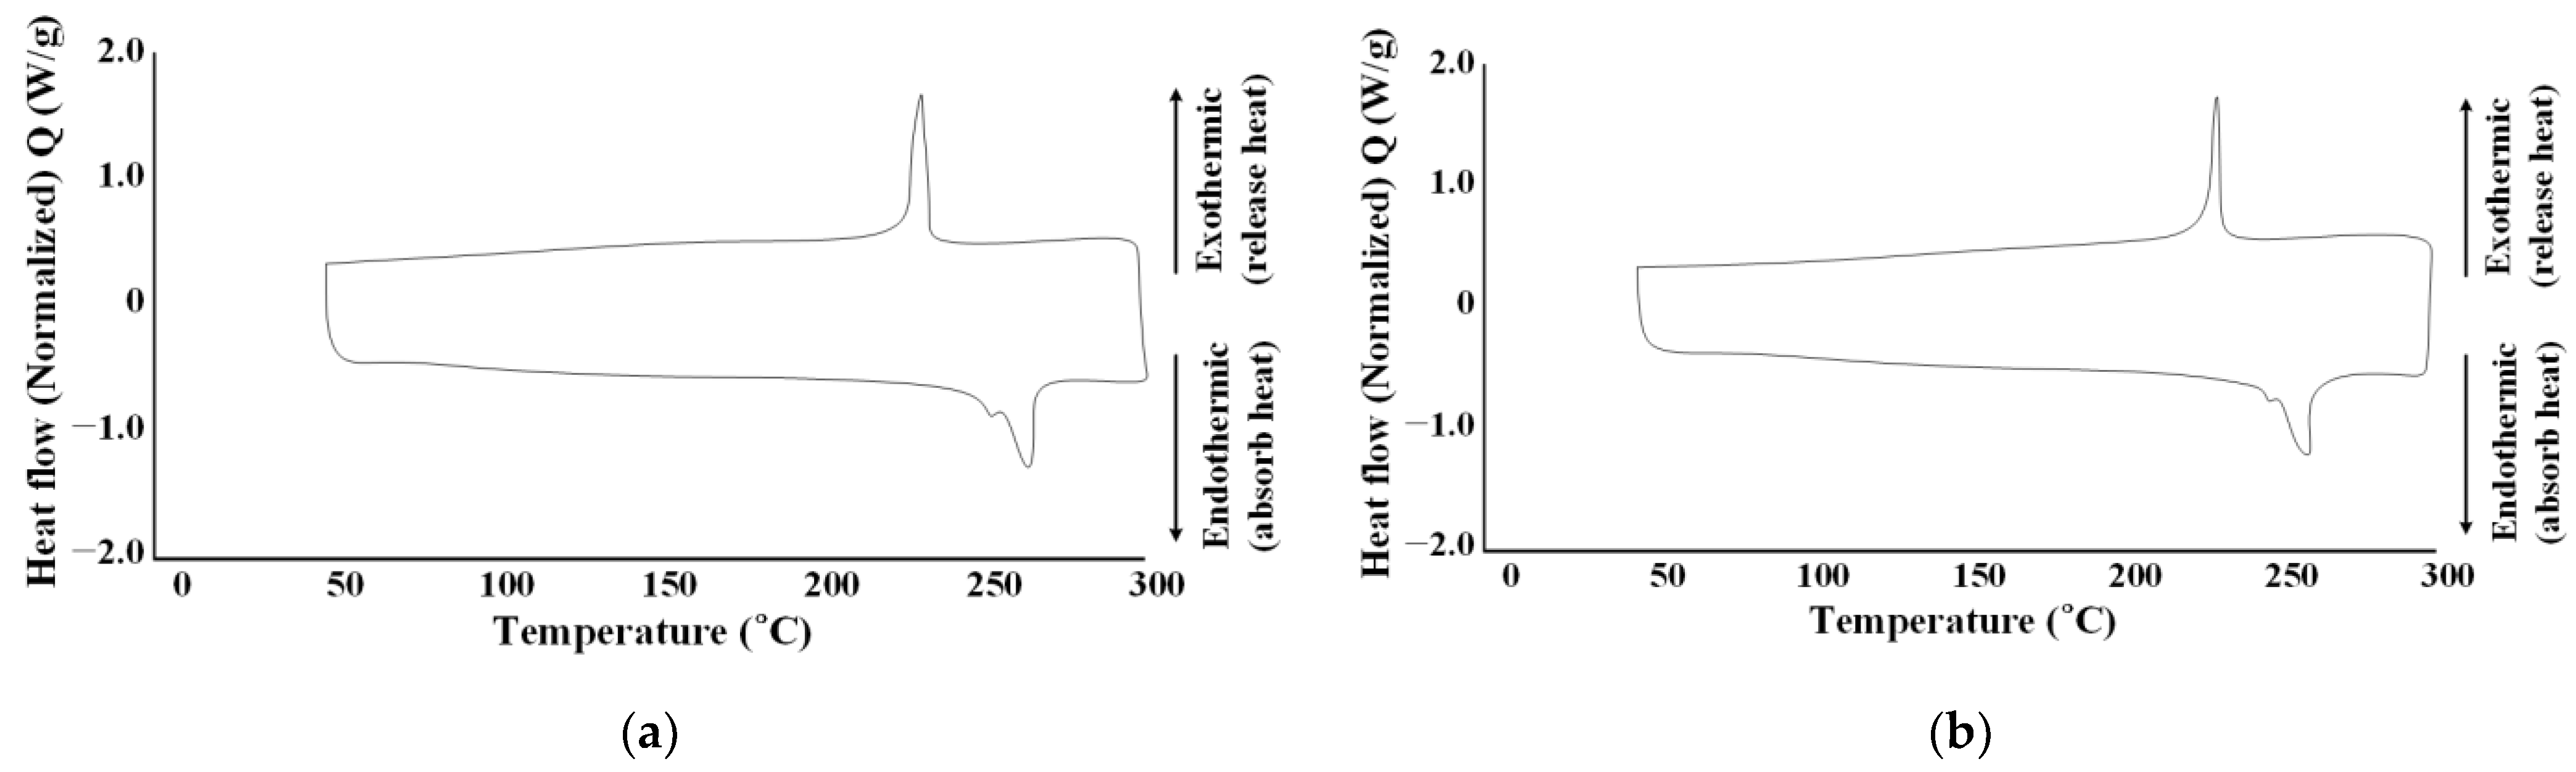
Figure 14.
Melt temperature graph. (a) Non-reinforced mPPO; (b) GF-reinforced mPPO.
Figure 14.
Melt temperature graph. (a) Non-reinforced mPPO; (b) GF-reinforced mPPO.
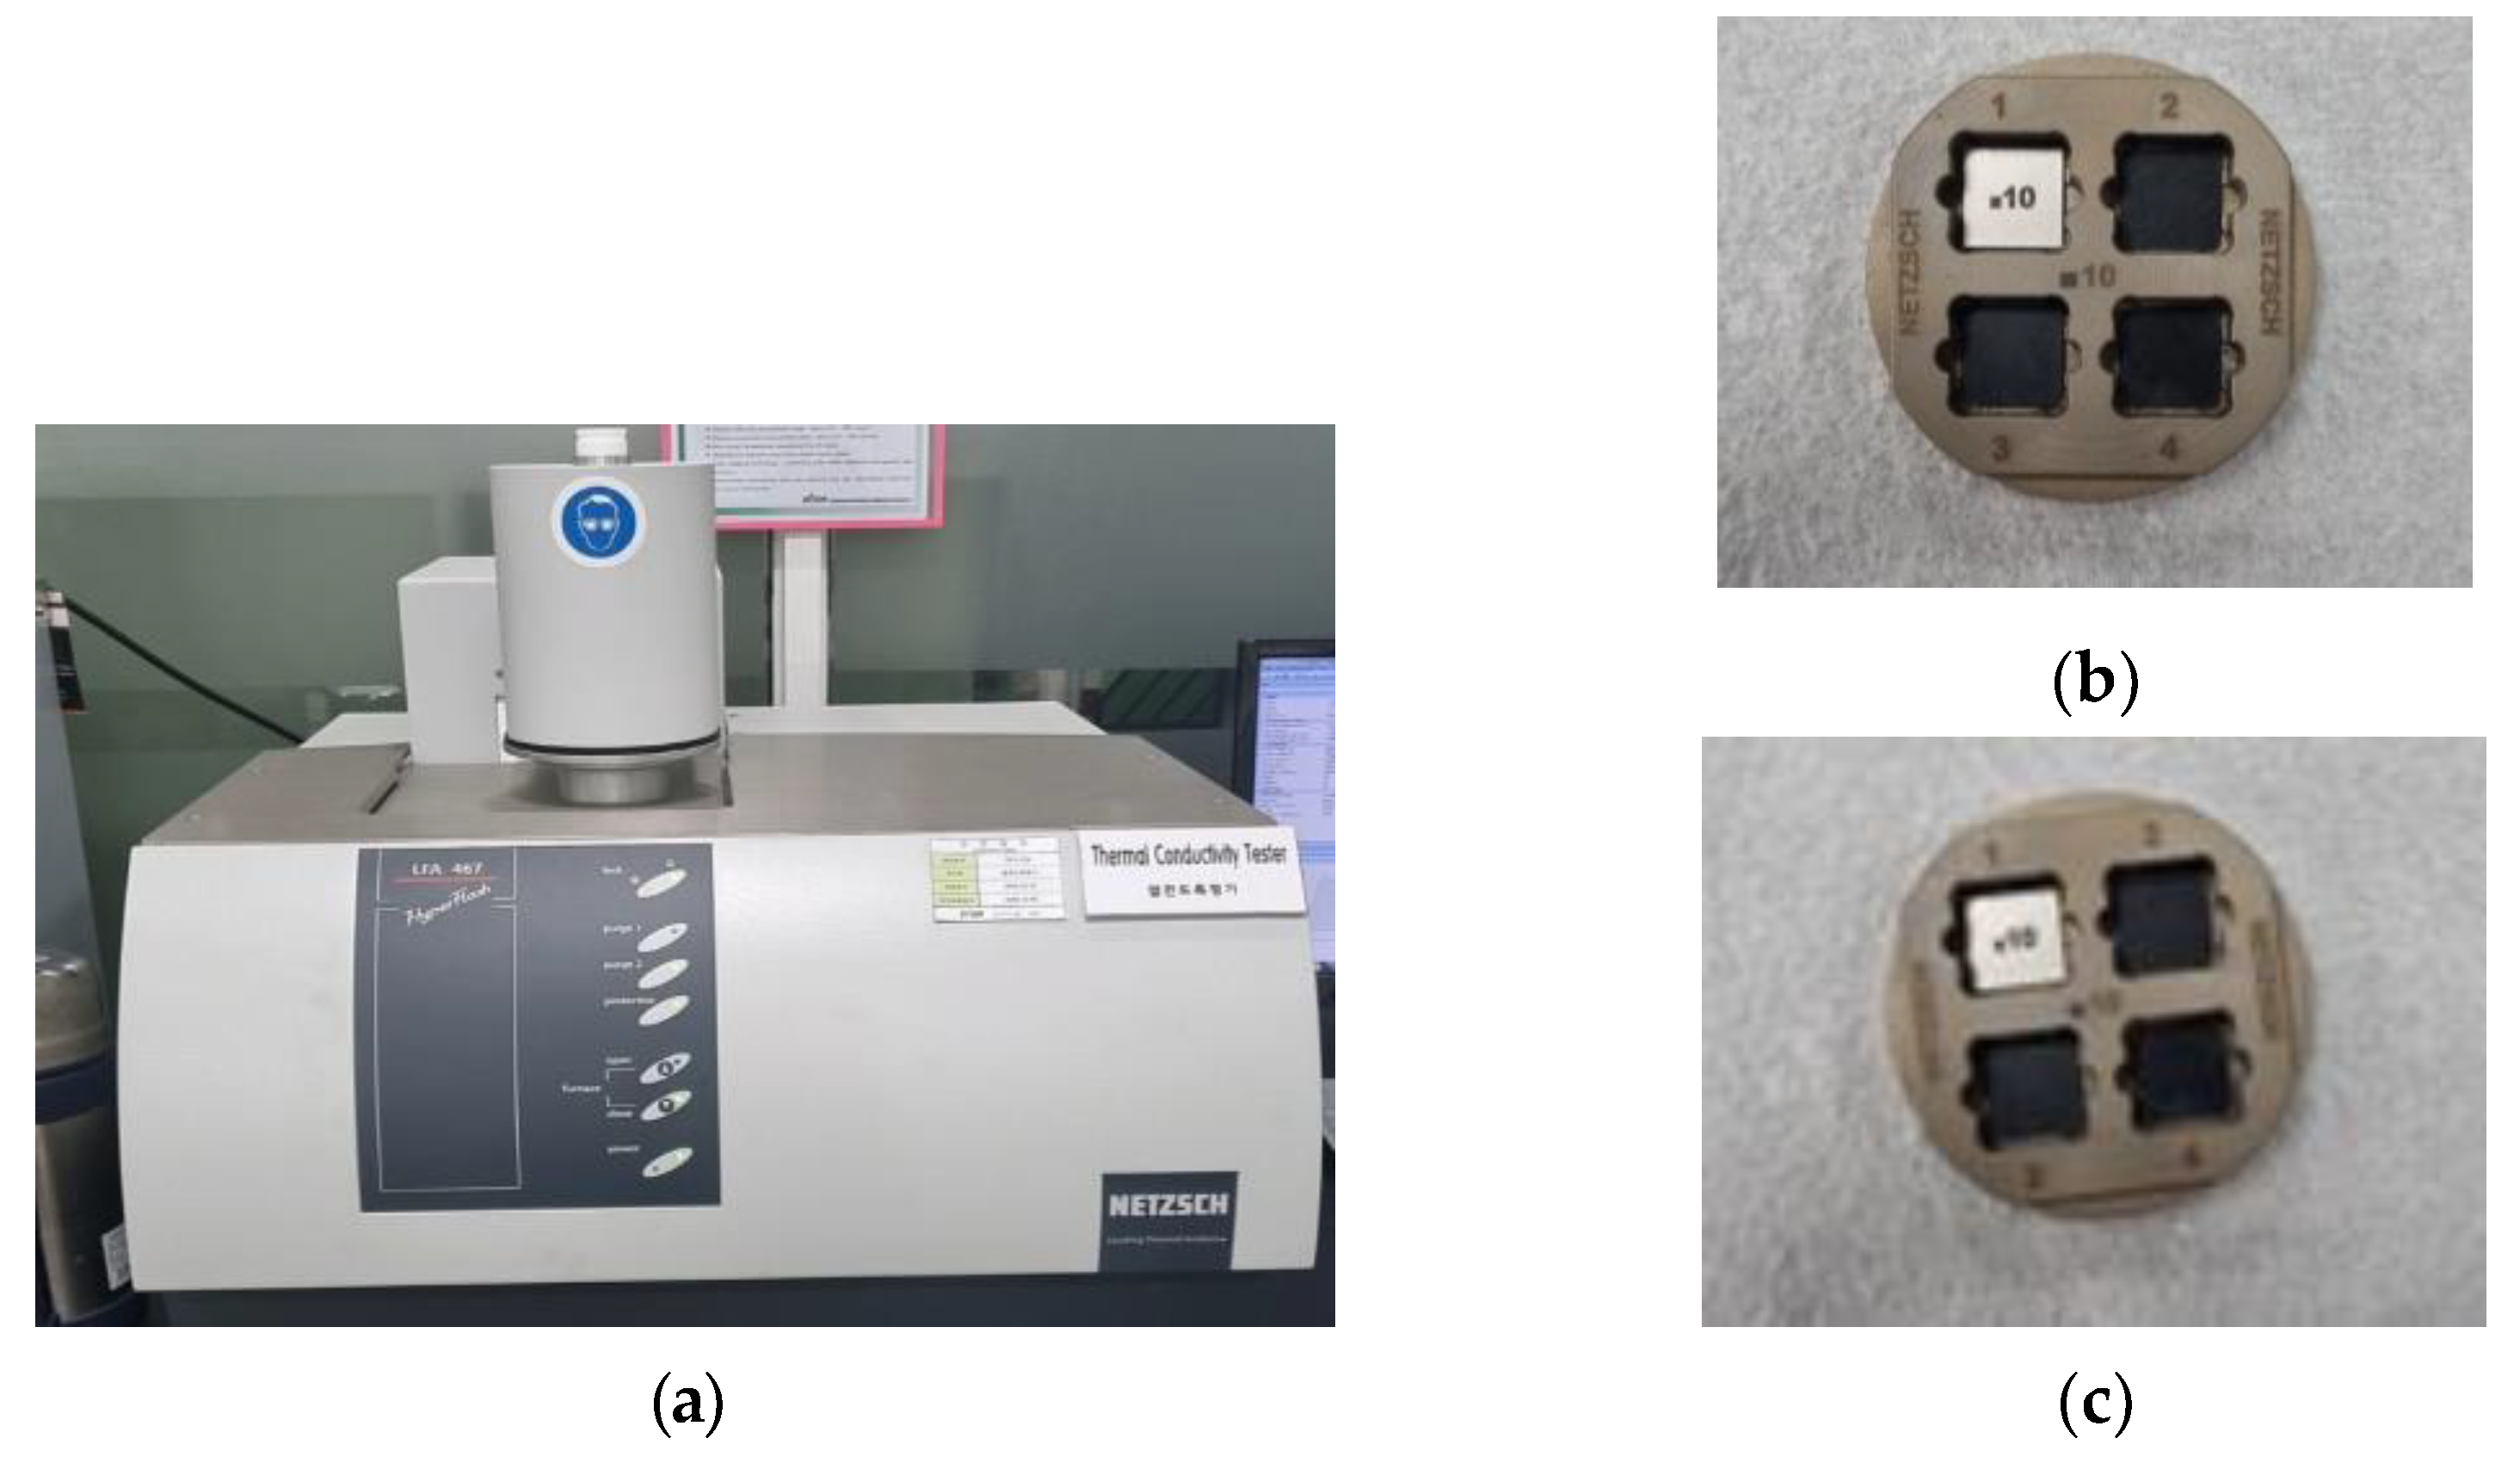
Figure 15.
Thermal conductivity test. (a) Laser flash analyzer, specimen test result of (b) non-reinforced mPPO and (c) reinforced mPPO.
Figure 15.
Thermal conductivity test. (a) Laser flash analyzer, specimen test result of (b) non-reinforced mPPO and (c) reinforced mPPO.
Figure 16.
Specific heat in 25, 50, 100, 150, 200, and 250 °C: (a) Non-reinforced mPPO; (b) GF-reinforced mPPO.
Figure 16.
Specific heat in 25, 50, 100, 150, 200, and 250 °C: (a) Non-reinforced mPPO; (b) GF-reinforced mPPO.
Figure 18.
Weld line by the pin-point gate size on face C. (a) 1.5 mm; (b) 2 mm; (c) 2.5 mm; (d) 3 mm.
Figure 18.
Weld line by the pin-point gate size on face C. (a) 1.5 mm; (b) 2 mm; (c) 2.5 mm; (d) 3 mm.
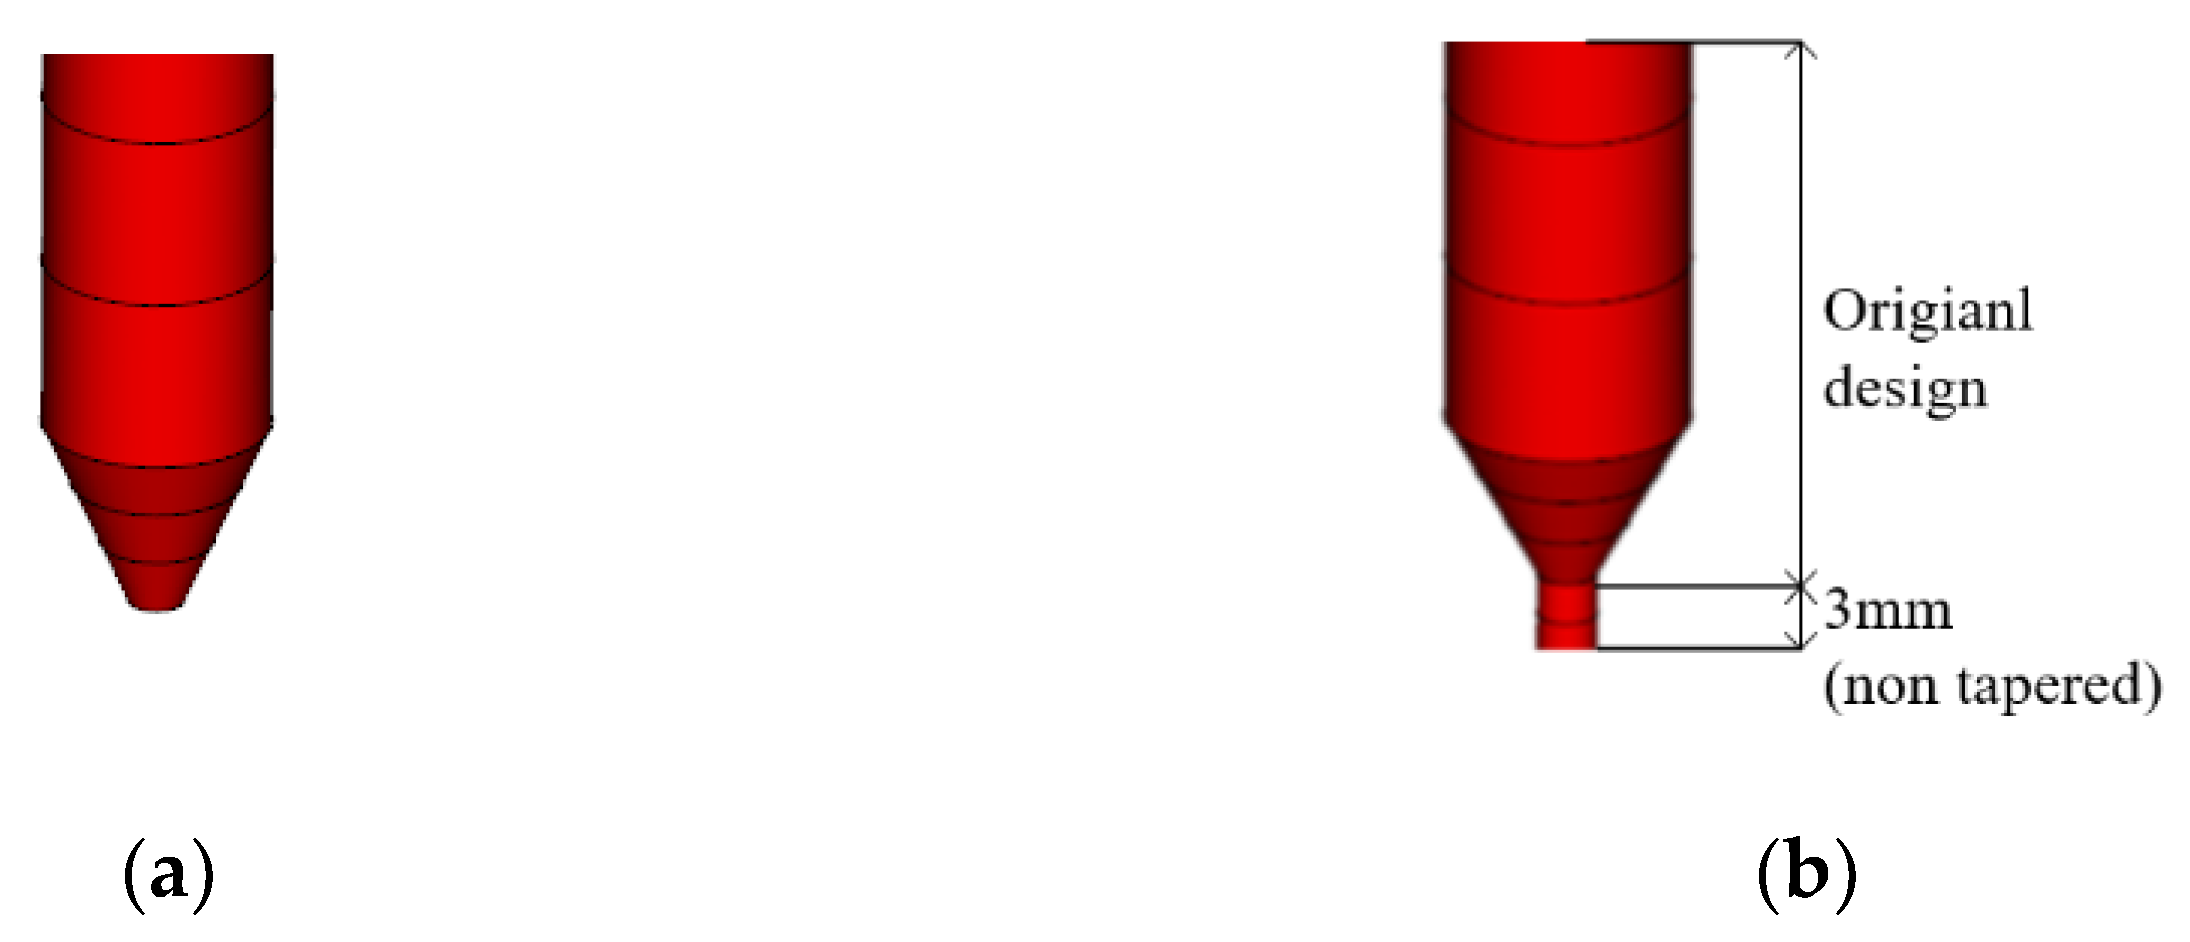
Figure 19.
Pin-point gate shape. (a) Original design; (b) non-tapered modified design.
Figure 19.
Pin-point gate shape. (a) Original design; (b) non-tapered modified design.
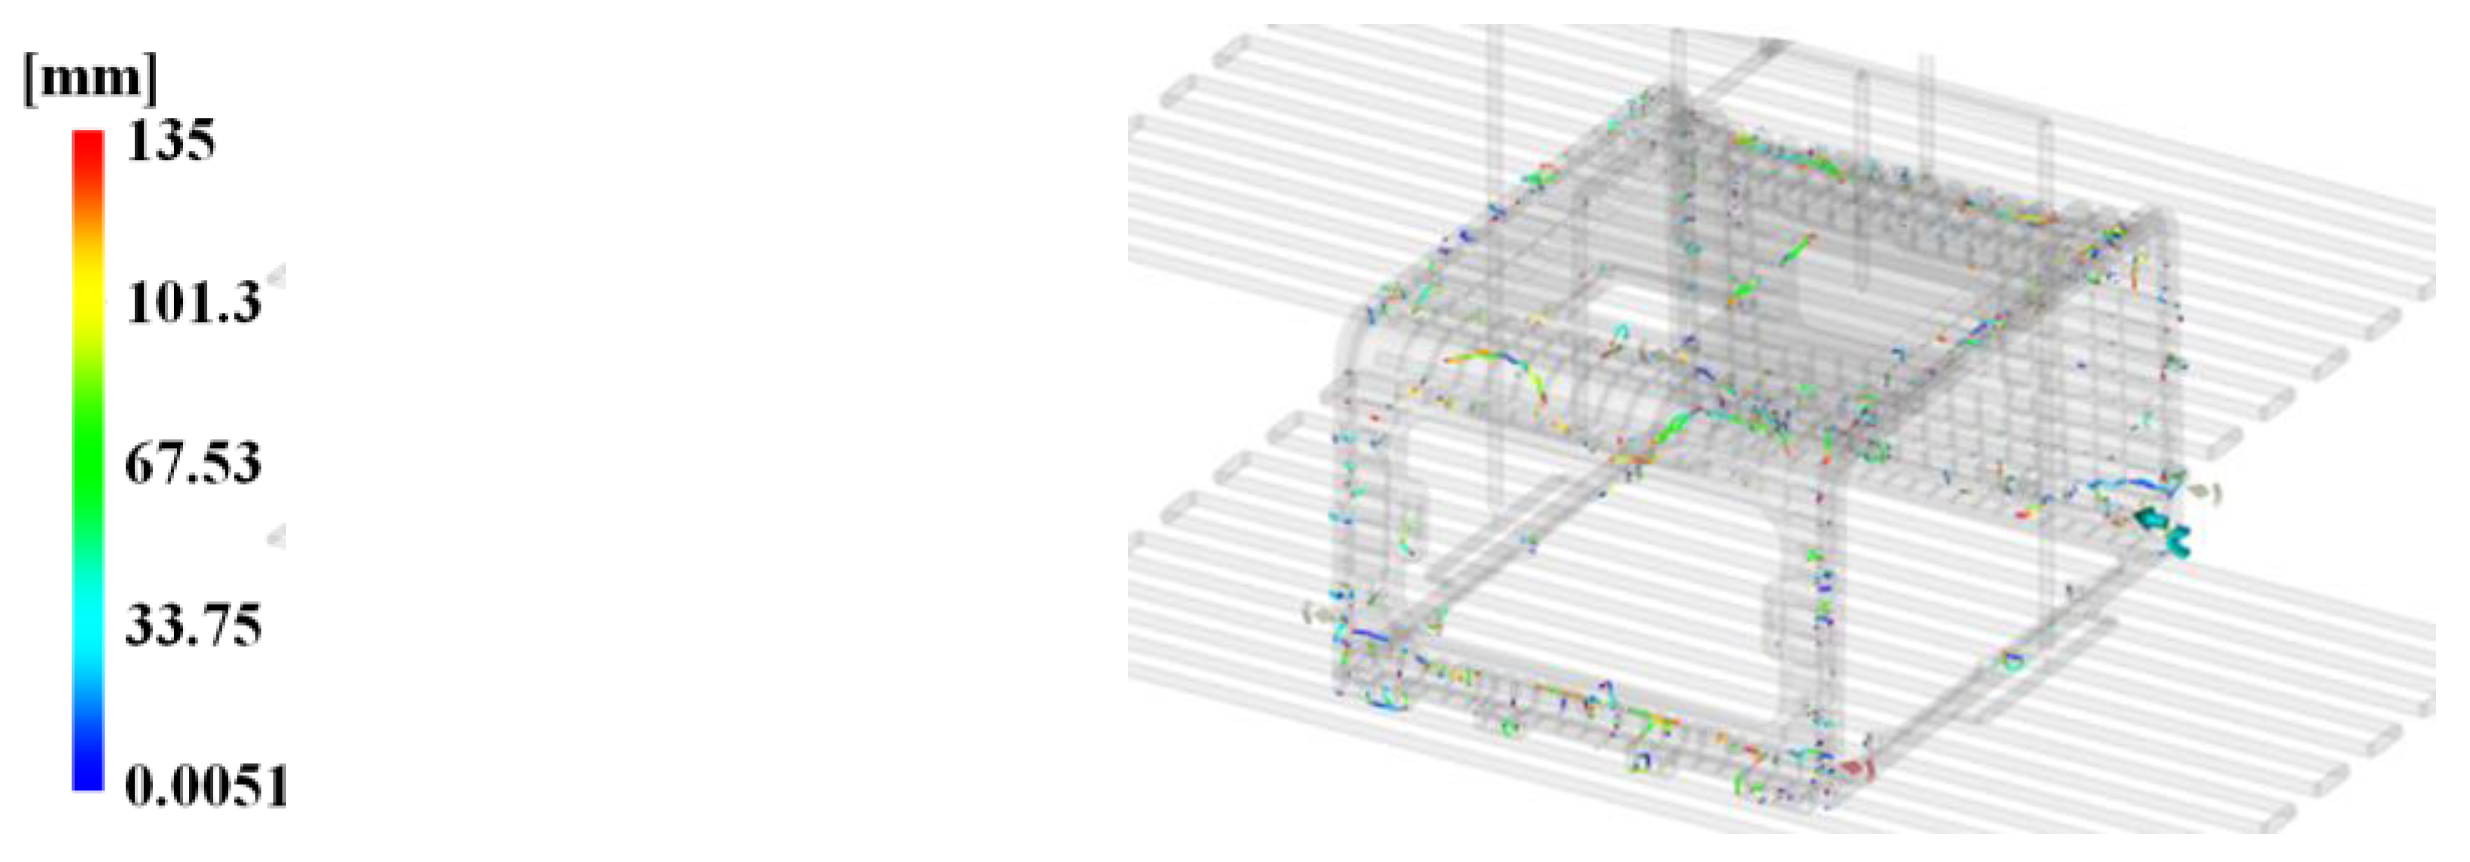
Figure 20.
Overall weld line result with modified pin-point gate shape.
Figure 20.
Overall weld line result with modified pin-point gate shape.
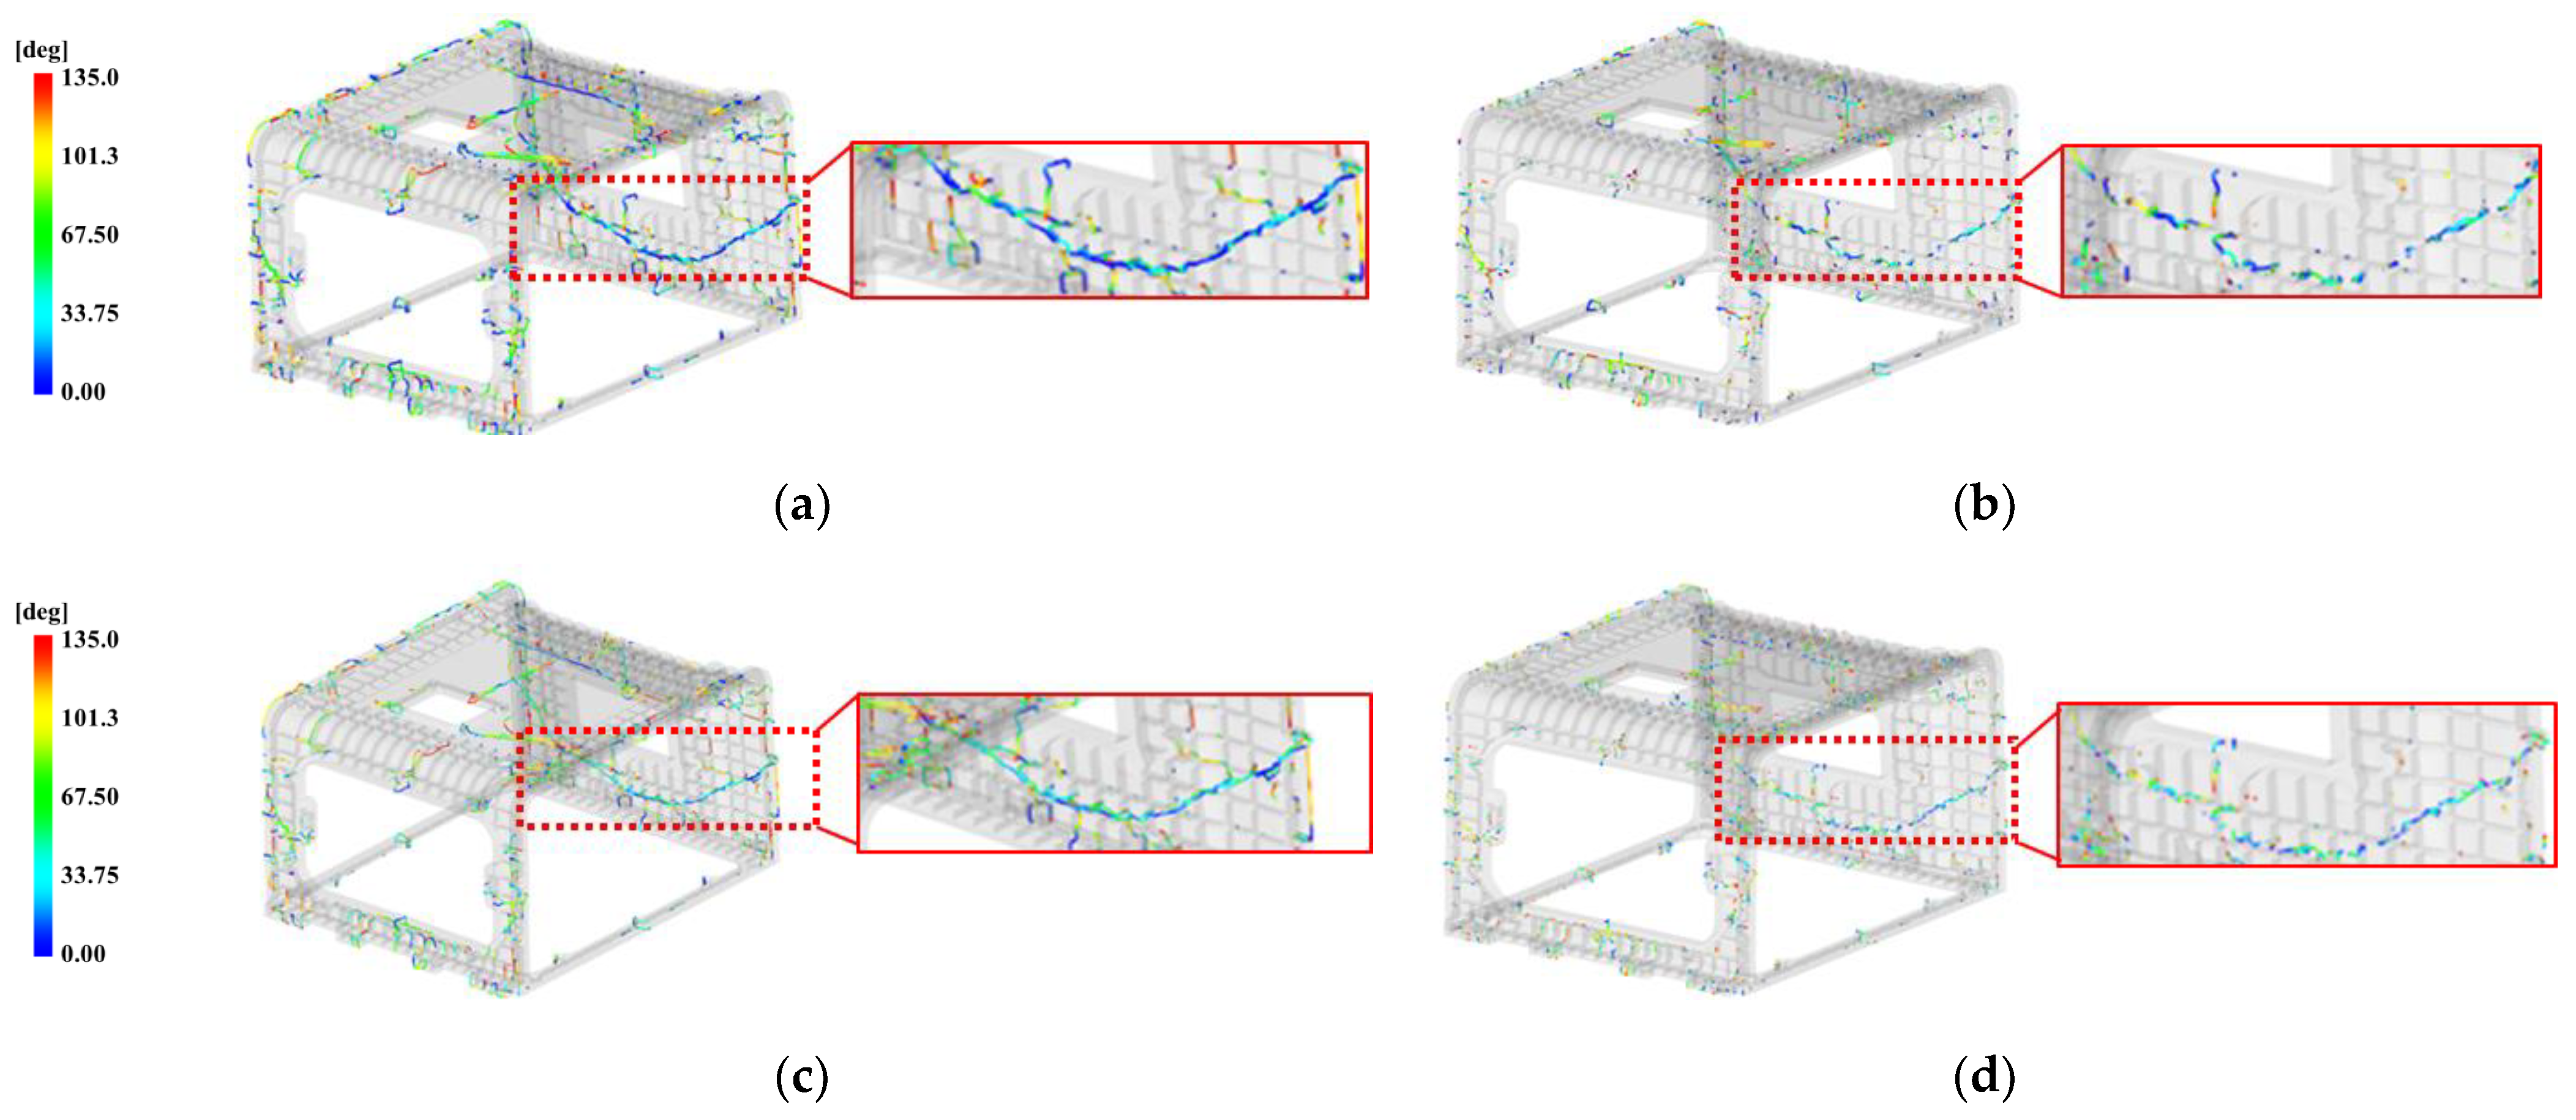
Figure 21.
Weld line effects on face C with tab gate’s height. (a) Original pin-point gate shape and tab gate’s height 5 mm; (b) original pin-point gate shape and tab gate’s height 6.5 mm; (c) modified pin-point gate shape and tab gate’s height 5 mm; (d) modified pin-point gate shape and tab gate’s height 6.5 mm.
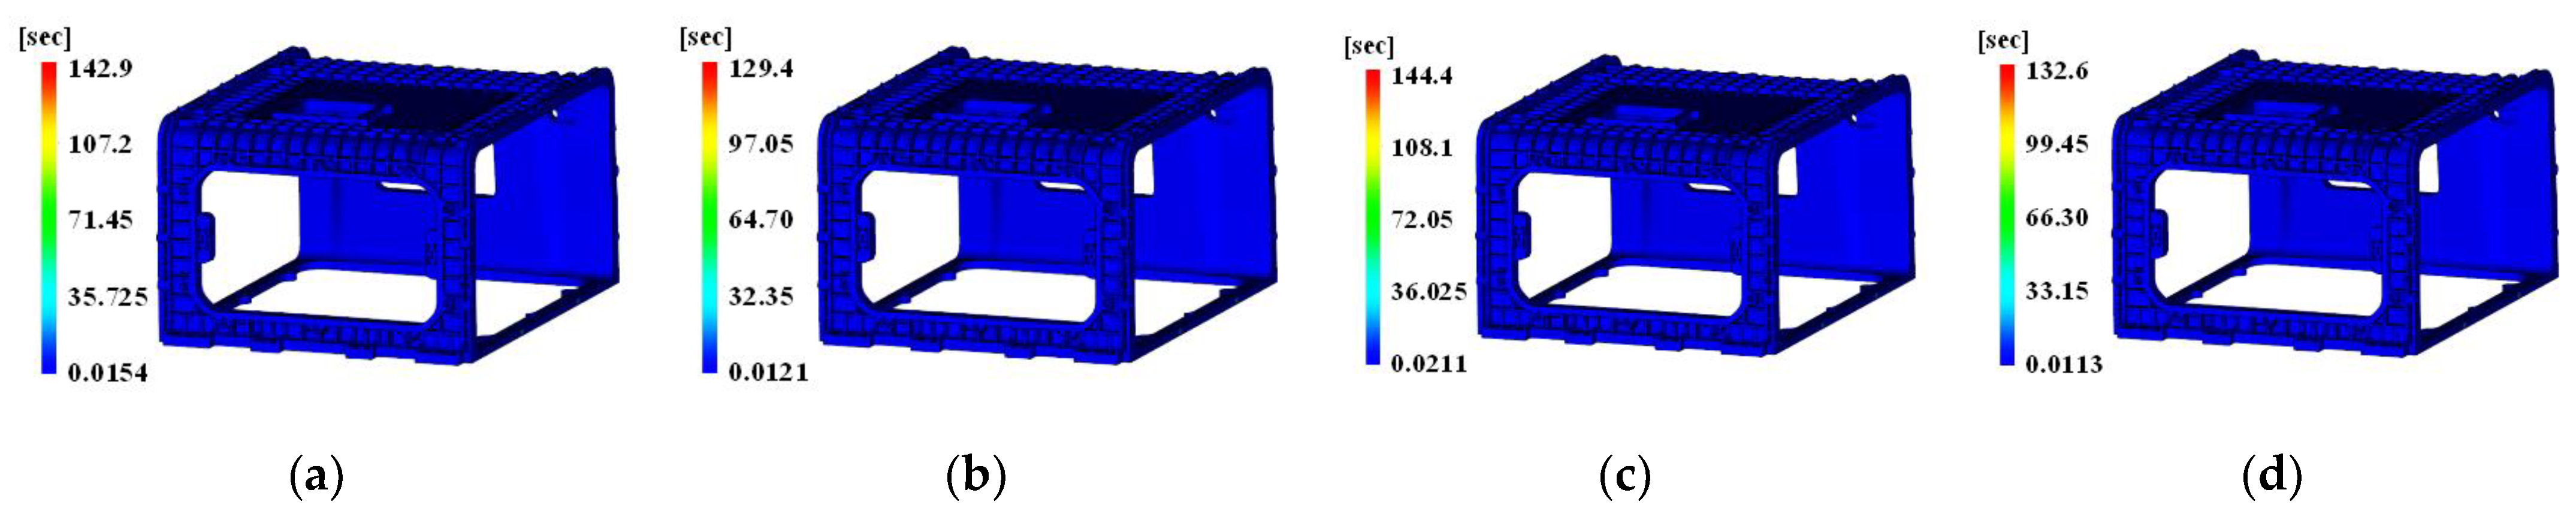
Figure 22.
Time to reach ejection temperature effects with tab gate’s height. (a) Original pin-point gate shape and tab gate’s height 5 mm; (b) original pin-point gate shape and tab gate’s height 6.5 mm; (c) modified pin-point gate shape and tab gate’s height 5 mm; (d) modified pin-point gate shape and tab gate’s height 6.5 mm.
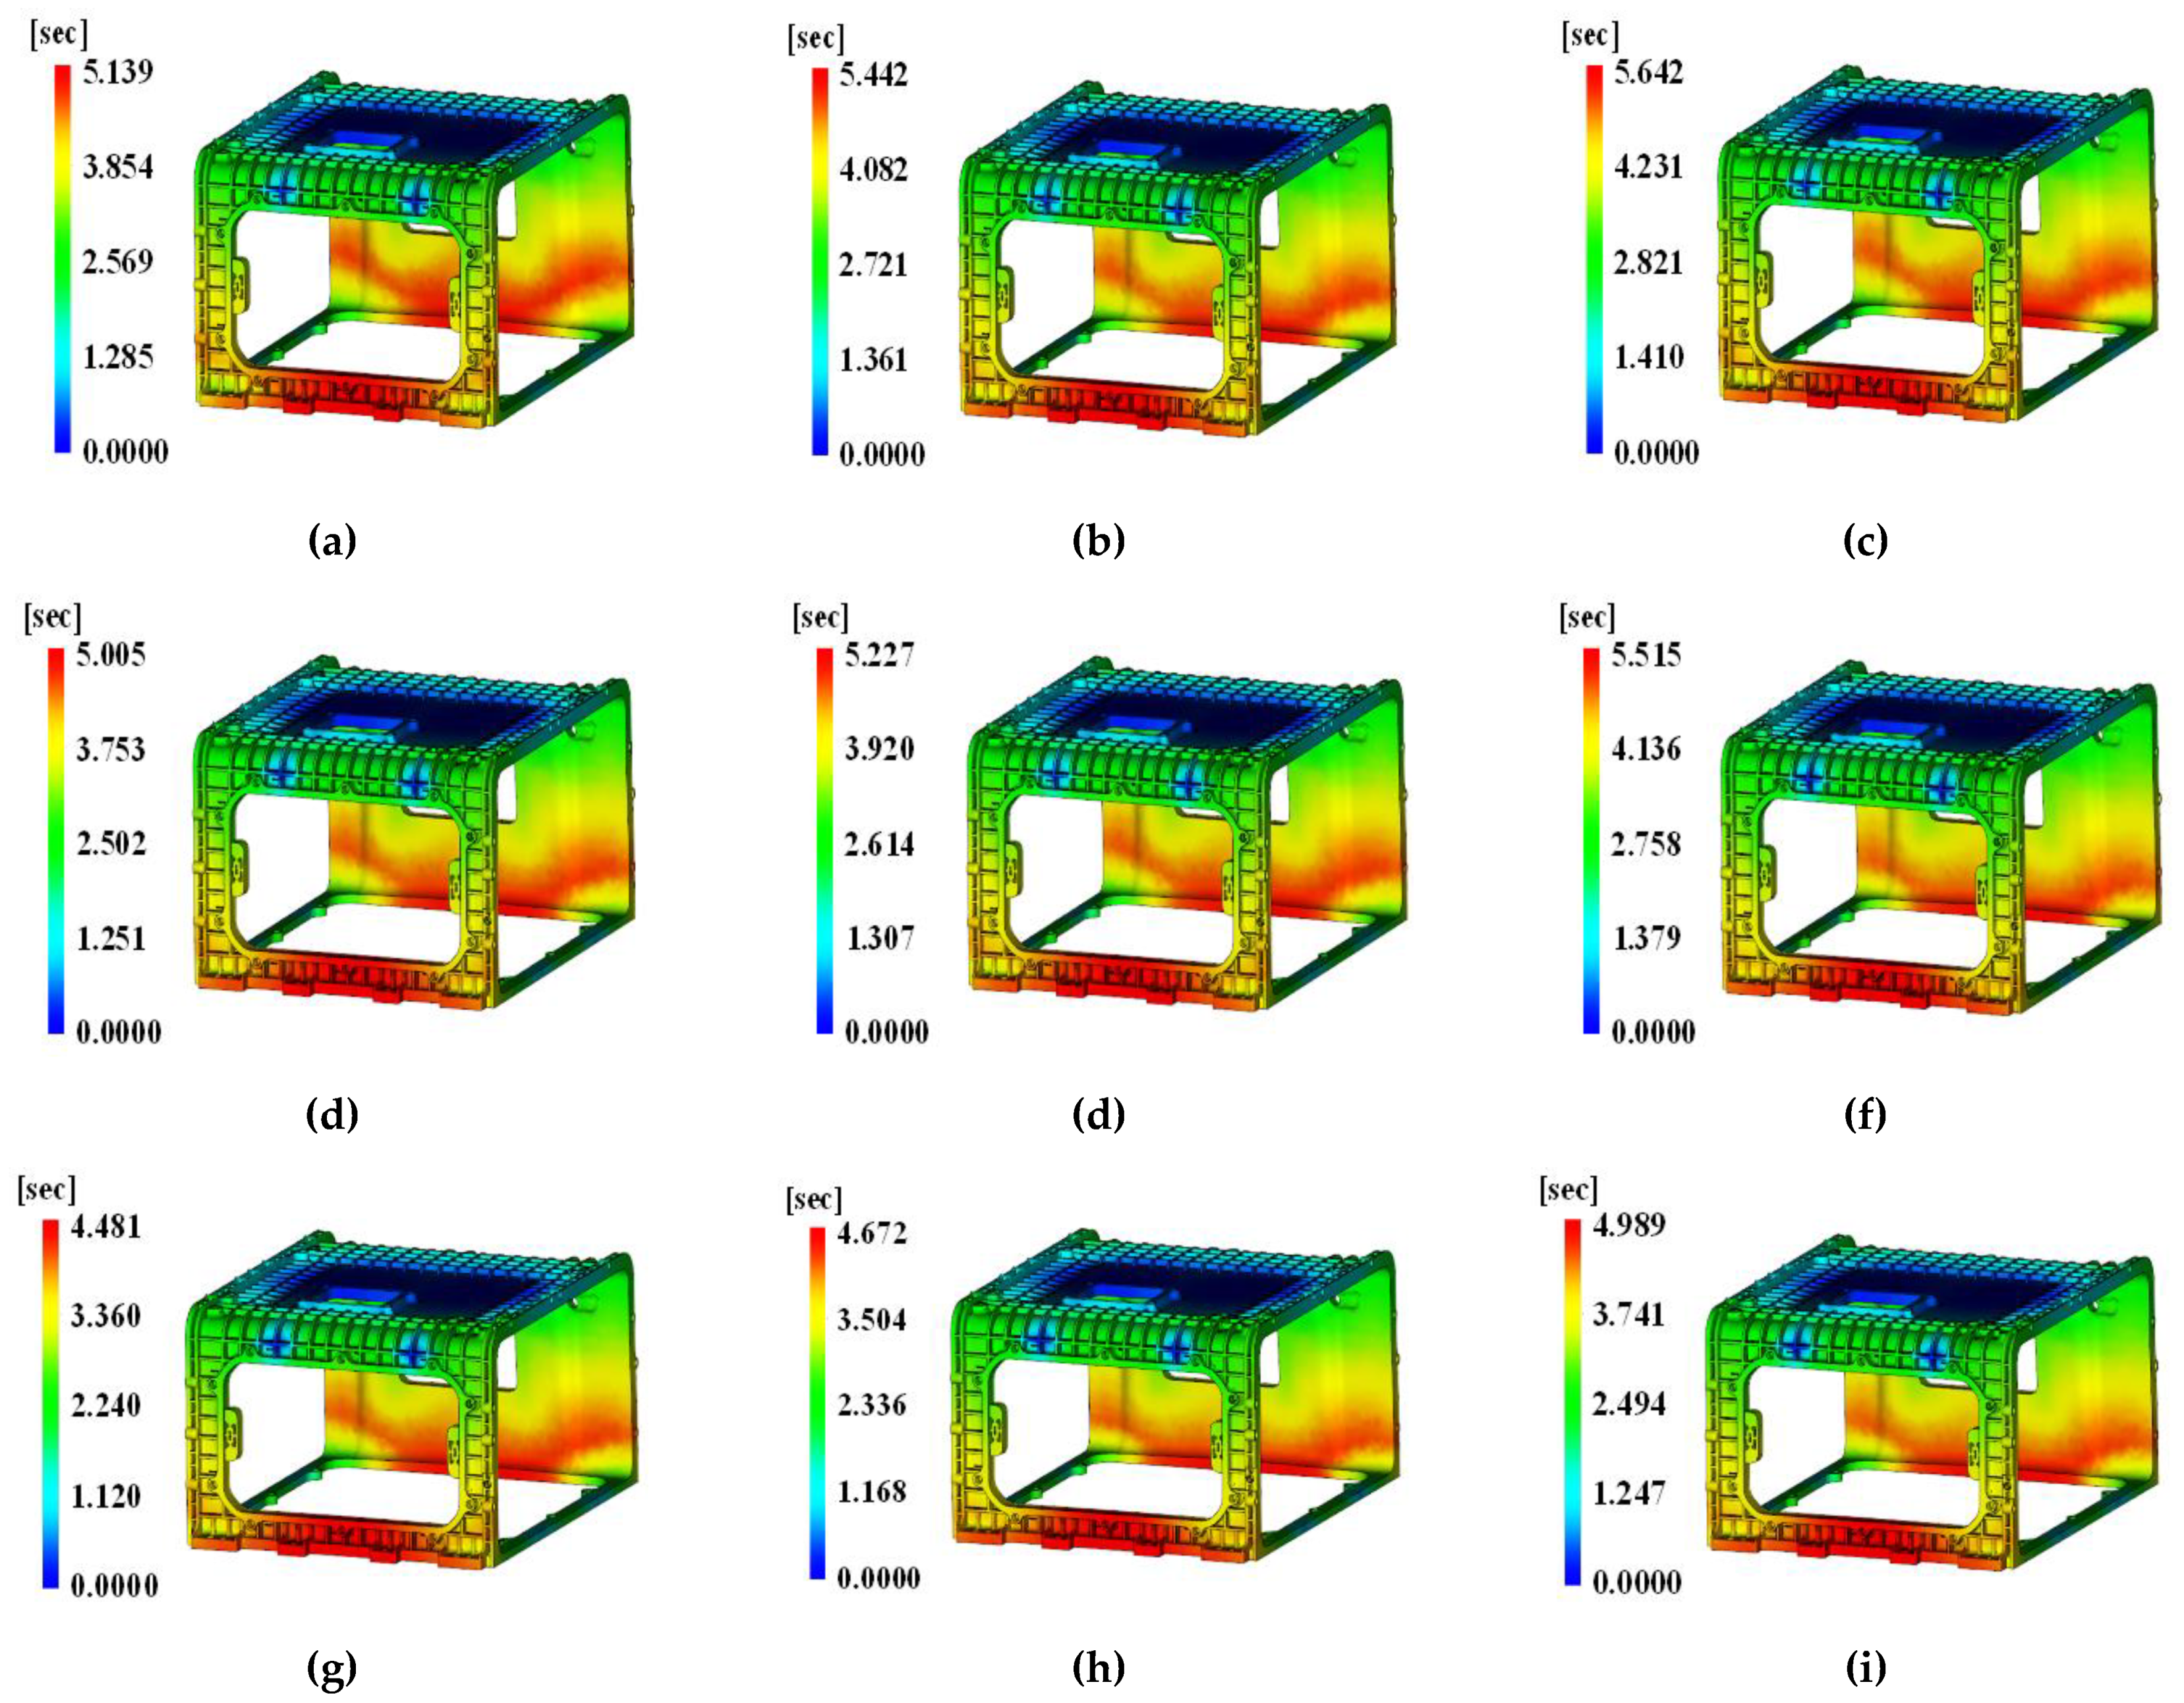
Figure 23.
Filling time results of overall view with DOE simulation number. (a) Case 1; (b) Case 2; (c) Case 3; (d) Case 4; (e) Case 5; (f) Case 6; (g) Case 7; (h) Case 8; (i) Case 9.
Figure 23.
Filling time results of overall view with DOE simulation number. (a) Case 1; (b) Case 2; (c) Case 3; (d) Case 4; (e) Case 5; (f) Case 6; (g) Case 7; (h) Case 8; (i) Case 9.
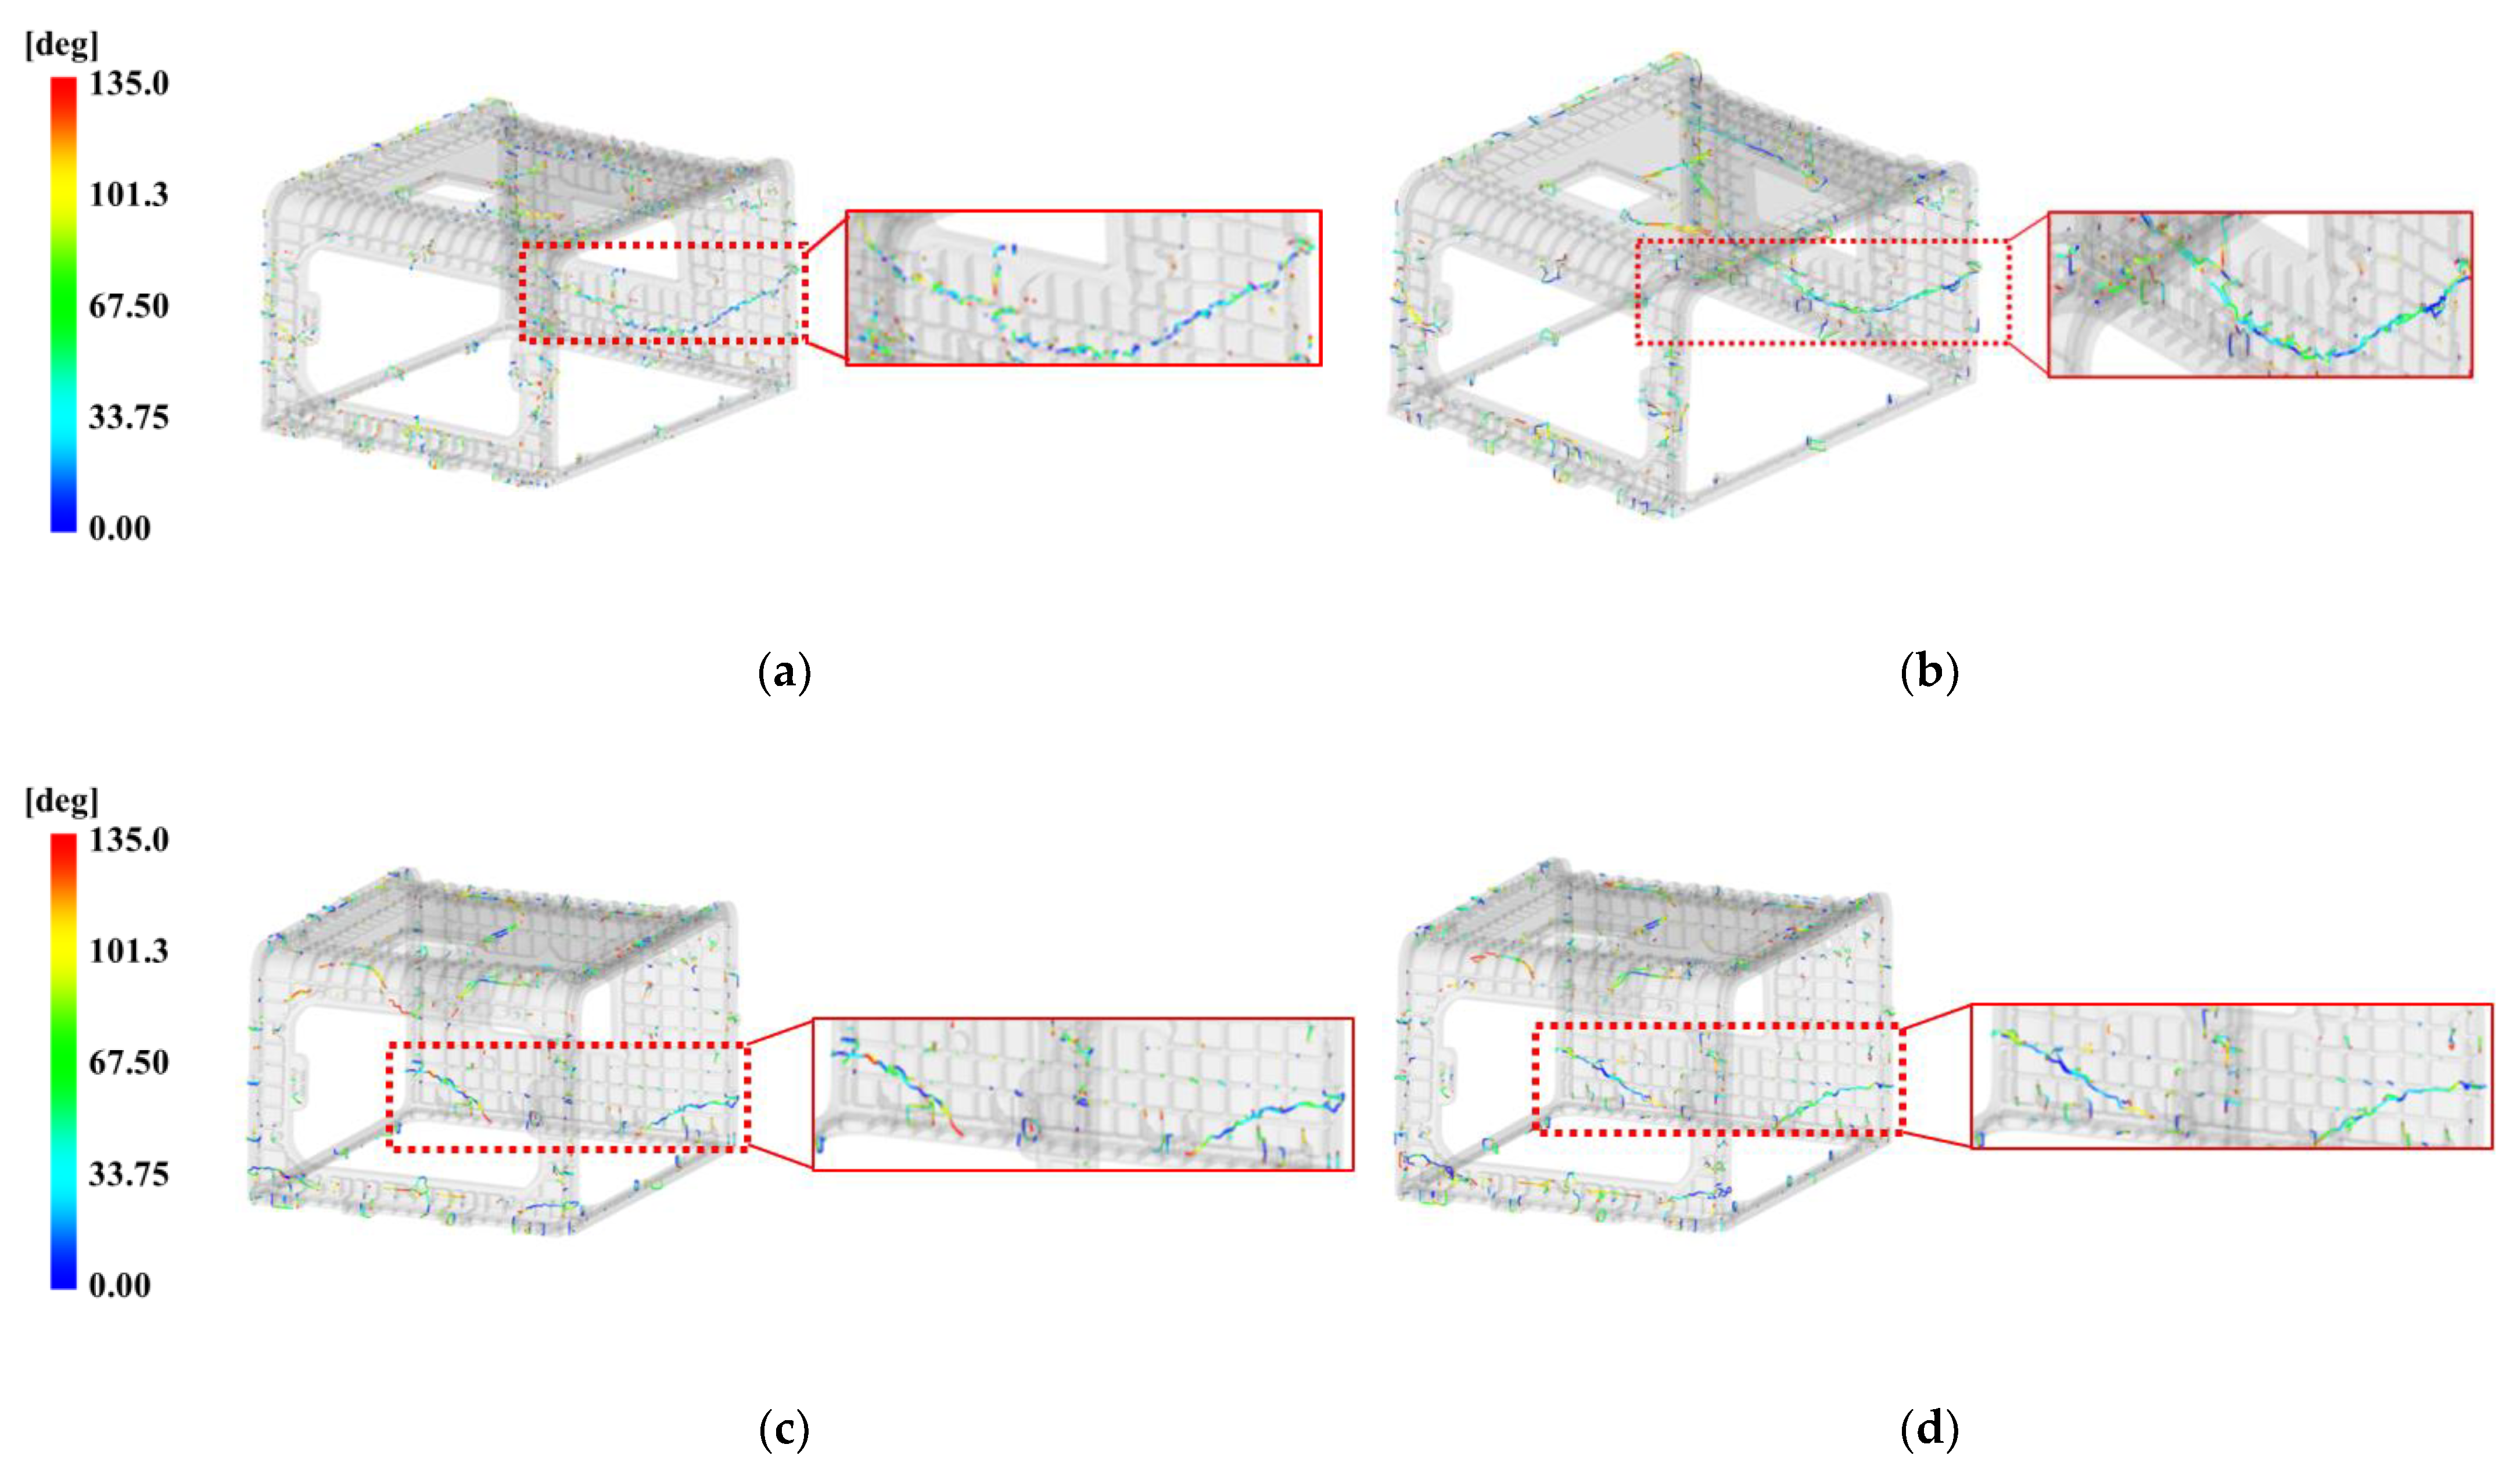
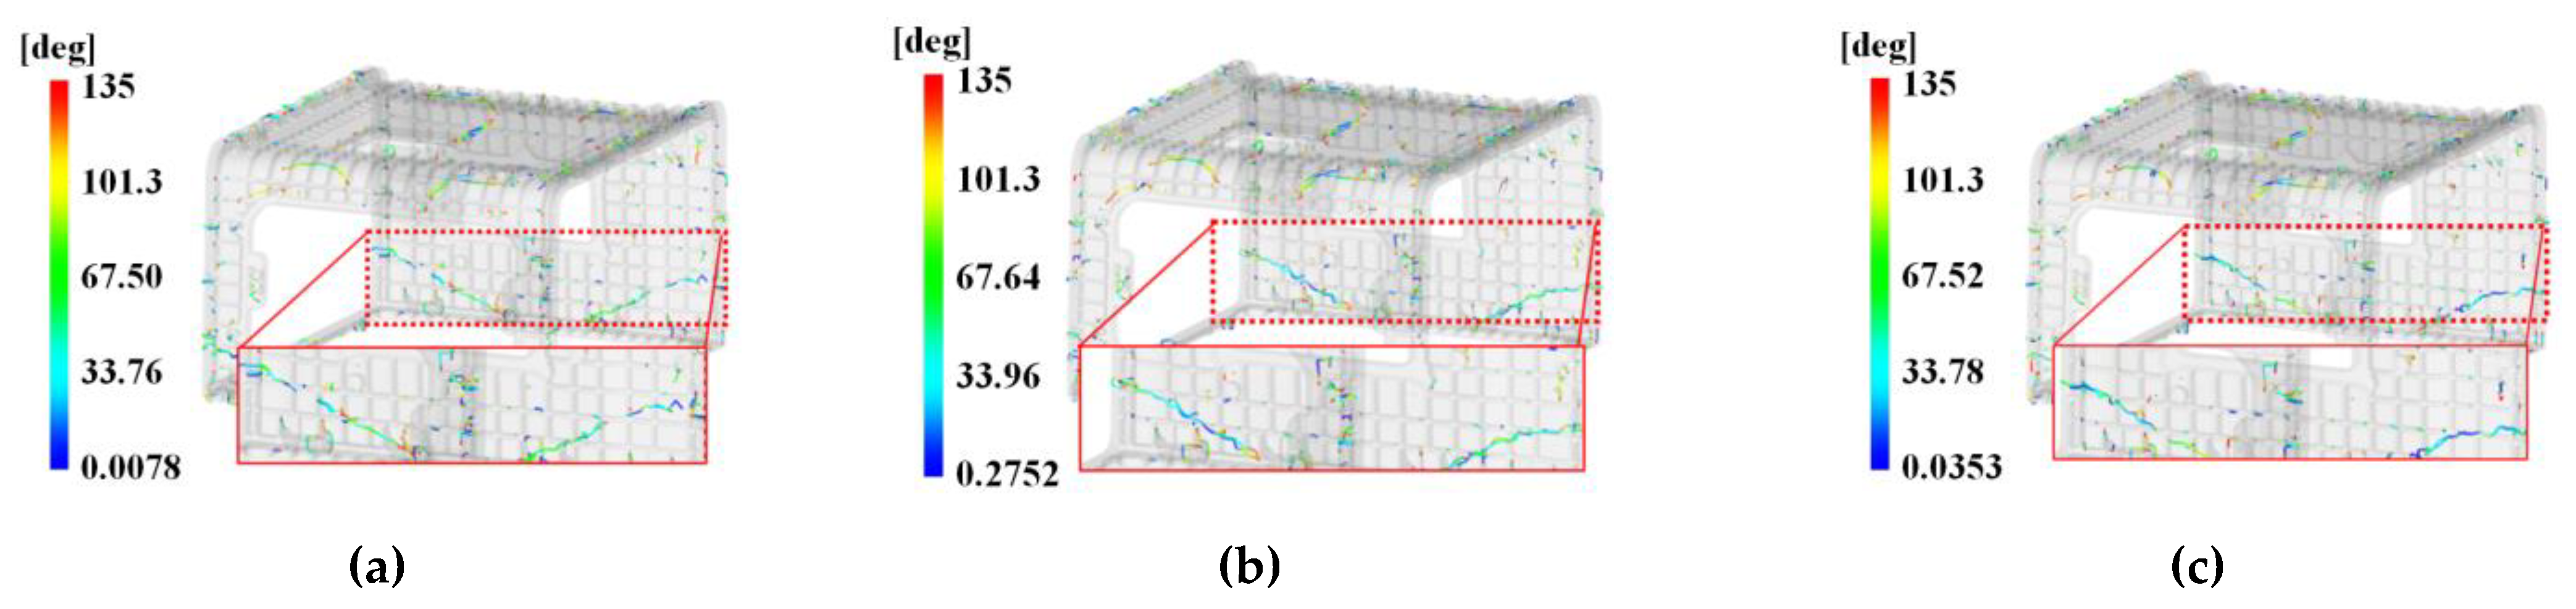
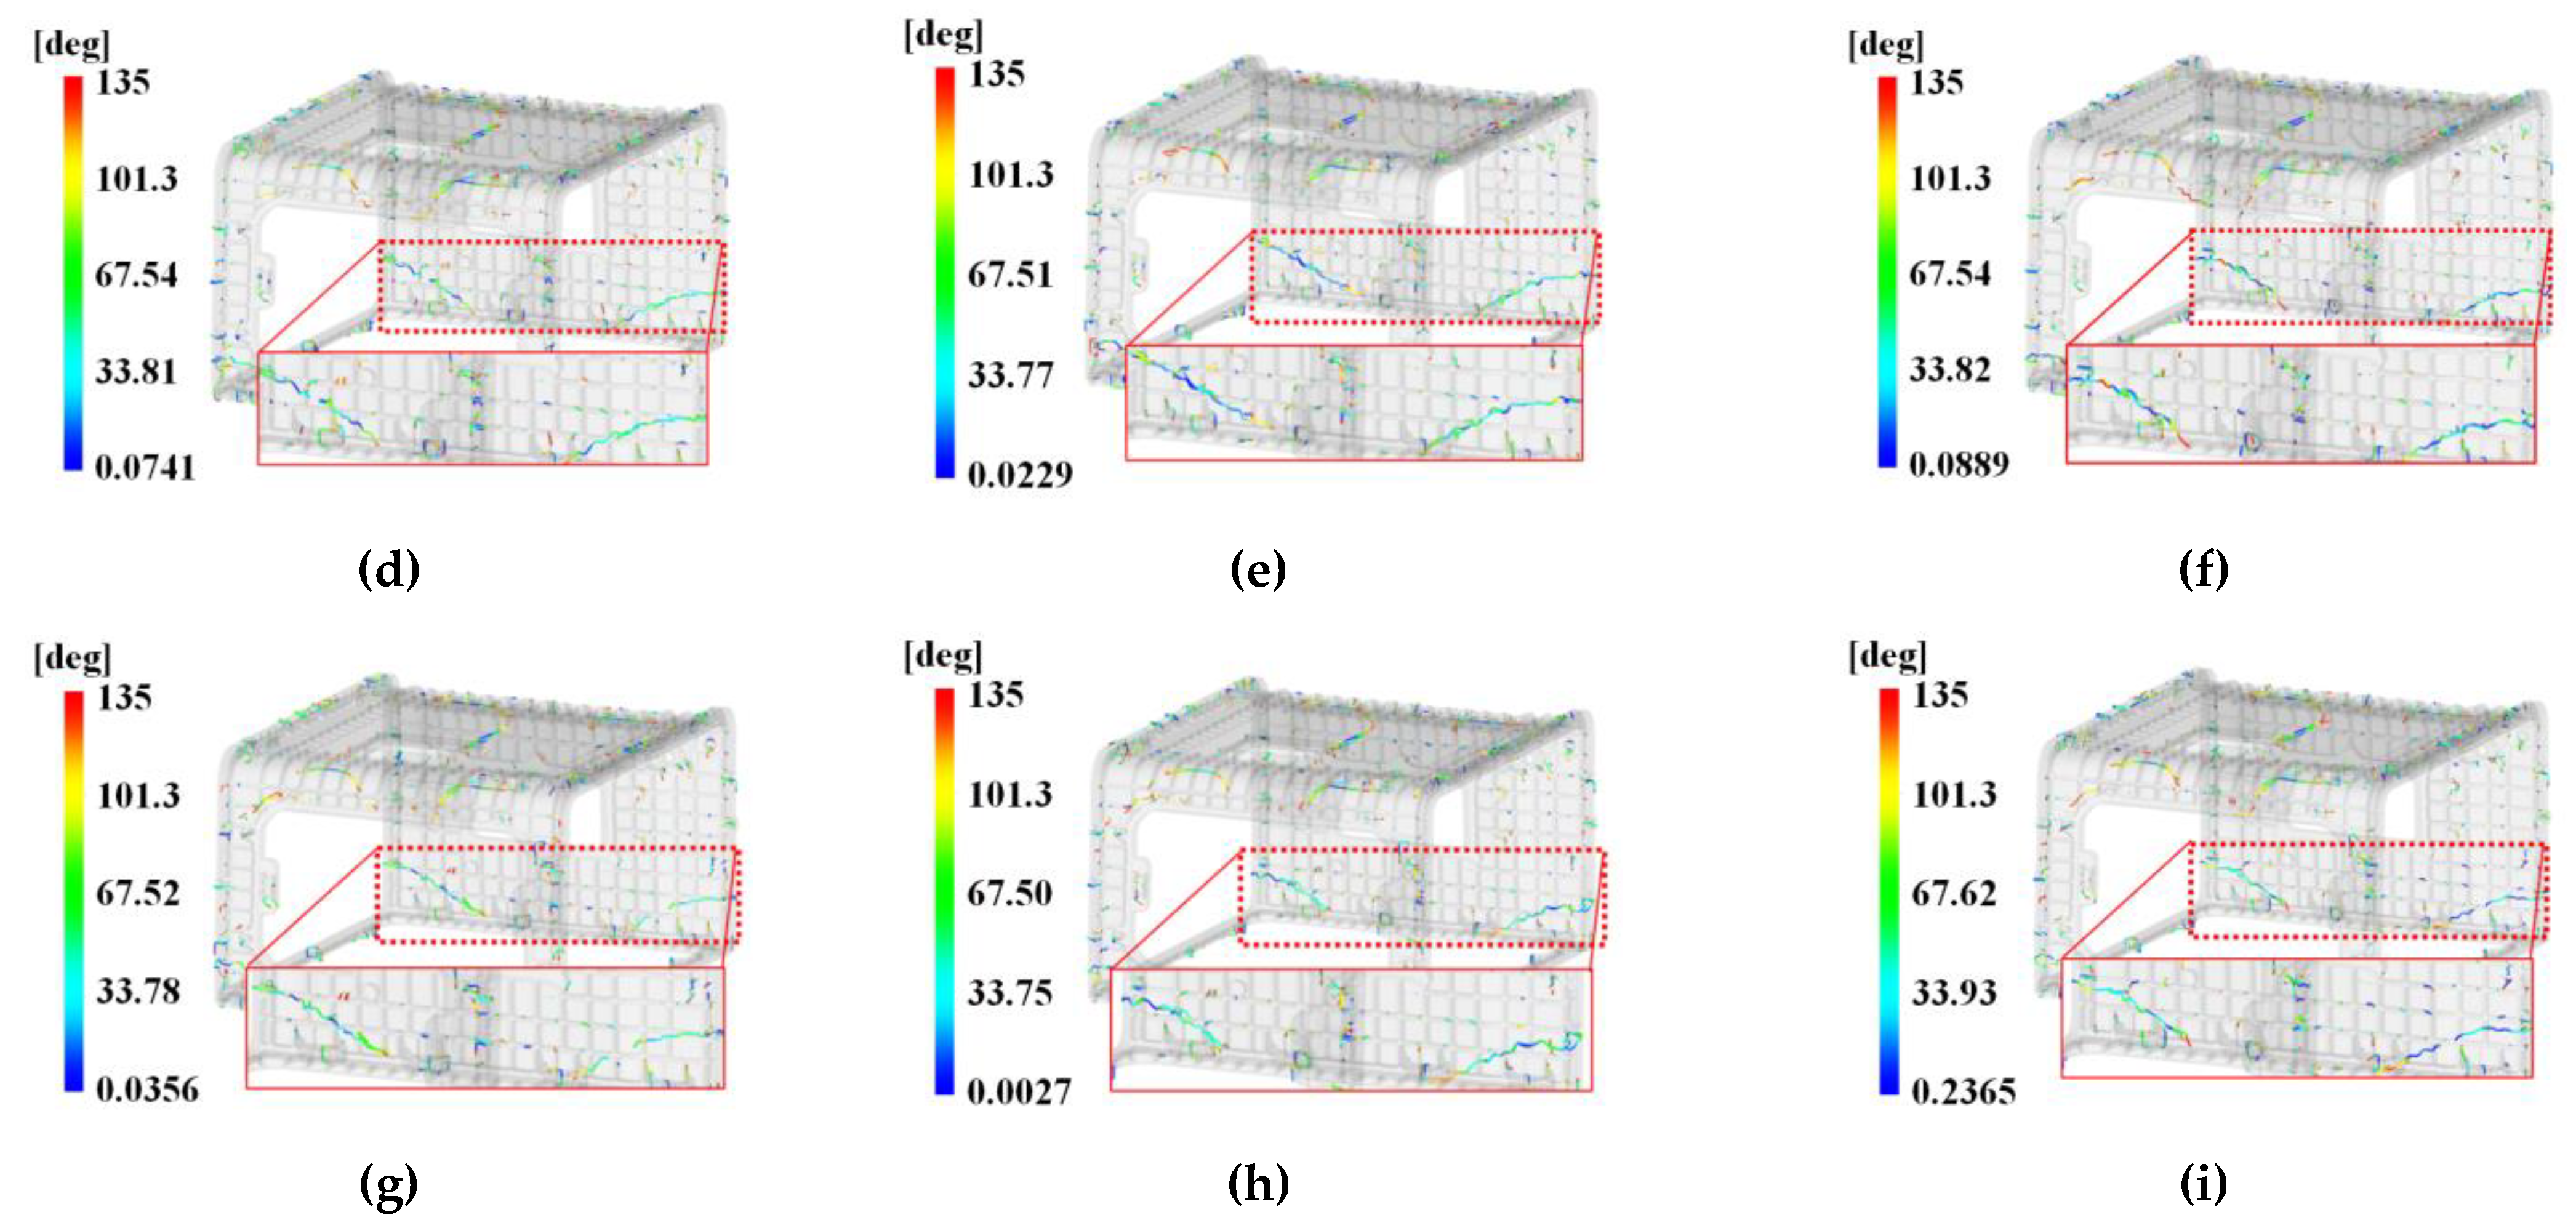
Figure 24.
Weld line results specifically analyzed for face C with DOE. (a) Case 1; (b) Case 2; (c) Case 3; (d) Case 4; (e) Case 5; (f) Case 6; (g) Case 7; (h) Case 8; (i) Case 9.
Figure 24.
Weld line results specifically analyzed for face C with DOE. (a) Case 1; (b) Case 2; (c) Case 3; (d) Case 4; (e) Case 5; (f) Case 6; (g) Case 7; (h) Case 8; (i) Case 9.
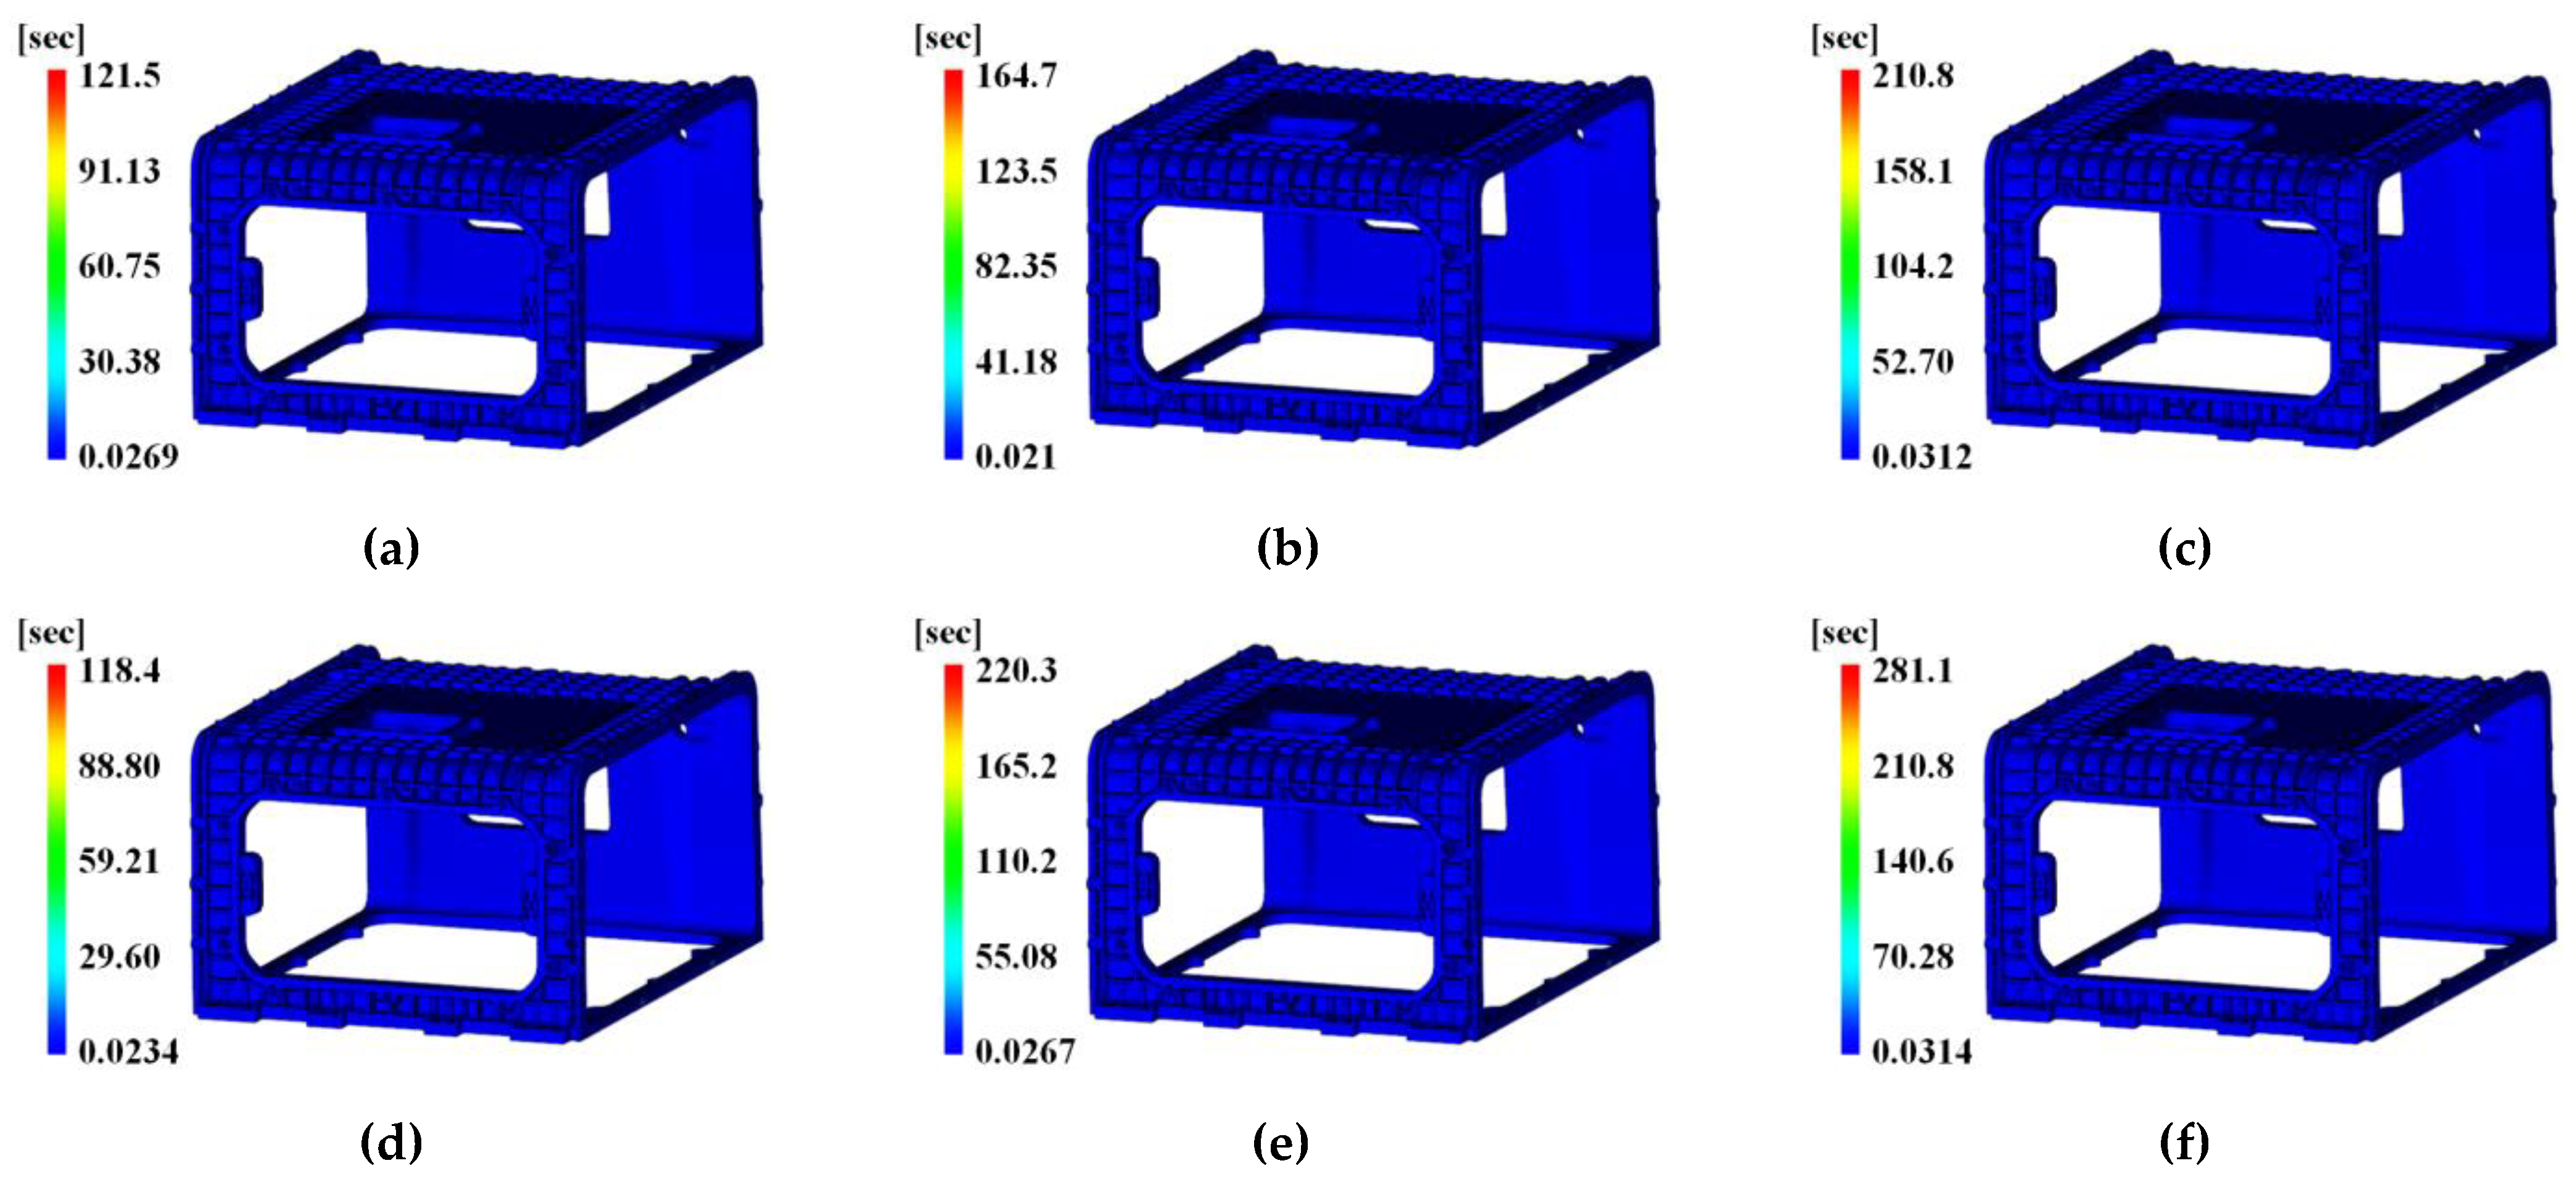
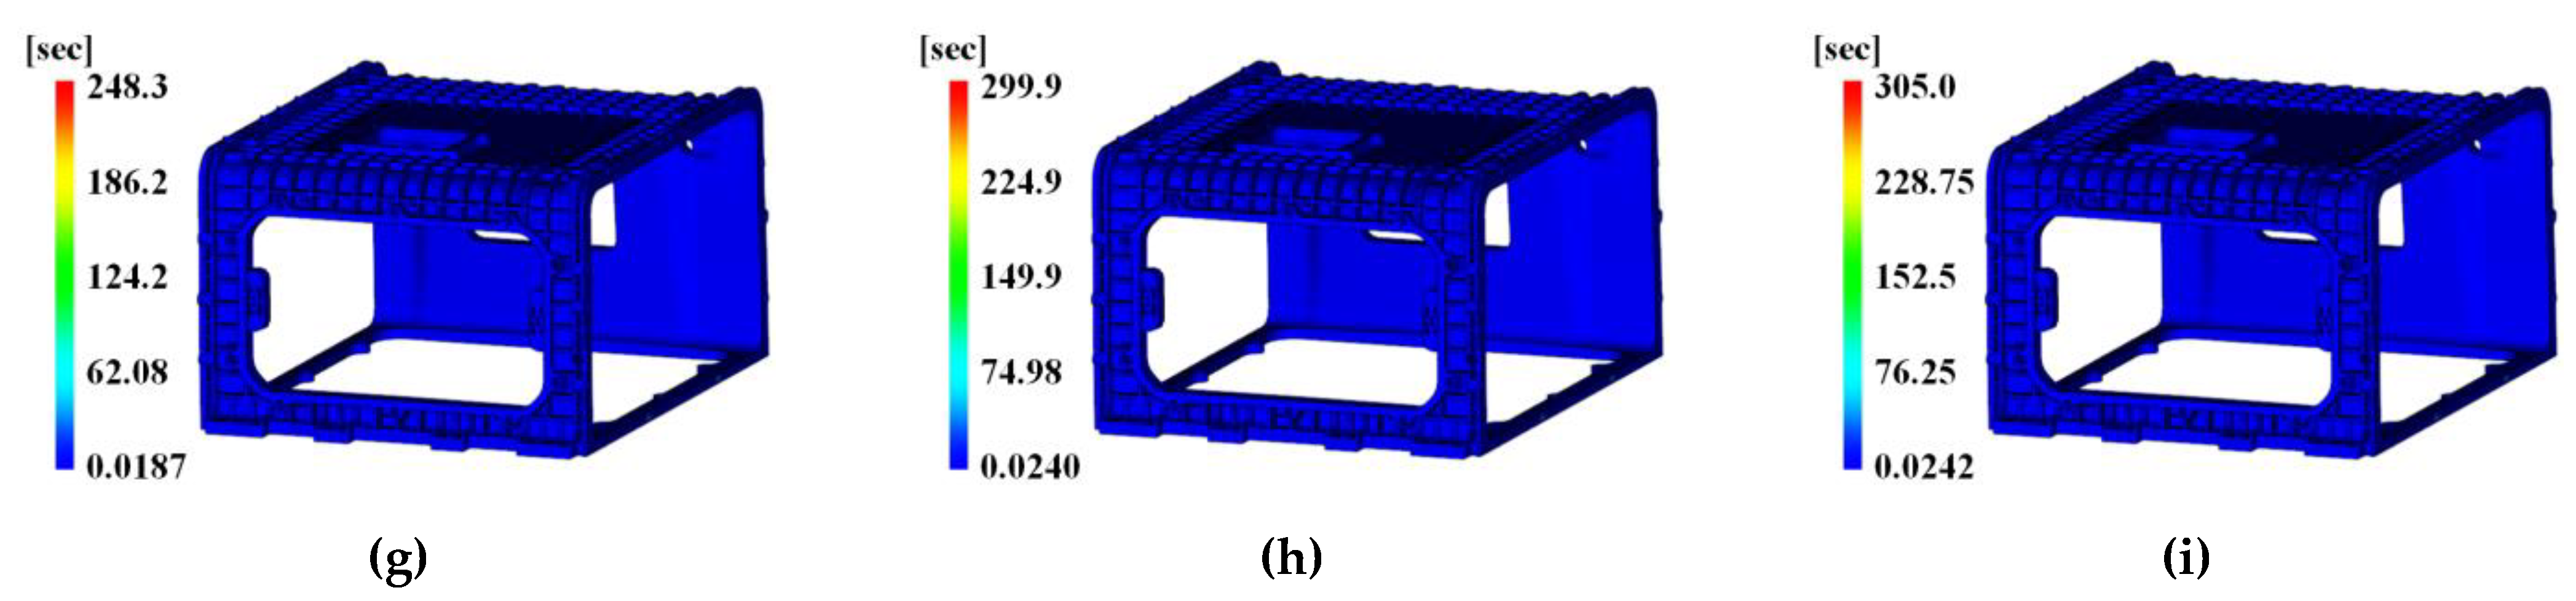
Figure 25.
Time to reach ejection temperature results with DOE simulation number. (a) Case 1; (b) Case 2; (c) Case 3; (d) Case 4; (e) Case 5; (f) Case 6; (g) Case 7; (h) Case 8; (i) Case 9; the earliest time is represented on the surface.
Figure 25.
Time to reach ejection temperature results with DOE simulation number. (a) Case 1; (b) Case 2; (c) Case 3; (d) Case 4; (e) Case 5; (f) Case 6; (g) Case 7; (h) Case 8; (i) Case 9; the earliest time is represented on the surface.
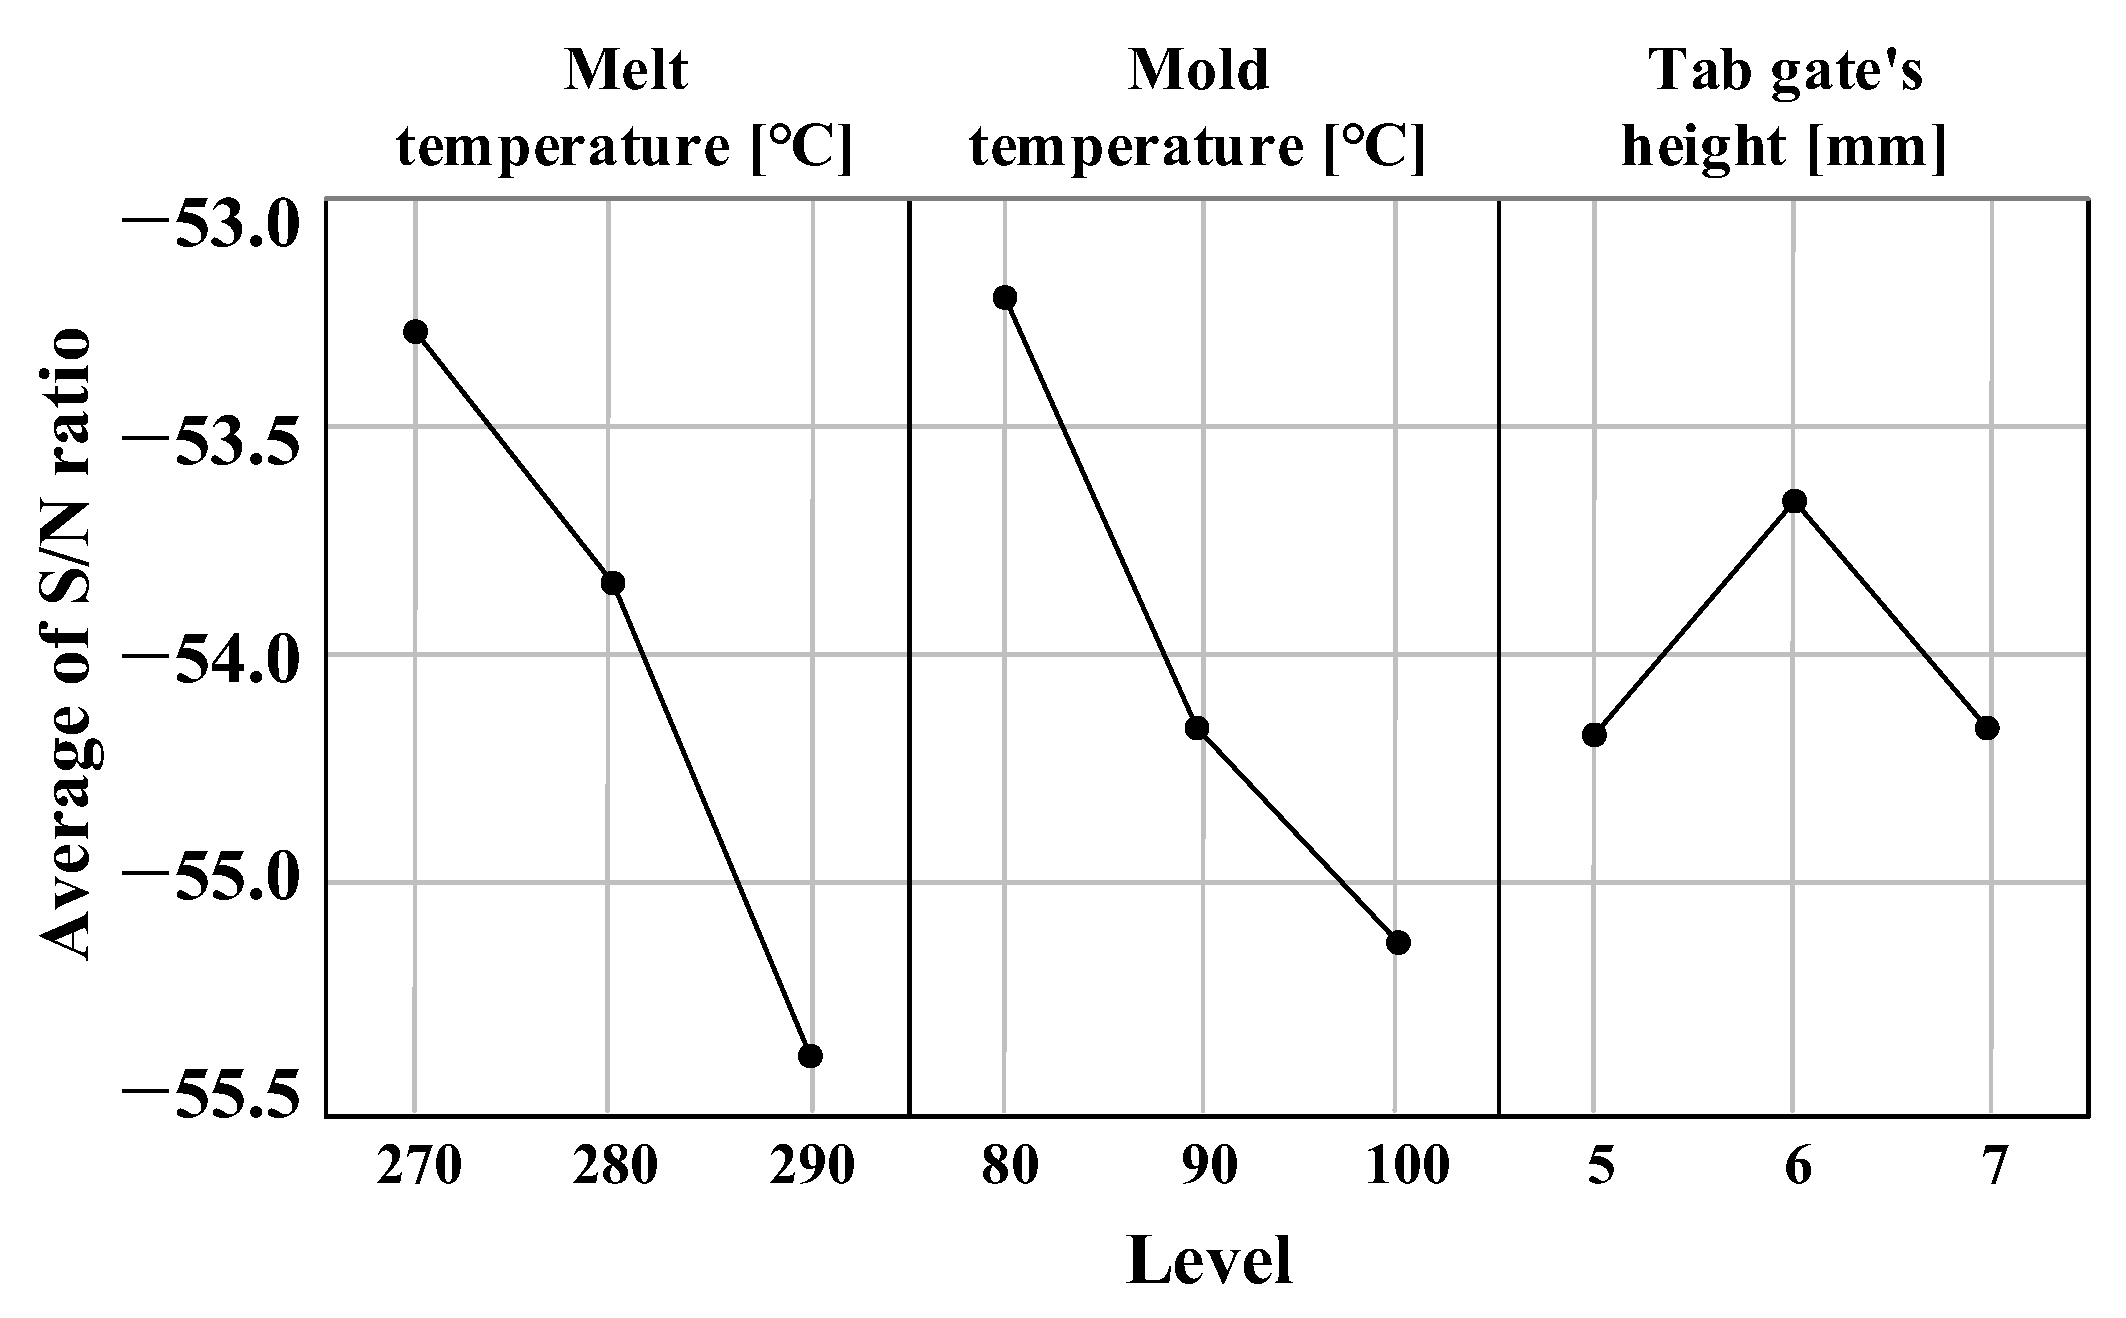
Figure 26.
Average S/N ratio of control factor represented by graph.
Figure 26.
Average S/N ratio of control factor represented by graph.
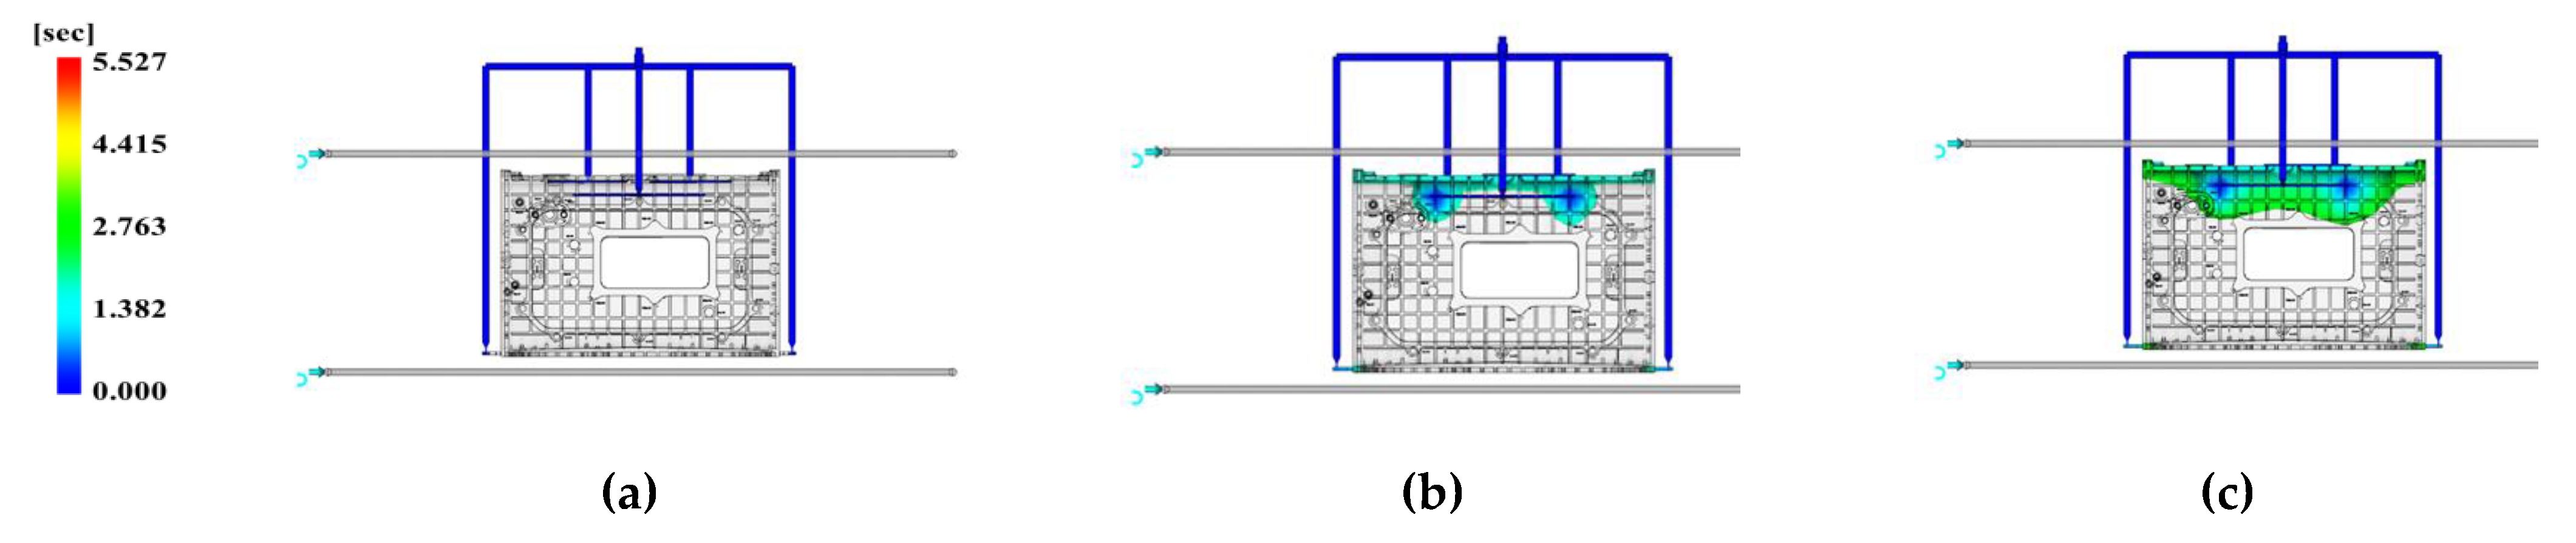
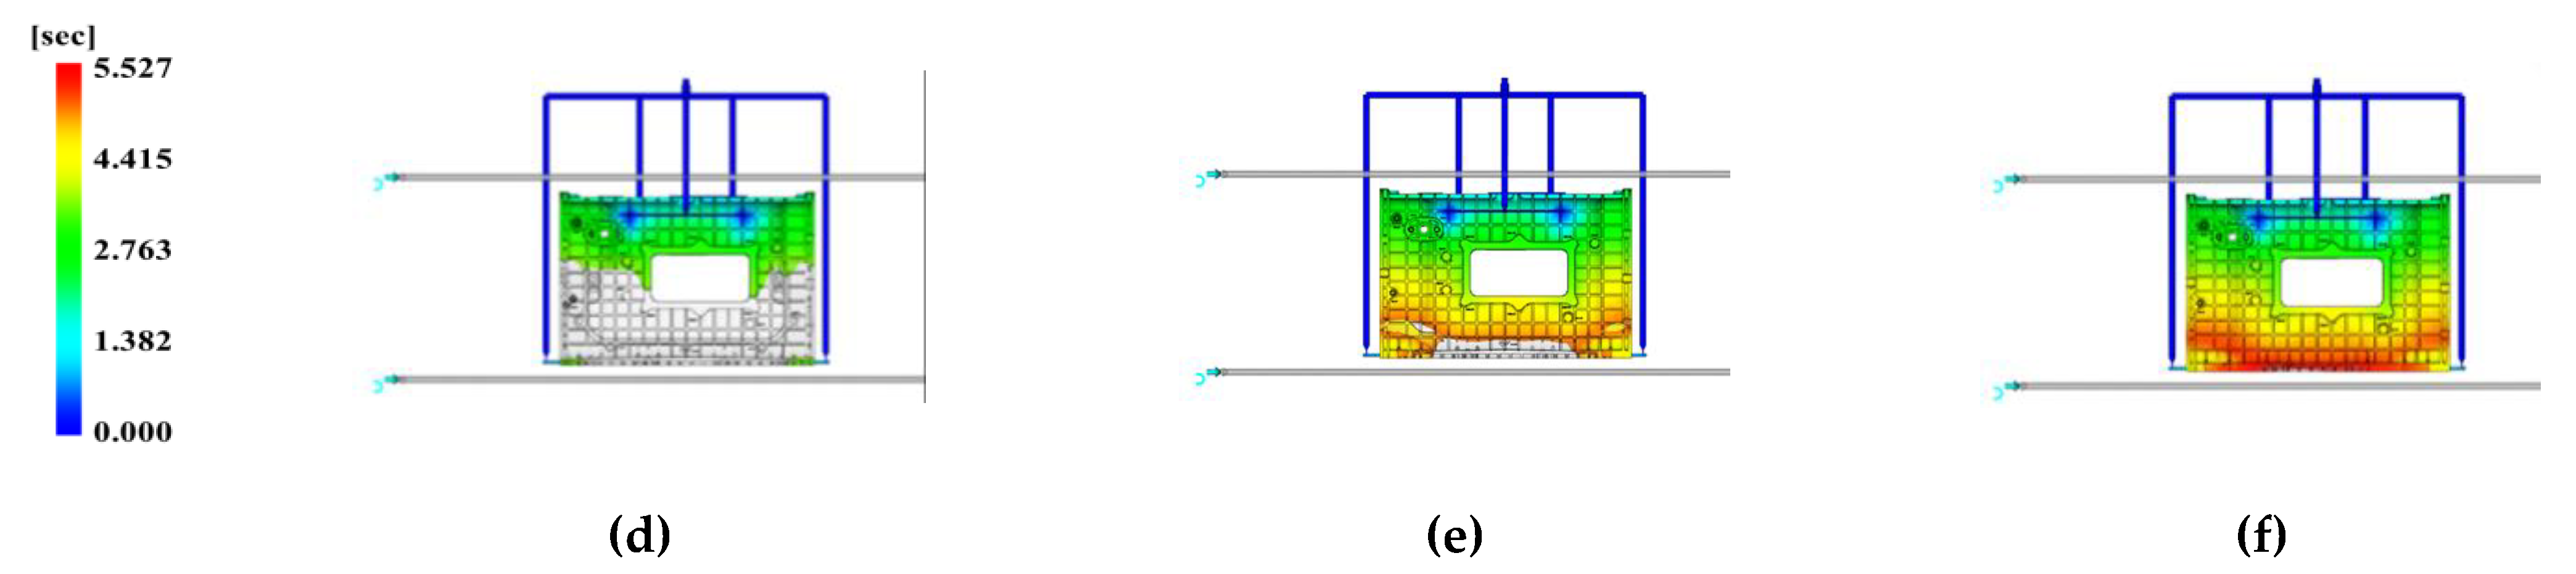
Figure 27.
Filling time represented on the viewpoint of Face C. Time of (a) 0.2303 s; (b) 1.151 s; (c) 2.994 s; (d) 3.6884 s; (e) 5.066 s; (f) 5.527 s.
Figure 27.
Filling time represented on the viewpoint of Face C. Time of (a) 0.2303 s; (b) 1.151 s; (c) 2.994 s; (d) 3.6884 s; (e) 5.066 s; (f) 5.527 s.
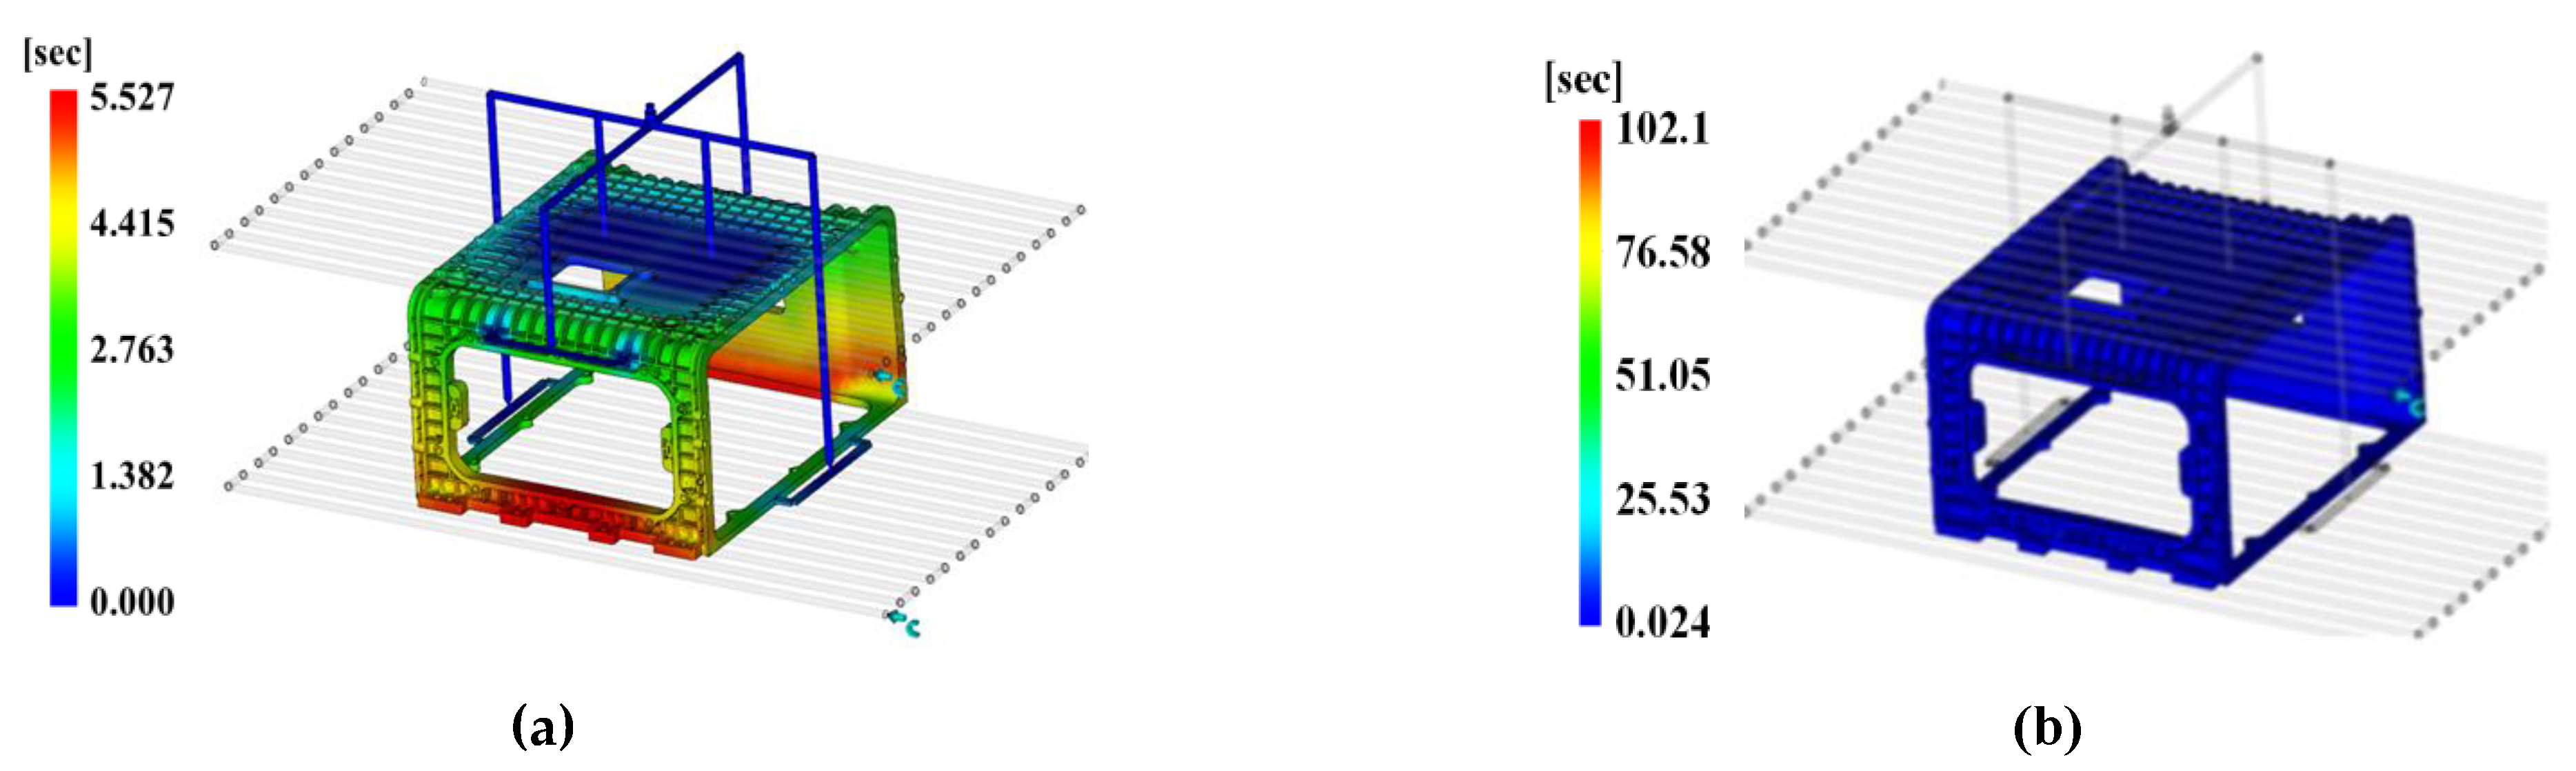
Figure 28.
Total cycle time. (a) Injection time; (b) time to reach ejection temperature.
Figure 28.
Total cycle time. (a) Injection time; (b) time to reach ejection temperature.
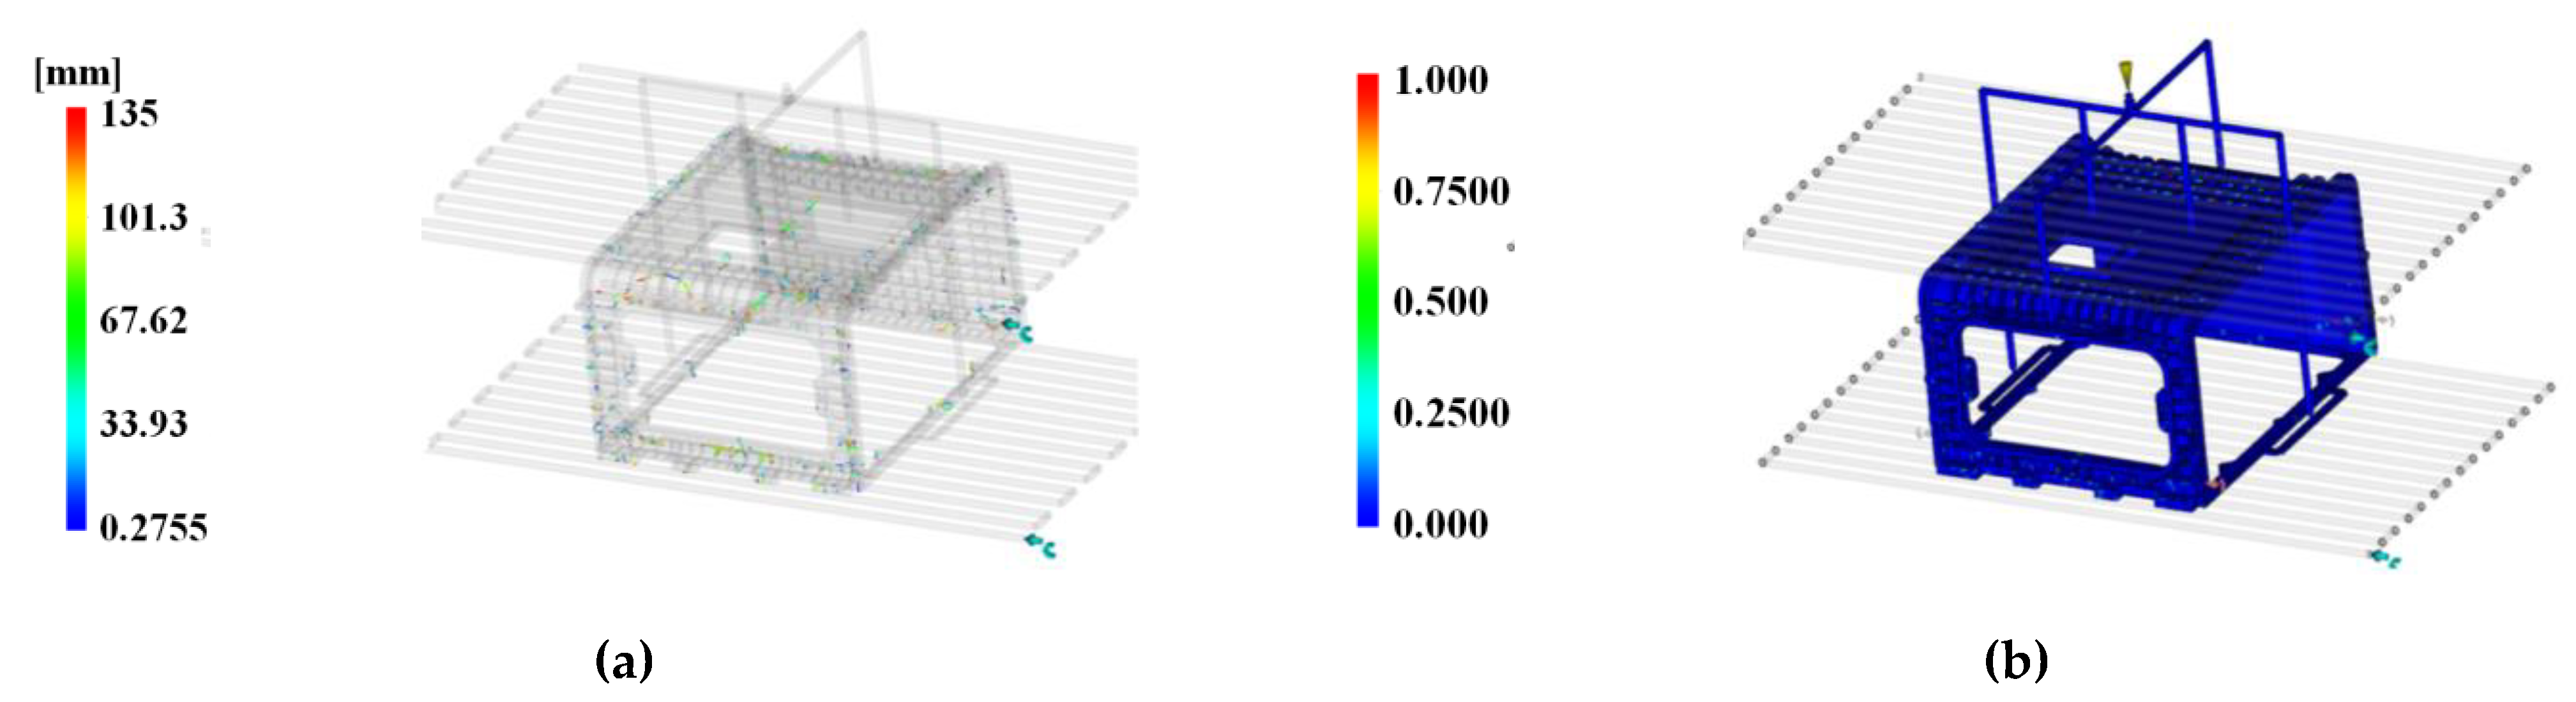
Figure 29.
Defect results. (a) Weld line; (b) air trap.
Figure 29.
Defect results. (a) Weld line; (b) air trap.
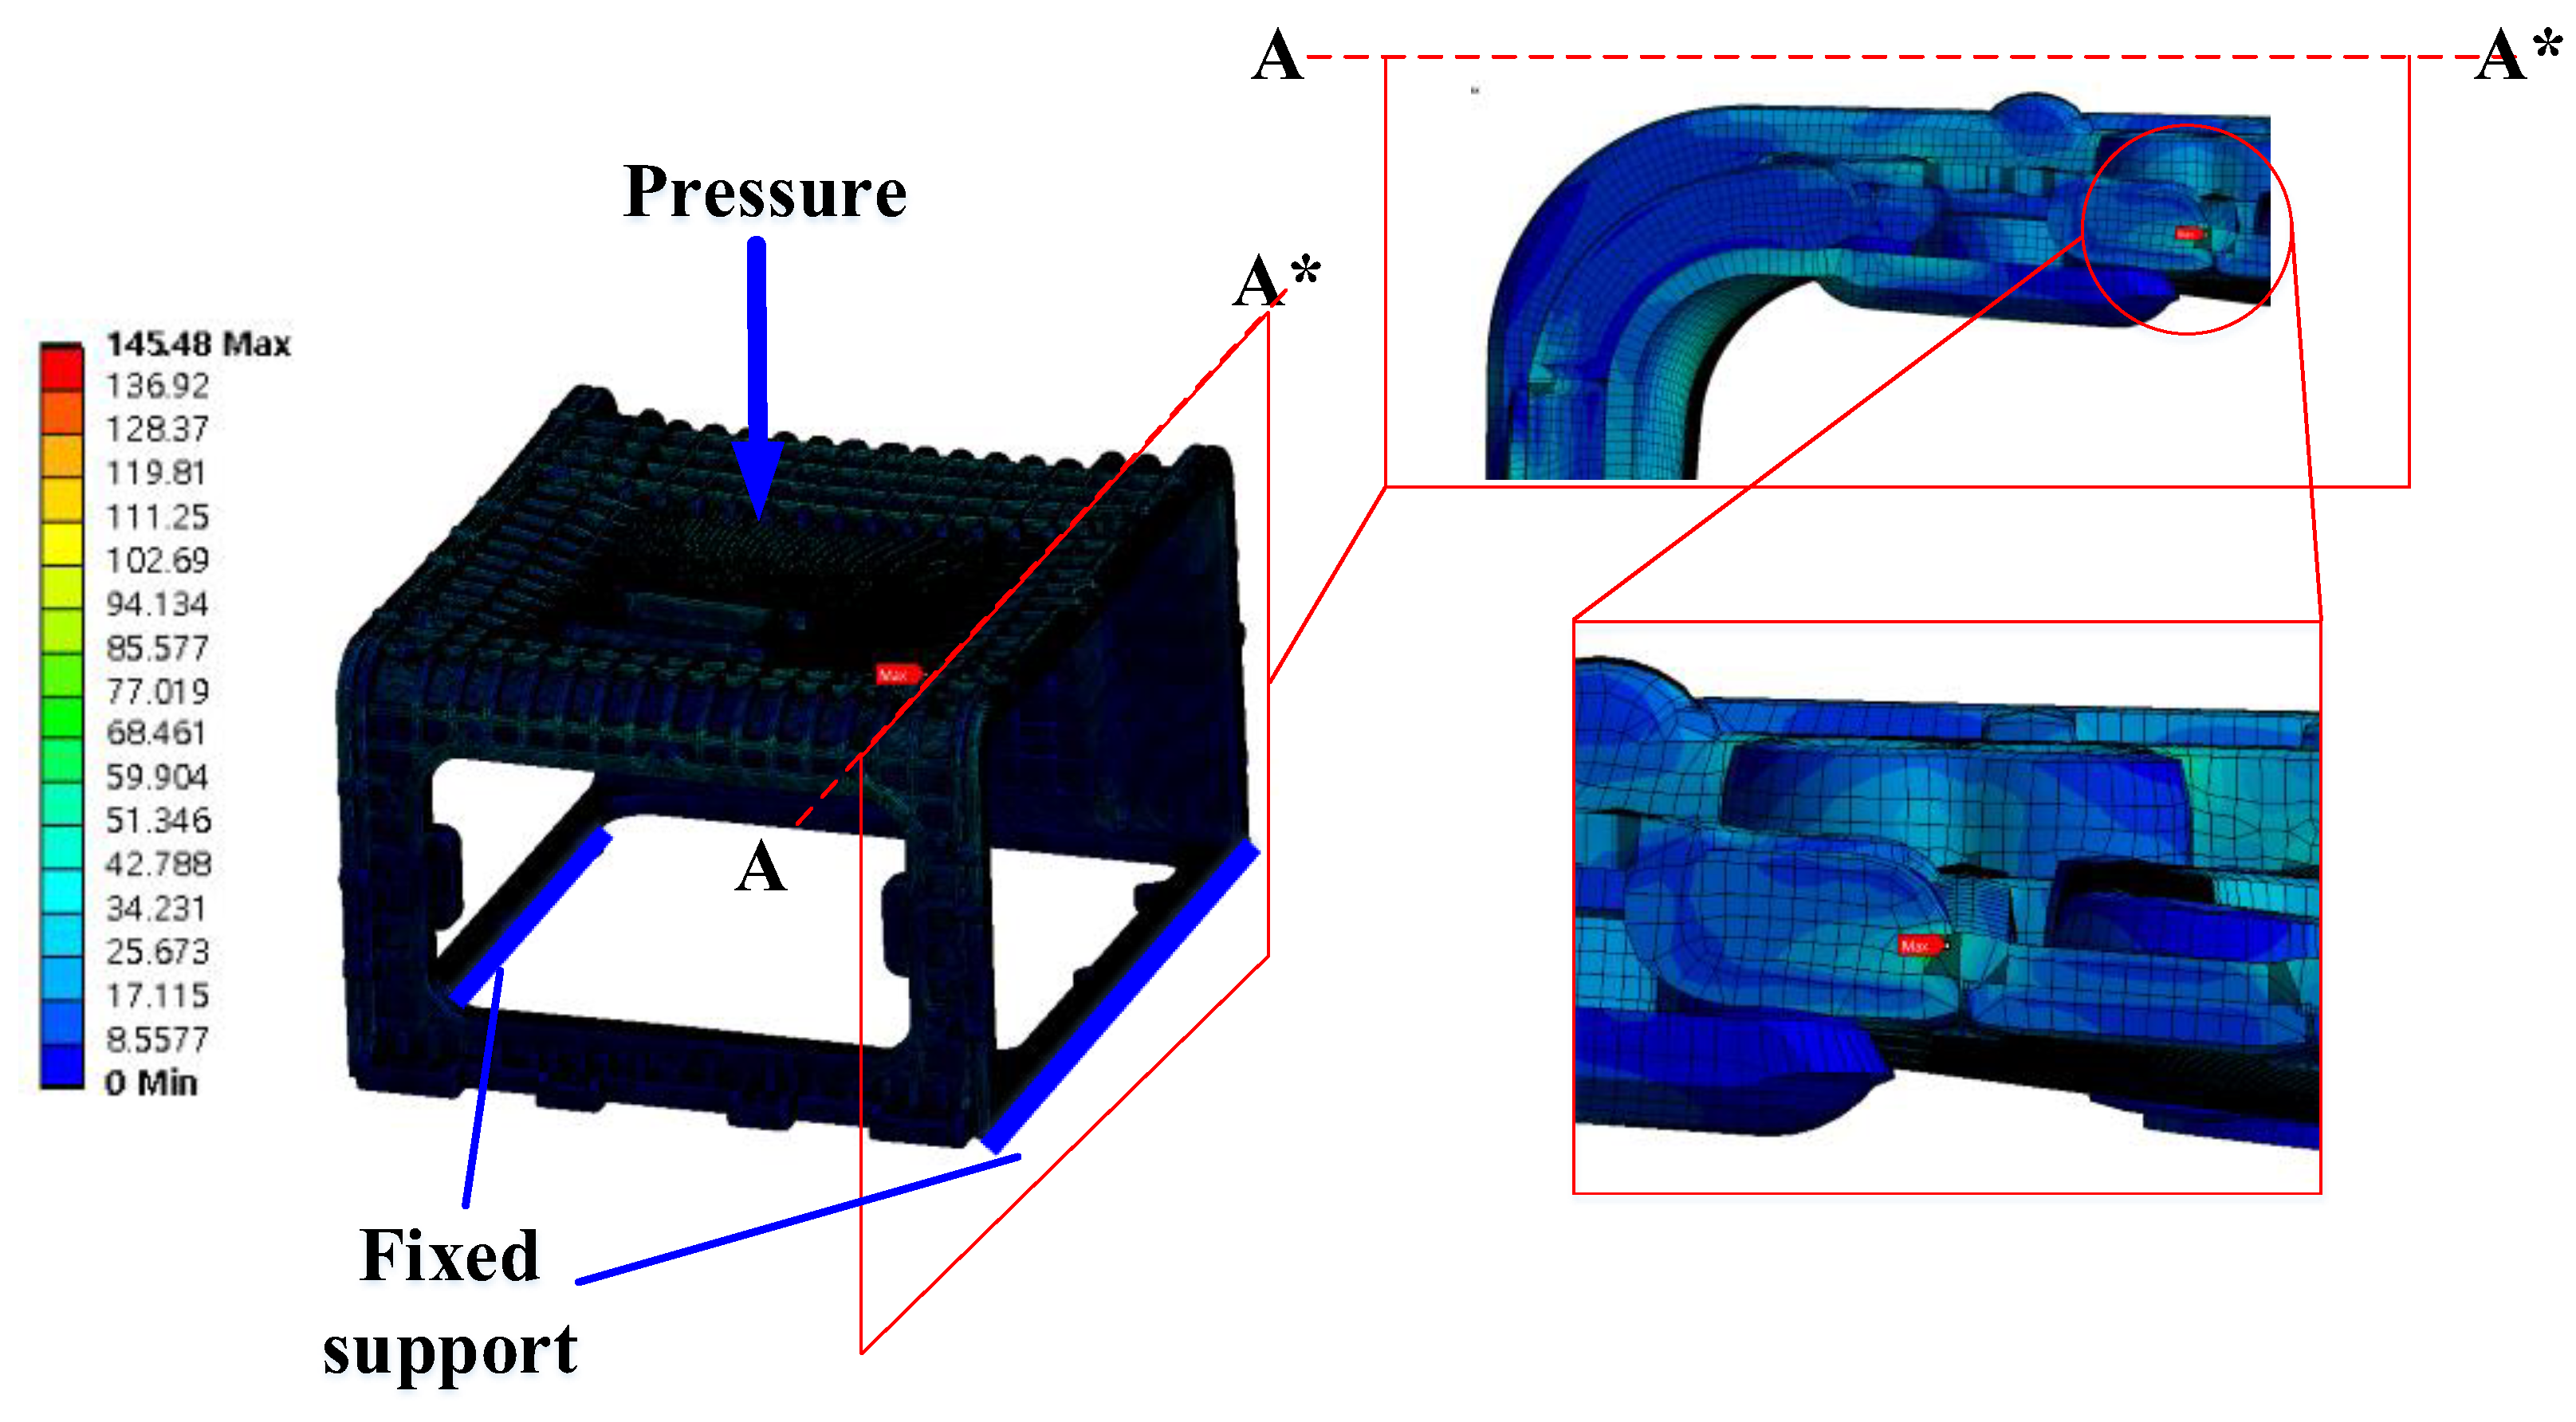
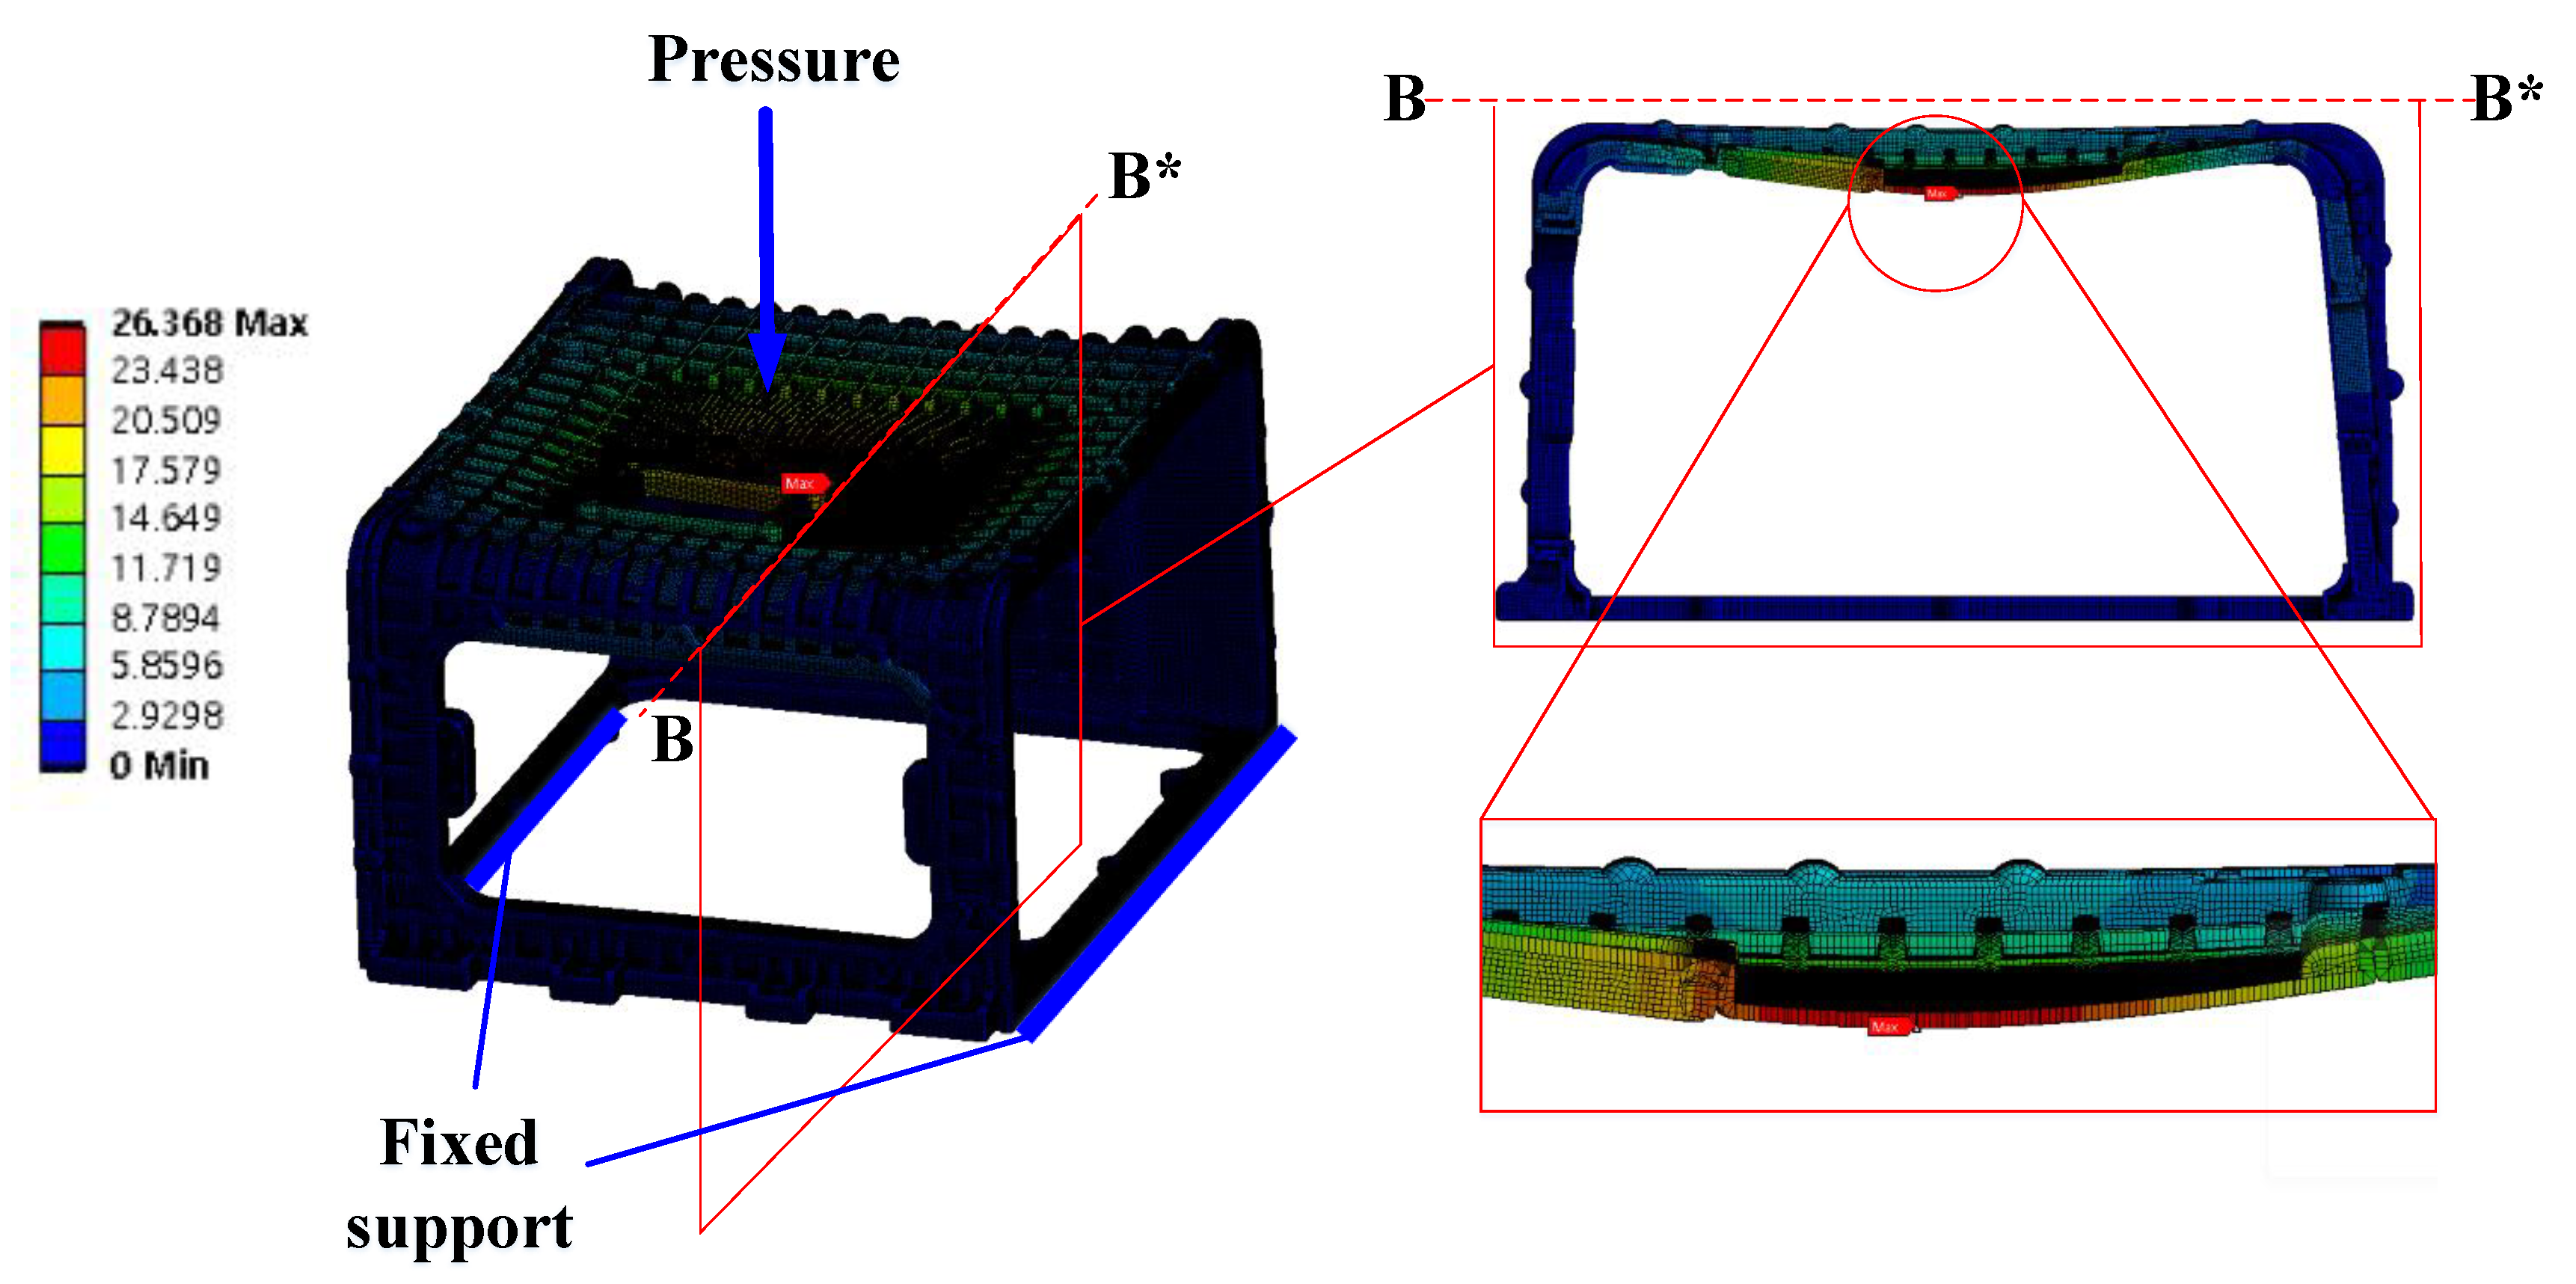
Figure 30.
Equivalent stress results. Maximum point.
Figure 30.
Equivalent stress results. Maximum point.
Figure 31.
Deformation results. Maximum point in side view.
Figure 31.
Deformation results. Maximum point in side view.
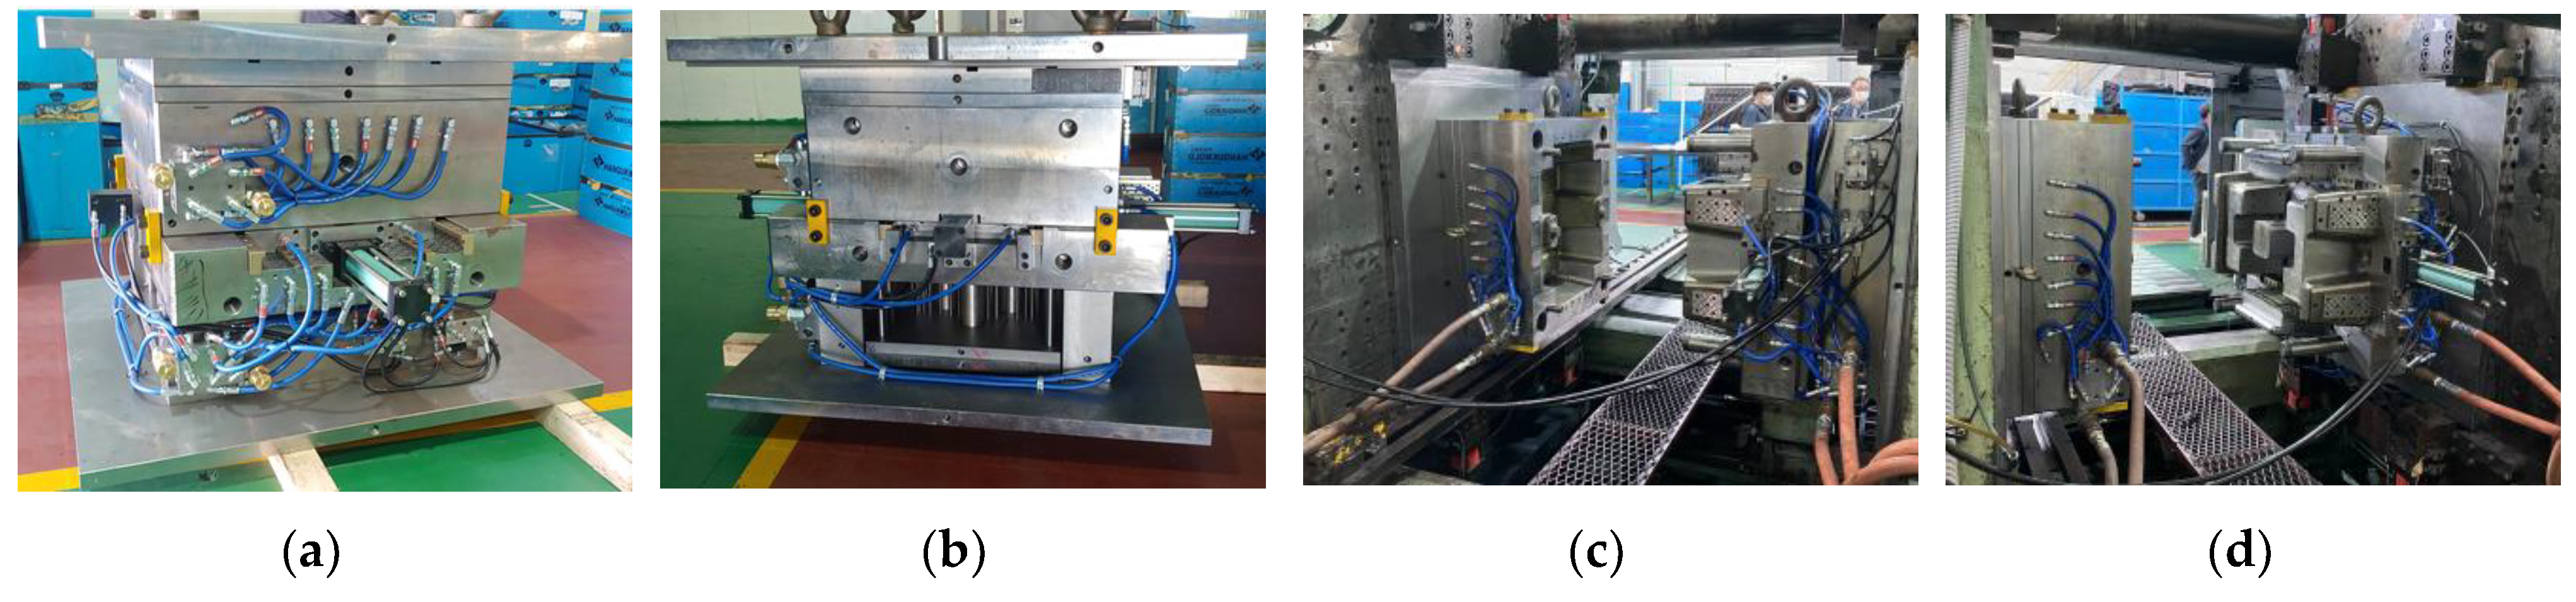
Figure 32.
Mold of the stack enclosure. (a) Closed mold by side 1; (b) closed mold by side 2; (c) mounted on the injection machine; (d) mounted on the injection machine on the other side view.
Figure 32.
Mold of the stack enclosure. (a) Closed mold by side 1; (b) closed mold by side 2; (c) mounted on the injection machine; (d) mounted on the injection machine on the other side view.
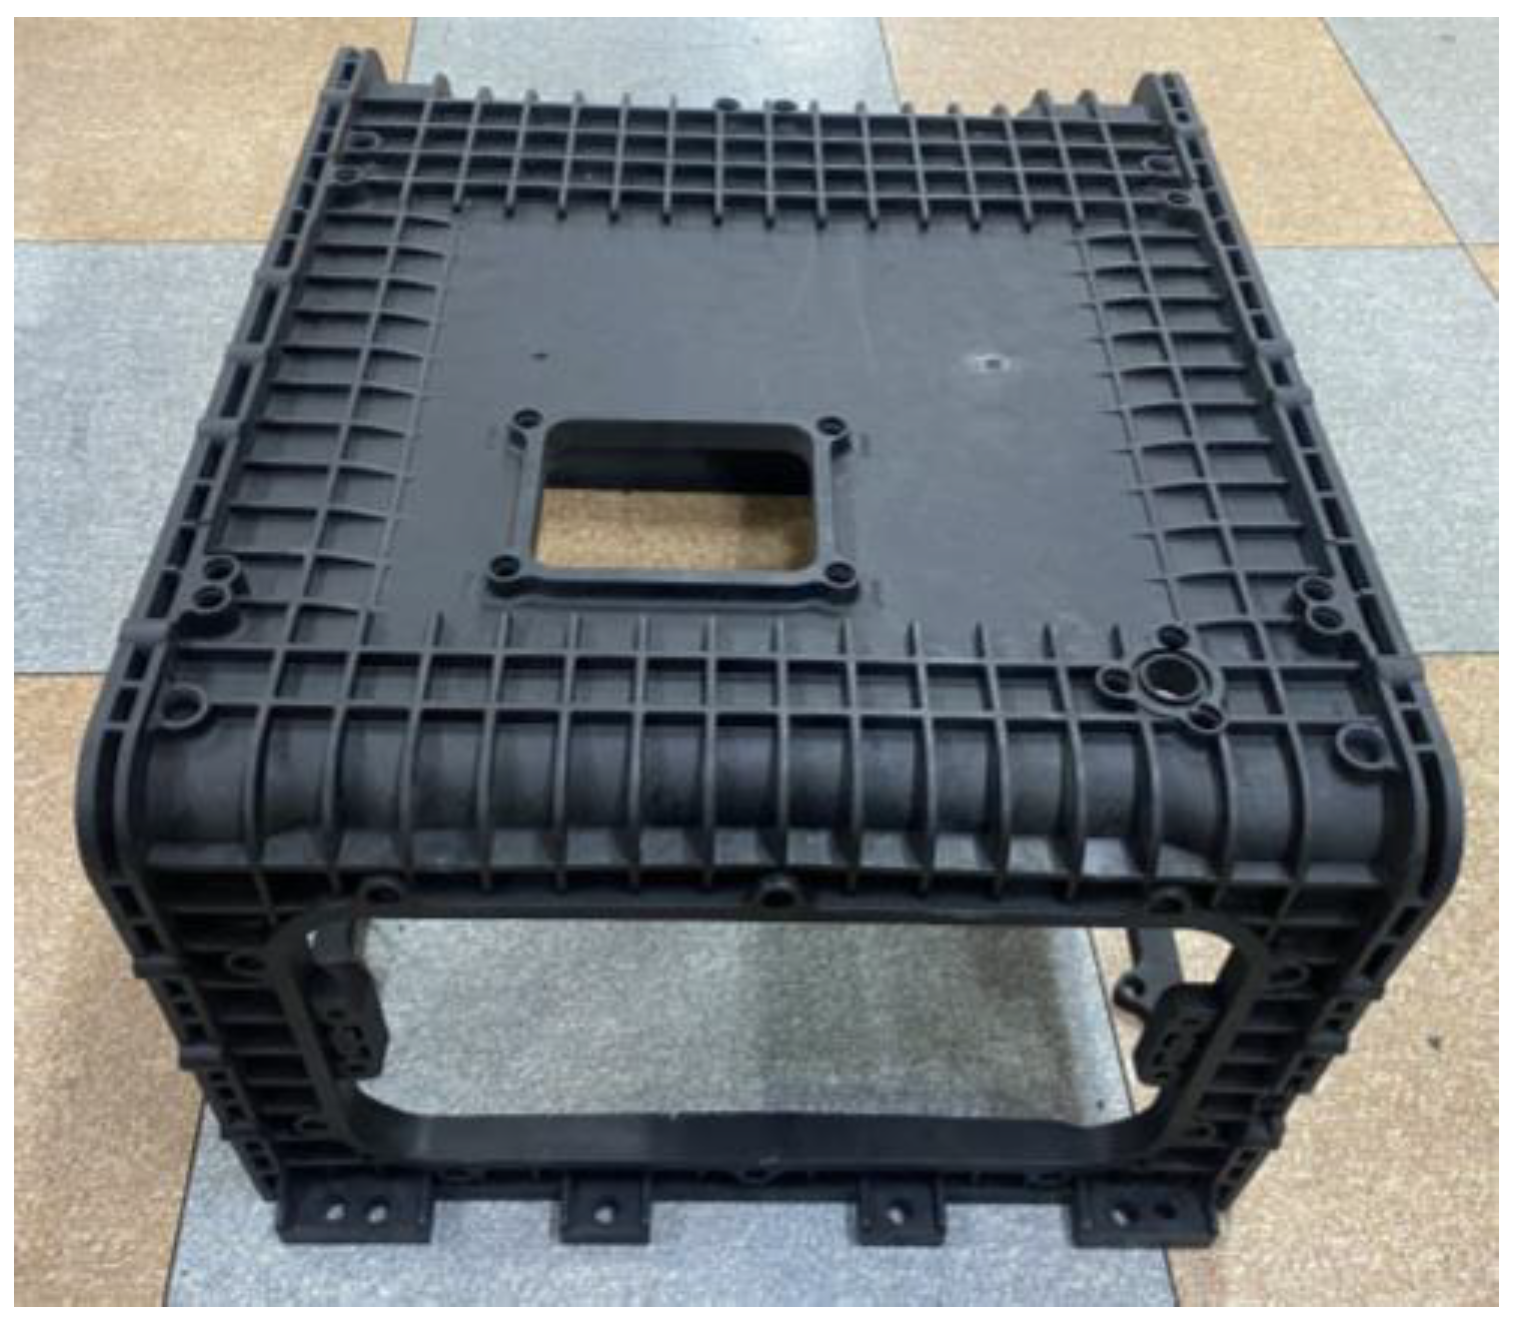
Figure 33.
The prototype of the stack enclosure.
Figure 33.
The prototype of the stack enclosure.
Table 1.
Runner system size. Pin-point gate’s diameter, tab gate size, and runner size.
Table 1.
Runner system size. Pin-point gate’s diameter, tab gate size, and runner size.
| Description | Value |
|---|
| Pin-Point Gate’s Diameter [mm] | Undetermined (1.5, 2, 2.5, 3) |
|---|
Tab gate [mm],
upside | Height | 3 |
| Width | 12 (runner size) |
| Length | 18 (width × 1.5) |
Tab gate [mm],
downside | Height | 5 |
| Width | 16 (runner size) |
| Length | 24 (width × 1.5) |
| Runner [mm] | Length | 180 ~ 488 |
| Diameter | 12 (upside), 16 (downside) |
Table 2.
Universal testing machine specification.
Table 2.
Universal testing machine specification.
| Description | Value |
|---|
| Force capacity | 10 kN |
| Crosshead travel | 1172 mm |
| Vertical test space | 1242 mm |
| Horizontal test space | 420 mm |
| Maximum speed | 508 mm/min |
| Minimum speed | 0.05 mm/min |
| Maximum return speed | 610 mm/min |
| Footprint dimensions (h×w×d) | 1610 × 760 × 710 mm |
| Position control resolution | 9.9 mm |
| Frame axial stiffness | 38 kN/mm |
| Maximum force at full speed | 10 kN |
| Maximum speed at full force | 508 mm/min |
| Weight | 122 kg |
| Maximum power requirement | 730 VA |
Table 3.
Tensile strength test specimen specification.
Table 3.
Tensile strength test specimen specification.
| Specimen Shape | Description | Value |
|---|
![Polymers 15 01303 i001]() | Length | 80 mm |
| Width | 10 mm |
| Thickness | 4 mm |
| Notch angle | 45° |
| Notch radius | 0.25 mm |
Table 4.
Tensile strength test results.
Table 4.
Tensile strength test results.
| Description | mPPO (Non-Reinforced) | mPPO (GF-Reinforced) |
|---|
| Poisson’s rate | 0.37 | 0.38 |
| Young’s modulus | 2650 MPa ± 21 | 8845 MPa ± 32 |
| Yield strength (0.2% offset) | 5.344 MPa ± 0.76 | 17.883 MPa ± 0.97 |
| Ultimate strength | 64 MPa ± 3 | 146.7 MPa ± 6 |
Table 5.
Thermal melting analyzer specification.
Table 5.
Thermal melting analyzer specification.
| Description | Value |
|---|
| Thermal range | 90~800 °C |
| Temperature programmer | 0.1~60 °C/min |
| Isothermal Stability | ±0.4 °C |
| Maximum sample size | up to 10 mm (in length) |
| Furnace Winding | Ni-chrome |
| Furnace movement | by electric motor |
Table 6.
Coefficient of thermal expansion from 20 to 165 °C test.
Table 6.
Coefficient of thermal expansion from 20 to 165 °C test.
| mPPO | Coefficient (1 µmm/m °C) |
|---|
| Horizontal | Vertical |
|---|
| Non-reinforced | 121.369 ± 3.019 | 103.951 ± 3.112 |
| GF-reinforced | 31.717 ± 1.88 | 97.183 ± 1.76 |
Table 7.
Rheograph specification.
Table 7.
Rheograph specification.
| Description | Value |
|---|
| Temperature | up to 400 °C |
| Speed | up to 40 mm/s |
| Press | up to 1000 bar |
| Drop height | 0.61 m |
| Impact velocity | 3.46 m/s |
| Dimensions (width*depth*height) | 660380840 mm |
| Weight | 110 kg |
Table 8.
The mPPO (non-reinforced) 2-domain modified Tait pvT model coefficients.
Table 8.
The mPPO (non-reinforced) 2-domain modified Tait pvT model coefficients.
| Coefficients | Unit | Value | Coefficients | Unit | Value |
|---|
| b5 | K | 536.15 | b1s | m3/kg | 0.0009874 |
| b6 | K/Pa | | b2s | m3/kg·K | |
| b1m | m3/kg | 0.001025 | b3s | Pa | |
| b2m | m3/kg·K | | b4s | 1/K | 0.014524 |
| b3m | Pa | | b7 | m3/kg | |
| b4m | 1/K | 0.00 | b8 | 1/Pa | 0.04248 |
| | | | b9 | 1/Pa | |
Table 9.
The mPPO (GF-reinforced) 2-domain modified Tait pvT model coefficients.
Table 9.
The mPPO (GF-reinforced) 2-domain modified Tait pvT model coefficients.
| Coefficients | Unit | Value | Coefficients | Unit | Value |
|---|
| b5 | K | 518.15 | b1s | m3/kg | 0.001570 |
| b6 | K/Pa | | b2s | m3/kg·K | |
| b1m | m3/kg | 0.001125 | b3s | Pa | |
| b2m | m3/kg·K | | b4s | 1/K | 0.01680 |
| b3m | Pa | | b7 | m3/kg | |
| b4m | 1/K | 0.001136 | b8 | 1/Pa | 0.04124 |
| | | | b9 | 1/Pa | |
Table 10.
The mPPO (non-reinforced) Cross-WLF viscosity model coefficients.
Table 10.
The mPPO (non-reinforced) Cross-WLF viscosity model coefficients.
| Coefficients | Unit | Value |
|---|
| n | - | 0.2816 |
| * | Pa | |
| D1 | Pa-s | |
| D2 | K | 413.15 |
| D3 | K/Pa | 0 |
| A1 | - | 48.65 |
| A2 | K | 51.6 |
Table 11.
The mPPO (GF-reinforced) Cross-WLF viscosity model coefficients.
Table 11.
The mPPO (GF-reinforced) Cross-WLF viscosity model coefficients.
| Coefficients | Unit | Value |
|---|
| n | - | 0.2168 |
| * | Pa | |
| D1 | Pa-s | |
| D2 | K | 408.15 |
| D3 | K/Pa | 0 |
| A1 | - | 48.65 |
| A2 | K | 51.6 |
Table 12.
Differential scanning calorimetry specification.
Table 12.
Differential scanning calorimetry specification.
| Description | Value |
|---|
| Temperature range | Room temperature ~725 °C |
| Temperature accuracy | ±0.1 °C |
| Temperature precision | ±0.05 °C |
| Flow accuracy | 1.0% |
Table 13.
Melt temperature results.
Table 13.
Melt temperature results.
| Description | mPPO (Non-Reinforced) | mPPO (GF-Reinforced) |
|---|
| Melt temperature [°C] | 263.12 ± 2.57 | 259.64 ± 1.02 |
Table 14.
Thermal conductivity analyzer specification.
Table 14.
Thermal conductivity analyzer specification.
| Description | Value |
|---|
| Temperature range | −100~500 °C |
| Maximum output | 10 J/pulse |
| Thermal diffusivity measurement range | 0.01~1000 mm2/s |
| Thermal conductivity measurement range | 0.01~2000 W/mK |
Table 15.
Specimen for thermal conductivity test.
Table 15.
Specimen for thermal conductivity test.
| Transverse | Length | Thickness |
|---|
| 10 mm | 10 mm | 1 mm |
Table 16.
Specimen for thermal conductivity test.
Table 16.
Specimen for thermal conductivity test.
| Description | Mechanical Property | pvT | Viscosity | Tm |
|---|
| Value | Poisson’s rate | 0.38 | b5 | 518.15 K | b1s | 0.001570 m3/kg | n | 0.2168 | 260 °C |
| Young’s modulus | 8845 MPa | b6 | K/Pa | b2s |
m3/kg·K | * | Pa |
| Yield strength | 17.88 MPa | b1m | 0.001125 m3/kg | b3s |
Pa | D1 | Pa-s |
| Ultimate strength | 146.7 MPa | b2m | m3/kg·K | b4s | 0.01680
1/K | D2 | 408.15 K |
| CTE | 0.38 µmm/m °C | b3m | Pa | b7 | m3/kg | D3 | 0 K/Pa |
| | | b4m | 0.001136
1/K | b8 | 0.04124
1/Pa | A1 | 48.65 |
| | | | | b9 |
1/Pa | A2 | 51.6 K |
Table 17.
Runner system size determined by injection mold analysis results.
Table 17.
Runner system size determined by injection mold analysis results.
| Description | Value |
|---|
Pin-point gate’s
diameter [mm] | Upside | 3 |
| Downside | 3 (with non-tapered shape) |
Tab gate [mm],
upside | Height | 3 |
| Width | 12 (runner size) |
| Length | 18 (width×1.5) |
Tab gate [mm],
downside | Height | 5 (undetermined) |
| Width | 16 (runner size) |
| Length | 24 (width×1.5) |
| Runner [mm] | length | 180~488 |
| diameter | 12 (upside), 16 (downside) |
Table 18.
Design of control factor and level for Taguchi experimental method.
Table 18.
Design of control factor and level for Taguchi experimental method.
| Factor | Description | Level |
|---|
| 1 | 2 | 3 |
|---|
| A | Melt temperature [°C] | 270 | 280 | 290 |
| B | Mold temperature [°C] | 80 | 90 | 100 |
| C | Tab gate’s height [mm], downside | 5 | 6 | 7 |
Table 19.
L9(33) orthogonal array with melt temperature (A), mold temperature (B), and tab gate’s height (C).
Table 19.
L9(33) orthogonal array with melt temperature (A), mold temperature (B), and tab gate’s height (C).
| Simulation No. | A | B | C |
|---|
| 1 | 1 | 1 | 1 |
| 2 | 1 | 2 | 2 |
| 3 | 1 | 3 | 3 |
| 4 | 2 | 1 | 2 |
| 5 | 2 | 2 | 3 |
| 6 | 2 | 3 | 1 |
| 7 | 3 | 1 | 3 |
| 8 | 3 | 2 | 1 |
| 9 | 3 | 3 | 2 |
| | (1) | | |
Table 20.
Conditions of injection molding except for control factors.
Table 20.
Conditions of injection molding except for control factors.
| Description | Value |
|---|
| Injection time | 6 s |
| V/P switchover | 98% |
| Packing pressure | 80% of injection pressure for 1 s |
| Coolant temperature | 20 °C |
Table 21.
Injection molding analysis results of L9(33) orthogonal array.
Table 21.
Injection molding analysis results of L9(33) orthogonal array.
| Case No. | Time to Reach Ejection Temperature [s] |
|---|
| 1 | 121.5 |
| 2 | 164.7 |
| 3 | 210.8 |
| 4 | 118.4 |
| 5 | 220.3 |
| 6 | 281.1 |
| 7 | 248.3 |
| 8 | 299.9 |
| 9 | 305.0 |
Table 22.
S/N ratio results of L9(33) orthogonal array.
Table 22.
S/N ratio results of L9(33) orthogonal array.
| Case No. | Time to Reach Ejection Temperature [S] | Time to Reach Ejection Temperature S/N Ratio |
|---|
| 1 | 121.5 | 52.4960 |
| 2 | 164.7 | 53.3435 |
| 3 | 210.8 | 54.1650 |
| 4 | 118.4 | 52.431 1 |
| 5 | 220.3 | 54.3251 |
| 6 | 281.1 | 55.2850 |
| 7 | 248.3 | 54.7804 |
| 8 | 299.9 | 55.5616 |
| 9 | 305.0 | 55.6351 |
Table 23.
S/N ratio results of each control factor.
Table 23.
S/N ratio results of each control factor.
| Description | Melt Temperature | Mold Temperature | Tab Gate’s Height |
|---|
| Level | 1 | 53.33 | 53.24 | 54.45 |
| 2 | 54.01 | 54.41 | 53.80 |
| 3 | 55.33 | 55.03 | 54.42 |
| Delta | 1.99 | 1.79 | 0.64 |
| Rank | 1 | 2 | 3 |
Table 24.
Design of runner system size determined by DOE results.
Table 24.
Design of runner system size determined by DOE results.
| Description | Value |
|---|
Pin-point gate’s
diameter [mm] | Upside | 3 |
| Downside | 3 (with non-tapered shape) |
Tab gate [mm],
upside | Height | 3 |
| Width | 12 (runner size) |
| Length | 18 (width × 1.5) |
Tab gate [mm],
downside | Height | 6 |
| Width | 16 (runner size) |
| Length | 24 (width × 1.5) |
| Runner [mm] | Length | 180~488 |
| Diameter | 12 (upside), 16 (downside) |
Table 25.
Final conditions of injection molding by DOE results and calculation of S/N ratio.
Table 25.
Final conditions of injection molding by DOE results and calculation of S/N ratio.
| Description | Value |
|---|
| Melt temperature | 270 °C |
| Mold temperature | 80 °C |
| Injection time | 6 s |
| V/P switchover | 98% |
| Packing pressure | 80% of injection pressure for 1 s |
| Coolant temperature | 20 °C |
Table 26.
Comparison with existing stack enclosure.
Table 26.
Comparison with existing stack enclosure.
| Description | Aluminum (AC4CH) | mPPO |
|---|
| Weight | 9.5 kg | 3.65 kg |
| Cycle time | 30 min/1 ea | 107.63 s/1 ea |
Table 27.
Suggestion design of runner system.
Table 27.
Suggestion design of runner system.
| Description | Value |
|---|
| Pin-point gate‘s diameter [mm] | Upside | 3 |
| Downside | 3 (with non-tapered shape) |
Tab gate [mm],
upside | Height | 3 |
| Width | 12 (runner size) |
| Length | 18 (width×1.5) |
Tab gate [mm],
downside | Height | 6 |
| Width | 16 (runner size) |
| Length | 24 (width ×1.5) |
| Runner [mm] | Length | 180~488 |
| Diameter | 12 (upside), 16 (downside) |
Table 28.
Suggestion conditions of injection molding.
Table 28.
Suggestion conditions of injection molding.
| Description | Value |
|---|
| Melt temperature | 270 °C |
| Mold temperature | 80 °C |
| Injection time | 6 s |
| V/P switchover | 98% |
| Packing pressure | 80% of injection pressure for 1 s |
| Coolant temperature | 20 °C |


