
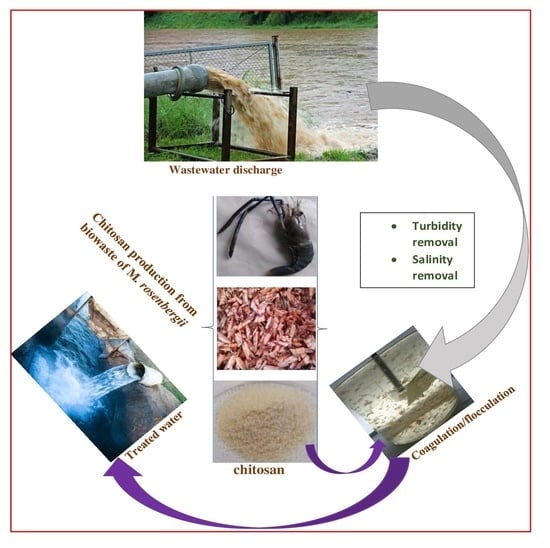
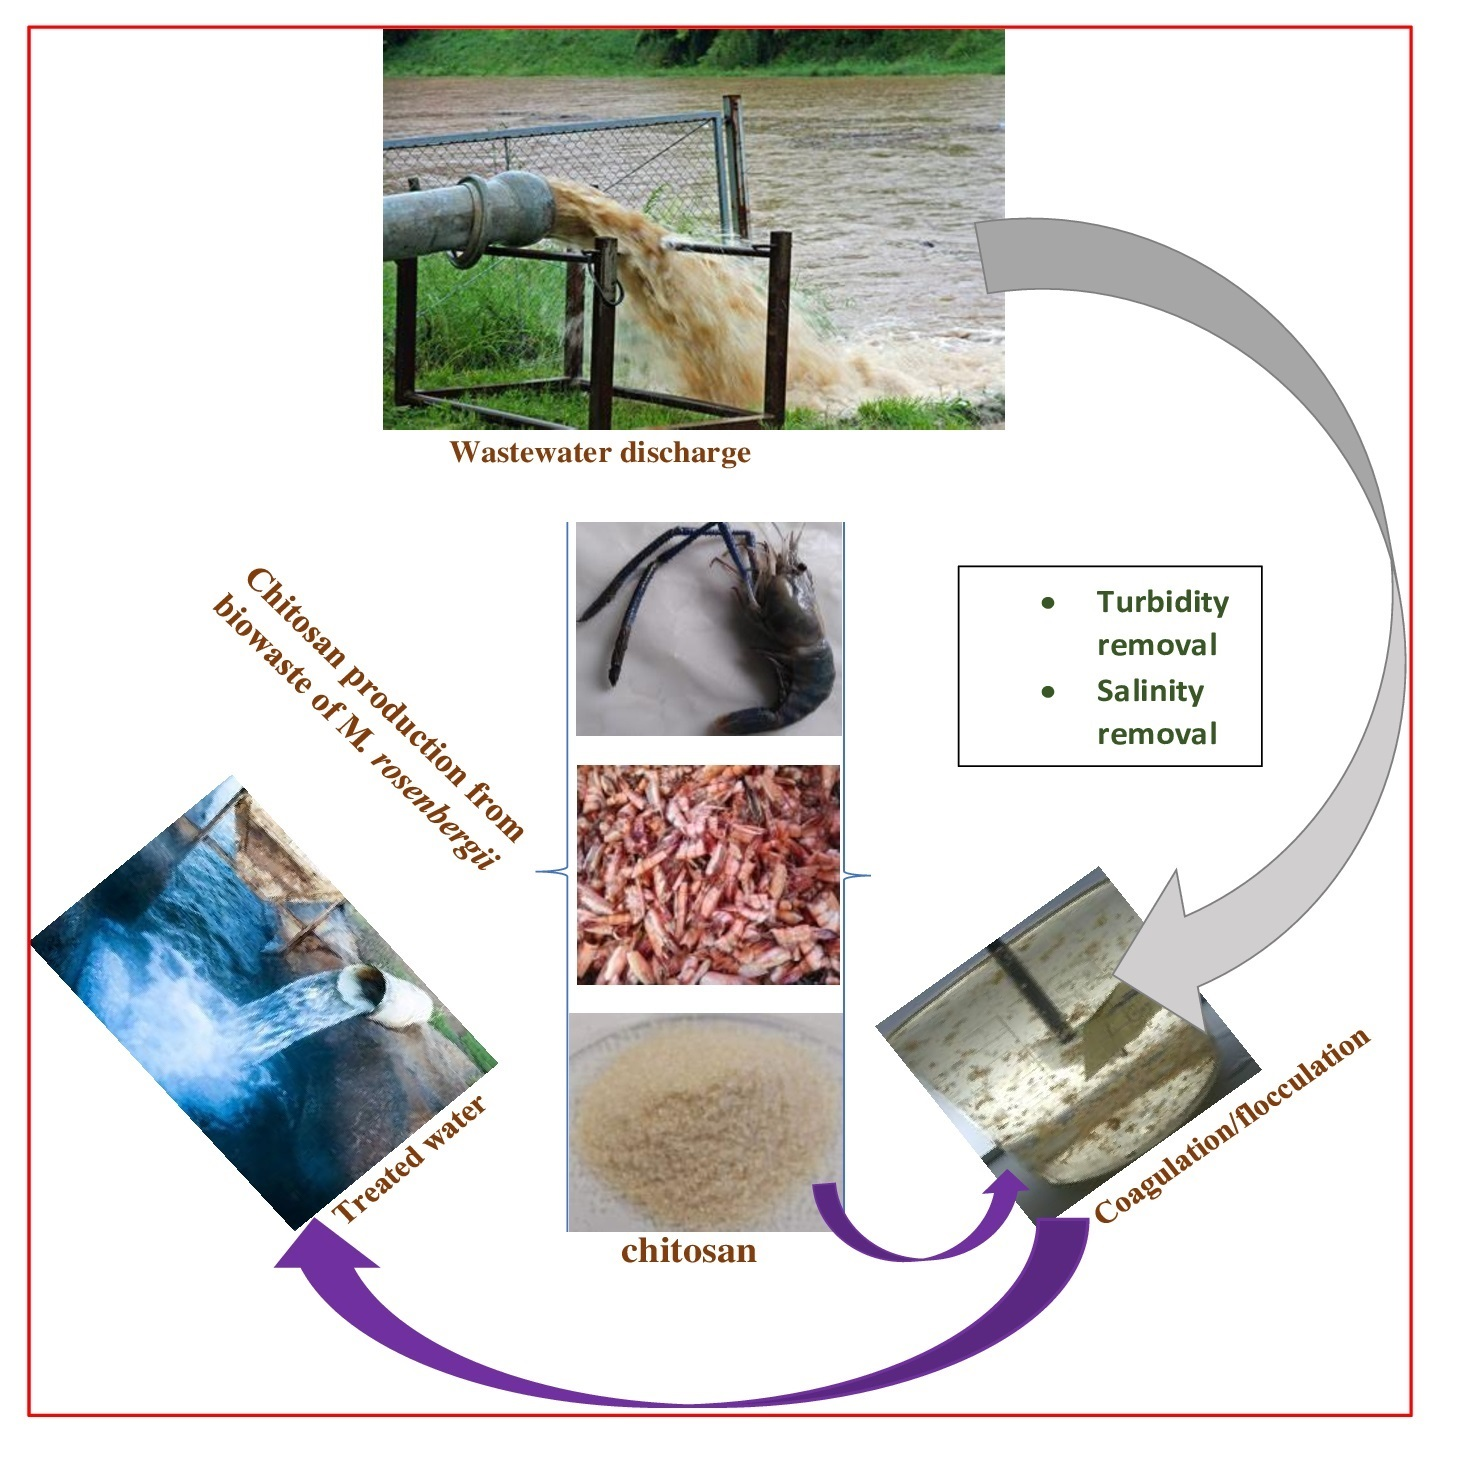
Response Surface Methodology (RSM) Approach to Optimization of Coagulation-Flocculation of Aquaculture Wastewater Treatment Using Chitosan from Carapace of Giant Freshwater Prawn Macrobrachium rosenbergii

 ,
,  ,
,  and
and
Abstract
:
1. Introduction
2. Materials and Methods
2.1. Preparation and Characterization of Chitosan from Carapace of M. rosenbergii
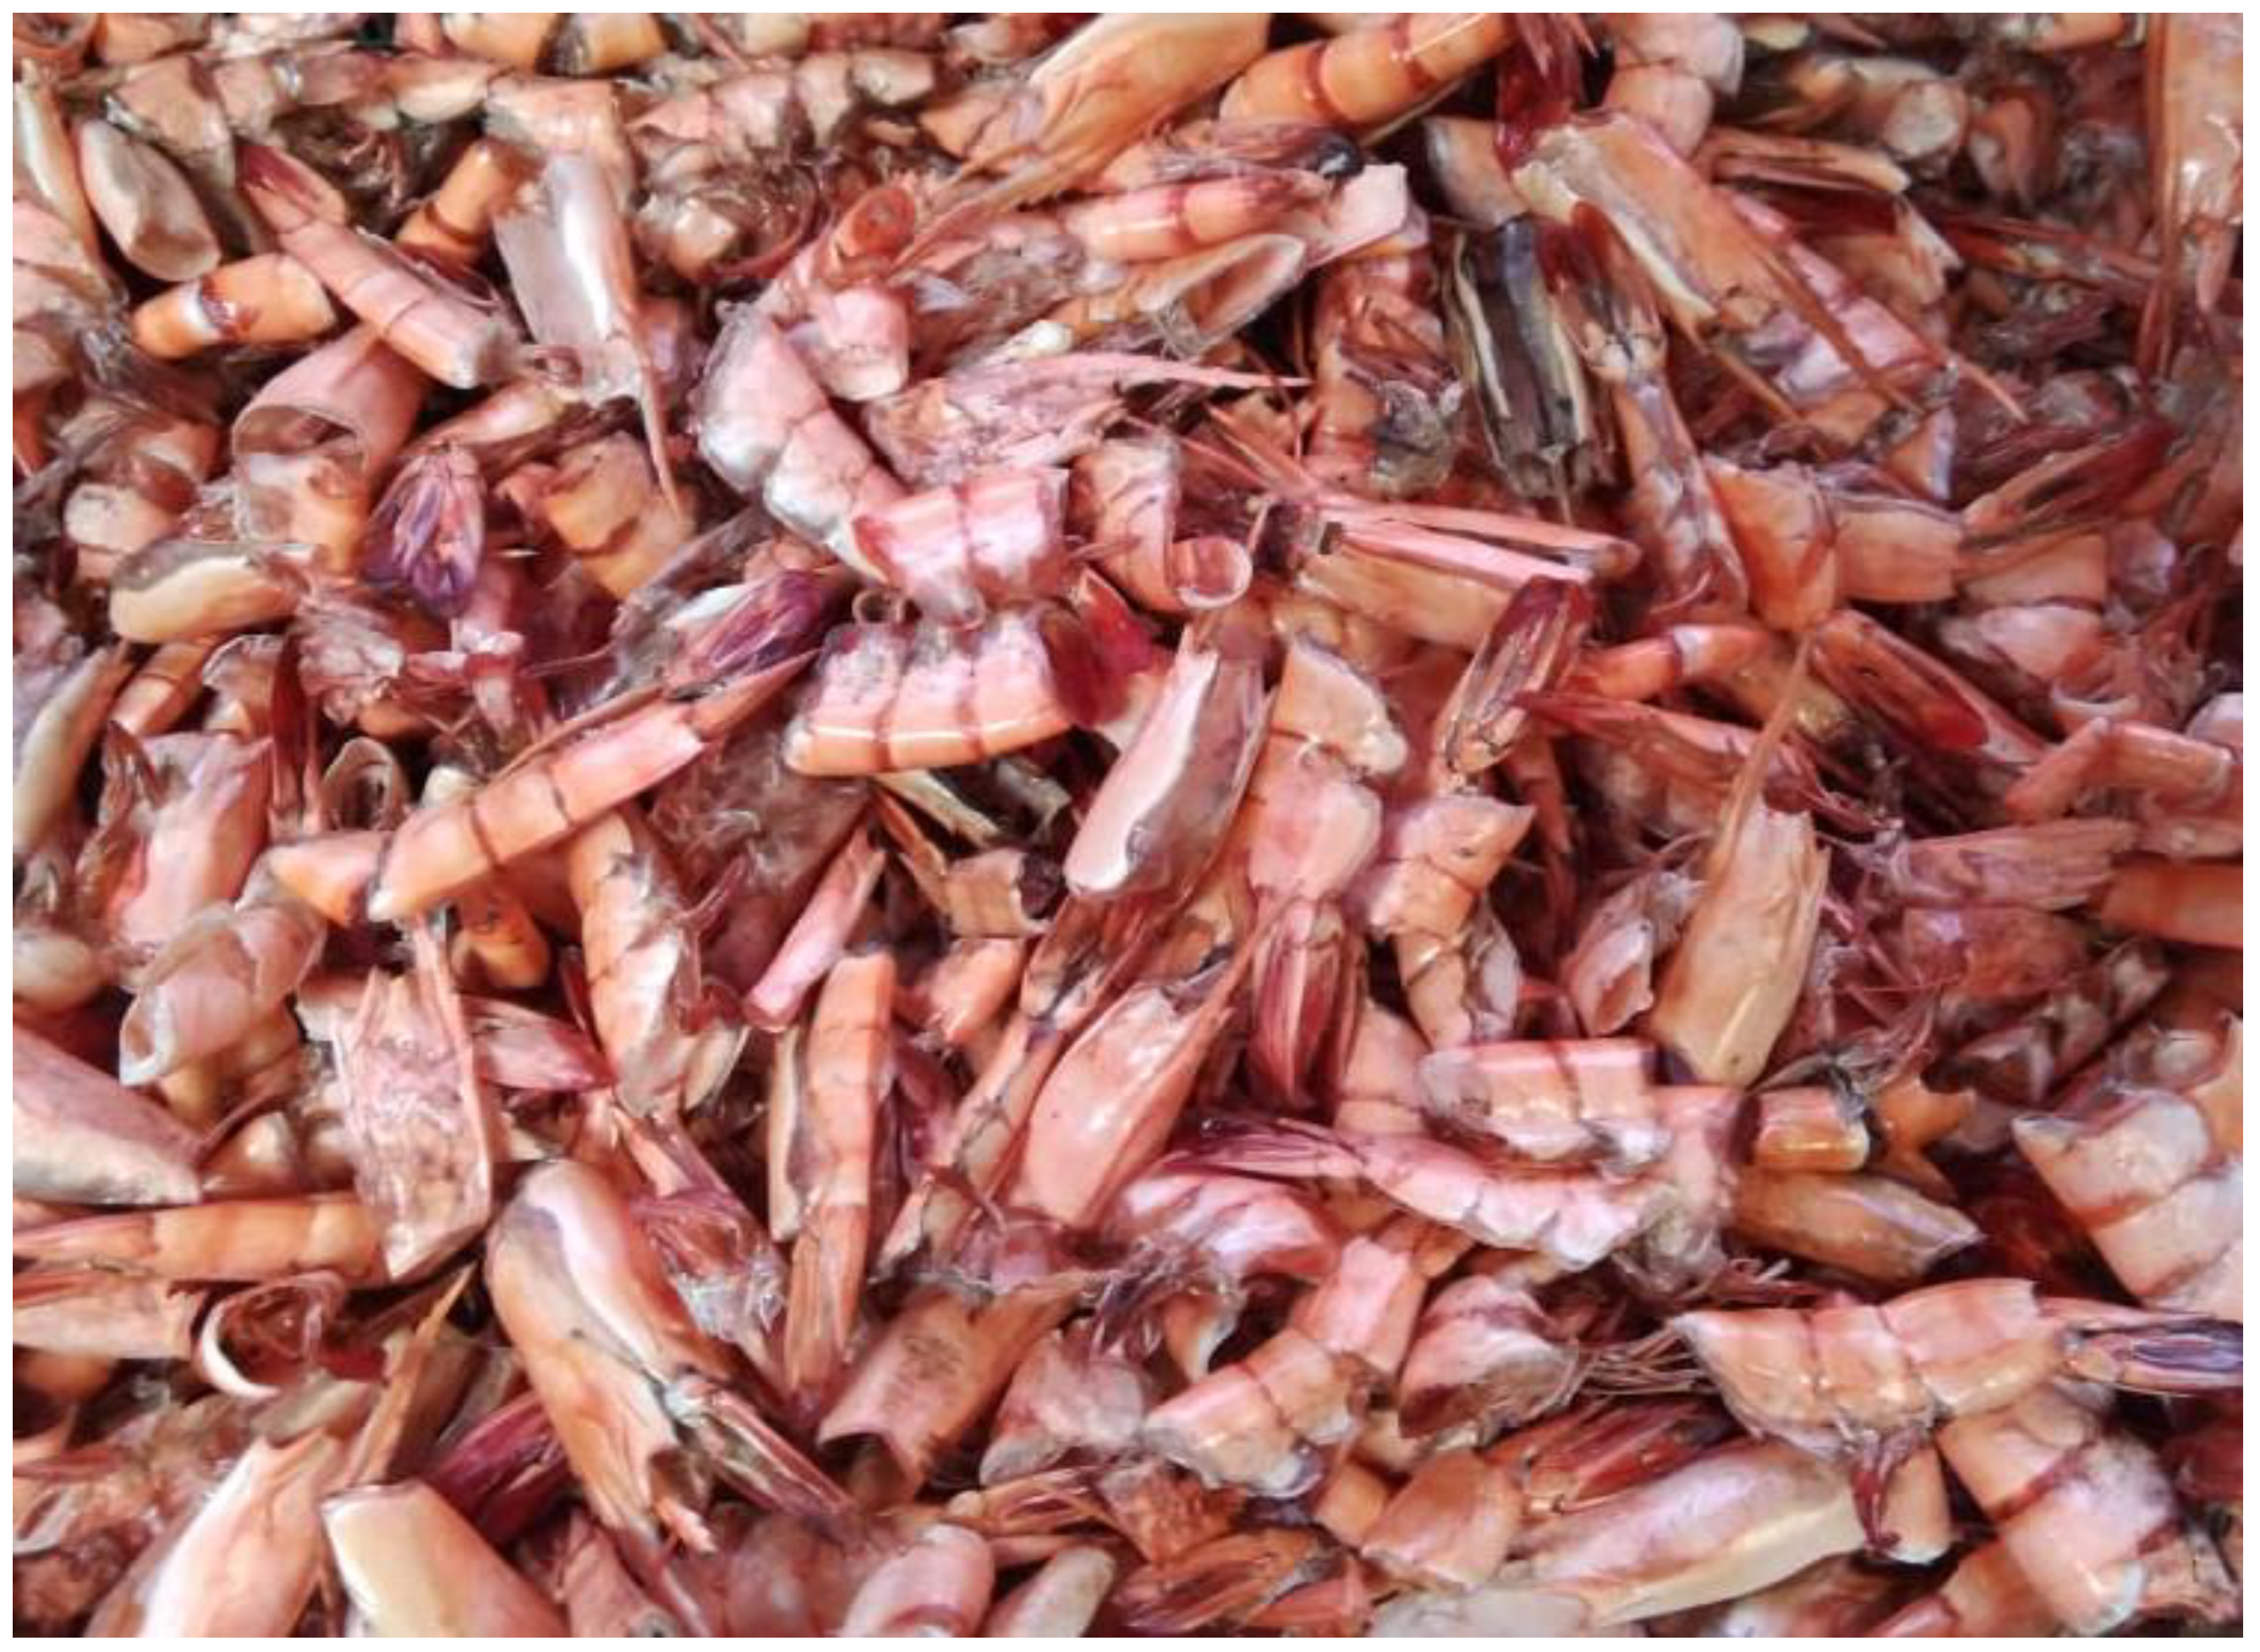
2.1.1. Collection and Preparation of Raw Material
2.1.2. Chemical Preparation of Chitin and Chitosan
Demineralization
Deproteinization
Decoloration and Deacetylation
2.1.3. Characterization of Chitosan
2.2. Coagulation/Flocculation Using Chitosan from Carapace of M. rosenbergii
2.2.1. Preparation of Chitosan Coagulant Solution
2.2.2. Experimental Design and Optimization
2.2.3. Coagulation/Flocculation Process
2.2.4. Analysis of Response Parameters
2.2.5. Fitness of Mathematical Model
2.2.6. Validation of Developed Model
3. Statistical Analysis
4. Results and Discussion
4.1. Physicochemical Properties
4.1.1. Chitin and Chitosan Yield
4.1.2. Percentage Moisture and Ash Content
4.1.3. Fat-Binding Capacity (FBC) and Water-Binding Capacity (WBC)
4.1.4. Solubility and DDA
4.1.5. Bulk Density (BD), Tapped Density, Compressibility, Hausner Ratio (HR), and Carr’s Index (CI)
4.1.6. Percentage of Inorganic Material, Protein, and Pigment in the Raw Sample
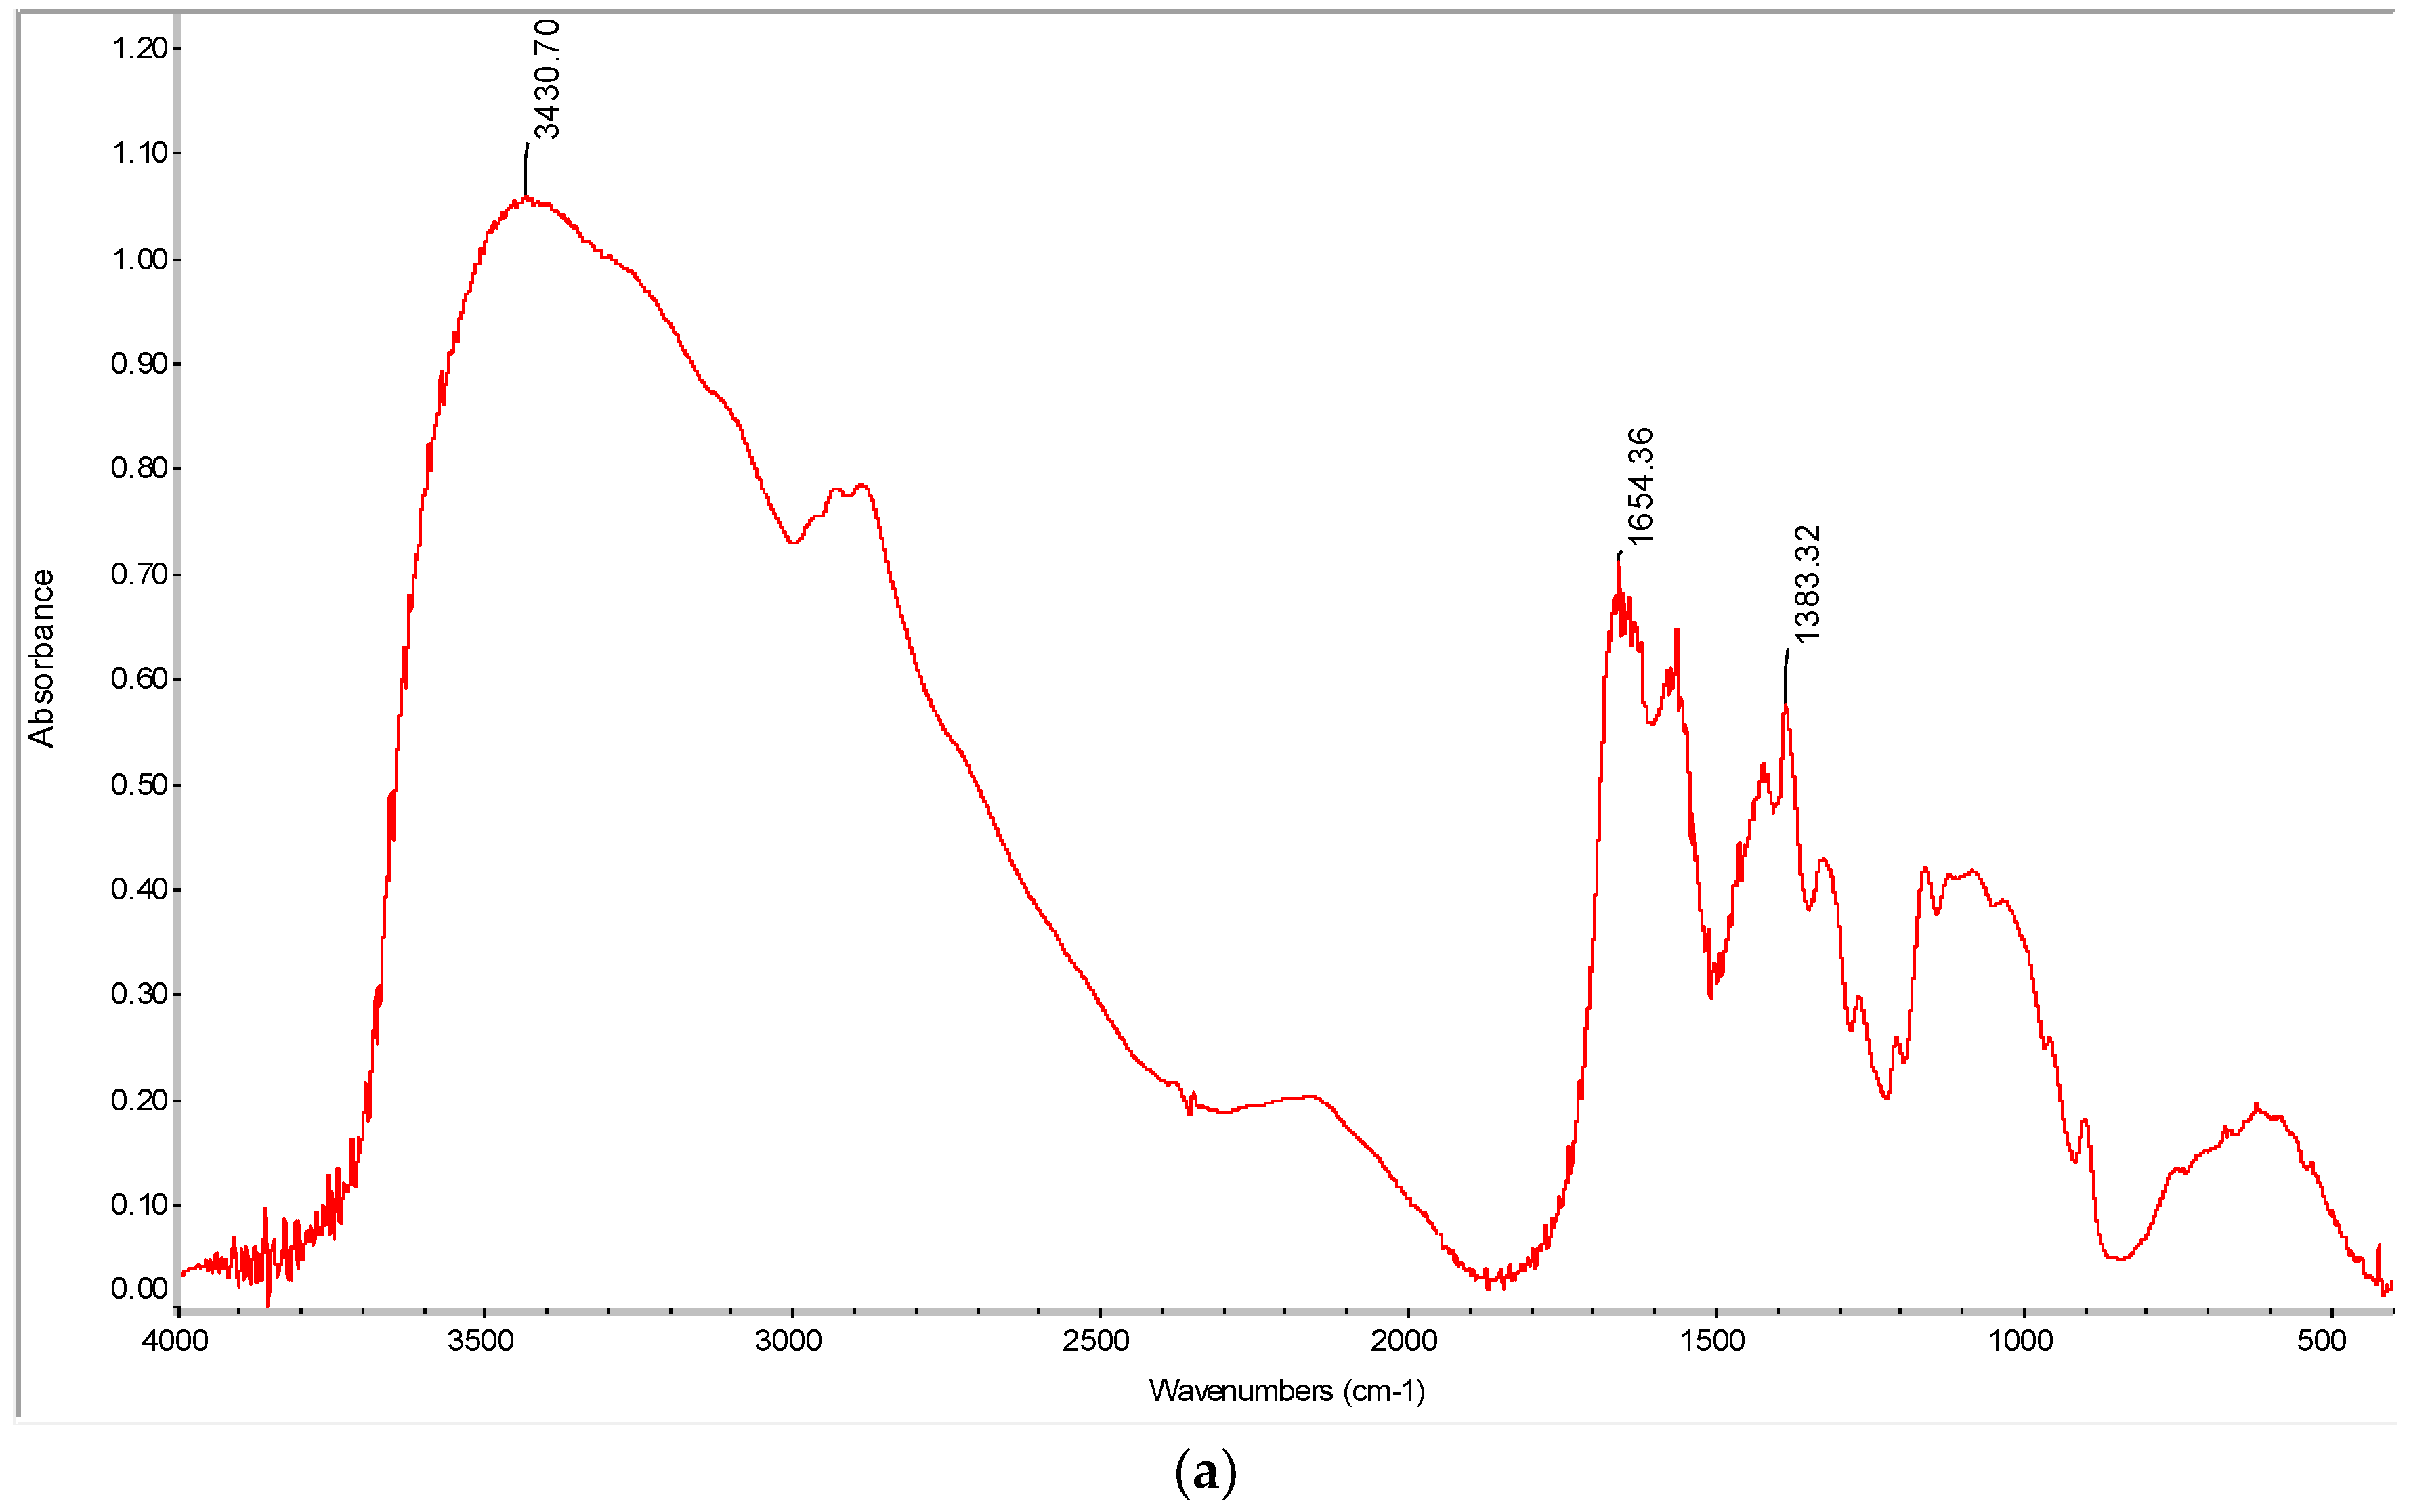
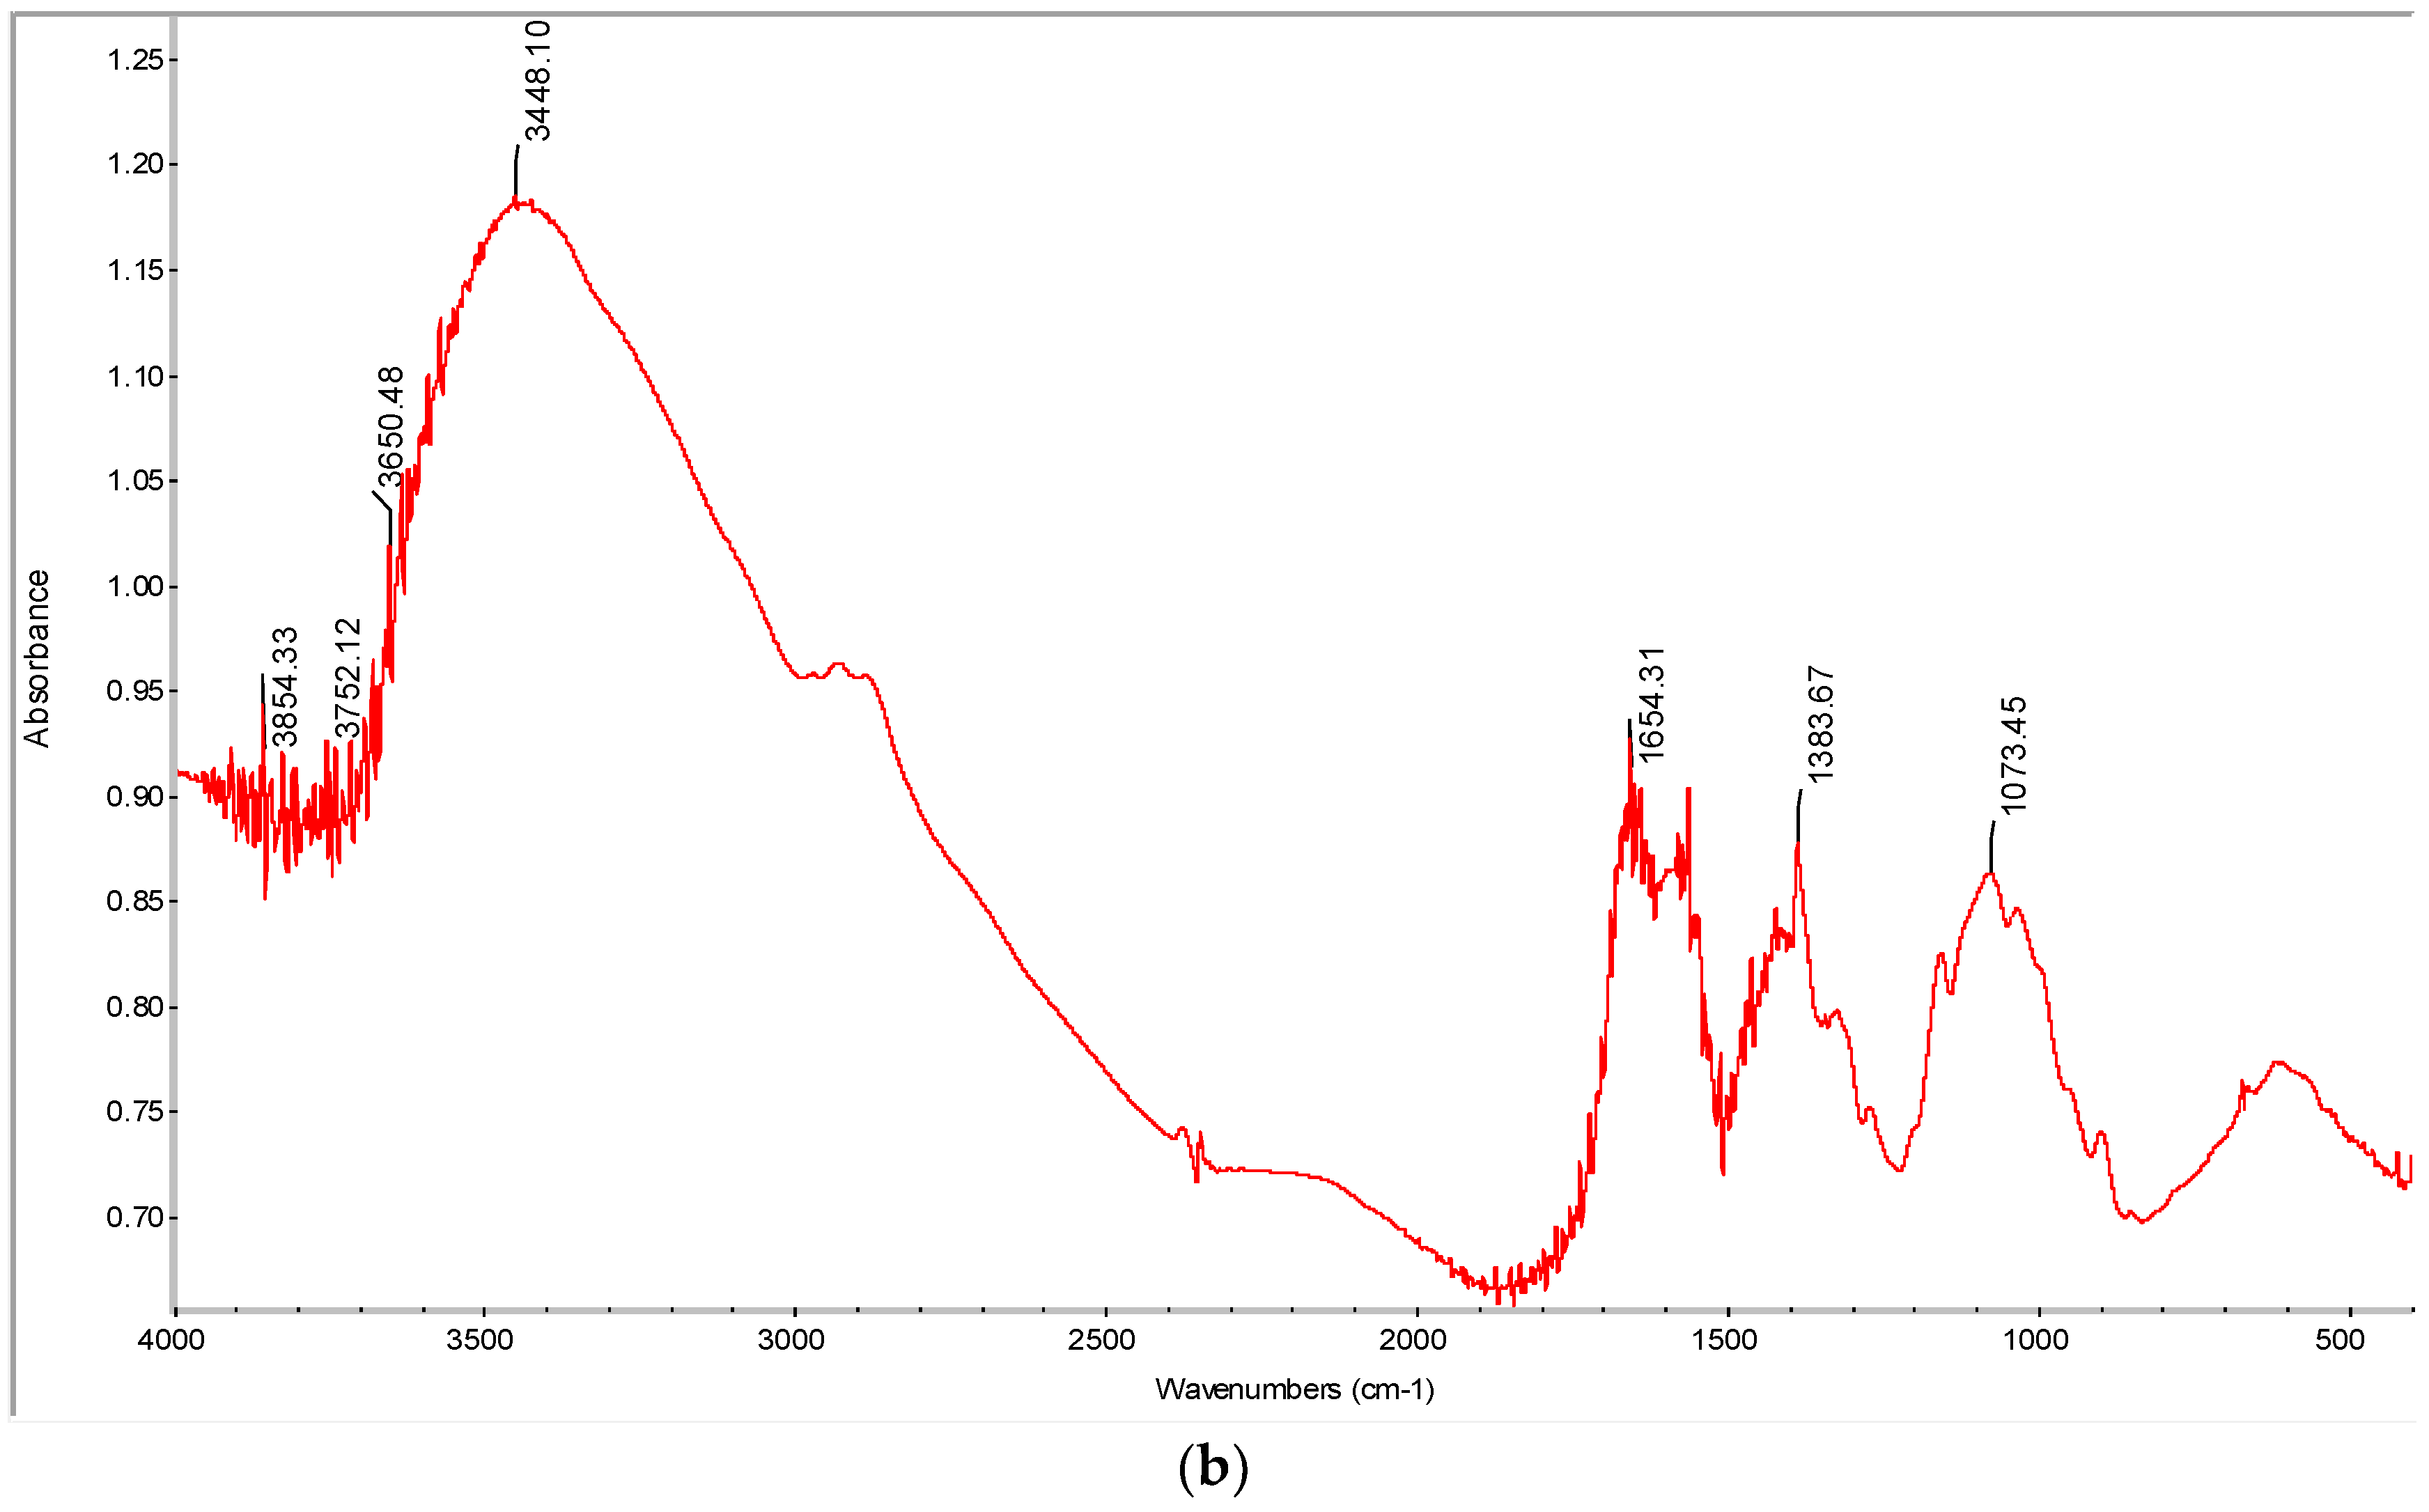
4.1.7. Fourier Transform Infrared Spectroscopy (FTIR)
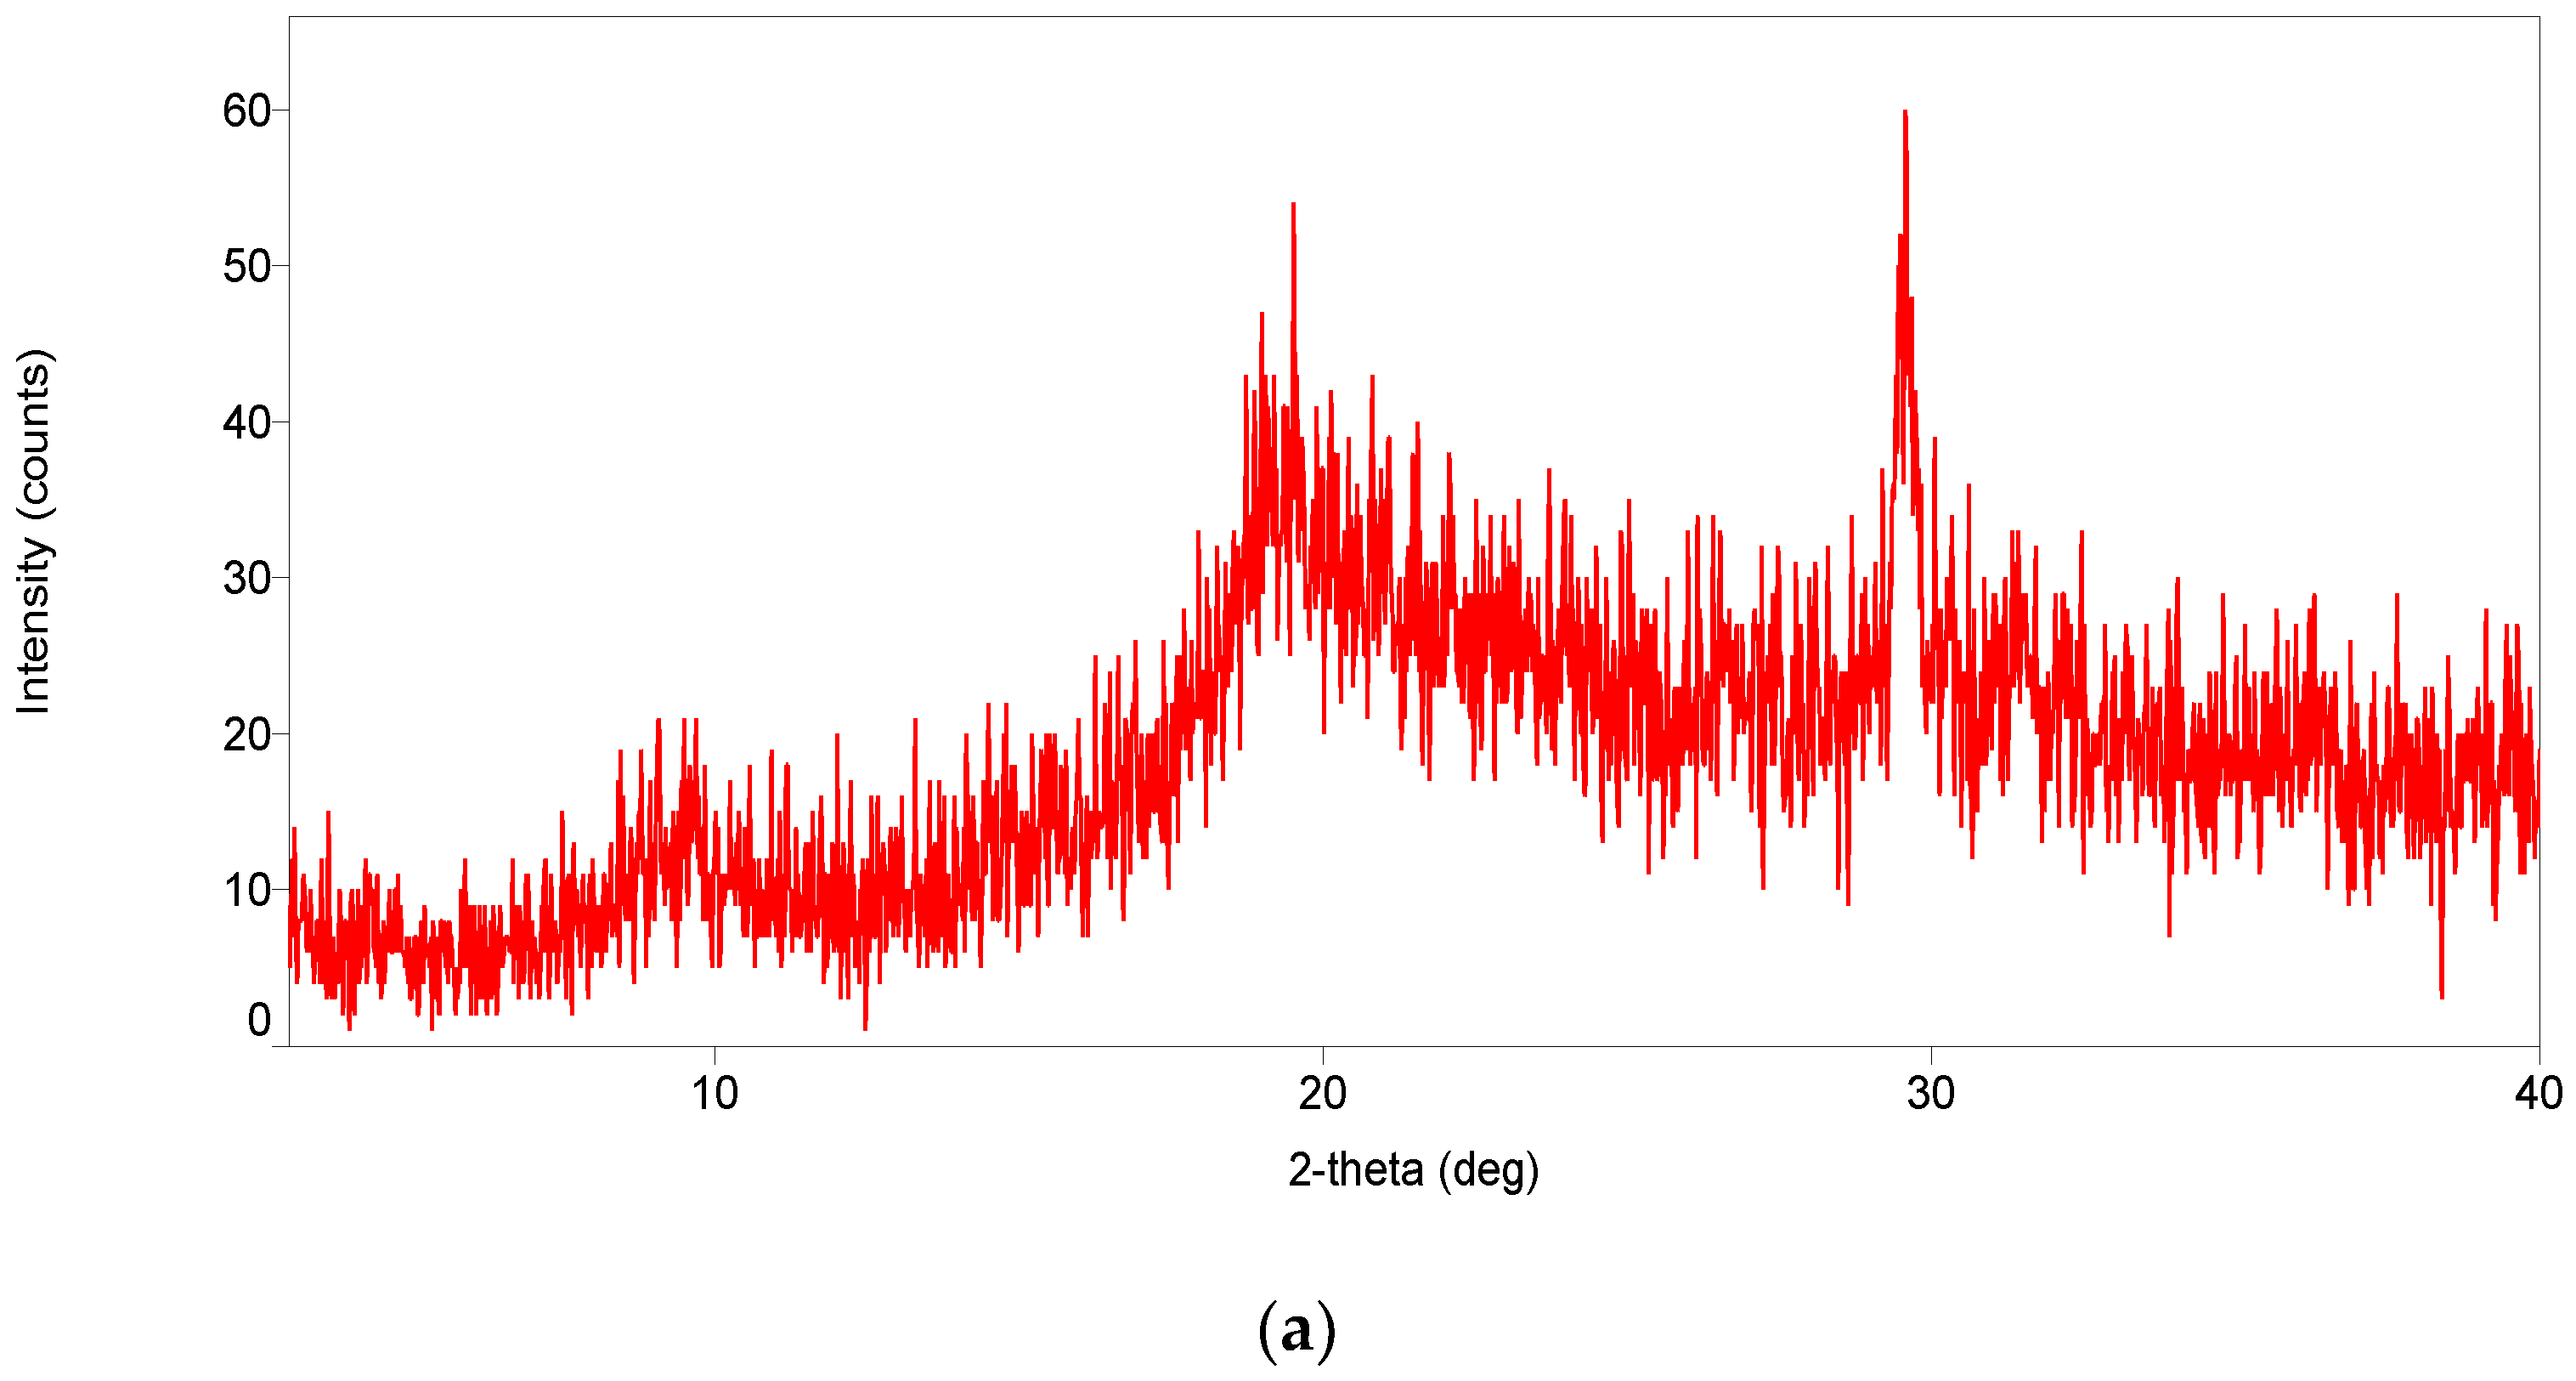
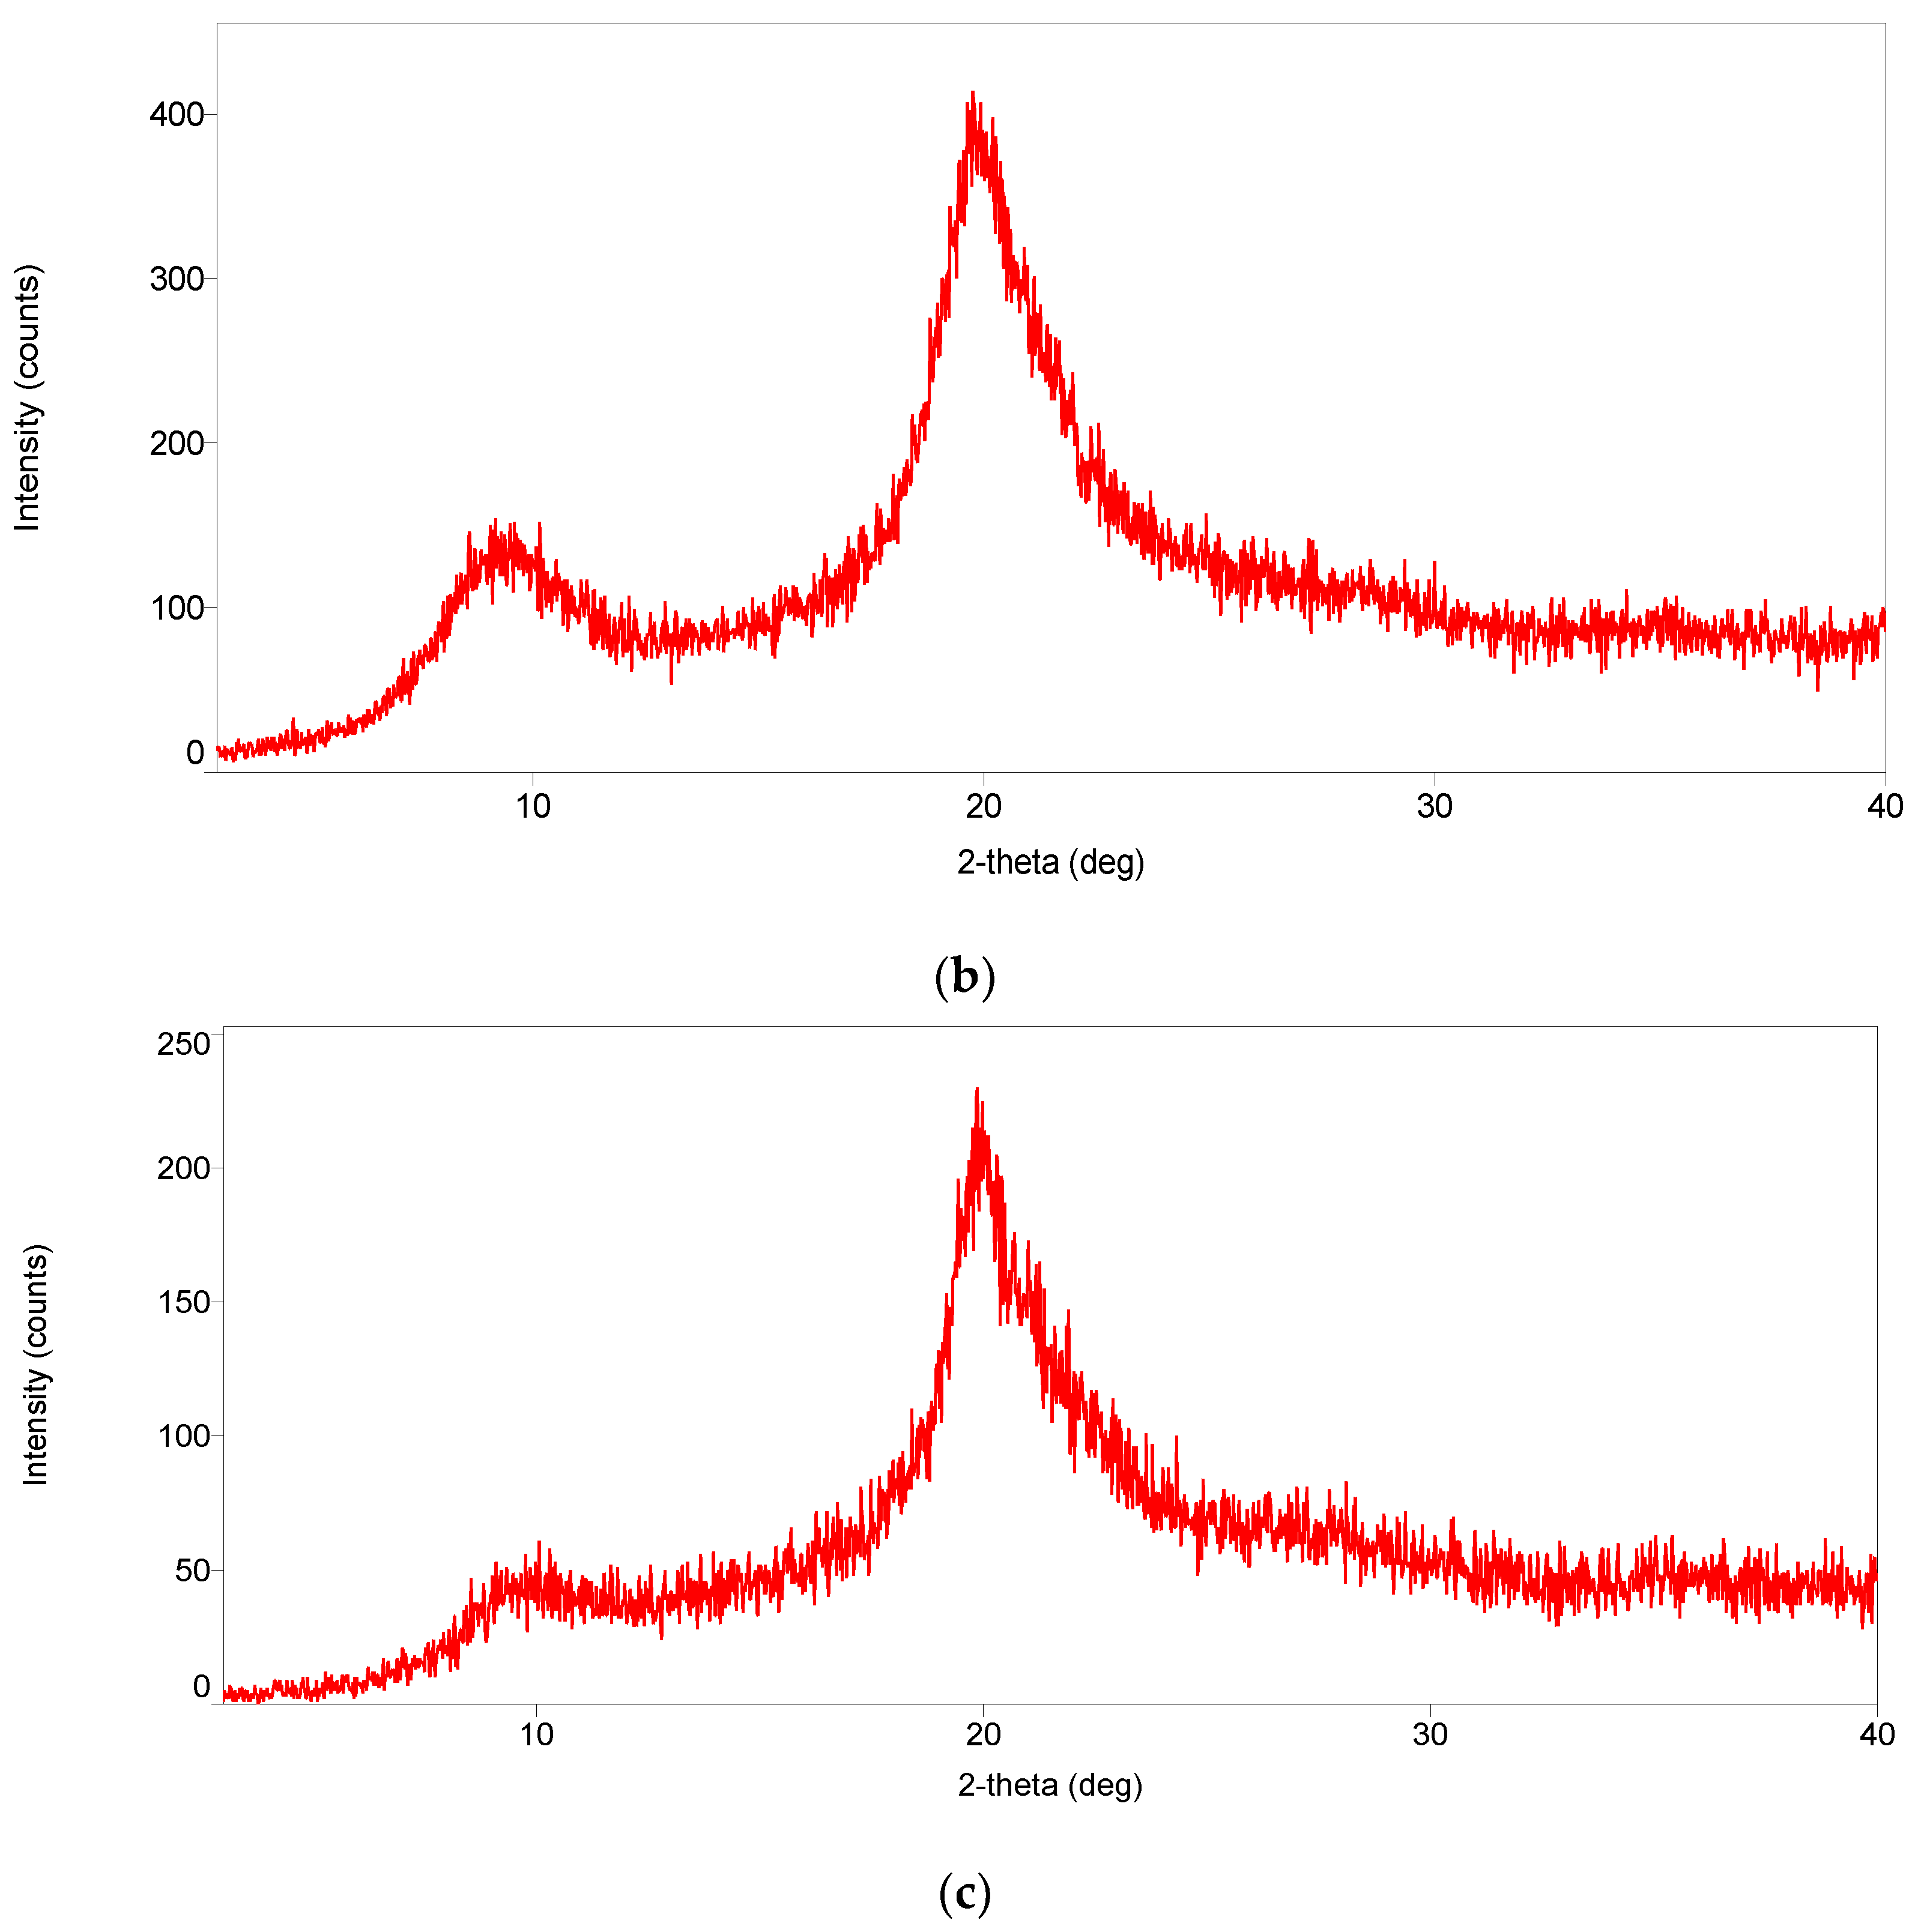
4.1.8. X-ray Diffraction (XRD)
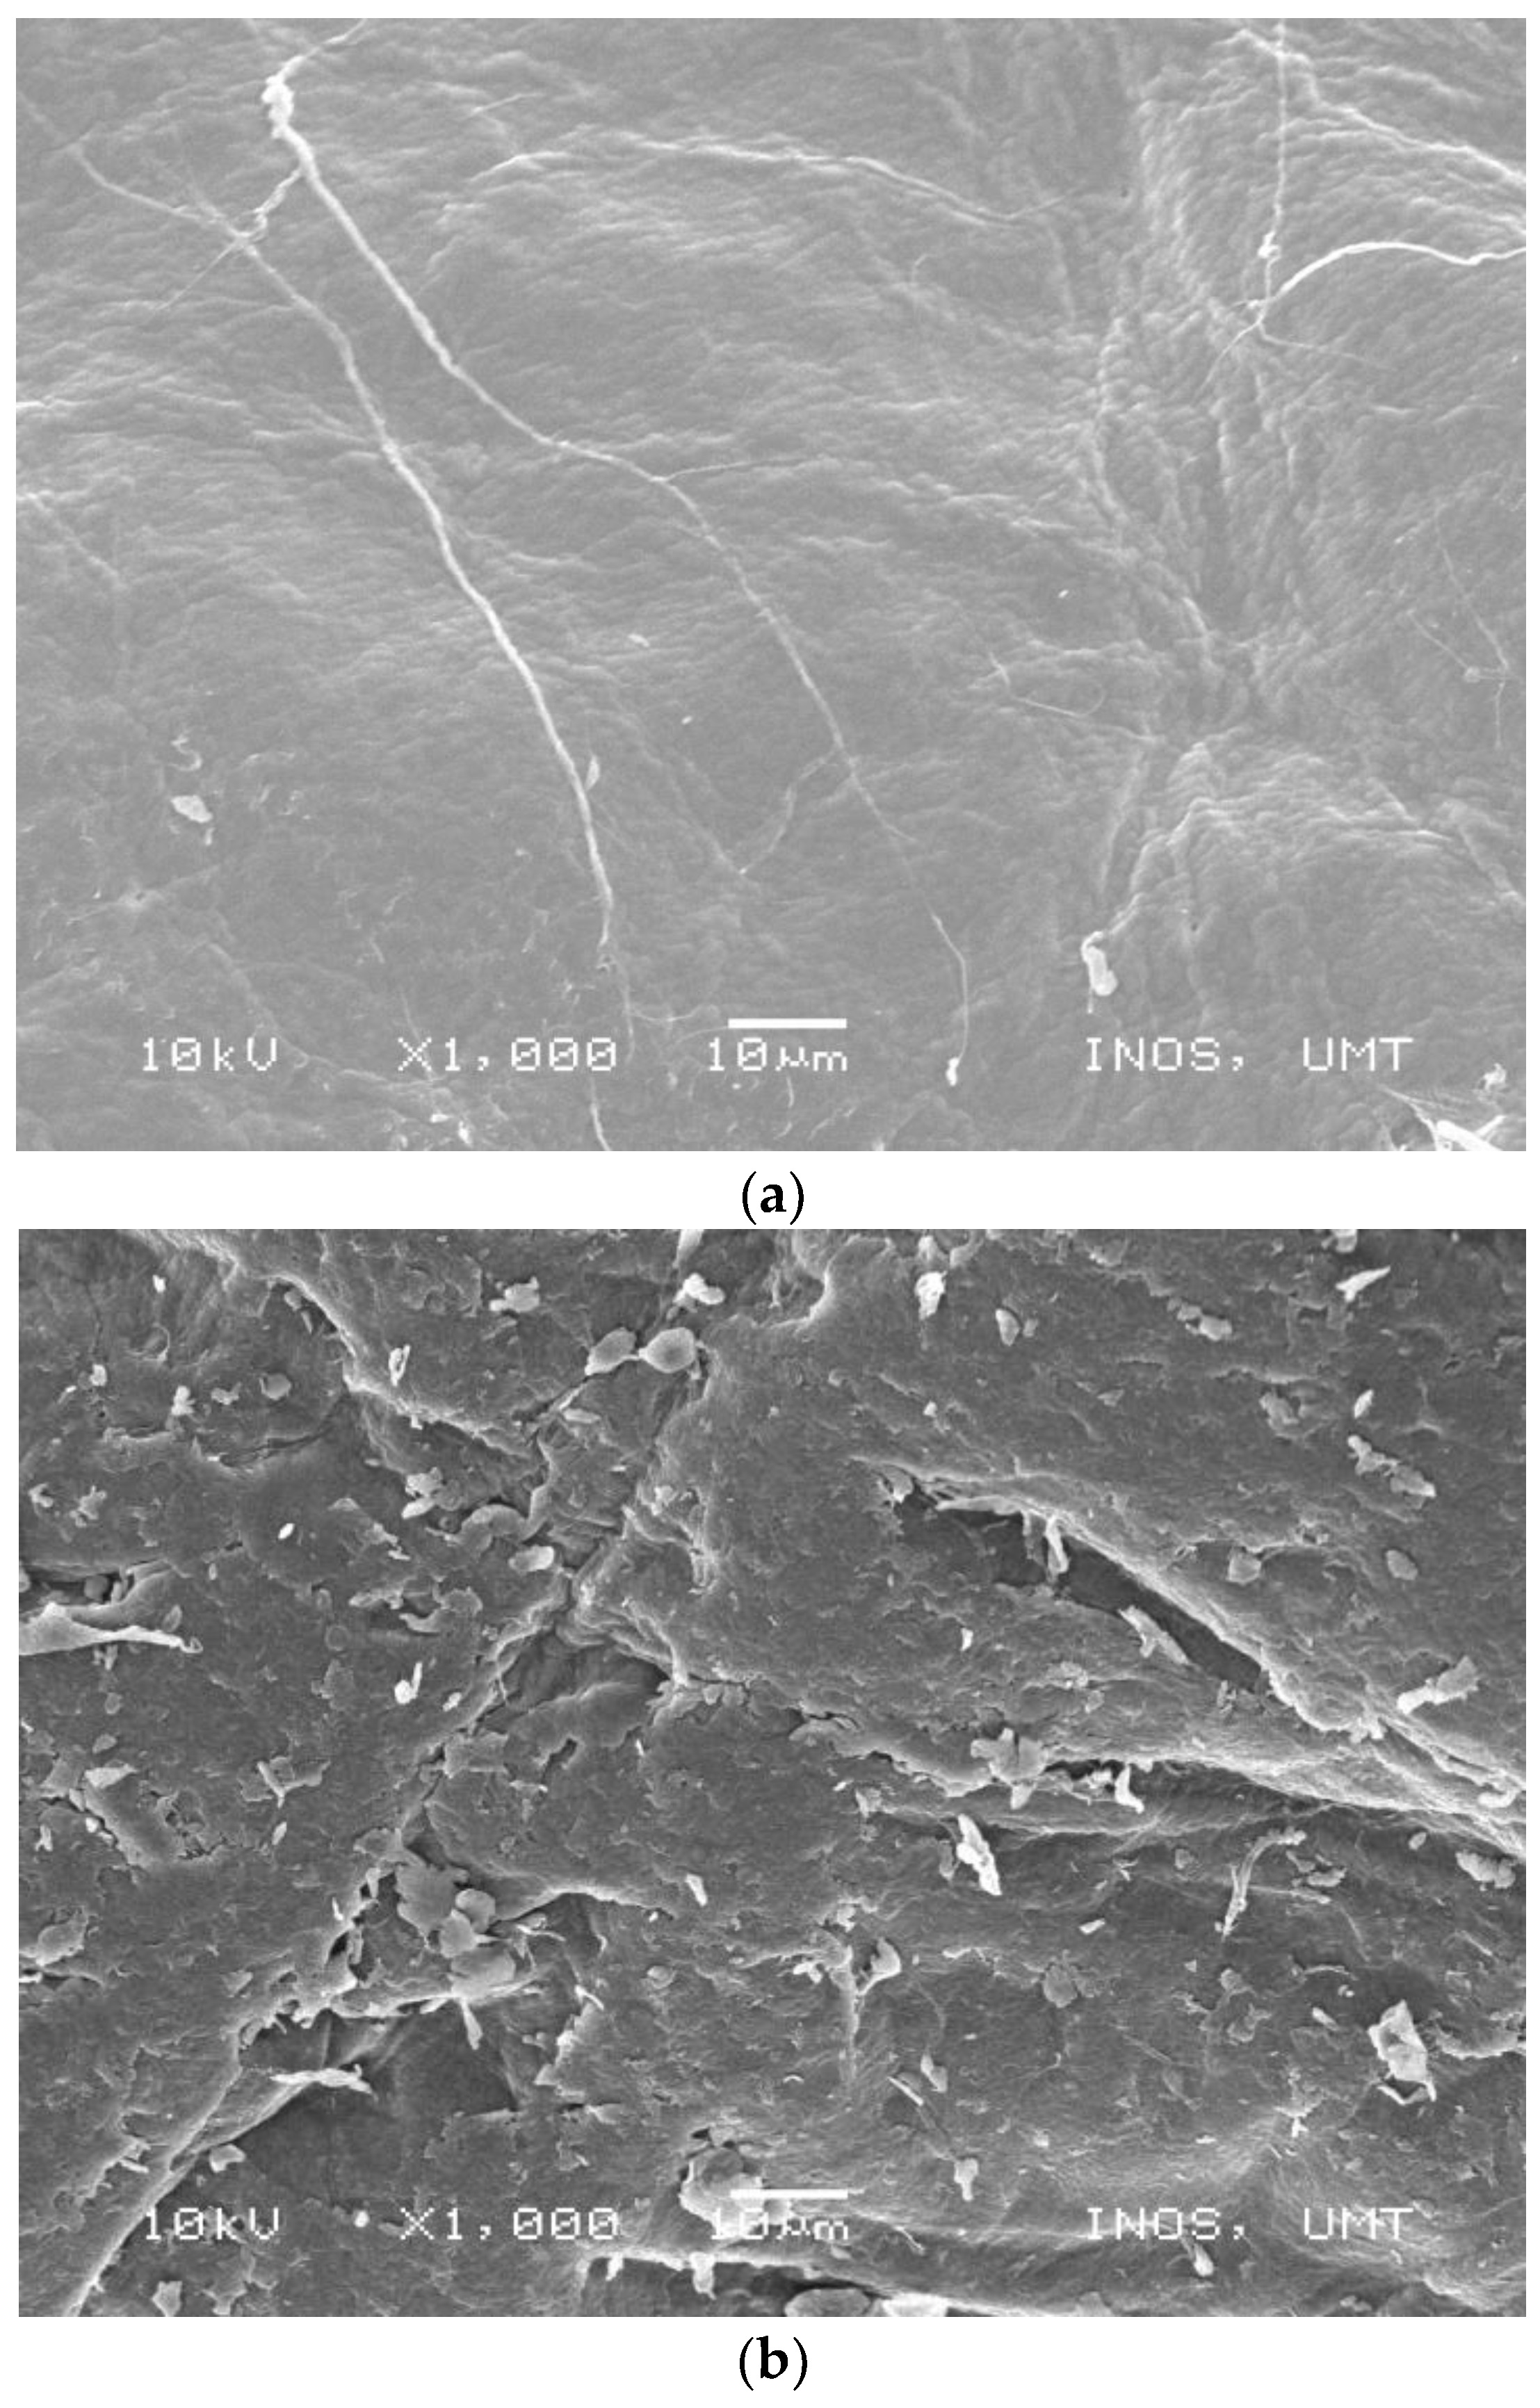
4.1.9. Scanning Electron Microscope (SEM)
4.2. Coagulation/Flocculation Using Chitosan from Dry Carapace of M. rosenbergii
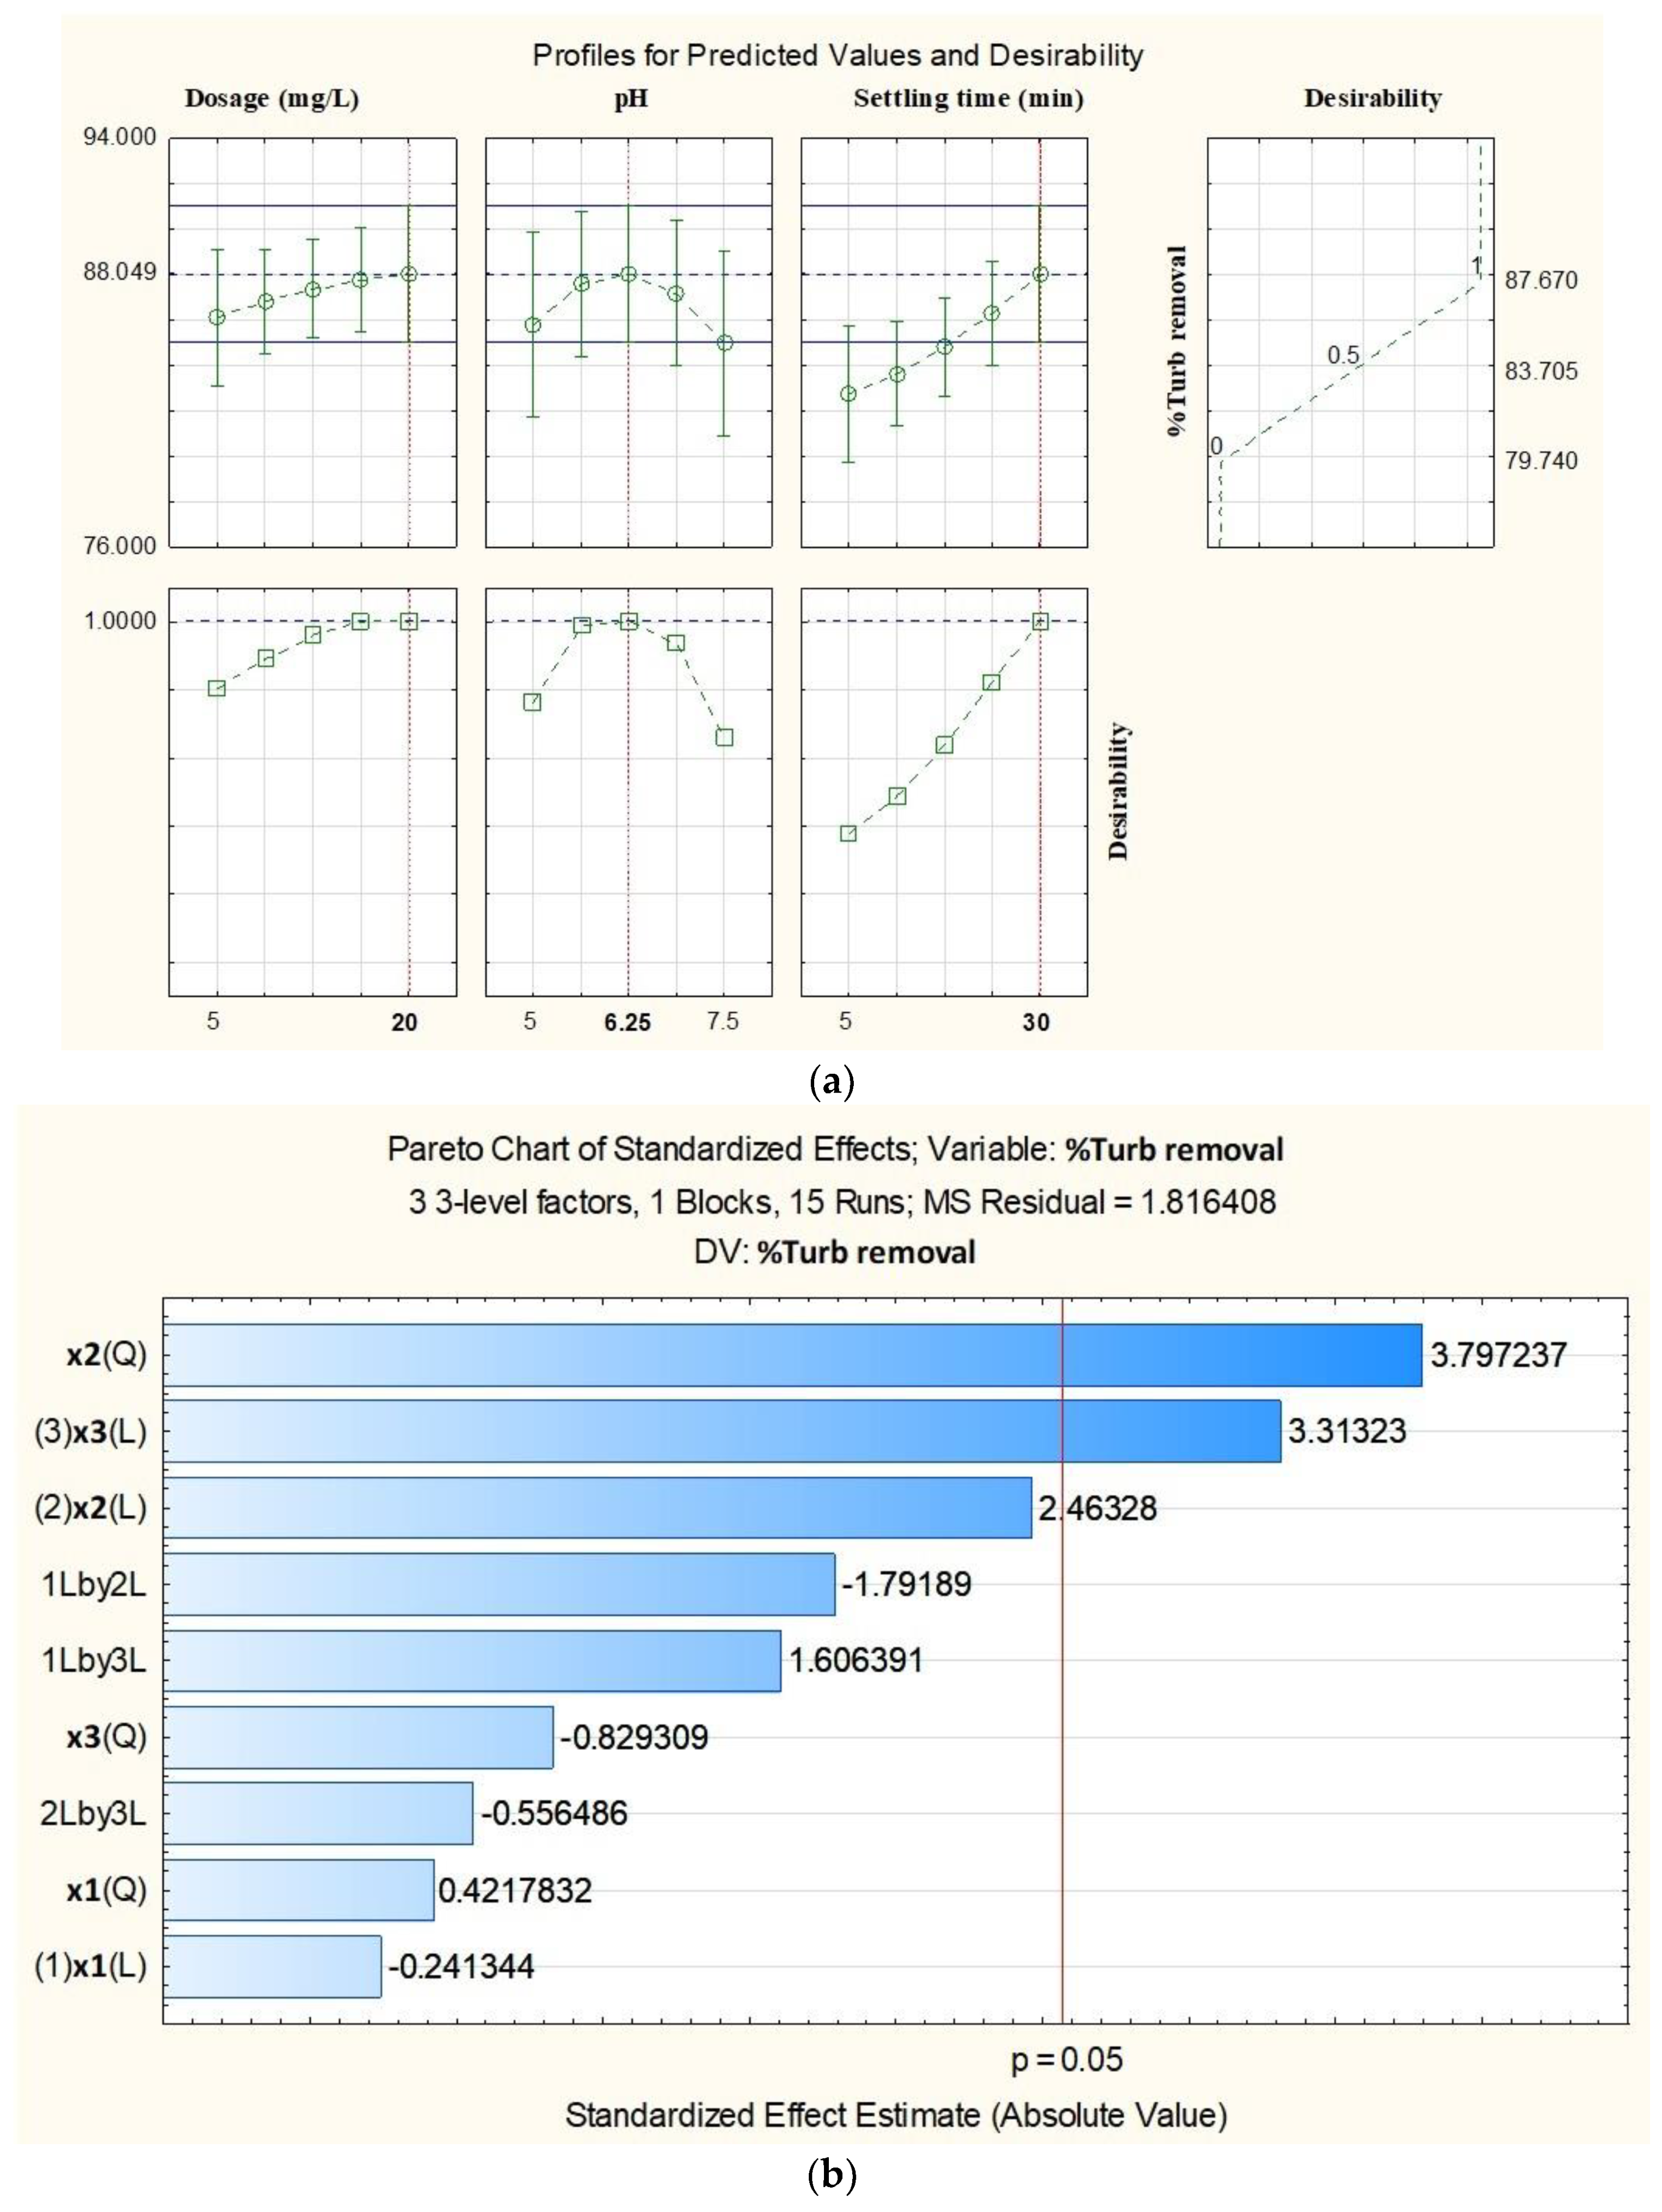
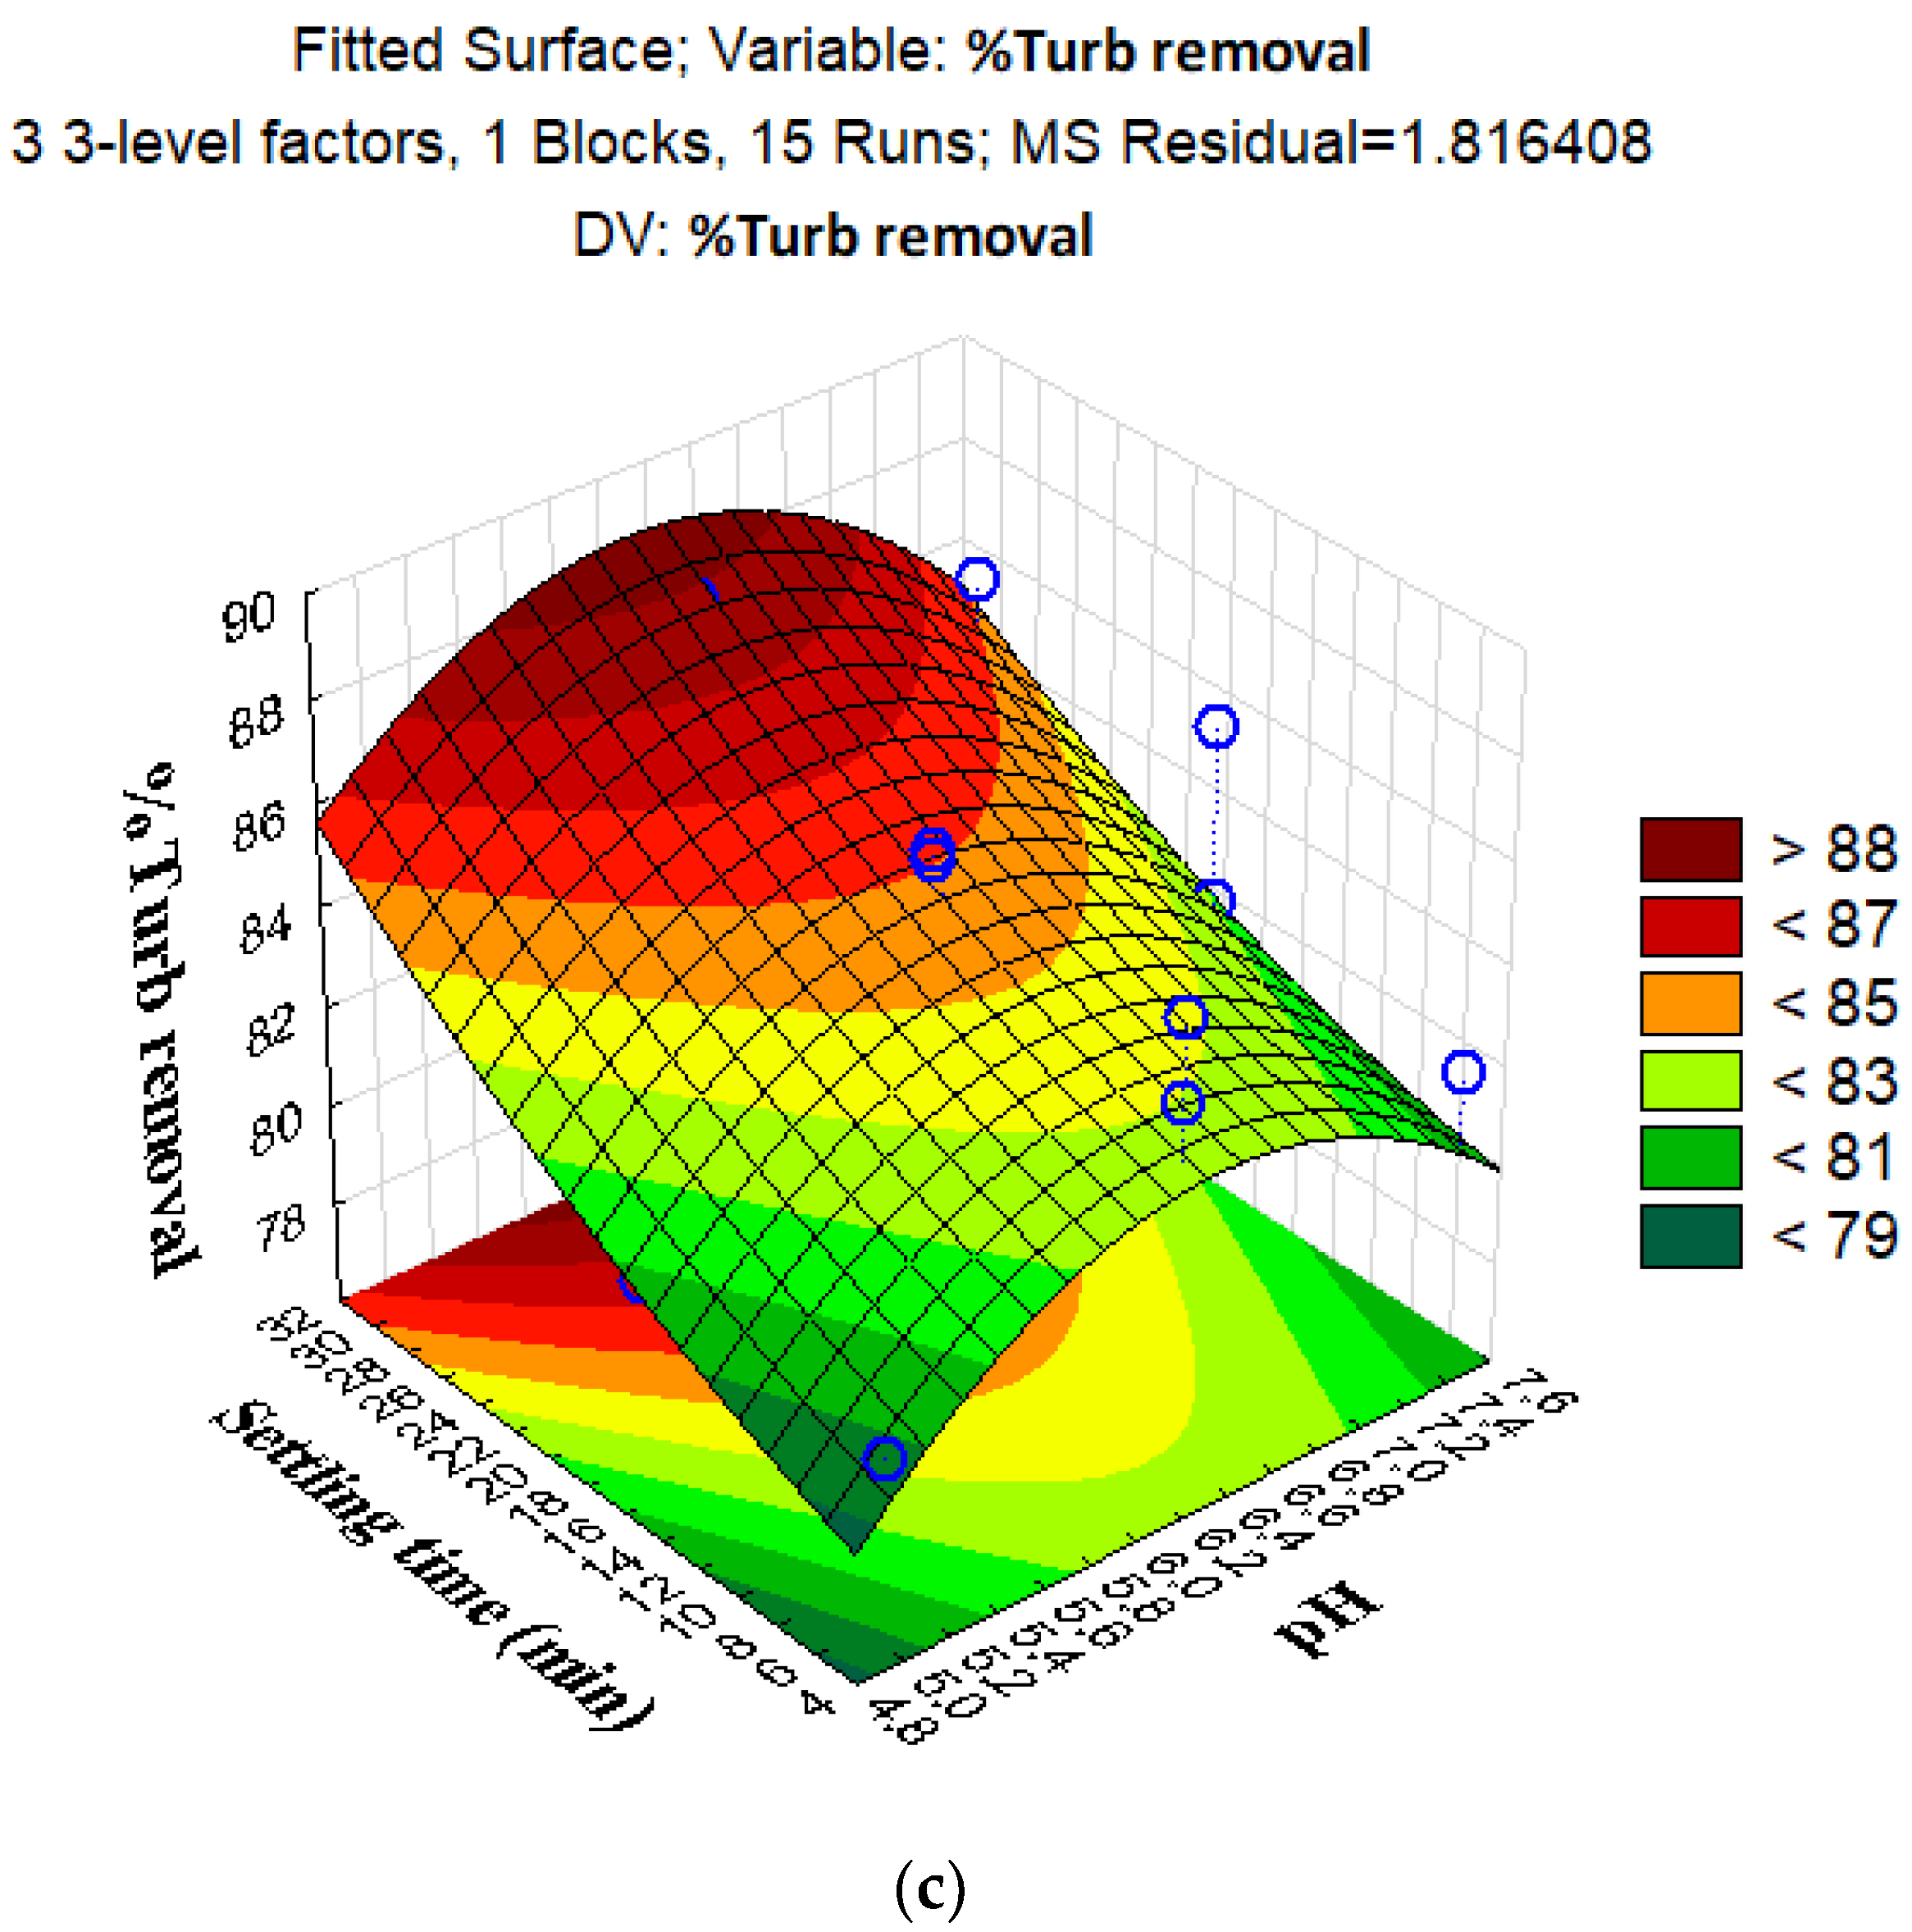
4.2.1. Percentage Turbidity Removal Using Chitosan from Carapace of M. rosenbergii

| Source | DF | Adj SS | Adj MS | F-Value | p-Value |
|---|---|---|---|---|---|
| Model | 9 | 70.7183 | 7.8576 | 4.33 | 0.051 Sig. |
| Linear | 3 | 31.0669 | 10.3556 | 5.70 | 0.045 Sig. |
| X1 | 1 | 0.1058 | 0.1058 | 0.06 | 0.819 |
| X2 | 1 | 11.0215 | 11.0215 | 6.07 | 0.057 |
| X3 | 1 | 19.9396 | 19.9396 | 10.98 | 0.021 Sig. |
| Square | 3 | 28.5695 | 9.5232 | 5.24 | 0.053 Sig. |
| X1 × X1 | 1 | 0.3231 | 0.3231 | 0.18 | 0.691 |
| X2 × X2 | 1 | 26.1908 | 26.1908 | 14.42 | 0.013 Sig. |
| X3 × X3 | 1 | 1.2492 | 1.2492 | 0.69 | 0.445 |
| 2-Way Interaction | 3 | 11.0819 | 3.6940 | 2.03 | 0.228 |
| X1 × X2 | 1 | 5.8322 | 5.8322 | 3.21 | 0.133 |
| X1 × X3 | 1 | 4.6872 | 4.6872 | 2.58 | 0.169 |
| X2 × X3 | 1 | 0.5625 | 0.5625 | 0.31 | 0.602 |
| Error | 5 | 9.0820 | 1.8164 | ||
| Lack-of-Fit | 3 | 8.1552 | 2.7184 | 5.87 | 0.149 Not Sig. |
| Pure Error | 2 | 0.9269 | 0.4634 | ||
| Total | 14 | 79.8004 | |||
| R2 | 88.62 | ||||
| R2 Adj. | 68.13 |
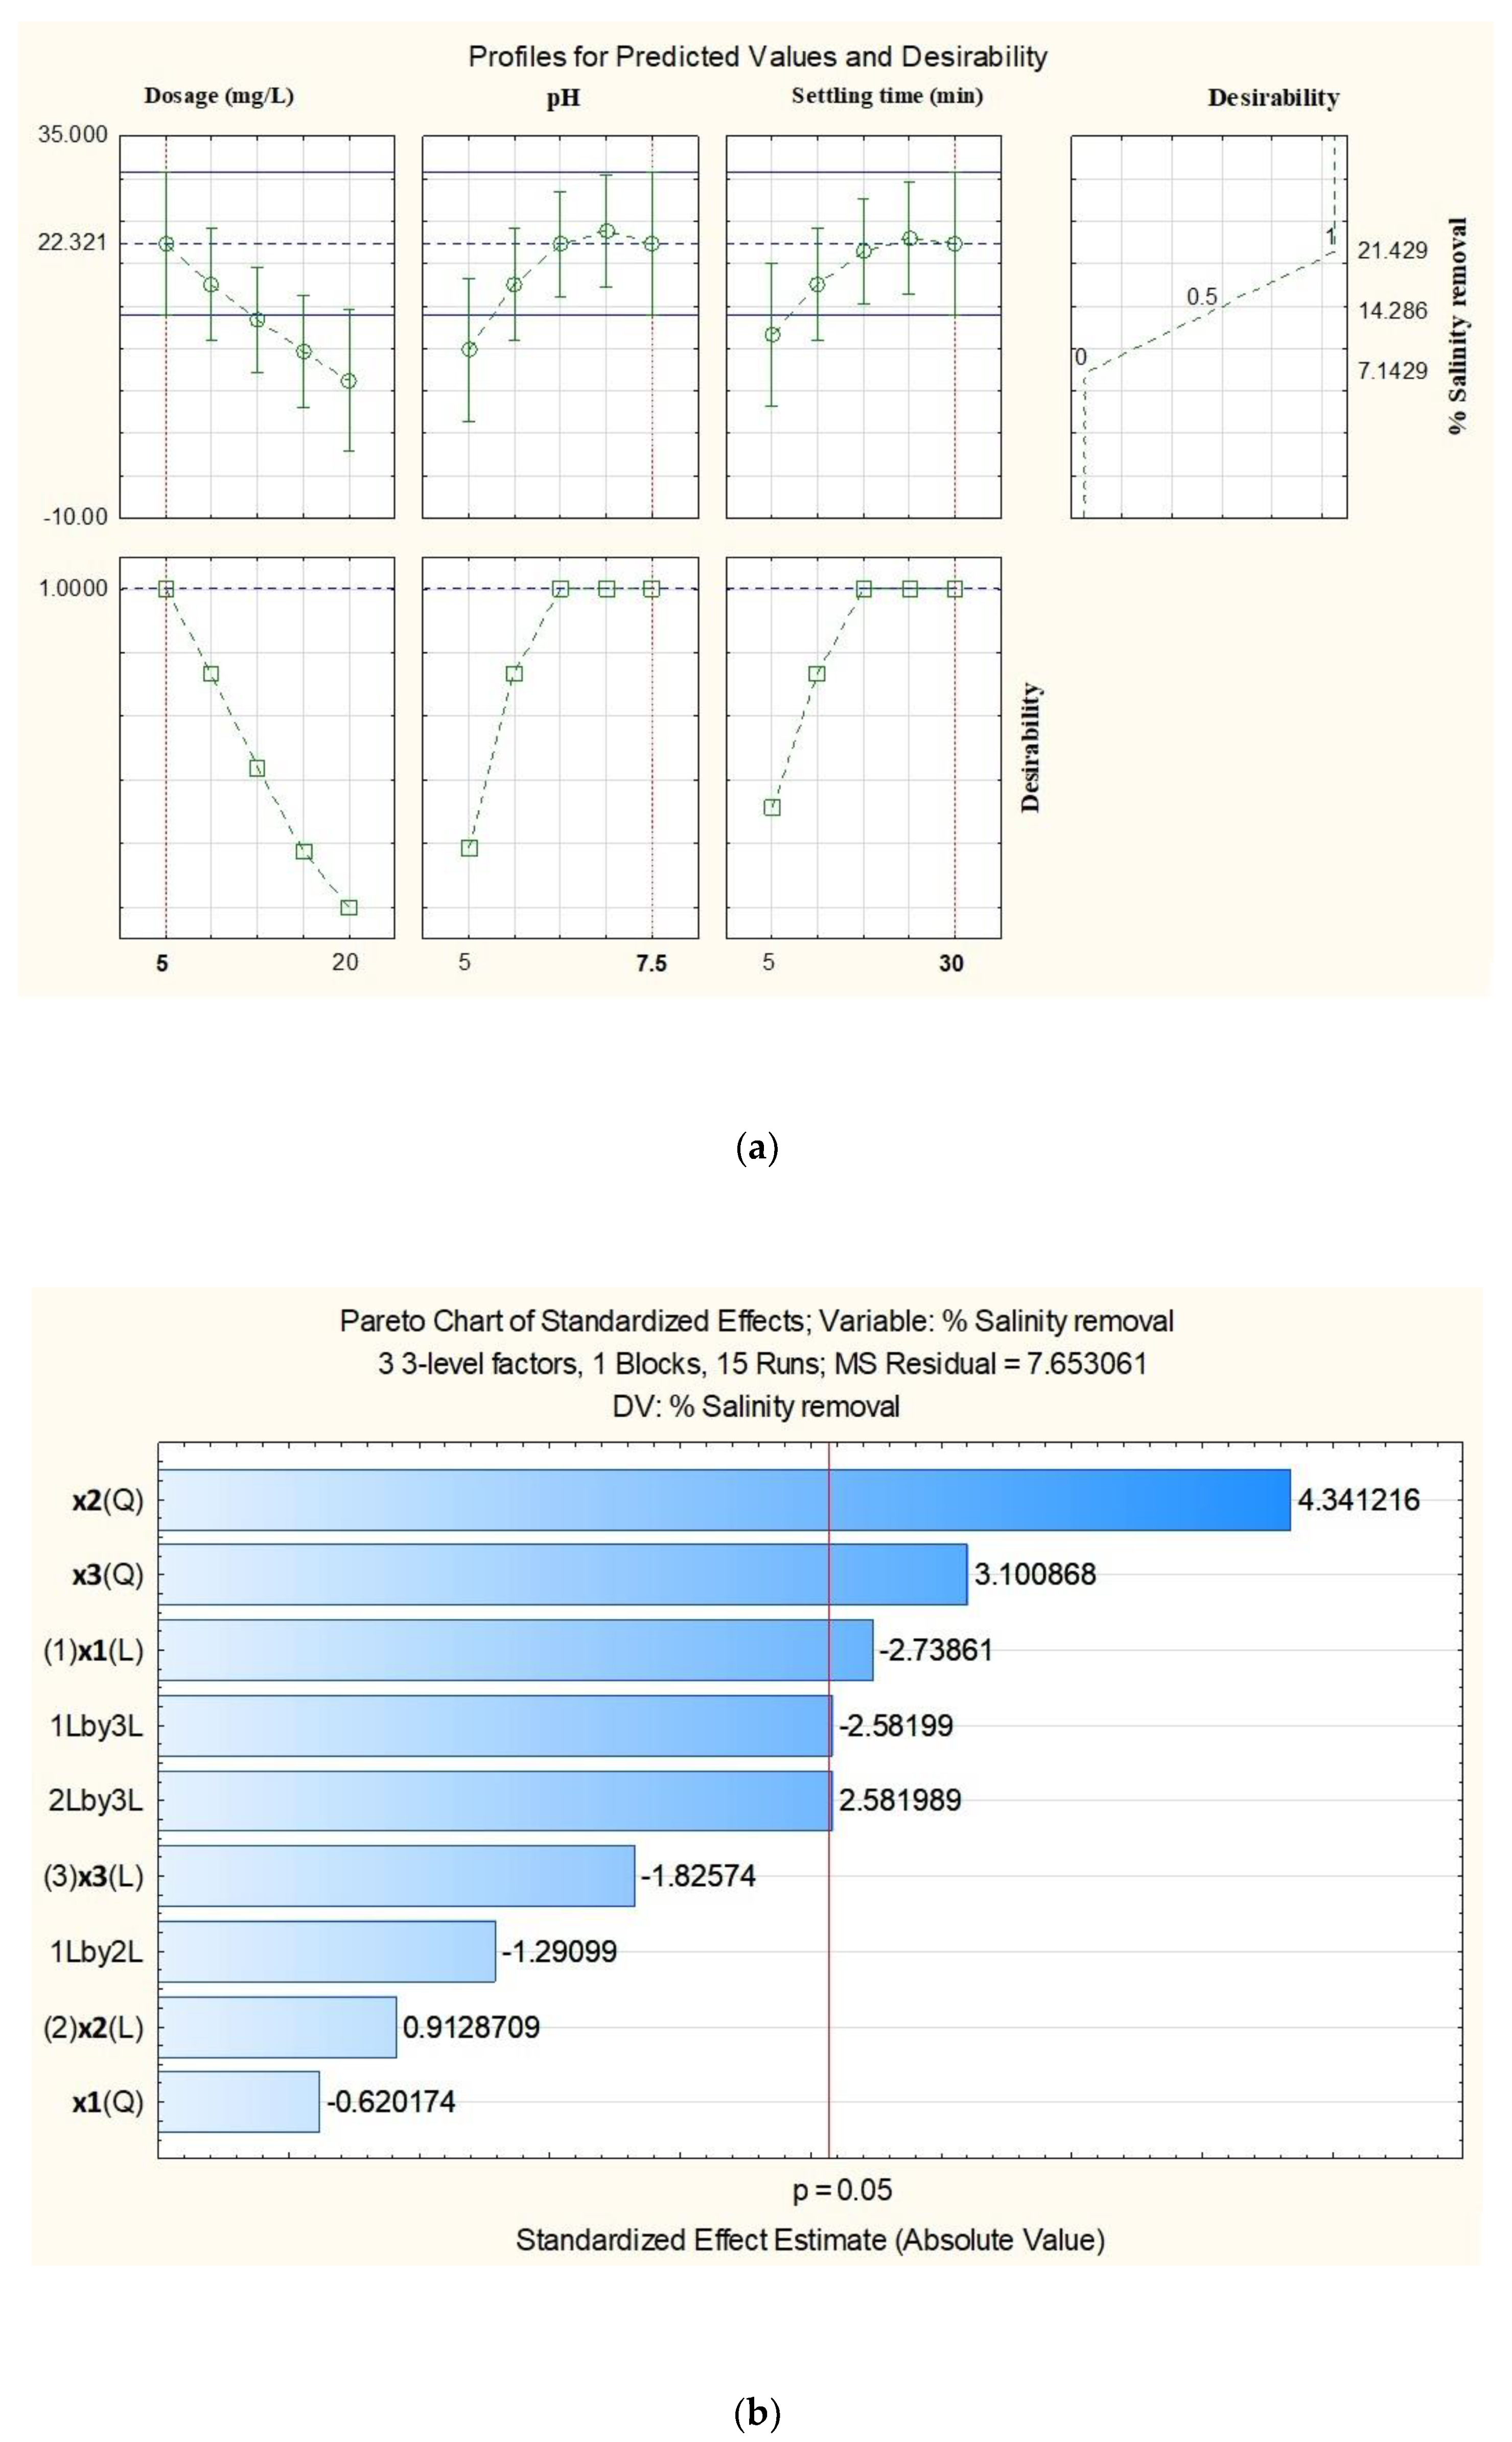
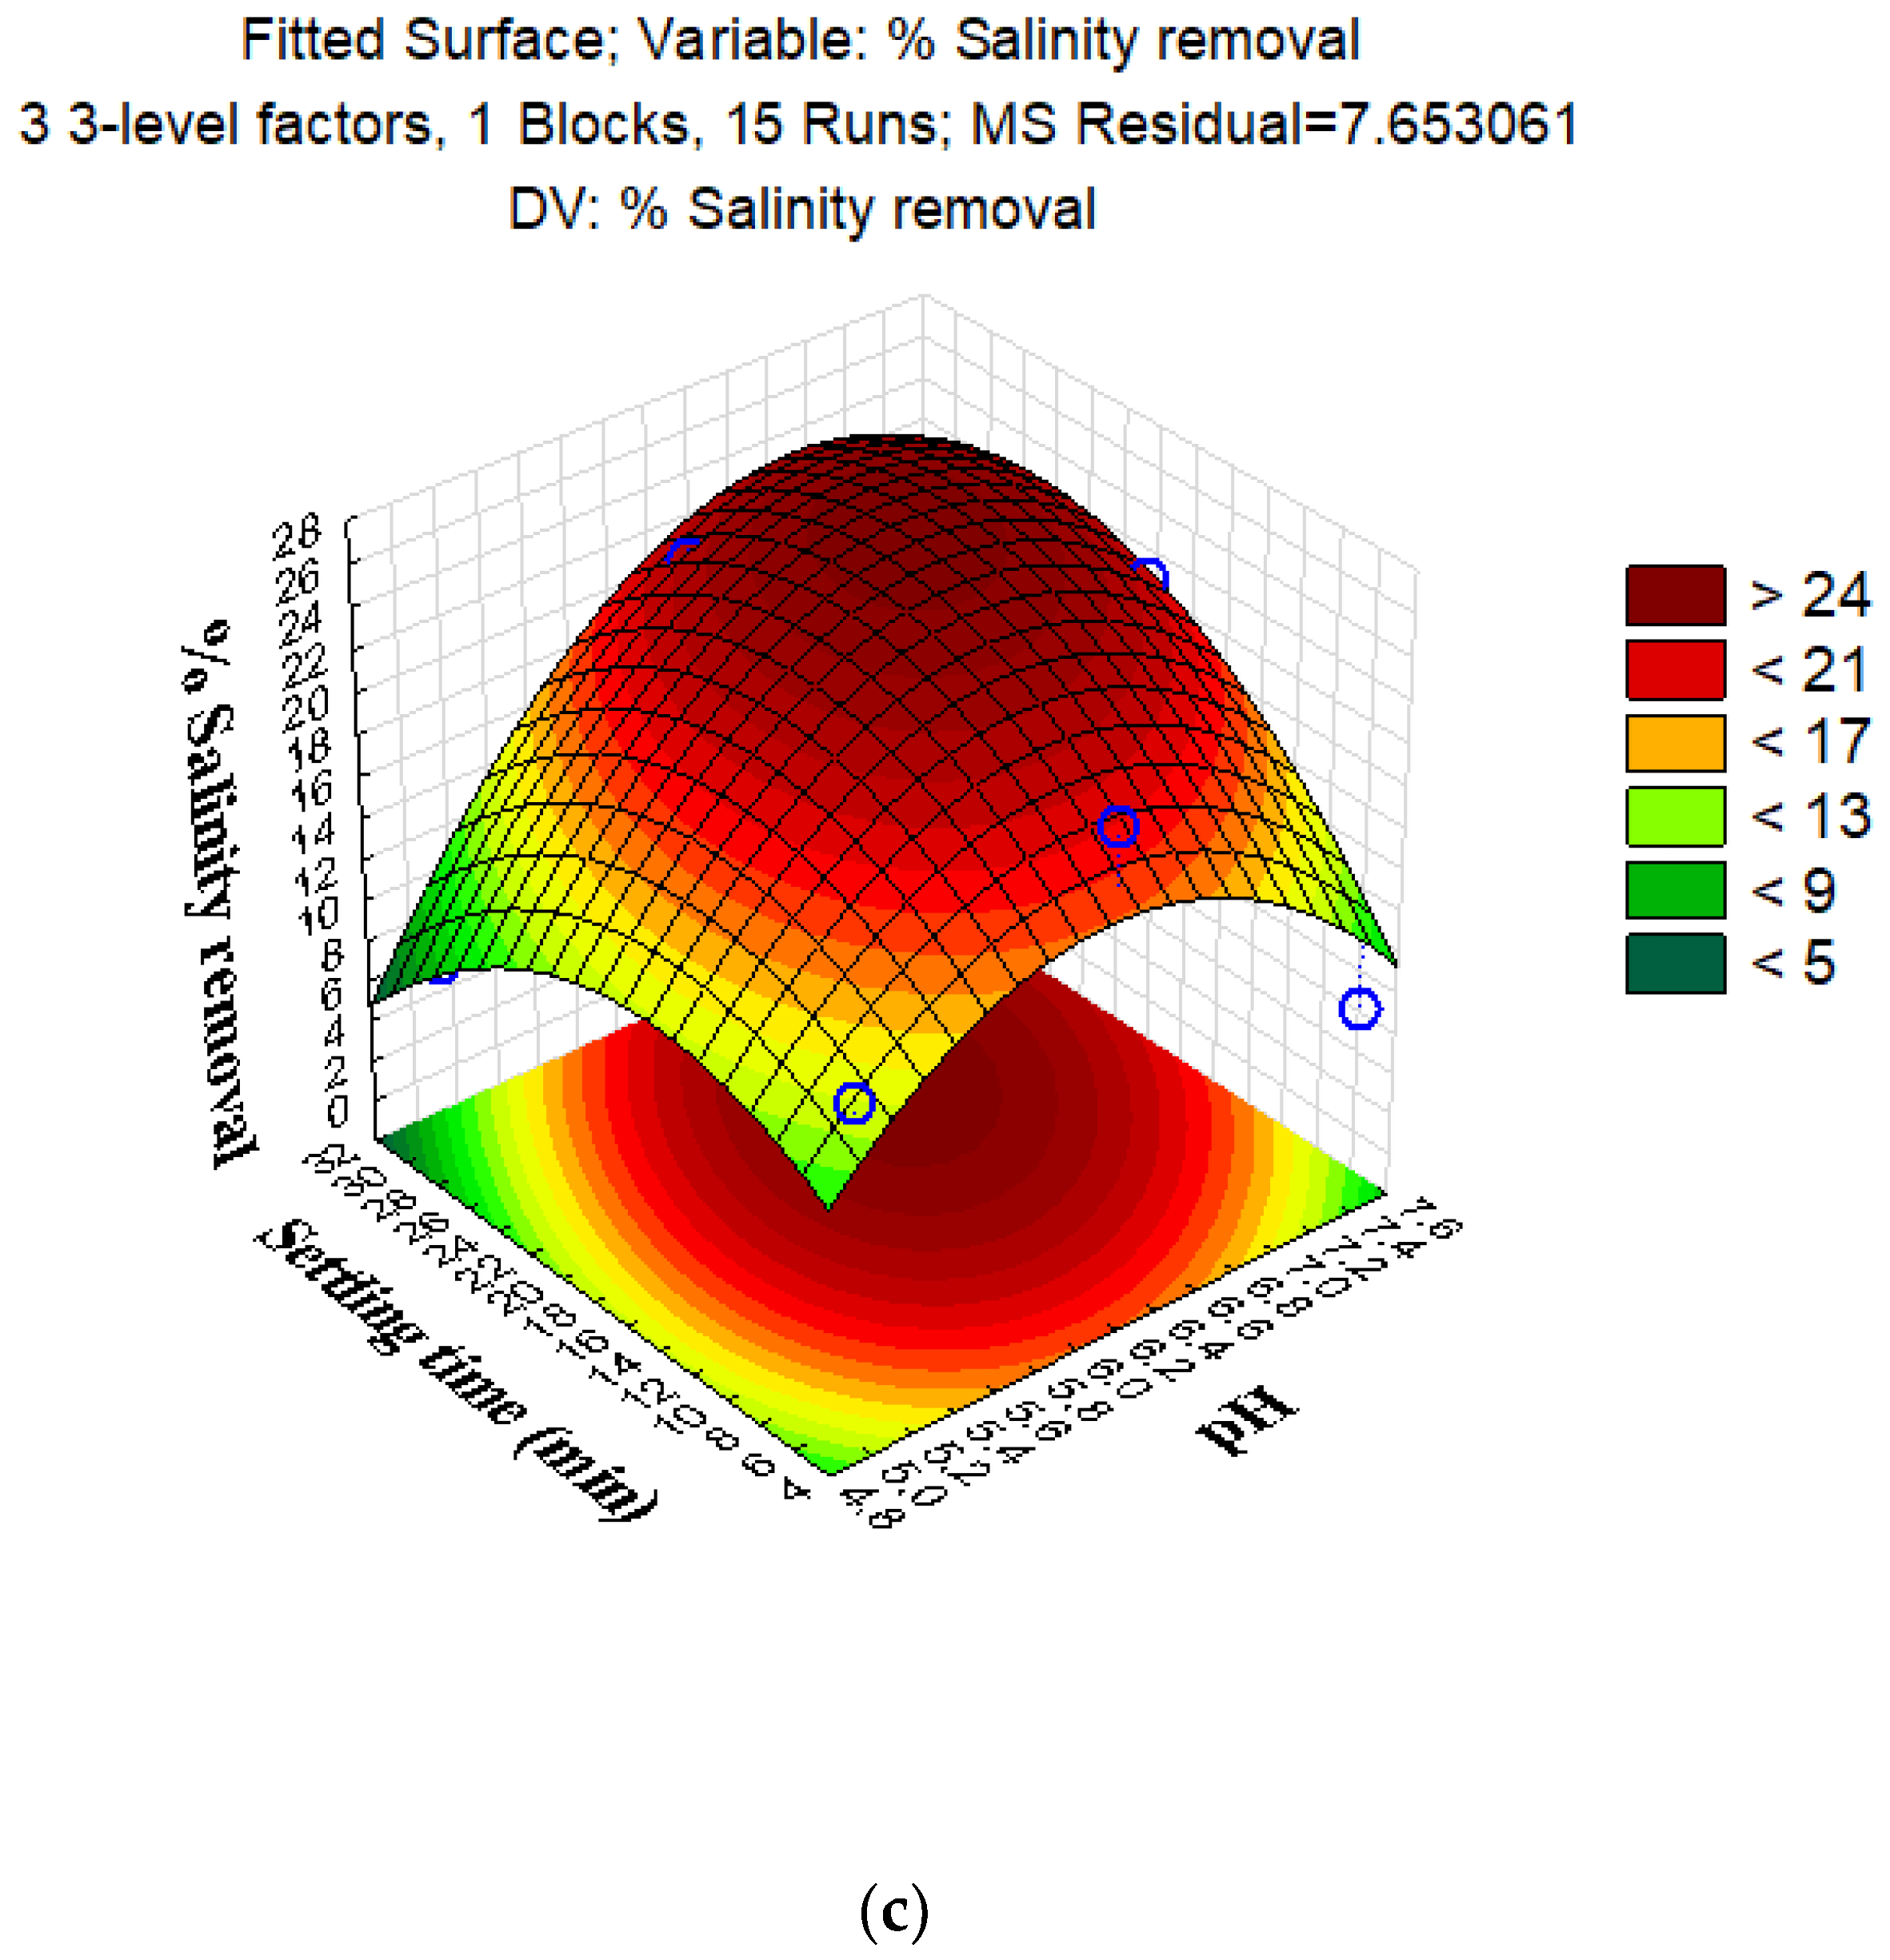
4.2.2. Percentage Salinity Removal Using Chitosan from Carapace of M. rosenbergii
| Source | DF | Adj SS | Adj MS | F-Value | p-Value |
|---|---|---|---|---|---|
| Model | 9 | 417.672 | 46.408 | 6.06 | 0.031 Sig. |
| Linear | 3 | 89.304 | 29.768 | 3.89 | 0.089 |
| X1 | 1 | 57.406 | 57.406 | 7.50 | 0.041 Sig. |
| X2 | 1 | 6.372 | 6.372 | 0.83 | 0.403 |
| X3 | 1 | 25.526 | 25.526 | 3.33 | 0.127 |
| Square | 3 | 213.450 | 71.150 | 9.29 | 0.017 Sig. |
| X1 × X1 | 1 | 2.949 | 2.949 | 0.39 | 0.562 |
| X2 × X2 | 1 | 144.173 | 144.173 | 18.83 | 0.007 Sig. |
| X3 × X3 | 1 | 73.652 | 73.652 | 9.62 | 0.027 Sig. |
| 2-Way Interaction | 3 | 114.918 | 38.306 | 5.00 | 0.058 |
| X1 × X2 | 1 | 12.745 | 12.745 | 1.66 | 0.253 |
| X1 × X3 | 1 | 51.051 | 51.051 | 6.67 | 0.049 Sig. |
| X2 × X3 | 1 | 51.122 | 51.122 | 6.68 | 0.049 Sig. |
| Error | 5 | 38.288 | 7.658 | ||
| Lack-of-Fit | 3 | 38.288 | 12.763 | 0.00 | 0.058 Not Sig. |
| Pure Error | 2 | 0.000 | 0.000 | ||
| Total | 14 | 455.961 | |||
| R2 | 91.60 | ||||
| R2 Adj. | 76.49 |
4.2.3. Validation of the Adequacy of Models for Turbidity and Salinity Removals
5. Conclusions
Author Contributions
Funding
Institutional Review Board Statement
Informed Consent Statement
Data Availability Statement
Conflicts of Interest
References
- Xuan, B.B.; Sandorf, E.D.; Ngoc, Q.T.K. Stakeholder perceptions towards sustainable shrimp aquaculture in Vietnam. J. Environ. Manag. 2021, 290, 112585. [Google Scholar] [CrossRef] [PubMed]
- Li, J.; Li, W.; Liu, K.; Guo, Y.; Ding, C.; Han, J.; Li, P. Global review of macrolide antibiotics in the aquatic environment: Sources, occurrence, fate, ecotoxicity, and risk assessment. J. Hazard. Mater. 2022, 439, 129628. [Google Scholar] [CrossRef] [PubMed]
- Hesni, M.A.; Hedayati, S.A.; Qadermarzi, A.; Pouladi, M.; Zangiabadi, S.; Naqshbandi, N. Comparison ability of algae and nanoparticles on nitrate and phosphate removal from aquaculture wastewater. Environ. Health Eng. Manag. 2019, 6, 171–177. [Google Scholar] [CrossRef]
- Vijayaraghavan, K.; Ahmad, D.; Bin Fadzin, T.S. In situ hypochlorous acid generation for the treatment of brackish shrimp aquaculture wastewater. Aquac. Res. 2008, 39, 449–456. [Google Scholar] [CrossRef]
- Strauch, S.M.; Wenzel, L.C.; Bischoff, A.; Dellwig, O.; Klein, J.; Schüch, A.; Wasenitz, B.; Palm, H.W. Commercial african catfish (clarias gariepinus) recirculating aquaculture systems: Assessment of element and energy pathways with special focus on the phosphorus cycle. Sustainability 2018, 10, 1805. [Google Scholar] [CrossRef] [Green Version]
- Litu, L.; Ciobanu, G.; Cîmpeanu, S.M.; Kotova, O.; Ciocinta, R.; Bucur, D.; Harja, M. Comparative study between flocculation-coagulation processesin raw/wastewater treatment. AgroLife Sci. J. 2019, 8, 139–145. [Google Scholar]
- Yousefi, S.A.; Nasser, M.S.; Hussein, I.A.; Benamor, A. Enhancement of flocculation and dewaterability of a highly stable activated sludge using a hybrid system of organic coagulants and polyelectrolytes. J. Water Process Eng. 2020, 35, 101237. [Google Scholar] [CrossRef]
- Gautam, S.; Arora, A.S.; Singh, A.K.; Ekka, P.; Daniel, H.; Gokul, B.; Toppo, S.; Chockalingam, P.; Kumar, H.; Lyngdoh, J.F. Coagulation influencing parameters investigation on textile industry discharge using Strychnos potatorum seed powders. Environ. Dev. Sustain. 2020, 23, 5666–5673. [Google Scholar] [CrossRef]
- Pourabdollah, K. Simultaneous ε-Keggin Al13 chloride salt and anionic polyacrylamide coagulation-flocculation system for agglomeration of trimetallic Cr-Ni-Fe doped core-shell microspheres of graphitized coke. Chem. Eng. J. 2021, 411, 128583. [Google Scholar] [CrossRef]
- Zhuang, J.; Qi, Y.; Yang, H.; Li, H.; Shi, T. Preparation of polyaluminum zirconium silicate coagulant and its performance in water treatment. J. Water Process Eng. 2021, 41, 102023. [Google Scholar] [CrossRef]
- Amran, A.H.; Syamimi Zaidi, N.; Muda, K.; Wai Loan, L. Effectiveness of Natural Coagulant in Coagulation Process: A Review. Int. J. Eng. Technol. 2018, 7, 34–37. Available online: www.sciencepubco.com/index.php/ (accessed on 29 January 2022). [CrossRef] [Green Version]
- Picos-Corrales, L.A.; Sarmiento-Sánchez, J.I.; Ruelas-Leyva, J.P.; Crini, G.; Hermosillo-Ochoa, E.; Gutierrez-Montes, J.A. Environment-Friendly Approach toward the Treatment of Raw Agricultural Wastewater and River Water via Flocculation Using Chitosan and Bean Straw Flour as Bioflocculants. ACS Omega 2020, 5, 3943–3951. [Google Scholar] [CrossRef]
- Chae, K.-S.; Shin, C.-S.; Shin, W.-S. Characteristics of cricket (Gryllus bimaculatus) chitosan and chitosan-based nanoparticles. Food Sci. Biotechnol. 2018, 27, 631–639. [Google Scholar] [CrossRef]
- Iber, B.T.; Kasan, N.A.; Torsabo, D.; Omuwa, J.W. A Review of Various Sources of Chitin and Chitosan in Nature. J. Renew. Mater. 2022, 10, 1097–1123. [Google Scholar] [CrossRef]
- Mat Zin, M.I.; Jimat, D.N.; Wan Nawawi, W.M.F. Physicochemical properties of fungal chitin nanopaper from shiitake (L. edodes), enoki (F. velutipes) and oyster mushrooms (P. ostreatus). Carbohydr. Polym. 2022, 281, 119038. [Google Scholar] [CrossRef]
- Abidin, N.Z.; Kormin, F.; Abidin, N.Z.; Anuar, N.M.; Abu Bakar, M. The Potential of Insects as Alternative Sources of Chitin: An Overview on the Chemical Method of Extraction from Various Sources. Int. J. Mol. Sci. 2020, 21, 4978. [Google Scholar] [CrossRef]
- Kaya, M.; Baran, T.; Mentes, A.; Asaroglu, M.; Sezen, G.; Tozak, K.O. Extraction and Characterization of α-Chitin and Chitosan from Six Different Aquatic Invertebrates. Food Biophys. 2014, 9, 145–157. [Google Scholar] [CrossRef]
- Da Silva Lucas, A.J.; Oreste, E.Q.; Costa, H.L.G.; López, H.M.; Saad, C.D.M.; Prentice, C. Extraction, physicochemical characterization, and morphological properties of chitin and chitosan from cuticles of edible insects. Food Chem. 2021, 343, 128550. [Google Scholar] [CrossRef]
- El Knidri, H.; Belaabed, R.; Addaou, A.; Laajeb, A.; Lahsini, A. Extraction, chemical modification and characterization of chitin and chitosan. Int. J. Biol. Macromol. 2018, 120, 1181–1189. [Google Scholar] [CrossRef]
- Silva, L.C.; Lopes, B.; Pontes, M.J.; Blanquet, I.; Segatto, M.E.; Marques, C. Fast decision-making tool for monitoring recirculation aquaculture systems based on a multivariate statistical analysis. Aquaculture 2021, 530, 735931. [Google Scholar] [CrossRef]
- Mohan, K.; Ganesan, A.R.; Muralisankar, T.; Jayakumar, R.; Sathishkumar, P.; Uthayakumar, V.; Chandirasekar, R.; Revathi, N. Recent insights into the extraction, characterization, and bioactivities of chitin and chitosan from insects. Trends Food Sci. Technol. 2020, 105, 17–42. [Google Scholar] [CrossRef] [PubMed]
- Mohan, K.; Ganesan, A.R.; Ezhilarasi, P.; Kondamareddy, K.K.; Rajan, D.K.; Sathishkumar, P.; Rajarajeswaran, J.; Conterno, L. Green and eco-friendly approaches for the extraction of chitin and chitosan: A review. Carbohydr. Polym. 2022, 287, 119349. [Google Scholar] [CrossRef]
- Manyatshe, A.; Cele, Z.E.; Balogun, M.O.; Nkambule, T.T.; Msagati, T.A. Lignocellulosic derivative-chitosan biocomposite adsorbents for the removal of soluble contaminants in aqueous solutions—Preparation, characterization and applications. J. Water Process Eng. 2022, 47, 102654. [Google Scholar] [CrossRef]
- Godeau, X.Y.; Andrianandrasana, F.J.; Volkova, O.; Szczepanski, C.R.; Zenerino, A.; Montreuil, O.; Godeau, R.-P.; Kuzhir, P.; Godeau, G. Investigation on dung beetle’s (Heliocopris Hope, 1838) chitosan valorisation for hydrogel 3D printing. Int. J. Biol. Macromol. 2022, 199, 172–180. [Google Scholar] [CrossRef] [PubMed]
- Rahayu, A.P.; Islami, A.F.; Saputra, E.; Sulmartiwi, L.; Rahmah, A.U.; Kurnia, K.A. The impact of the different types of acid solution on the extraction and adsorption performance of chitin from shrimp shell waste. Int. J. Biol. Macromol. 2022, 194, 843–850. [Google Scholar] [CrossRef]
- Pădure, C.-C.C.; Apetroaei, M.R.; Schroder, V.; Rău, I.; Schroder, V. Characterization of chitosan extracted from different romanian black sea crustaceans. UPB Sci. Bull. Ser. B Chem. Mater. Sci. 2018, 80, 13–24. [Google Scholar]
- Hassan, L.S.; Abdullah, N.; Abdullah, S.; Ghazali, S.R.; Sobri, N.A.M.; Hashim, N.; Yahya, N.A.M.; Muslim, W.M.N. The Effectiveness of Chitosan Extraction from Crustaceans’ Shells as a natural coagulant. J. Physics Conf. Ser. 2022, 2266, 012002. [Google Scholar] [CrossRef]
- Ribeiro, T.M.H.; dos Santos, M.C. Chitin Adsorbents to Wastewater Treatment. In Nanomaterials for Eco-friendly Applications; Springer: Berlin/Heidelberg, Germany, 2019; pp. 131–140. [Google Scholar] [CrossRef]
- Renault, F.; Sancey, B.; Badot, P.-M.; Crini, G. Chitosan for coagulation/flocculation processes—An eco-friendly approach. Eur. Polym. J. 2009, 45, 1337–1348. [Google Scholar] [CrossRef]
- Turunen, J.; Karppinen, A.; Ihme, R. Effectiveness of biopolymer coagulants in agricultural wastewater treatment at two contrasting levels of pollution. SN Appl. Sci. 2019, 1, 210. [Google Scholar] [CrossRef] [Green Version]
- Czemierska, M.; Szcześ, A.; Jarosz-Wilkołazka, A. Physicochemical factors affecting flocculating properties of the proteoglycan isolated from Rhodococcus opacus. Biophys. Chem. 2021, 277, 106656. [Google Scholar] [CrossRef]
- Trinh, T.K.; Kang, L.S. Response surface methodological approach to optimize the coagulation–flocculation process in drinking water treatment. Chem. Eng. Res. Des. 2011, 89, 1126–1135. [Google Scholar] [CrossRef]
- Reghioua, A.; Barkat, D.; Jawad, A.H.; Abdulhameed, A.S.; Al-Kahtani, A.A.; Alothman, Z.A. Parametric optimization by Box–Behnken design for synthesis of magnetic chitosan-benzil/ZnO/Fe3O4 nanocomposite and textile dye removal. J. Environ. Chem. Eng. 2021, 9, 105166. [Google Scholar] [CrossRef]
- Adesina, O.A.; Abdulkareem, F.; Yusuff, A.S.; Lala, M.; Okewale, A. Response surface methodology approach to optimization of process parameter for coagulation process of surface water using Moringa oleifera seed. S. Afr. J. Chem. Eng. 2019, 28, 46–51. [Google Scholar] [CrossRef]
- Prasad, R.K. Color removal from distillery spent wash through coagulation using Moringa oleifera seeds: Use of optimum response surface methodology. J. Hazard. Mater. 2009, 165, 804–811. [Google Scholar] [CrossRef] [PubMed]
- Iber, B.T.; Torsabo, D.; Chik, C.E.N.C.E.; Wahab, F.; Sheikh Abdullah, S.R.; Abu Hassan, H.; Kasan, N.A. The impact of re-ordering the conventional chemical steps on the production and characterization of natural chitosan from biowaste of Black Tiger Shrimp, Penaeus monodon. J. Sea Res. 2022, 190, 102306. [Google Scholar] [CrossRef]
- AOAC. Official Methods of Analysis, 17th ed.; Methods 925.10, 65.17, 974.24, 992.16; The Association of Official Analytical Chemists: Gaithersburg, MD, USA, 2000. [Google Scholar]
- Adekanmi, A.A.; Adekanmi, S.A.; Adekanmi, O.S.; Adekanmi, O. Different Processing Sequential Protocols for Extraction, Quantification and Characterization of Chitosan from Cray Fish. IJEAIS 2020, 4, 47–61. Available online: www.ijeais.org (accessed on 1 December 2022).
- Ocloo, F.C.K.; Quayson, E.; Adu-Gyamfi, A.; Quarcoo, E.; Asare, D.; Serfor-Armah, Y.; Woode, B. Physicochemical and functional characteristics of radiation-processed shrimp chitosan. Radiat. Phys. Chem. 2011, 80, 837–841. [Google Scholar] [CrossRef]
- Abideen, Z.U.; Ghafoor, M.; Munir, K.; Saqib, M.; Ullah, A.; Zia, T.; Tariq, S.A.; Ahmed, G.; Zahra, A. Uncertainty assisted robust tuberculosis identification with bayesian convolutional neural networks. IEEE Access 2020, 8, 22812–22825. [Google Scholar] [CrossRef]
- Ahing, F.A.; Wid, N. Extraction and Characterization of Chitosan from Shrimp Shell Waste in Sabah. Trans. Sci. Technol. 2016, 3, 227–237. Available online: http://transectscience.org/ (accessed on 1 September 2022).
- Kumari, S.; Annamareddy, S.H.K.; Abanti, S.; Rath, P.K. Physicochemical properties and characterization of chitosan synthesized from fish scales, crab and shrimp shells. Int. J. Biol. Macromol. 2017, 104, 1697–1705. [Google Scholar] [CrossRef]
- Acosta-Ferreira, S.; Castillo, O.S.; Madera-Santana, J.T.; A Mendoza-García, D.; Núñez-Colín, C.A.; Grijalva-Verdugo, C.; Villa-Lerma, A.G.; Morales-Vargas, A.T.; Rodríguez-Núñez, J.R. Production and physicochemical characterization of chitosan for the harvesting of wild microalgae consortia. Biotechnol. Rep. 2020, 28, e00554. [Google Scholar] [CrossRef]
- Anand, M.; Kalaivani, R.; Maruthupandy, M.; Kumaraguru, A.K.; Suresh, S. Extraction and Characterization of Chitosan from Marine Crab and Squilla Collected from the Gulf of Mannar Region, South India. J. Chitin Chitosan Sci. 2014, 2, 280–287. [Google Scholar] [CrossRef]
- Boudouaia, N.; Bengharez, Z.; Jellali, S. Preparation and characterization of chitosan extracted from shrimp shells waste and chitosan film: Application for Eriochrome black T removal from aqueous solutions. Appl. Water Sci. 2019, 9, 91. [Google Scholar] [CrossRef] [Green Version]
- Pinotti, A.; Bevilacqua, A.; Zaritzky, N. Optimization of the flocculation stage in a model system of a food emulsion waste using chitosan as polyelectrolyte. J. Food Eng. 1997, 32, 69–81. [Google Scholar] [CrossRef]
- Ariffin, M.; Hassan, A.; Li, T.P.; Noor, Z.Z. Coagulation and flocculation treatment of wastewater in textile industry using chitosan. J. Chem. Nat. Resour. Eng. 2008, 4, 43–53. [Google Scholar]
- Chua, S.-C.; Chong, F.-K.; Malek, M.A.; Mustafa, M.R.U.; Ismail, N.; Sujarwo, W.; Lim, J.-W.; Ho, Y.-C. Optimized Use of Ferric Chloride and Sesbania Seed Gum (SSG) as Sustainable Coagulant Aid for Turbidity Reduction in Drinking Water Treatment. Sustainability 2020, 12, 2273. [Google Scholar] [CrossRef] [Green Version]
- Goularte, N.F.; Kallem, T.; Cegelski, L. Chemical and Molecular Composition of the Chrysalis Reveals Common Chitin-Rich Structural Framework for Monarchs and Swallowtails: Chemical and Molecular Composition of the Chrysalis. J. Mol. Biol. 2022, 434, 167456. [Google Scholar] [CrossRef]
- Wang, Y.; Yang, Y.; Wang, R.; Zhu, Y.; Yang, P.; Lin, Z.; Wang, Z.; Cong, W. Effectively inhibiting the degradation of chitin during extraction from crustacean waste via a novel deep eutectic solvent aqueous solution. Process Biochem. 2022, 121, 142–151. [Google Scholar] [CrossRef]
- Zaghbib, I.; Arafa, S.; Hassouna, M. Biological, Functional and Physico-Chemical Characterization of Chitosan Extracted From Blue Crab (Portunus segnis) Shell Waste by Chemical Method. Am. Acad. Sci. Res. J. Eng. Technol. Sci. 2022, 85, 100–115. [Google Scholar]
- Ibitoye, B.E.; Lokman, I.H.; Hezmee, M.N.M.; Goh, Y.M.; Zuki, A.B.Z.; Jimoh, A.A. Extraction and physicochemical characterization of chitin and chitosan isolated from house cricket. Biomed. Mater. 2018, 13, 025009. [Google Scholar] [CrossRef] [Green Version]
- Lee, P.S.; Jung, S.M. Quantitative analysis of microplastics coagulation-removal process for clean sea salt production Keywords Microplastic · Sea salt · Ionic coagulant · Silane coagulant · Fourier transform infrared spectroscopy. Int. J. Environ. Sci. Technol. 2022, 19, 5205–5216. [Google Scholar] [CrossRef]
- Rasweefali, M.; Sabu, S.; Sunooj, K.; Sasidharan, A.; Xavier, K.M. Consequences of chemical deacetylation on physicochemical, structural and functional characteristics of chitosan extracted from deep-sea mud shrimp. Carbohydr. Polym. Technol. Appl. 2021, 2, 100032. [Google Scholar] [CrossRef]
- Fadlaoui, S.; Elasri, O.; Mohammed, L.; Sihame, A.; Omari, A.; Melhaoui, M. Isolation and characterization of chitin from shells of the freshwater crab potamon algeriense. Prog. Chem. Appl. Chitin Deriv. 2019, 24, 23–35. [Google Scholar] [CrossRef]
- Ali, M.; Shakeel, M.; Mehmood, K. Extraction and characterization of high purity chitosan by rapid and simple techniques from mud crabs taken from Abbottabad. Pak. J. Pharm. Sci. 2019, 32, 171–175. [Google Scholar] [PubMed]
- Hahn, T.; Roth, A.; Ji, R.; Schmitt, E.; Zibek, S. Chitosan production with larval exoskeletons derived from the insect protein production. J. Biotechnol. 2020, 310, 62–67. [Google Scholar] [CrossRef]
- Hao, G.; Hu, Y.; Shi, L.; Chen, J.; Cui, A.; Weng, W.; Osako, K. Physicochemical characteristics of chitosan from swimming crab (Portunus trituberculatus) shells prepared by subcritical water pretreatment. Sci. Rep. 2021, 11, 1646. [Google Scholar] [CrossRef]
- Santos, V.P.; Maia, P.; Alencar, N.D.S.; Farias, L.; Andrade, R.F.S.; Souza, D.; Ribaux, D.R.; Franco, L.D.O.; Campos-Takaki, G.M. Recovery of chitin and chitosan from shrimp waste with microwave technique and versatile application. Arq. Inst. Biol. 2019, 86, 1–7. [Google Scholar] [CrossRef]
- Kaya, M.; Baublys, V.; Šatkauskienė, I.; Akyuz, B.; Bulut, E.; Tubelytė, V. First chitin extraction from Plumatella repens (Bryozoa) with comparison to chitins of insect and fungal origin. Int. J. Biol. Macromol. 2015, 79, 126–132. [Google Scholar] [CrossRef]
- Oh, K.-T.; Kim, Y.-J.; Nguyen, V.N.; Jung, W.-J.; Park, R.-D. Demineralization of crab shell waste by Pseudomonas aeruginosa F722. Process Biochem. 2007, 42, 1069–1074. [Google Scholar] [CrossRef]
- Renuka, V.; Ravishankar, C.N.R.; Elavarasan, K.; Zynudheen, A.A.; Joseph, T.C. Production and Characterization of Chitosan from Shrimp Shell Waste of Parapeneopsis stylifera. Int. J. Curr. Microbiol. Appl. Sci. 2019, 8, 2076–2083. [Google Scholar] [CrossRef]
- Yuan, Y.; Tan, W.; Zhang, J.; Li, Q.; Guo, Z. Water-soluble amino functionalized chitosan: Preparation, characterization, antioxidant and antibacterial activities. Int. J. Biol. Macromol. 2022, 217, 969–978. [Google Scholar] [CrossRef]
- William, W.; Wid, N. Comparison of extraction sequence on yield and physico-chemical characteristic of chitosan from shrimp shell waste. In Journal of Physics: Conference Series; IOP Publishing: Bristol, UK, 2019; Volume 1358. [Google Scholar] [CrossRef]
- Azeez, S.; Sathiyaseelan, A.; Jeyaraj, E.R.; Saravanakumar, K.; Wang, M.-H.; Kaviyarasan, V. Extraction of Chitosan with Different Physicochemical Properties from Cunninghamella echinulata (Thaxter) Thaxter for Biological Applications. Appl. Biochem. Biotechnol. 2022, 1–14. [Google Scholar] [CrossRef]
- WHO. Bulk Density and Tapped Density of Powders, 4th ed.; Final text for addition to The International Pharmacopoeia. Document QAS/11.450, FINAL; WHO: Geneva, Switzerland, 2012; p. 6. [Google Scholar]
- Eftaiha, A.F.; El-Barghouthi, M.I.; Rashid, I.S.; Al-Remawi, M.M.; Saleh, A.I.; Badwan, A.A. Compressibility and compactibility studies of chitosan, xanthan gum, and their mixtures. J. Mater. Sci. 2009, 44, 1054–1062. [Google Scholar] [CrossRef]
- Badwan, A.A.; Rashid, I.; Al Omari, M.M.; Darras, F.H. Chitin and Chitosan as Direct Compression Excipients in Pharmaceutical Applications. Mar. Drugs 2015, 13, 1519–1547. [Google Scholar] [CrossRef] [Green Version]
- Szymańska, E.; Winnicka, K. Stability of Chitosan—A Challenge for Pharmaceutical and Biomedical Applications. Mar. Drugs 2015, 13, 1819–1846. [Google Scholar] [CrossRef]
- Avelelas, F.; Horta, A.; Pinto, L.F.; Cotrim Marques, S.; Marques Nunes, P.; Pedrosa, R.; Leandro, S.M. Antifungal and Antioxidant Properties of Chitosan Polymers Obtained from Nontraditional Polybius henslowii Sources. Mar. Drugs 2019, 17, 239. [Google Scholar] [CrossRef] [Green Version]
- Triunfo, M.; Tafi, E.; Guarnieri, A.; Salvia, R.; Scieuzo, C.; Hahn, T.; Zibek, S.; Gagliardini, A.; Panariello, L.; Coltelli, M.B.; et al. Characterization of chitin and chitosan derived from Hermetia illucens, a further step in a circular economy process. Sci. Rep. 2022, 12, 6613. [Google Scholar] [CrossRef]
- Bernabé, P.; Becherán, L.; Cabrera, G.; Nesic, A.; Alburquenque, C.; Tapia, C.V.; Taboada, E.; Alderete, J.B.; Ríos, P.D.L. Chilean crab (Aegla cholchol) as a new source of chitin and chitosan with antifungal properties against Candida spp. Int. J. Biol. Macromol. 2020, 149, 962–975. [Google Scholar] [CrossRef]
- Kumari, S.; Rath, P.K. Extraction and Characterization of Chitin and Chitosan from (Labeo rohit) Fish Scales. Procedia Mater. Sci. 2014, 6, 482–489. [Google Scholar] [CrossRef] [Green Version]
- Carpinteyro-Urban, S.; Torres, L.G. Use of Response Surface Methodology in the Optimization of Coagula-tion-Flocculation of Wastewaters Employing Biopolymers. Int. J. Environ. Res. 2013, 7, 717–726. [Google Scholar]
- Côrtes, S.D.L.; Borsato, D.; Kimura, M.; Moreira, I.; Galão, O.F.; Costa, S.B. Optimisation of fermentation conditions in the production of ethanol from Palmer mango. Semin. Ciências Exatas e Tecnológicas 2018, 39, 34. [Google Scholar] [CrossRef]
- Ghafari, S.; Aziz, H.A.; Isa, M.H.; Zinatizadeh, A.A. Application of response surface methodology (RSM) to optimize coagulation–flocculation treatment of leachate using poly-aluminum chloride (PAC) and alum. J. Hazard. Mater. 2009, 163, 650–656. [Google Scholar] [CrossRef] [PubMed]
- Benouis, K.; Alami, A.; Khalfi, Y.; Guella, S.; Khane, Y. Optimization of Coagulation Parameters for Turbidity Removal Using Box-Behnken model. In Proceedings of the 2nd International Conference on Industry 4.0 and Artificial Intelligence (ICIAI 2021), Sousse, Tunisia, 28–30 November 2021; Volume 175, pp. 114–121. [Google Scholar] [CrossRef]
- Shiraishi, I.S.; Dorte, R.P.; Ribeiro, B.R.; Souza, G.C.; Dekker, R.F.; Maia, L.F.; Barbosa-Dekker, A.M.; Borsato, D.; Evaristo, J.A.; Evaristo, G.P.; et al. Optimization of Laccase Production, and Characterization of Lignin Degradation Products by Fusarium oxysporum JUMAD-053. Orbital Electron. J. Chem. 2021, 13, 404–412. [Google Scholar] [CrossRef]
- Chen, F.; Liu, W.; Pan, Z.; Wang, Y.; Guo, X.; Sun, S.; Jia, R. Characteristics and mechanism of chitosan in flocculation for water coagulation in the Yellow River diversion reservoir. J. Water Process Eng. 2019, 34, 101191. [Google Scholar] [CrossRef]
- Wang, D.; Xie, X.; Tang, W.; Pan, H.; Luo, J. Suitability of Nansha Mangrove Wetland for High Nitrogen Shrimp Pond Wastewater Treatment. Bull. Environ. Contam. Toxicol. 2021, 106, 349–354. [Google Scholar] [CrossRef] [PubMed]
- Khouni, I.; Marrot, B.; Moulin, P.; Ben Amar, R. Decolourization of the reconstituted textile effluent by different process treatments: Enzymatic catalysis, coagulation/flocculation and nanofiltration processes. Desalination 2010, 268, 27–37. [Google Scholar] [CrossRef]
- Shan, T.C.; Al Matar, M.; Makky, E.A.; Ali, E.N. The use of Moringa oleifera seed as a natural coagulant for wastewater treatment and heavy metals removal. Appl. Water Sci. 2017, 7, 1369–1376. [Google Scholar] [CrossRef]
- Hamdy, S.M.; Danial, A.W.; El-Rab, S.M.F.G.; Shoreit, A.A.M.; Hesham, A.E.-L. Production and optimization of bioplastic (Polyhydroxybutyrate) from Bacillus cereus strain SH-02 using response surface methodology. BMC Microbiol. 2022, 22, 183. [Google Scholar] [CrossRef]


| Parameter | Method | Equation | |
|---|---|---|---|
| Chitin and chitosan yield | Chitosan is the weight that remains after chitin has been deacetylated, whereas chitin was measured by comparing weight measurements taken before and after mineral elements and protein were removed from the raw powder [37]. | (1) | |
| (2) | |||
| Percentage moisture | In [37,38] was used the gravimetric method, which makes use of a hot air oven, to determine the moisture content of chitosan. The samples were heated to a consistent weight in an oven at 70 °C. By comparing the differences in weight before and after drying, moisture content was determined. | Moisture (%) | (3) |
| Ash content | One gram of the sample was put in a silica crucible and roasted to 600 °C for five hours in a muffle furnace to determine the sample’s ash concentration. Samples were placed in desiccators after being further cooled to 200 °C. Ash content was calculated using the weights of the crucible and the ash leftover. | (4) | |
| WBC | WBC was measured using the technique described by [39]. A centrifuge tube was filled with 0.5 g of chitosan sample before 10 mL of distilled water was mixed in. To dissolve the chitosan, the liquid was then vortexed for one minute and left at room temperature for 30 min. The tube was then centrifuged for 25 min at 3200 rpm after shaking for 5 s every 10 min. The tube was weighed again to determine the water bound after decantation of the supernatant. | (5) | |
| FBC | Refs. [40,41] assessed the chitosan’s fat-binding capacity (FBC) using a modified method. In order to measure FBC, a centrifuge tube containing 0.5 g of chitosan sample, 10 mL of soybean oil, and 1 min of vortex mixing to disperse the samples was gauged. The mixture was centrifuged at 3000 rpm for 25 min after being held at room temperature for 30 min and shaking for 5 s every 10 min. The supernatant was then drained, and the cylinder was reweighed after that. | (6) | |
| Solubility | Chitosan’s solubility in weak acidic medium was assessed using a modified version of [37,42]’s methods. To create 1% chitosan solution, one gram of chitosan was treated with 1% acetic acid solution. This solution was swirled with a magnetic stirrer at ambient temperature for two hours. The mixture was then centrifuged at 600 rmp for five minutes, and then filtered through Whatman No. 1 filter paper that was preweighed (Wi). The filter paper was reweighed after being further dried at room temperature (Wf). | (7) | |
| where Wi and Wf refer to the initial and final weight of filter paper, while Ws is the weight of substance (chitosan) | |||
| DDA | For FTIR spectra analysis utilizing an I.R. instrument, chitosan samples were made in KBr disks and film (MB- 100, Bomem Hartmann & Braun, Quebec, Canada). Following frequency set to 4000–400 cm−1, DDA was calculated using the technique suggested by [42]. | DDA (%) = | (8) |
| where DDA is the degree of deacetylation; A1655 is the peak area for the band at 1655 cm−1; A3450 is the peak area for the band at 3450 cm−1; and 1.33 is the factor representing the ratio of A1655/A3450 for complete N-acetylated chitosan. | |||
| Bulk density (BD) | According to [43]’s study, the bulk density (BD) of the chitosan samples can be estimated as a function of the mass and volume occupied by the given sample. A chitosan sample weighing 5 grams was put into graduated centrifuge tube, and volume was recorded without shaking. To determine an average volume, this process was performed five times. | (9) | |
| where V is the untapped volume of sample in the centrifuge tube | |||
| Tapped density (TD) | A chitosan dry sample weighing 5 g was inserted in a calibrated centrifuge tube and mixed thoroughly until a consistent volume was achieved in order to determine the tapped density of the material. For all samples, the experiment was run 3 times. | (10) | |
| where Vtap is the volume of the substance in the centrifuge tube after tapping or shaking | |||
| Compressibility | In this investigation, the proportional variation in the volume of the substance in reaction to pressure or a change in mean stress was used to estimate the compressibility of dry powder chitosan. | (11) | |
| where Vo is the unsettled apparent volume, while Vf is the final volume after tapping. | |||
| Hausner ratio (HR) | The frictional tensions between the granules of chitosan are shown by the HR of samples. | (12) | |
| where Dtap and Dbulk are the tapped and bulk densities of the chitosan samples, respectively | |||
| Carr’s index (CI) | CI stands for cohesion index and describes the capacity of the chitosan particles to aggregate. | (13) | |
| where Dtap and Dbulk are the tap and bulk densities of the substance, respectively | |||
| % Inorganic | (14) | ||
| where DM: demineralization | |||
| % Protein | (15) | ||
| where DP: deproteinization | |||
| % Pigment | 100 | (16) | |
| where DC: decoloration | |||
| X-ray diffraction | To determine the crystalline nature of the chitosan, wide-angle X-ray diffraction investigations were performed using a diffractometer XRD (Bruker model D8 ADVANCE), operated at a voltage of 40 V and a current of 30 mA with Cu K radiation (=1.54060). The XRD pattern was captured in a fixed-time mode at ambient temperature in the 2θ range of 9 to 80 degrees [44]. | ||
| SEM | Using a scanning electron microscope (JEOL, JSM-7600 F, Japan), morphological characterization of the granular chitosan surface was carried out at 1000× magnification. Therefore, Chitosan samples’ dimensions, forms, and shapes were examined [45]. | ||
| FTIR | After samples were made in KBr disks and film, infrared spectra of the chitosan samples were acquired using I.R. equipment (MB-100, Bomem Hartmann & Braun, QC, Canada). The range of frequency was 4000–400 cm−1 [46]. | ||
| Parameter | Unit | Value | Environmental Standard |
|---|---|---|---|
| Temperature | °C | 23.82 ± 1.15 | 40 |
| Dissolved oxygen | mg/L | 2.8 ± 2.12 | >3 |
| Salinity | ppt | 13.21 ± 0.44 | |
| Turbidity | NTU | 81 ± 2.22 | <0.15 |
| Total suspended solid | mg/L | 86 ± 3.51 | 50–100 |
| pH | - | 7.95 ± 3.11 | 6.0–9.0 |
| Nitrite (NO2) | mg/L | 1.50 ± 34 | 1 |
| Ammonia (NH3) | mg/L | 0.86 ± 0.55 | 0.25 |
| Phosphate (PO4) | mg/L | 11.37 ± 1.03 | 0.05 |
| Variables | Symbol | Levels of Variation | ||
|---|---|---|---|---|
| −1 | 0 | +1 | ||
| pH | X1 | 5.00 | 6.25 | 7.50 |
| Coagulant dosage (mg/L) | X2 | 5.00 | 12.50 | 20.00 |
| Settling time (min) | X3 | 5.00 | 17.50 | 30.00 |
| Parameters | Mean Values |
|---|---|
| Chitin yield (g) | 11.98 ± 0.49 |
| Percentage chitin yield (%) | 23.79 ± 1.12 |
| Chitosan yield (g) | 10.10 ± 0.02 |
| Percentage chitosan yield (%) | 20.21 ± 0.23 |
| Percentage moisture content (%) | 0.38 ± 0.13 |
| Ash (%) | 12.58 ± 0.51 |
| WBC (%) | 562.33 ± 7.51 |
| FBC (%) | 372.33 ± 3.51 |
| Solubility (%) | 71.23 ± 7.64 |
| Bulk density (g/mL) | 0.25 ± 0.44 |
| Tapped density (g/mL) | 0.32 ± 0.06 |
| Compressibility | 22.01 ± 1.94 |
| Hausner ratio | 1.27 ± 0.05 |
| Carr’s index | 21.02 ± 6.14 |
| Percentage inorganic material (%) | 51.93 ± 4.89 |
| Percentage protein (%) | 18.70 ± 8.26 |
| Percentage pigment (%) | 5.69 ± 3.44 |
| DDA (%) | 85.20 ± 4.49 |
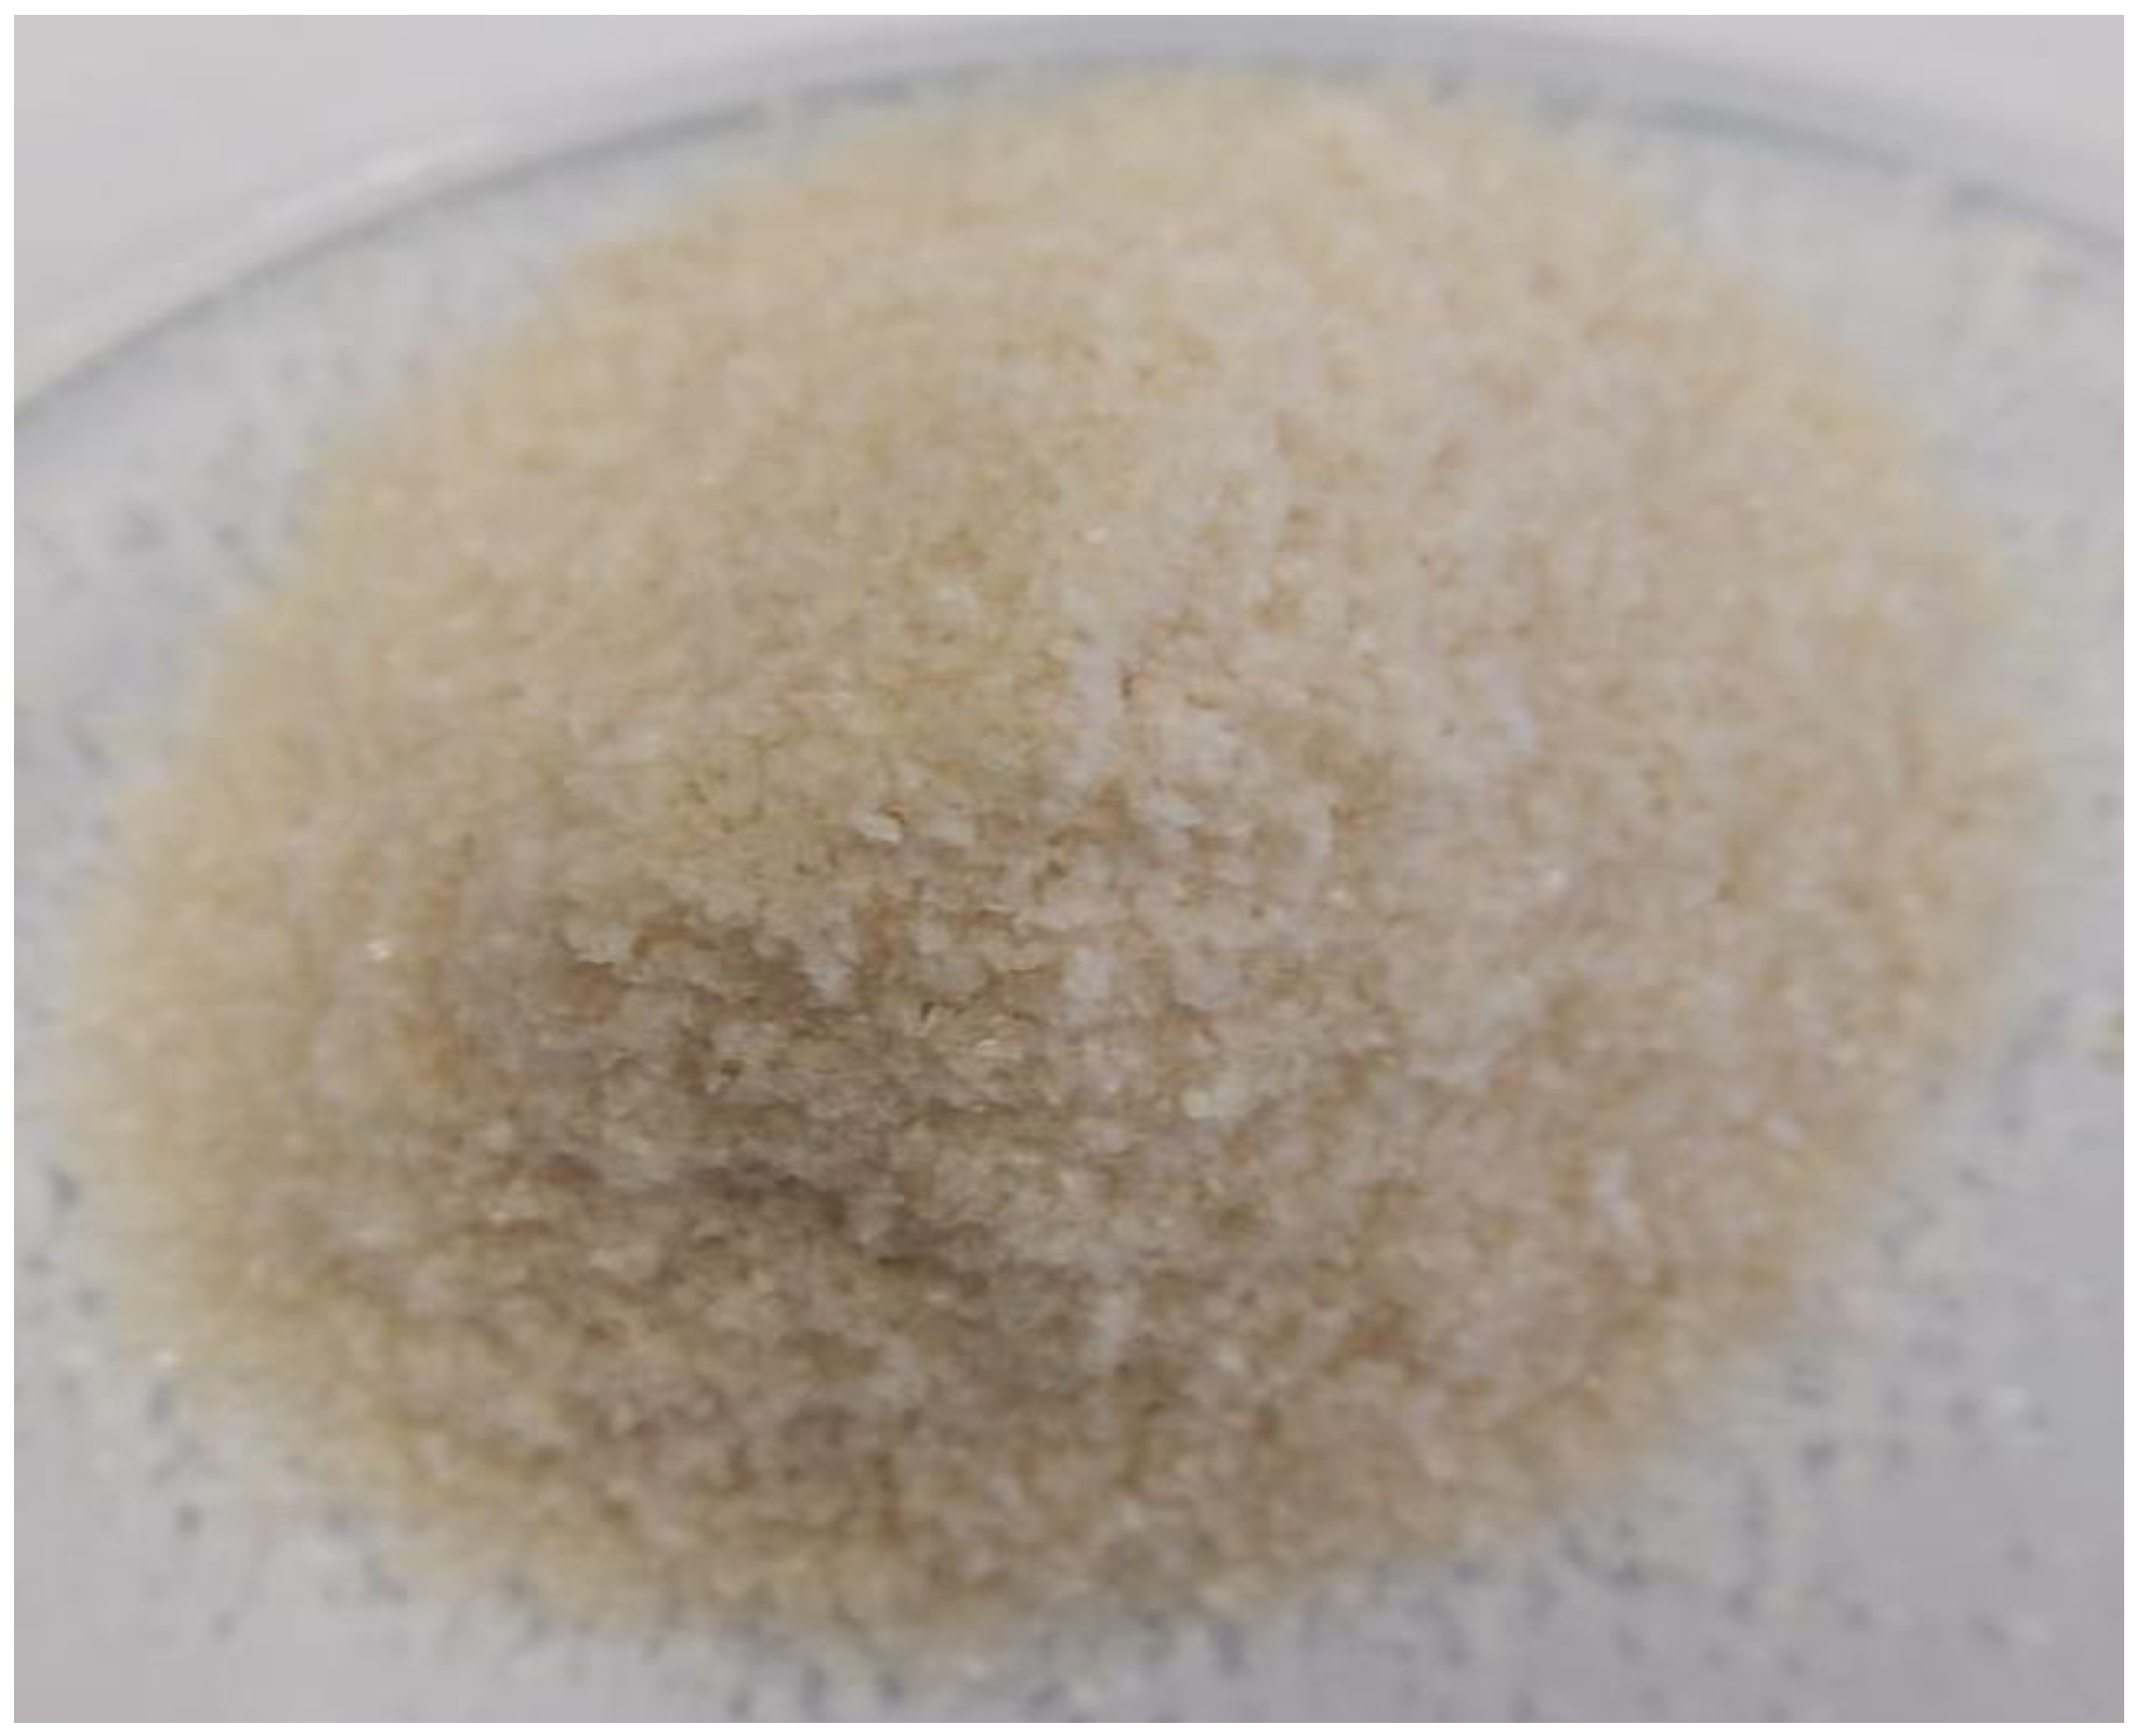
| Color | Pale white |
| Runs | x1 | x2 | x3 | Dosage (mg/L) | pH | Settling Time (Min) | %Turb Removal | %Salinity Removal |
|---|---|---|---|---|---|---|---|---|
| 1 | −1 | −1 | 0 | 5 | 5 | 17.5 | 79.88 | 14.29 |
| 2 | 1 | −1 | 0 | 20 | 5 | 17.5 | 81.27 | 14.29 |
| 3 | −1 | 1 | 0 | 5 | 7.5 | 17.5 | 85.66 | 21.43 |
| 4 | 1 | 1 | 0 | 20 | 7.5 | 17.5 | 82.22 | 14.29 |
| 5 | −1 | 0 | −1 | 5 | 6.25 | 5 | 85.5 | 21.43 |
| 6 | 1 | 0 | −1 | 20 | 6.25 | 5 | 83.9 | 21.43 |
| 7 | −1 | 0 | 1 | 5 | 6.25 | 30 | 84.94 | 21.43 |
| 8 | 1 | 0 | 1 | 20 | 6.25 | 30 | 87.67 | 7.14 |
| 9 | 0 | −1 | −1 | 12.5 | 5 | 5 | 79.74 | 14.29 |
| 10 | 0 | 1 | −1 | 12.5 | 7.5 | 5 | 81.82 | 7.14 |
| 11 | 0 | −1 | 1 | 12.5 | 5 | 30 | 85.2 | 7.14 |
| 12 | 0 | 1 | 1 | 12.5 | 7.5 | 30 | 85.78 | 14.29 |
| 13 | 0 | 0 | 0 | 12.5 | 6.25 | 17.5 | 84.44 | 21.43 |
| 14 | 0 | 0 | 0 | 12.5 | 6.25 | 17.5 | 85.71 | 21.43 |
| 15 | 0 | 0 | 0 | 12.5 | 6.25 | 17.5 | 85.5 | 21.43 |
| Parameter | Predicted | Actual | Difference |
|---|---|---|---|
| % Turbidity removal | 87.67 | 90.80 ± 0.35 | 3.13 |
| % Salinity removal | 21.43 | 22.40 ± 1.80 | 0.97 |
Disclaimer/Publisher’s Note: The statements, opinions and data contained in all publications are solely those of the individual author(s) and contributor(s) and not of MDPI and/or the editor(s). MDPI and/or the editor(s) disclaim responsibility for any injury to people or property resulting from any ideas, methods, instructions or products referred to in the content. |
© 2023 by the authors. Licensee MDPI, Basel, Switzerland. This article is an open access article distributed under the terms and conditions of the Creative Commons Attribution (CC BY) license (https://creativecommons.org/licenses/by/4.0/).
Share and Cite
Iber, B.T.; Torsabo, D.; Chik, C.E.N.C.E.; Wahab, F.; Sheikh Abdullah, S.R.; Abu Hassan, H.; Kasan, N.A. Response Surface Methodology (RSM) Approach to Optimization of Coagulation-Flocculation of Aquaculture Wastewater Treatment Using Chitosan from Carapace of Giant Freshwater Prawn Macrobrachium rosenbergii. Polymers 2023, 15, 1058. https://doi.org/10.3390/polym15041058
Iber BT, Torsabo D, Chik CENCE, Wahab F, Sheikh Abdullah SR, Abu Hassan H, Kasan NA. Response Surface Methodology (RSM) Approach to Optimization of Coagulation-Flocculation of Aquaculture Wastewater Treatment Using Chitosan from Carapace of Giant Freshwater Prawn Macrobrachium rosenbergii. Polymers. 2023; 15(4):1058. https://doi.org/10.3390/polym15041058
Chicago/Turabian StyleIber, Benedict Terkula, Donald Torsabo, Che Engku Noramalina Che Engku Chik, Fachrul Wahab, Siti Rozaimah Sheikh Abdullah, Hassimi Abu Hassan, and Nor Azman Kasan. 2023. "Response Surface Methodology (RSM) Approach to Optimization of Coagulation-Flocculation of Aquaculture Wastewater Treatment Using Chitosan from Carapace of Giant Freshwater Prawn Macrobrachium rosenbergii" Polymers 15, no. 4: 1058. https://doi.org/10.3390/polym15041058