Article

Thin Films of Polyaniline-Based Nanocomposites with CeO2 and WO3 Metal Oxides Applied to the Impedimetric and Capacitive Transducer Stages in Chemical Sensors

by
Beatriz Cotting Rossignatti
1,
Amanda Portes Vieira
1,
Martin Schwellberger Barbosa
2,
Luís Miguel Gomes Abegão
1 and
Hugo José Nogueira Pedroza Dias Mello
1,*
1
Physics Institute, Goiás Federal University, Samambaia Campus, Goiânia 74001-970, GO, Brazil
2
Chemistry Institute, Goiás Federal University, Samambaia Campus, Goiânia 74001-970, GO, Brazil
*
Author to whom correspondence should be addressed.
Polymers 2023, 15(3), 578; https://doi.org/10.3390/polym15030578
Submission received: 9 December 2022 / Revised: 6 January 2023 / Accepted: 19 January 2023 / Published: 22 January 2023
(This article belongs to the Special Issue Polymer Based Electronic Devices and Sensors II)

Abstract

:
There is a recognized need for the development of cost-effective, stable, fast, and optimized novel materials for technological applications. Substantial research has been undertaken on the role of polymeric nanocomposites in sensing applications. However, the use of PANI-based nanocomposites in impedimetric and capacitive electrochemical sensors has yet to be understood. The present study aimed to explore the relationship between the sensitivity and linearity of electrochemical pH sensors and the composition of nanocomposites. Thin films of PANI/CeO2 and PANI/WO3 were deposited via spin coating for characterization and application during the electrochemical impedance and capacitance spectroscopy (EIS and ECS) transduction stages. The findings showed that the optimized performance of the devices was extended not only to the sensitivity but also to the linearity. An increase of 213% in the ECS sensitivity of the PANI/CeO2 compared to the metal oxide and an increase of 64% in the ECS linearity of the PANI/WO3 compared to the polymeric sensitivity were reported. This study identified the structure–property relationship of nanocomposite thin films of PANI with metal oxides for use in electrochemical sensors. The developed materials could be applied in devices to be used in different fields, such as food, environment, and biomedical monitoring.

1. Introduction

Conducting polymers (CP) represent a class of polymers that have gained attention due to the work of Shirakawa, MacDiarmid, and Heeger [1]. CP have a conjugated structure due to sp2 hybridized carbons in their backbone, which leads to the delocalization of π-electrons, ensuring their unique properties, with particular attention being paid to the electrical one [2]. The doping of the conjugated structure can improve the electrical conductivity and is responsible for the wide range of applications of CP [3]. There are several CP, such as polyacetylene (PA), polyaniline (PANI), polypyrrole (PPY), poly(p-phenylene) (PPP), poly(p-phenylenevinylene) (PPV), polythiophenes (PTH), and their derivatives. Among them, PANI is one of the most studied and applied CP due to its low cost, ease of synthesis, processability, deposition as a thin film, environmental stability, and possibility of forming hybrid structures [4,5,6].
The ability to tailor the mechanical, optical, and electrical properties of PANI renders the polymer a viable material for many applications, such as conductive adhesives, diodes, organic transistors, solar cells, capacitors, energy storage devices, ion-selective electrodes, chemical sensors, gas sensors, and biosensors [7,8,9,10,11,12,13,14,15]. PANI plays a central role in the development of sensors. Its ability to change its properties upon exposure to acids and bases, as well as some vapors and liquids, makes it a candidate for such applications [16]. PANI-based sensors and biosensors involve potentiometric, amperometric, conductometric, impedimetric, capacitive, and optical transducer stages [17,18,19,20]. The use of PANI-based thin films for pH sensors has been shown for different transduction systems, sample preparations, and applications. Mello and co-workers [21] and Chinnathambi and co-workers [22] showed optical pH sensors with electrodeposited PANI samples. Mello and co-workers [23] and Vieira and co-workers [24] showed potentiometric PANI-based pH sensors with FET platforms. Despite the polymer’s many qualities, PANI-based chemical sensors may suffer from sensitivity, linearity, selectivity, or stability limitations. Such limitations might be overcome by introducing a secondary material into the PANI, thereby forming a polymeric composite [25]. Regarding the use of PANI-based composites, Nguyen and co-workers described a conductometric platform fabricated via microlithography using a PANI and poly(vinyl butyral) (PVB) blend layer as a pH sensor for water quality monitoring [26].
Polymeric composite synthesis, fabrication, characterization, and application are significant areas of interest within the materials science field due to the potential to eliminate the limitations of polymers in different application fields [27,28,29,30]. Combining PANI with a secondary nanocomponent, such as metallic nanoparticles, metal oxide nanoparticles, carbon compounds, or polymers, enhances its functionalities and performance, offering an efficient design [31]. To date, several studies have demonstrated that synergic interactions expand the scope and application of PANI-based nanocomposites by improving their known properties and promoting their novel features [32].
Nanocomposites of PANI with metal oxides have enhanced properties due to the synergistic interactions between the constituents that are useful for applications, such as sensors and biosensors, photovoltaics, and batteries [25,33]. Moreover, several studies have used nanocomposites of PANI with metal oxides for sensing applications [34]. One reason for the enhanced sensor response of PANI with metal oxide nanocomposites is the development of electron-conducting pathways in the material, which improve the device’s efficiency [27]. To date, different authors have investigated the application of nanocomposites in sensors, such as PANI/TiO2 (titanium dioxide) [35], PANI/WO3 (tungsten trioxide) [36], and PANI/CeO2 (cerium dioxide) [37]. While the first two were prepared by physically mixing the constituents, PANI, and metal oxide nanoparticles in solutions for deposition, the last one was prepared via the in situ self-assembly of the composite prior to deposition. As sensors, the nanocomposites presented optimized performance compared to their constituents. Previous studies have shown that electrochemical sensors and biosensors based on PANI nanocomposites are promising devices. Still, drawbacks must be overcome, such as the need for cost-effective, fast, and reliable analysis methods to achieve a dedicated sensing device using PANI-based composites [38]. Such is the case for pH sensors, which have importance in the quantification of chemicals and bio-chemical analytes in environmental and biomedical monitoring.
Recently, we demonstrated that pristine PANI can be used as a promising platform for chemical sensors based on the use of the electrochemical impedance spectroscopy (EIS) and EIS-based electrochemical capacitance spectroscopy (ECS) transducer stages [39]. The use of the capacitive properties of PANI in chemical sensors has been novel to date. Our previous work showed that the oxidation state of the PANI thin film directly influences its response in each setup. Therefore, this work reveals how to achieve a low-cost and effective electrochemical pH sensor using PANI-based metal oxide nanocomposites, particularly PANI/CeO2 and PANI/WO3, in the form of thin films to further explore and improve the previous approach. The thin film production was accomplished using the well-known spin-coating technique, which is an inexpensive, straightforward, and fast method for producing thin films. The analysis methods were based on EIS and ECS. Such methods use a proper electric equivalent circuit model (EECM) to interpret the impedance and capacitance changes in the electrode/electrolyte interface [40,41,42,43]. The equivalent circuit used in this work is widely applied to study polymer-coated metal systems [44,45] due to allowing the decoupling of the electron transfer from the mass-transport process [46]. The performance of the sensor with nanocomposites is compared to that of its constituents regarding the sensitivity and linearity of the devices. We show that the synergic interactions between the constituents influence the structure–property relationship of the composites, with a significant effect on the sensor’s figures of merit.

2. Materials and Methods

2.1. Materials

The fluorine-doped tin oxide (FTO) thin film deposited over a glass substrate (7 Ω/sq.), PANI (PANI-EB, MW 50,000 g/mol), hydrous dibasic sodium phosphate (99%), sodium tungstate (Na2WO4.2H2O, 99%), oxalic acid (H2C2O4.2H2O, 99%), potassium sulfate (K2SO4, 99%), cerium nitrate (CeNO3.6H2O, 98%), and N-Methyl-2-pyrrolidone (NMP, 99%) were purchased from Sigma-Aldrich. The citric acid (99.5%) was obtained from Vetec, Brazil. Glass slides (KB7) were used as the substrate for the sample deposition used in the characterization. All the chemicals were used as received without any further purification.

2.2. CeO2 and WO3 Synthesis

The synthesis of the cerium dioxide nanorods (CeO2) via the hydrothermal route followed the procedures described by Mai and co-workers [47]. First, 0.434 g of cerium nitrate was dissolved in 5 mL of deionized (DI) water, before 15 mL of NaOH 9 mol/L was added to the solution under vigorous stirring. Then, the solution was transferred to a sealed polytetrafluoroethylene autoclave and heated in a conventional oven at 100 °C for 24 h. The resultant white precipitate was washed and centrifuged with water and ethanol three times and dried at 80 °C for 24 h, yielding a yellow powder.
The synthesis of the hexagonal phase tungsten oxide (h-WO3·H2O) microplates via the hydrothermal route followed a procedure described by Gu and co-workers [48]. Briefly, 0.73 g of sodium tungstate was dissolved in 20 mL of DI water, followed by the addition of 0.71 g of oxalic acid under stirring. Hydrochloric acid 3 mol/L was added dropwise to set the pH to 2, followed by the addition of 0.16 g of potassium sulfate. The solution was transferred to a sealed polytetrafluoroethylene autoclave and heated in a conventional oven at 160 °C for 12 h. The resultant bright yellow powder was washed and centrifuged with water and ethanol three times and dried at 80 °C for 24 h.

2.3. Sample Preparation and Characterization

The PANI, metal oxide (CeO2 and WO3), and nanocomposite (PANI/CeO2 and PANI/WO3) thin films were deposited via spin coating (1000 rpm, for 60 s) using a G3P-8 spin coater (SCS). For sensing and characterization purposes, FTO and glass thin films were used as substrates after cleaning via ultrasonication (DI water, ethanol, and acetone, 10 min each). The PANI was deposited from a weight ratio of 1:400 polymer:solvent (NMP) solution. The CeO2 and WO3 were deposited from a 60 and 11 mg/mL dispersion in NMP, respectively. The PANI solution and metal oxide dispersions were stirred and ultrasonicated for 1 h each before use. The nanocomposite films were deposited from a 50:50 (V/V) solution prepared from the precursor solution and dispersions. After mixing, the composite solutions were stirred and ultrasonicated for 1 h each before use. The samples were annealed on a hot plate for 20 min at 120 °C.
Scanning electron microscopy (SEM) and energy-dispersive X-ray spectroscopy (EDS) characterizations were performed in the samples deposited over glass substrates using a JEOL JSM—6610 system with an operation voltage of 15–20 kV. Prior to the analysis, a 5 nm Au layer was sputtered over the samples to enhance the electrical conductivity. The UV-VIS absorbance spectra of the samples were recorded using a Lambda 1050 WB spectrophotometer (PerkinElmer, Waltham, MA, USA). The selected absorbance spectral window ranged from 350 to 850 nm with a 0.5 nm step. The samples’ profiles for thickness and average surface roughness determination purposes were obtained using a DektakXT stylus profilometer (Bruker, Billerica, MA, USA). The recorded data were analyzed using the Mountains Map software (Digital Surf, Besançon, France). The results were analyzed for the absorbance above 370 nm to minimize interference by the KB7 glass substrate. All the experiments were performed at room temperature, i.e., 298 K.

2.4. Sensor Measurement

An AUTOLAB potentiostat (Metrohm, Herisau, Switzerland) with an FRA module controlled by the NOVA software was used for the electrochemical measurements. A conventional three-electrode electrochemical cell system was used. The samples (PANI, CeO2, WO3, PANI/CeO2, and PANI/WO3 thin films) were used as working electrodes. The reference electrode was an Ag|AgCl (3 mol/L) electrode, and platinum foil was used as the counter electrode. All the experiments were performed at room temperature. The cyclic voltammetry (CV) was performed with a scan rate of 100 mV/s in a scan window between—0.2 and 1.2 V vs. Ag|AgCl. The electrochemical impedance spectroscopy (EIS) measurements were performed under an open circuit potential (OCP) vs. Ag|AgCl with an AC frequency ranging from 100 mHz to 100 kHz. The AC voltage amplitude used was 10 mV RMS. The films were carefully washed in distilled water between the measurements. The EIS-derived electrochemical capacitance spectroscopy (ECS) analyses consisted of converting the complex impedance into complex capacitance, as discussed elsewhere [49].
McIlvaine buffer solutions, ranging from a pH of 2 to 8, were used as electrolytes to obtain the calibration curve of the pH sensor. The relative response at any specific pH and frequency was defined as R R p H ω ( % ) = ( R R p H ω / R R M a x ) × 100 , where R R p H ω is the electrochemical capacitance ( C μ ¯ ) or the charge-transfer resistance ( R c t ) for the ECS and EIS systems, respectively, and R R M a x stands for the maximum response for the specific sample. The sensor’s linearity was obtained from the coefficient of determination (R2) of the fitted calibration curves. The linearity parameter L was calculated as R2 times 100. All the experiments were performed in triplicate, and the results are presented as a function of the mean and standard deviation values.

3. Results

The surface morphology and multi-phase elemental composition of the PANI, PANI/CeO2, and PANI/WO3 films deposited over glass substrates were investigated by means of SEM-EDS (Figure 1). Two different operation modes were used for the collection of the images: secondary electrons (SE) for images with higher spatial resolution and backscattered electrons (BSE) for images with spatially resolved atomic number contrast (Z-contrast). The pristine PANI films exhibited smooth continuous morphology (Figure 1a,b). The PANI/CeO2 exhibited a secondary phase composed of several clusters of nanostructures spread across the surface (Figure 1c), which also showed a high atomic number contrast in the BSE images (Figure 1d) due to the high atomic number of Ce (Z = 52). Likewise, the PANI/WO3 films presented a secondary phase composed of dispersed plate-like particles with sizes ranging from a few hundred nanometers to a few micrometers (Figure 1d), with a high atomic number contrast in the BSE images (Figure 1e) due to the presence of W (Z = 74). For both films, the EDS analysis confirmed the presence of the respective elements in the secondary phases (Figure S1). Together, these results indicate that the composite phases were successfully prepared via the co-dispersion spin-coating methodology, with the incorporation of the respective oxide materials into the surface of the polymer film.
The cyclic voltammograms (CVs) of the pH sensors for the different materials are given in Figure 2. Figure 2a–c show the CVs for the PANI, PANI/CeO2, and PANI/WO3 films, respectively. Figure 2d compares the CVs of the three samples for the same buffer solution with a pH of 2.33. It is possible to observe the characteristic reversible redox peaks of PANI-based materials in the CVs. The films made of the metal oxides did not present reversible redox peaks (see Figure S2 in the SI). From the graph, one can also see that the oxidation and reduction potentials are different for each pH. This may be attributed to the electrostatic interaction of the ions in the electrolyte with the chemical groups in the polymer [50]. It is apparent from the figure that, for each sample, the oxidation and reduction peak current values correlated with the pH of the buffer solution and were different among the samples for the same pH.
The reduction/oxidation reactions and doping/dedoping process occurring on the film surface depend on the pH due to the variation in the ion concentration. PANI-based materials are protonated in their quinoid rings [51], and this process is responsible for the ionic current measured via CV. Therefore, increasing the pH will cause a decrease in the peak current measured. The differences in the CVs among the samples can be explained in part by the fact that the reactions occurring on the surface of the films are dependent on the composition of the nanocomposite.
It is also possible to observe that the materials presented different values for the peak current at each pH, with the composite materials presenting a smaller response (Figure 2d). For the buffer solution with a pH of 2.33, the PANI sample presented a higher current, followed by the PANI/WO3 composite and then the PANI/CeO2 film. The peak currents (IPeak) were 61.4 ± 6.6, 33.4 ± 2.9, and 17.1 ± 2.5 μA, respectively (as shown in the inset in Figure 2d). A decrease in the peak current is expected for both composites due to the absence of the voltametric response of the individual oxides (see Figure S2 in the SI).
The results, as shown in Figure 2d, indicate that the electrochemical response of the nanocomposite films depends on the metal oxide. The nanocomposite samples were prepared in a 50:50 ratio of polymer and metal oxide, and the inset table in Figure 2d shows that the IPeak of the PANI/WO3 is about 54% of the PANI IPeak. By contrast, the IPeak of the PANI/CeO2 is about 27% of the PANI IPeak, suggesting that the decrease in the IPeak of the PANI/WO3 to approximately half of the PANI value is a result of the film composition. The same would be expected for the PANI/CeO2 film. However, a larger decrease in the IPeak for the PANI/CeO2 is observed than for the PANI/WO3. A possible explanation for this might be that the CeO2 interacts with the PANI quinoid rings, decreasing the overall protonation potential of the composite [52]. These results agree with those obtained via UV-VIS spectroscopy of PANI thin films. The PANI/CeO2 film presented a typical protonated PANI (PANI-ES) peak [53,54] (see Figure S3 in the SI) characterized by a band at 440 nm (Figure 3a).
The experimental UV-VIS absorption spectroscopy findings are shown in Figure 3. Before discussing the samples’ absorbance behavior, it is essential to point out that for the spectral region above 650 nm, the absorbance increases due to light scattering, causing transmittance variation, which should not be considered a pure absorbance effect. With that in mind, and emphasizing that a KB7 glass is the samples’ substrate, one could infer that the existent peaks c.a. at 390 nm are due to the substrate. Two spectral regions of interest are around 440 nm and 620 nm. The lowest energy region (around 620 nm) is where the maximum absorbance of PANI exists [53,54]. The highest energy region (around 440 nm) could be related to the interaction of CeO2 and WO3 with the PANI quinoid rings, which is responsible for the existent absorption peaks and the voltammogram behavior, as previously discussed.
The UV-VIS spectra of the CeO2 group (PANI, CeO2, and PANI/CeO2 thin films) are shown in Figure 3a. The CeO2 thin film (solid orange line) does not present the same low energy band as the PANI thin film (solid black line), in which the characteristic absorbance band is revealed by the discrete shoulder centered c.a. at 620 nm, which is almost masked by the scattering light effect. Regarding the high-energy band, centered c.a. at 440 nm, the PANI/CeO2 nanocomposite absorbance spectrum increases, probably due to the interaction of CeO2 with the PANI quinoid rings, as mentioned before. Regardless of the spectral bands’ nature, there is an overall increase in the absorbance of the PANI/CeO2 nanocomposite, as expected once the nanocomposite has more material adsorbed in the substrate. Moreover, the metal oxide in the polymeric matrix further contributes to the higher density of light scatterers, as also revealed in the absorption spectrum of the nanocomposite, i.e., the nanocomposite’s absorbance (solid green line) has a higher scattering of light above 650 nm.
Figure 3b shows the UV-VIS spectra of the WO3 group (PANI, WO3, and PANI/WO3 thin films). The WO3 thin film presents a higher absorbance (solid cyan line), with a broad band at low energy in the visible spectra. The PANI/WO3 nanocomposite absorbance (solid yellow line) has a higher value than the PANI film (solid black line), which might be due to the contributions of three factors: the increase in the scattering centers, the polymer chain, and oxide nanoparticles in the film, as observed for the PANI/CeO2. Further data analysis reveals that the PANI/WO3 and PANI present similar spectral features, suggesting a negligible interaction between the WO3 and PANI chemical groups.
We performed the pH sensor measurements using EIS and ECS as transducing platforms following our previously established methodology, again using pristine PANI, metal oxide films, and PANI–oxide composites. The results for the PANI/WO3 nanocomposite material are shown in Figure 4. The EIS and ECS spectra are acquired for all the samples for each pH buffer solution. A constant DC voltage perturbated by a small oscillating amplitude is applied to the system during the measurements. The reduction and oxidation reactions and the protonation/deprotonation process cause variations in the interfacial impedance and capacitance of the samples under different buffer solutions. The changes in these properties can be measured and estimated. The PANI/WO3 Nyquist diagram of complex impedance is shown in Figure 4a (data for the other samples are not shown here). The R C T changes are provided by the electric equivalent circuit model (EECM), which is applied to the Nyquist diagram. In the same way, the capacitive spectra plots are shown in Figure 4b. The ECS spectra are based on the mathematical conversion of the complex impedance into a complex capacitive signal, i.e., C * ( ω ) = 1 / i ω Z * ( ω ) . The electrochemical capacitance parameter of the circuit, C μ ¯ ( ω ) , is obtained from the phase-frequency analysis.
The EIS spectra present a partially shown semicircle profile in the kΩ range. Each pH is associated with an interfacial charge-transfer resistance, R c t , which is used as a transducing signal for resistive sensing. This pattern of the EIS spectra is in keeping with previous observational studies [55], which associate electrodes not only with the redox probe attached to it but also need to account for the electrochemical capacitance, C μ ¯ ( ω ) , associated with a redox reaction, thereby allowing for capacitive transduced sensing. These experimental results could be related to the nature of the polymer, because the redox probe is the PANI structure itself, meaning it is capable of undergoing redox processes.
The EECM is shown in the inset in Figure 4a. The equivalent circuit for polymer-coated electrodes is composed of the electrolyte solution resistance, R S , the polymeric pore resistance for electrolyte penetration, R C , the charge-transfer resistance, R C T , the constant phase element, CPE [56], representing the charge accumulation at the interface, which is classically interpreted as the electric double layer capacitance, C D L , and the electrochemical capacitance, C μ ¯ , which is classically presented as the electrostatic coating capacitance, C C = ϵ ϵ 0 A / d , and updated to the electrochemical DOS occupancy interpretation [57]. The decrease in the buffer solution’s pH (acidic pHs) contributes to the increase in the redox activity and protonation of PANI-based materials. A consequence of this is a decrease in the impedance of the system. This impedance variation can be monitored using the R C T variations.
The ECS measurements of the PANI/WO3 nanocomposite thin film are shown in Figure 5. The analysis procedure was previously described [39] and is accurate for obtaining electrochemical information using EIS and EIS-derived capacitive methods for polymeric-based materials. The analysis of the ECS data involves determining the frequency of the maximum phase angle from the phase angle-frequency graph (Figure 5a) for the more acidic pH buffer (2.33). After determining the frequency, the real capacitance (C′) at the specific frequency is obtained from the real capacitance frequency graph (Figure 5b). For the PANI/WO3 composite, the maximum phase angle is obtained at 1.99 Hz, as depicted by the dashed line in Figure 5b.
The relative responses of the electrochemical capacitance, C μ ¯ , and the charge-transfer resistance, R C T , are plotted as a function of the pH in Figure 5c. The C μ ¯ is represented by the blue circle and the R C T by the red square. The EIS and ECS relative response variations are caused by the surface charge density and electric field distribution around the film/solution interface changing with the buffer solution [58]. The relative capacitance decreases linearly with an increasing pH in the range from 2 to 8. This can be attributed to the changes in its electronic density, mainly its redox state, that contribute to the C μ ¯ , which are caused by the chemical reaction (reduction/oxidation and protonation/deprotonation) of the composite film. The structural [59] and electrostatic changes [60] are not the only ones responsible for the capacitance changes in the samples. A sensitivity of 12.8 ± 2.2%/pH and a linearity of 89% are obtained. The relative variation of the R C T increases with the increasing pH in the range from 2 to 8, and as for the capacitance, is attributed to the chemical reactions of the composite film. An EIS-based sensitivity of 16.3 ± 2.9%/pH and linearity of 92.8% are obtained.
The sensitivity and linearity of the EIS and ECS electrochemical sensors for each group of materials are presented in Figure 6. Figure 6a shows the sensitivity and linearity of the impedimetric platform for each film in the CeO2 group. Figure 6b shows the capacitive results for the same set of films. The EIS sensitivity and linearity are 21.5 ± 2.4%/pH and 71.7%, respectively, for the PANI. For the CeO2, they are 16.6 ± 2.9%/pH and 91.2%, respectively. The sensor with CeO2 presents a lower sensitivity than the sensor with PANI. By contrast, the linearity is higher for the sensor with CeO2 than for that with PANI. The PANI/CeO2-based sensor presents a sensitivity of 19.9 ± 2.9%/pH and a linearity of c.a. 94%. Comparing the impedimetric (EIS) pH sensor with the spin-coated PANI thin film with the electrodeposited one from our previous work [39], the device from this work presents a higher sensitivity (21.5 ± 2.4%/pH vs. 12.7 ± 2.2%/pH). Regarding the linearity, it is lower for the spin-coated sample (71.7% vs. 91.7%). This is also observed for the capacitive (ECS) sensor.
The nanocomposite presents a synergic performance. The described results indicate that the nanocomposite’s sensitivity is in the level of the PANI’s sensitivity, and the linearity is in the level of the CeO2 oxide. The nanocomposite improves the polymer linearity and metal oxide sensitivity. The same behavior as for the EIS sensitivity is observed for the ECS sensor. The sensitivity is 16.5 ± 2.6%/pH for the PANI, 3.22 ± 0.6%/pH for the CeO2, and 10.1 ± 2.9%/pH for the PANI/CeO2. Although the ECS sensitivity of the nanocomposite is not at the level of the PANI sensitivity, it represents a 213% increase compared to the metal oxide sensitivity. At the same time, the impedimetric sensitivity increases by about 20%. Regarding the ECS linearity, the PANI has 54.3%, the CeO2 has 88.7%, and the PANI/CeO2 composite has 79.3%. As for the capacitive sensitivity, the linearity does not reach the level of the metal oxide, although it has a 46% increase when compared to the polymer linearity, while for the impedimetric linearity, the increase for the nanocomposite is about 31%. One unexpected finding is the extent to which the PANI/CeO2 nanocomposite optimizes the performance of the pH sensor for both impedimetric and capacitive platforms. This improves not only the linearity of the PANI-based sensor but also the sensitivity of the CeO2-based sensor.
Figure 6c,d present the sensitivity and linearity of the impedimetric and capacitive platforms, respectively, for each film in the WO3 group. The EIS sensitivity and linearity for the PANI are the same as for the previous group. For the WO3, they are 11.9 ± 2.9%/pH and 88.6%, respectively. Again, the metal oxide-based sensor presents a lower sensitivity and higher linearity than the polymeric sensor. The PANI/WO3 nanocomposite presents impedimetric sensitivity and linearity of 16.3 ± 2.2%/pH and 92.8%, respectively, improving on the polymer’s linearity and the metal oxide’s sensitivity. Although the nanocomposite’s sensitivity is not at the PANI’s sensitivity level, it represents an increase of 37% in relation to the WO3’s sensitivity. Regarding the linearity, the composite is higher than the metal oxide, with a rise of 5%, representing an increase of 31% concerning the PANI’s linearity. The ECS platform with the PANI/WO3 nanocomposite presents the same behavior as the platform with the PANI/CeO2. The nanocomposite presents a sensitivity improvement in relation to the metal oxide of 71%, from 7.5 ± 0.1%/pH to 12.8 ± 2.2%/pH, and a linearity improvement concerning the PANI of 64%, from 54.3% to 89%. Compared to previous work, it is possible to control the response of each sensor though the protonation potential and electronic density of the PANI sample by combining it with a metal oxide instead of controlling the oxidation state of the polymer.
The thin film morphology has a significant influence on the response of electrochemical interfacial sensors. The thickness and surface roughness, R Q (root mean square deviation), of the thin films are presented in Table 1. For each group of films, the CeO2 and WO3 films are the thickest (11.6 ± 1.8 and 21.1 ± 1.9 nm, respectively) and the composites, PANI/CeO2 and PANI/WO3, are thinner than the oxide. The PANI/CeO2 are thinner than the PANI film (4.2 ± 0.2 vs. 5.0 ± 1.0 nm), although the PANI/WO3 is thicker (11.7 ± 0.2 vs. 5.0 ± 1.0 nm). The interaction between the polymeric chain and the metal oxide generates a composite sample with unique structural properties.
Both the thickness and surface roughness are important for the interfacial processes at the film/electrolyte interface. While thicker films present a reduced electron transfer rate [61], electrodes with a higher surface area, directly related to the surface roughness, deliver an enlarged electron transfer rate [62]. As shown in Table 1, both parameters are related, with the thicker film presenting higher surface roughness and vice versa. Based on this, the roughness-to-surface ratio can be a helpful parameter for evaluating the quality of a sample when applied in electrochemical sensors. Figure 7 displays the roughness/thickness parameter for both sets of films. Based on the effects of the roughness and thickness on the interfacial phenomenon, lower ratios indicate reduced sensor sensitivity and performance, and vice-versa.
A nanocomposite is a material that combines its constituent properties. The consequences are noted in its new and synergic properties. The interaction between the metal oxide and the polymer is responsible for altering the structural properties of the thin films, such as the thickness and roughness, as well as the response of the electrochemical sensors based on the material. Ultimately, the sensors’ sensitivity is defined by the nanocomposite’s thickness and roughness. As shown in Figure 7, the relationship between the roughness/thickness ratio and the material is the same as that shown for the sensitivity (Figure 6). The synthesis of new composites may be key to the development of materials with tailored properties presenting the optimal performance in sensor devices. For example, the described polymeric composites with CeO2 and WO3 metal oxides could offer improved and optimized sensitivity and linearity compared to the constituent materials.

4. Conclusions

The present study was designed to determine the effect of nanocomposites of PANI with metal oxides on the response of electrochemical impedimetric and capacitive pH sensors. The thin films were produced via spin coating on FTO substrates from an NMP solution of the nanocomposites. The solutions were prepared by physically mixing the hydrothermally synthesized metal oxides, CeO2 and WO3, and PANI. This study has shown that the PANI/CeO2 and PANI/WO3 nanocomposites optimized the EIS- and ECS-based pH sensors. The ECS sensitivity of the PANI/CeO2 sample represented an increase of 213% compared to the metal oxide’s sensitivity, while for the EIS sensitivity, the increase was 20%. The linearity showed an increase of 46% compared to the PANI’s linearity based on the ECS method and 31% based on the EIS method. For the PANI/WO3 sample, the increase in the sensitivity of the EIS and ECS methods was 37% and 71%, respectively, while the increase in the linearity was 31% and 64%, respectively. The results of this study indicate that the nanocomposites improved not only the linearity of the PANI-based sensor but also the sensitivity of the metal oxide-based sensor. These findings were supported by the analysis of the roughness-to-thickness ratio, two morphological characteristics of the thin films with an impact on the interfacial electron transfer rate and, consequently, the sensors’ performance.
Although there is a need for further studies to evaluate the structural characteristics of the composites and their effect on sensing devices, the findings of this study contribute to our understanding of PANI and PANI-based nanocomposites applied to impedimetric and capacitive electrochemical sensors for ions. A key strength of the present study was the evaluation of the capacitive properties of PANI-based materials applied in chemical sensors following the novel findings of previous works.

Supplementary Materials

The following supporting information can be downloaded at https://www.mdpi.com/article/10.3390/polym15030578/s1, Figure S1: CV of the metal oxide thin films, Figure S2: Absorption UV-VIS spectra of the PANI-EB and PANI-ES, Figure S3. UV-VIS spectra of the PANI-EB and PANI-ES thin films.

Author Contributions

Conceptualization, H.J.N.P.D.M. and M.S.B.; methodology, B.C.R., A.P.V., and H.J.N.P.D.M.; investigation, B.C.R., A.P.V., M.S.B., L.M.G.A., and H.J.N.P.D.M.; resources, M.S.B. and H.J.N.P.D.M.; data curation, M.S.B., L.M.G.A., and H.J.N.P.D.M.; writing—original draft preparation, H.J.N.P.D.M.; writing—review and editing, M.S.B., L.M.G.A., and H.J.N.P.D.M.; visualization, H.J.N.P.D.M.; supervision, H.J.N.P.D.M. All authors have read and agreed to the published version of the manuscript.

Funding

This research was funded by Coordenação de Aperfeiçoamento de Pessoal de Nível Superior, grant number 001, Conselho Nacional de Desenvolvimento Científico e Tecnológico, grant numbers 311439/2021-7, 406190/2021-6, and 440225/2021-3, and Fundação de Apoio à Pesquisa, grant number 1/2022.

Institutional Review Board Statement

Not applicable.

Data Availability Statement

The data presented in this study are available on request from the corresponding author.

Acknowledgments

The authors would like to thank the Brazilian funding agencies for the financial support and the Laboratório Multiusuário de Microscopia de Alta Resolução (LabMic/UFG) for performing the scanning electron microscopy analysis.

Conflicts of Interest

The authors declare no conflict of interest. The funders had no role in the design of the study; in the collection, analyses, or interpretation of data; in the writing of the manuscript; or in the decision to publish the results.

References

  1. MacDiarmid, A.G. Synthetic Metals: A Novel Role for Organic Polymers. Angew. Chem. Int. Ed. 2001, 40, 2581–2590. [Google Scholar] [CrossRef]
  2. Aydemir, N.; Malmström, J.; Travas-Sejdic, J. Conducting Polymer Based Electrochemical Biosensors. Phys. Chem. Chem. Phys. 2016, 18, 8264–8277. [Google Scholar] [CrossRef] [PubMed]
  3. Poddar, A.K.; Patel, S.S.; Patel, H.D. Synthesis, Characterization and Applications of Conductive Polymers: A Brief Review. Polym. Adv. Technol. 2021, 32, 4616–4641. [Google Scholar] [CrossRef]
  4. Zhang, D.; Wang, Y. Synthesis and Applications of One-Dimensional Nano-Structured Polyaniline: An Overview. Mater. Sci. Eng. B 2006, 134, 9–19. [Google Scholar] [CrossRef]
  5. Song, E.; Choi, J.-W. Conducting Polyaniline Nanowire and Its Applications in Chemiresistive Sensing. J Nanomater 2013, 3, 498–523. [Google Scholar] [CrossRef] [PubMed]
  6. Kumari Jangid, N.; Jadoun, S.; Kaur, N. A Review on High-Throughput Synthesis, Deposition of Thin Films and Properties of Polyaniline. Eur. Polym. J. 2020, 125, 109485. [Google Scholar] [CrossRef]
  7. Gerard, M.; Malhotra, B.D. Application of Polyaniline as Enzyme Based Biosensor. Curr. Appl. Phys. 2005, 5, 174–177. [Google Scholar] [CrossRef]
  8. Lange, U.; Roznyatovskaya, N.V.; Mirsky, V.M. Conducting Polymers in Chemical Sensors and Arrays. Anal. Chim. Acta 2008, 614, 1–26. [Google Scholar] [CrossRef]
  9. Dhand, C.; Das, M.; Datta, M.; Malhotra, B.D. Recent Advances in Polyaniline Based Biosensors. Biosens. Bioelectron. 2011, 26, 2811–2821. [Google Scholar] [CrossRef]
  10. Ramya, R.; Sivasubramanian, R.; Sangaranarayanan, M.V. Conducting Polymers-Based Electrochemical Supercapacitors—Progress and Prospects. Electrochimica Acta 2013, 101, 109–129. [Google Scholar] [CrossRef]
  11. Fratoddi, I.; Venditti, I.; Cametti, C.; Russo, M.V. Chemiresistive Polyaniline-Based Gas Sensors: A Mini Review. Sens. Actuators B Chem. 2015, 220, 534–548. [Google Scholar] [CrossRef]
  12. Lai, J.; Yi, Y.; Zhu, P.; Shen, J.; Wu, K.; Zhang, L.; Liu, J. Polyaniline-Based Glucose Biosensor: A Review. J. Electroanal. Chem. 2016, 782, 138–153. [Google Scholar] [CrossRef]
  13. Travaglini, L.; Micolich, A.P.; Cazorla, C.; Zeglio, E.; Lauto, A.; Mawad, D. Single-Material OECT-Based Flexible Complementary Circuits Featuring Polyaniline in Both Conducting Channels. Adv. Funct. Mater. 2021, 31, 2007205. [Google Scholar] [CrossRef]
  14. Beygisangchin, M.; Abdul Rashid, S.; Shafie, S.; Sadrolhosseini, A.R.; Lim, H.N. Preparations, Properties, and Applications of Polyaniline and Polyaniline Thin Films—A Review. Polymers 2021, 13, 2003. [Google Scholar] [CrossRef] [PubMed]
  15. Pietrzak, K.; Wardak, C.; Malinowski, S. Application of Polyaniline Nanofibers for the Construction of Nitrate All-Solid-State Ion-Selective Electrodes. Appl. Nanosci. 2021, 11, 2823–2835. [Google Scholar] [CrossRef]
  16. Bhadra, S.; Khastgir, D.; Singha, N.K.; Lee, J.H. Progress in Preparation, Processing and Applications of Polyaniline. Prog. Polym. Sci. 2009, 34, 783–810. [Google Scholar] [CrossRef]
  17. Sadek, A.Z.; Wlodarski, W.; Kalantar-Zadeh, K.; Baker, C.; Kaner, R.B. Doped and Dedoped Polyaniline Nanofiber Based Conductometric Hydrogen Gas Sensors. Sens. Actuators Phys. 2007, 139, 53–57. [Google Scholar] [CrossRef] [Green Version]
  18. Mello, H.J.N.P.D.; Heimfarth, T.; Mulato, M. Influence of the Physical–Chemical Properties of Polyaniline Thin Films on the Final Sensitivity of Varied Field Effect Sensors. Mater. Chem. Phys. 2015, 160, 257–263. [Google Scholar] [CrossRef]
  19. Hosu, O.; Lettieri, M.; Papara, N.; Ravalli, A.; Sandulescu, R.; Cristea, C.; Marrazza, G. Colorimetric Multienzymatic Smart Sensors for Hydrogen Peroxide, Glucose and Catechol Screening Analysis. Talanta 2019, 204, 525–532. [Google Scholar] [CrossRef]
  20. Mello, H.J.N.P.D.; Mulato, M. Enzymatically Functionalized Polyaniline Thin Films Produced with One-Step Electrochemical Immobilization and Its Application in Glucose and Urea Potentiometric Biosensors. Biomed. Microdevices 2020, 22, 22. [Google Scholar] [CrossRef]
  21. Mello, H.J.N.P.D.; Mulato, M. Optochemical Sensors Using Electrodeposited Polyaniline Films: Electrical Bias Enhancement of Reflectance Response. Sens. Actuators B Chem. 2015, 213, 195–201. [Google Scholar] [CrossRef]
  22. Chinnathambi, S.; Euverink, G.J.W. Polyaniline Functionalized Electrochemically Reduced Graphene Oxide Chemiresistive Sensor to Monitor the PH in Real Time during Microbial Fermentations. Sens. Actuators B Chem. 2018, 264, 38–44. [Google Scholar] [CrossRef]
  23. Mello, H.J.N.P.D.; Mulato, M. Well-Established Materials in Microelectronic Devices Systems for Differential-Mode Extended-Gate Field Effect Transistor Chemical Sensors. Microelectron. Eng. 2016, 160, 73–80. [Google Scholar] [CrossRef]
  24. Vieira, N.C.S.; Fernandes, E.G.R.; Faceto, A.D.; Zucolotto, V.; Guimarães, F.E.G. Nanostructured Polyaniline Thin Films as PH Sensing Membranes in FET-Based Devices. Sens. Actuators B Chem. 2011, 160, 312–317. [Google Scholar] [CrossRef]
  25. Sen, T.; Mishra, S.; Shimpi, N.G. Synthesis and Sensing Applications of Polyaniline Nanocomposites: A Review. RSC Adv. 2016, 6, 42196–42222. [Google Scholar] [CrossRef]
  26. Nguyen, H.D.; Nguyen, T.H.; Hoang, N.V.; Le, N.N.; Nguyen, T.N.N.; Doan, D.C.T.; Dang, M.C. PH Sensitivity of Emeraldine Salt Polyaniline and Poly(Vinyl Butyral) Blend. Adv. Nat. Sci. Nanosci. Nanotechnol. 2014, 5, 045001. [Google Scholar] [CrossRef] [Green Version]
  27. Singh, P.; Shukla, S.K. Advances in Polyaniline-Based Nanocomposites. J. Mater. Sci. 2020, 55, 1331–1365. [Google Scholar] [CrossRef]
  28. Lin, Y.; Li, W.-H.; Wen, Y.; Wang, G.-E.; Ye, X.-L.; Xu, G. Layer-by-Layer Growth of Preferred-Oriented MOF Thin Film on Nanowire Array for High-Performance Chemiresistive Sensing. Angew. Chem. Int. Ed. 2021, 60, 25758–25761. [Google Scholar] [CrossRef]
  29. Zhang, R.; Wang, Y.; Li, J.; Zhao, H.; Wang, Y.; Zhou, Y. Mesoporous Cellulose Nanofibers-Interlaced PEDOT:PSS Hybrids for Chemiresistive Ammonia Detection. Microchim. Acta 2022, 189, 308. [Google Scholar] [CrossRef]
  30. Deng, W.-H.; Yao, M.-S.; Zhang, M.-Y.; Tsujimoto, M.; Otake, K.; Wang, B.; Li, C.-S.; Xu, G.; Kitagawa, S. Non-Contact Real-Time Detection of Trace Nitro-Explosives by MOF Composites Visible-Light Chemiresistor. Natl. Sci. Rev. 2022, 9, nwac143. [Google Scholar] [CrossRef]
  31. Babel, V.; Hiran, B.L. A Review on Polyaniline Composites: Synthesis, Characterization, and Applications. Polym. Compos. 2021, 42, 3142–3157. [Google Scholar] [CrossRef]
  32. Lu, X.; Zhang, W.; Wang, C.; Wen, T.-C.; Wei, Y. One-Dimensional Conducting Polymer Nanocomposites: Synthesis, Properties and Applications. Prog. Polym. Sci. 2011, 36, 671–712. [Google Scholar] [CrossRef]
  33. Zadehnazari, A. Metal Oxide/Polymer Nanocomposites: A Review on Recent Advances in Fabrication and Applications. Polym.-Plast. Technol. Mater. 2022, 1–46. [Google Scholar] [CrossRef]
  34. Pandey, S. Highly Sensitive and Selective Chemiresistor Gas/Vapor Sensors Based on Polyaniline Nanocomposite: A Comprehensive Review. J. Sci. Adv. Mater. Devices 2016, 1, 431–453. [Google Scholar] [CrossRef] [Green Version]
  35. Sonker, R.K.; Sabhajeet, S.R.; Yadav, B.C. TiO2–PANI Nanocomposite Thin Film Prepared by Spin Coating Technique Working as Room Temperature CO2 Gas Sensing. J. Mater. Sci. Mater. Electron. 2016, 27, 11726–11732. [Google Scholar] [CrossRef]
  36. Kulkarni, S.B.; Navale, Y.H.; Navale, S.T.; Stadler, F.J.; Ramgir, N.S.; Patil, V.B. Hybrid Polyaniline-WO3 Flexible Sensor: A Room Temperature Competence towards NH3 Gas. Sens. Actuators B Chem. 2019, 288, 279–288. [Google Scholar] [CrossRef]
  37. Liu, C.; Tai, H.; Zhang, P.; Yuan, Z.; Du, X.; Xie, G.; Jiang, Y. A High-Performance Flexible Gas Sensor Based on Self-Assembled PANI-CeO2 Nanocomposite Thin Film for Trace-Level NH3 Detection at Room Temperature. Sens. Actuators B Chem. 2018, 261, 587–597. [Google Scholar] [CrossRef]
  38. Shoaie, N.; Daneshpour, M.; Azimzadeh, M.; Mahshid, S.; Khoshfetrat, S.M.; Jahanpeyma, F.; Gholaminejad, A.; Omidfar, K.; Foruzandeh, M. Electrochemical Sensors and Biosensors Based on the Use of Polyaniline and Its Nanocomposites: A Review on Recent Advances. Microchim. Acta 2019, 186, 465. [Google Scholar] [CrossRef]
  39. Nogueira Pedroza Dias Mello, H.J.; Mulato, M. Impedimetric and Capacitive Transducer Platform for Chemical Sensors Based on Electrodeposited Polyaniline Thin Films. J. Phys. Chem. C 2022, 126, 12222–12229. [Google Scholar] [CrossRef]
  40. Johnson, A.; Song, Q.; Ko Ferrigno, P.; Bueno, P.R.; Davis, J.J. Sensitive Affimer and Antibody Based Impedimetric Label-Free Assays for C-Reactive Protein. Anal. Chem. 2012, 84, 6553–6560. [Google Scholar] [CrossRef]
  41. Zhurauski, P.; Arya, S.K.; Jolly, P.; Tiede, C.; Tomlinson, D.C.; Ko Ferrigno, P.; Estrela, P. Sensitive and Selective Affimer-Functionalised Interdigitated Electrode-Based Capacitive Biosensor for Her4 Protein Tumour Biomarker Detection. Biosens. Bioelectron. 2018, 108, 1–8. [Google Scholar] [CrossRef] [PubMed]
  42. Hudari, F.F.; Bessegato, G.G.; Bedatty Fernandes, F.C.; Zanoni, M.V.B.; Bueno, P.R. Reagentless Detection of Low-Molecular-Weight Triamterene Using Self-Doped TiO2 Nanotubes. Anal. Chem. 2018, 90, 7651–7658. [Google Scholar] [CrossRef] [PubMed]
  43. Mello, H.J.N.P.D.; Bueno, P.R.; Mulato, M. Comparing Glucose and Urea Enzymatic Electrochemical and Optical Biosensors Based on Polyaniline Thin Films. Anal. Methods 2020, 12, 4199–4210. [Google Scholar] [CrossRef]
  44. Niu, L.; Li, Q.; Wei, F.; Chen, X.; Wang, H. Electrochemical Impedance and Morphological Characterization of Platinum-Modified Polyaniline Film Electrodes and Their Electrocatalytic Activity for Methanol Oxidation. J. Electroanal. Chem. 2003, 544, 121–128. [Google Scholar] [CrossRef]
  45. Amirudin, A.; Thierry, D. Application of Electrochemical Impedance Spectroscopy to Study the Degradation of Polymer-Coated Metals. Prog. Org. Coat. 1995, 26, 1–28. [Google Scholar] [CrossRef]
  46. Hu, C.-C.; Chu, C.-H. Electrochemical Impedance Characterization of Polyaniline-Coated Graphite Electrodes for Electrochemical Capacitors—Effects of Film Coverage/Thickness and Anions. J. Electroanal. Chem. 2001, 503, 105–116. [Google Scholar] [CrossRef]
  47. Mai, H.-X.; Sun, L.-D.; Zhang, Y.-W.; Si, R.; Feng, W.; Zhang, H.-P.; Liu, H.-C.; Yan, C.-H. Shape-Selective Synthesis and Oxygen Storage Behavior of Ceria Nanopolyhedra, Nanorods, and Nanocubes. J. Phys. Chem. B 2005, 109, 24380–24385. [Google Scholar] [CrossRef]
  48. Gu, Z.; Zhai, T.; Gao, B.; Sheng, X.; Wang, Y.; Fu, H.; Ma, Y.; Yao, J. Controllable Assembly of WO3 Nanorods/Nanowires into Hierarchical Nanostructures. J. Phys. Chem. B 2006, 110, 23829–23836. [Google Scholar] [CrossRef]
  49. Santos, A.; Carvalho, F.C.; Roque-Barreira, M.-C.; Bueno, P.R. Impedance-Derived Electrochemical Capacitance Spectroscopy for the Evaluation of Lectin–Glycoprotein Binding Affinity. Biosens. Bioelectron. 2014, 62, 102–105. [Google Scholar] [CrossRef]
  50. Pruneanu, S.; Veress, E.; Marian, I.; Oniciu, L. Characterization of Polyaniline by Cyclic Voltammetry and UV-Vis Absorption Spectroscopy. J. Mater. Sci. 1999, 34, 2733–2739. [Google Scholar] [CrossRef]
  51. Ping, Z.; Nauer, B.G.E.; Neugebauer, H.; Theiner, J.; Neckel, A. Protonation and Electrochemical Redox Doping Processes of Polyaniline in Aqueous Solutions: Investigations Using in-Situ FTIR-ATR Spectroscopy and a New Doping System. J. Chem. Soc. Faraday Trans. 1997, 93, 121–129. [Google Scholar] [CrossRef]
  52. Mello, H.J.N.P.D.; Mulato, M. Influence of Galvanostatic Electrodeposition Parameters on the Structure-Property Relationships of Polyaniline Thin Films and Their Use as Potentiometric and Optical PH Sensors. Thin Solid Films 2018, 656, 14–21. [Google Scholar] [CrossRef]
  53. Mahat, M.M.; Mawad, D.; Nelson, G.W.; Fearn, S.; Palgrave, R.G.; Payne, D.J.; Stevens, M.M. Elucidating the Deprotonation of Polyaniline Films by X-Ray Photoelectron Spectroscopy. J. Mater. Chem. C 2015, 3, 7180–7186. [Google Scholar] [CrossRef]
  54. Tarver, J.; Yoo, J.E.; Dennes, T.J.; Schwartz, J.; Loo, Y.-L. Polymer Acid Doped Polyaniline Is Electrochemically Stable Beyond PH. Chem. Mater. 2009, 21, 280–286. [Google Scholar] [CrossRef]
  55. Garrote, B.L.; Santos, A.; Bueno, P.R. Perspectives on and Precautions for the Uses of Electric Spectroscopic Methods in Label-Free Biosensing Applications. ACS Sens. 2019, 4, 2216–2227. [Google Scholar] [CrossRef] [PubMed] [Green Version]
  56. Le Thu, Q.; Takenouti, H.; Touzain, S. EIS Characterization of Thick Flawed Organic Coatings Aged under Cathodic Protection in Seawater. Electrochimica Acta 2006, 51, 2491–2502. [Google Scholar] [CrossRef]
  57. Bueno, P.R.; Fernandes, F.C.B.; Davis, J.J. Quantum Capacitance as a Reagentless Molecular Sensing Element. Nanoscale 2017, 9, 15362–15370. [Google Scholar] [CrossRef]
  58. Manjakkal, L.; Djurdjic, E.; Cvejin, K.; Kulawik, J.; Zaraska, K.; Szwagierczak, D. Electrochemical Impedance Spectroscopic Analysis of RuO2 Based Thick Film PH Sensors. Electrochimica Acta 2015, 168, 246–255. [Google Scholar] [CrossRef]
  59. Chowdhury, A.D.; De, A.; Chaudhuri, C.R.; Bandyopadhyay, K.; Sen, P. Label Free Polyaniline Based Impedimetric Biosensor for Detection of E. Coli O157:H7 Bacteria. Sens. Actuators B Chem. 2012, 171, 916–923. [Google Scholar] [CrossRef]
  60. Contractor, A.Q.; Juvekar, V.A. Estimation of Equilibrium Capacitance of Polyaniline Films Using Step Voltammetry. J. Electrochem. Soc. 2015, 162, A1175–A1181. [Google Scholar] [CrossRef]
  61. Baradoke, A.; Hein, R.; Li, X.; Davis, J.J. Reagentless Redox Capacitive Assaying of C-Reactive Protein at a Polyaniline Interface. Anal. Chem. 2020, 92, 3508–3511. [Google Scholar] [CrossRef] [PubMed] [Green Version]
  62. Mousa, H.M.; Aggas, J.R.; Guiseppi-Elie, A. Electropolymerization of Aniline and (N-Phenyl-o-Phenylenediamine) for Glucose Biosensor Application. Mater. Lett. 2019, 238, 267–270. [Google Scholar] [CrossRef]
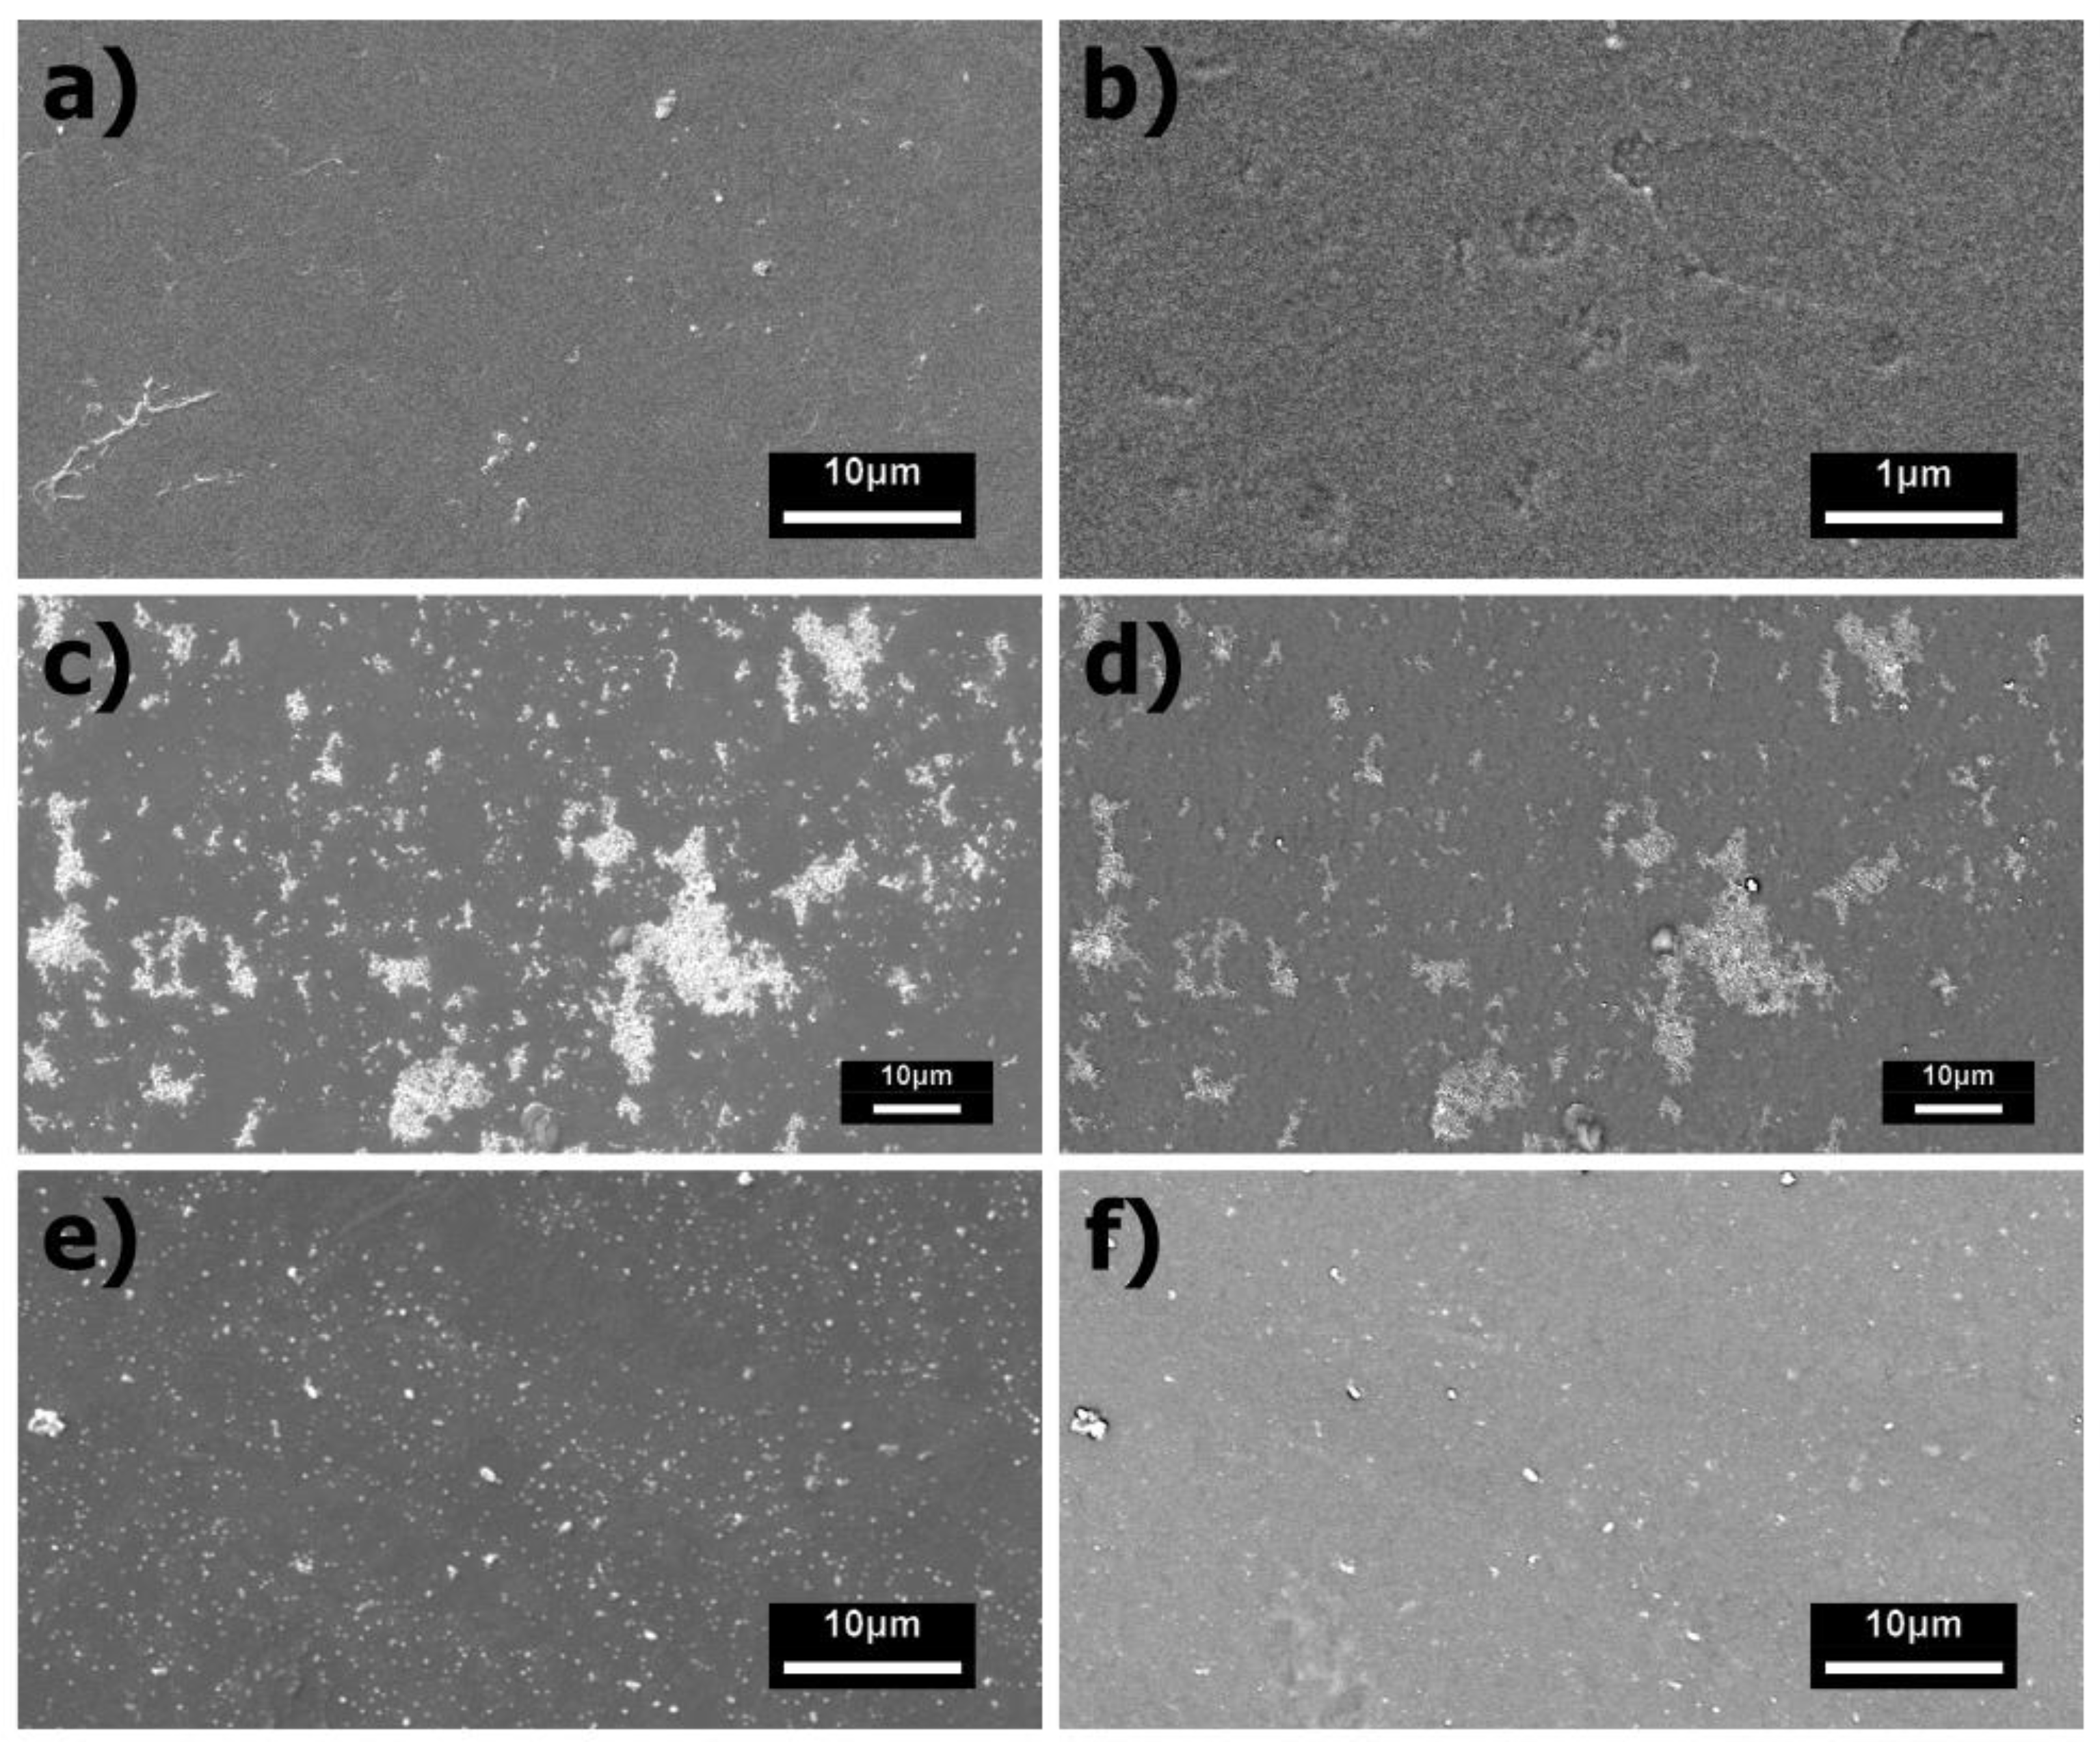
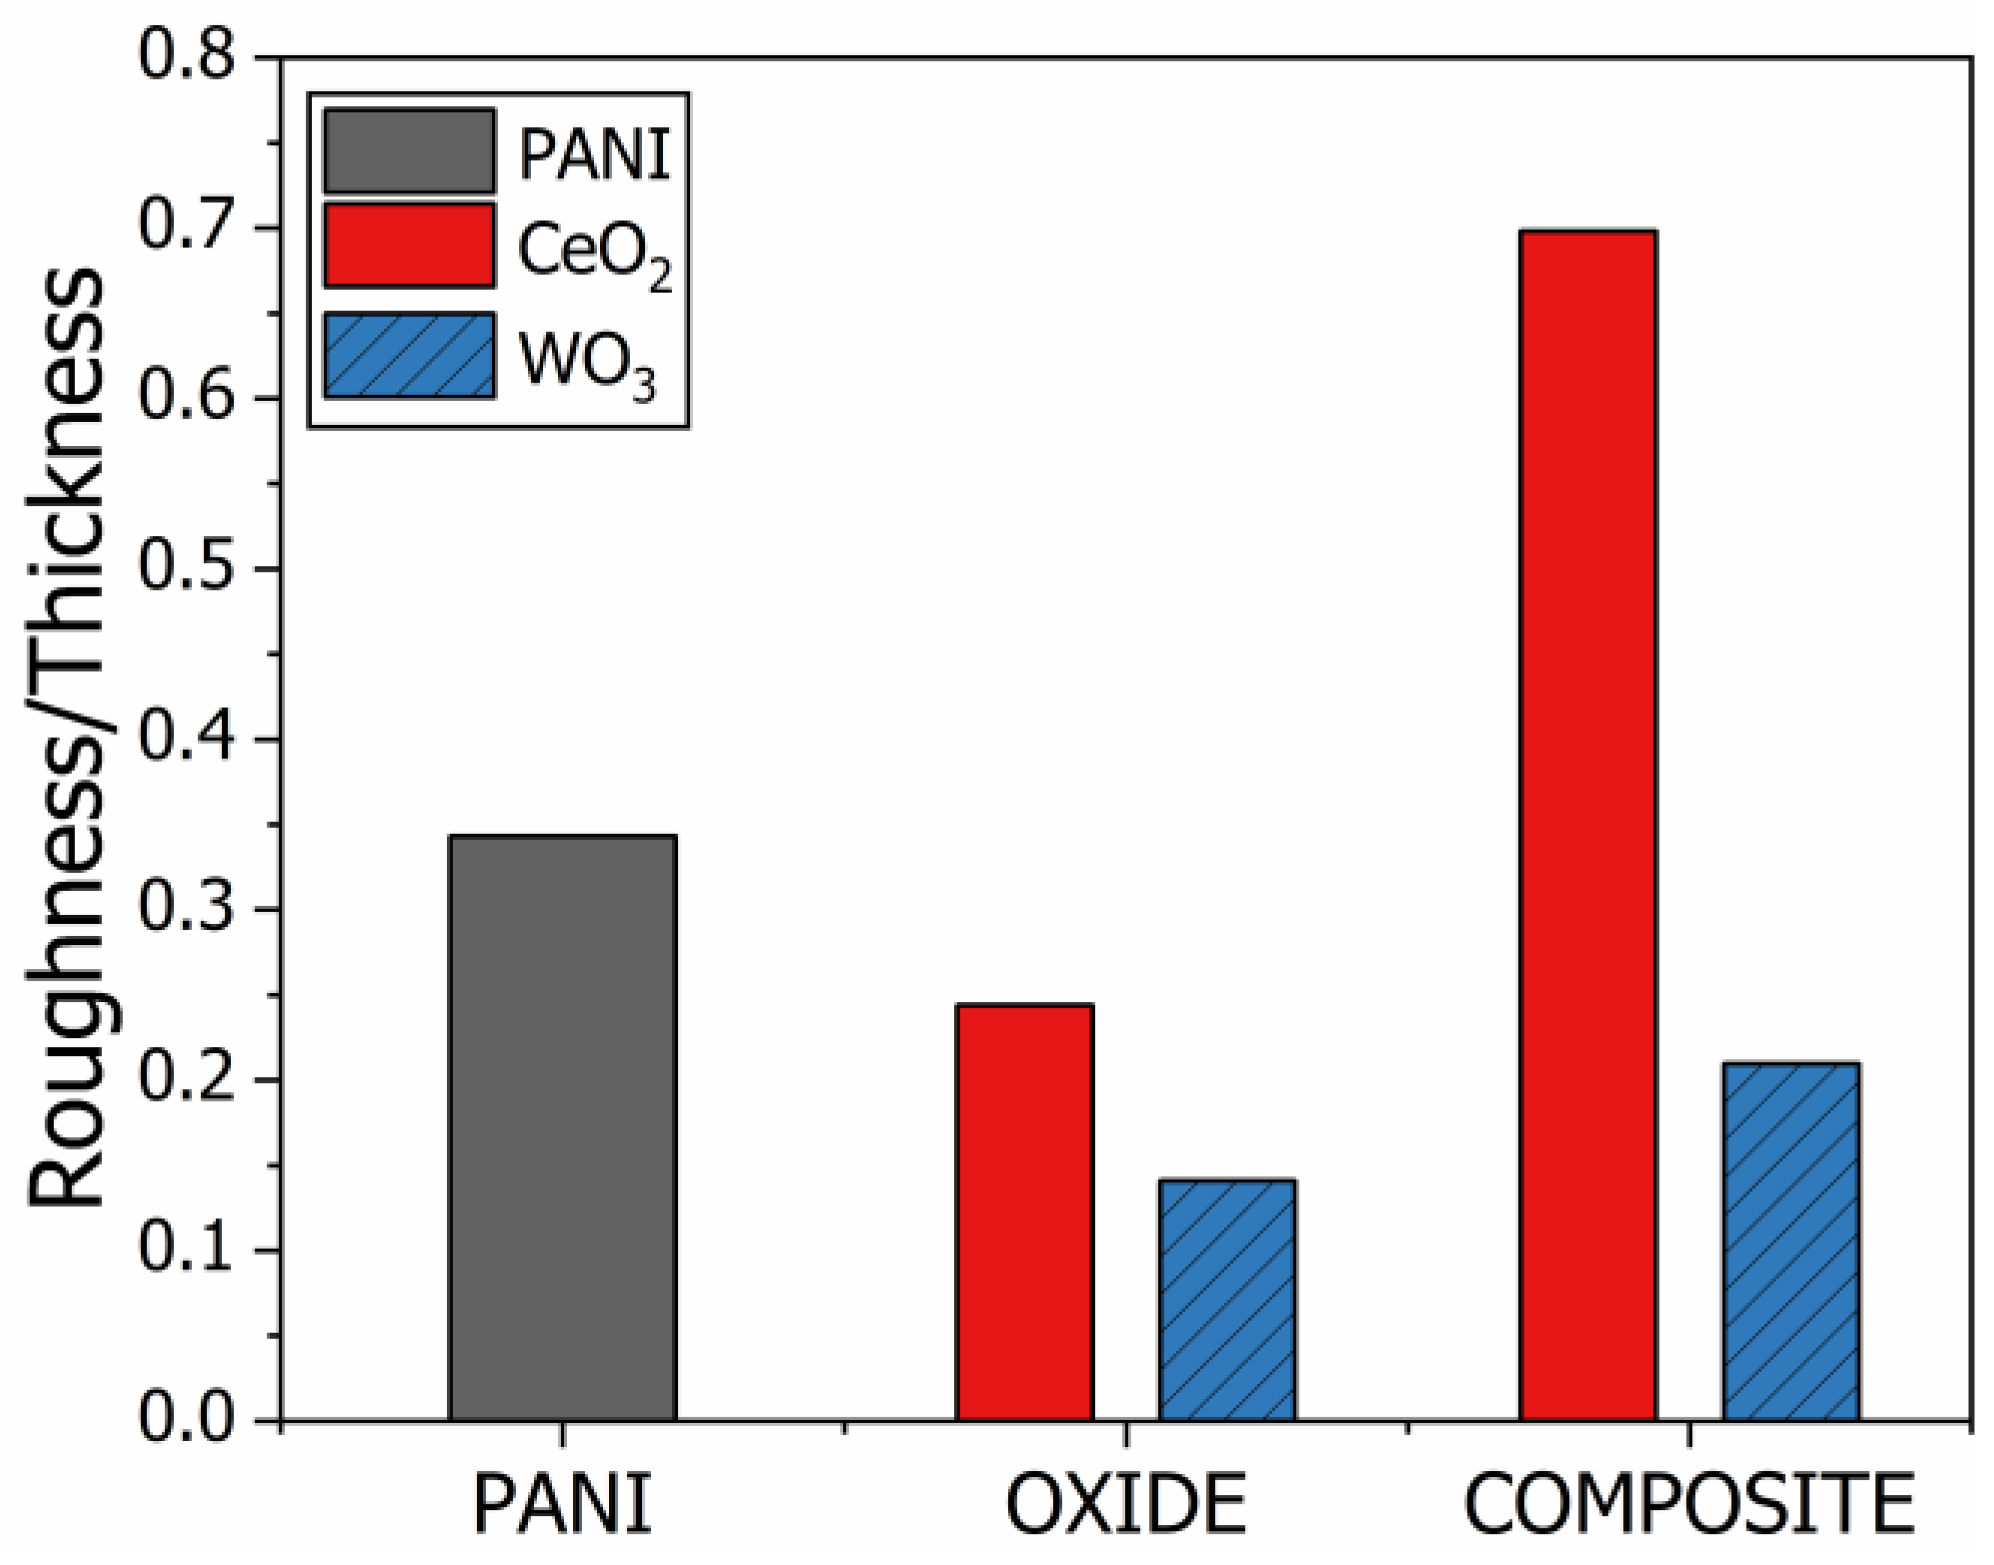
Figure 1. SEM characterization of the pristine PANI and composite films deposited over glass substrates when using the secondary electrons (SE) as signals for high-resolution images or backscattered electrons (BSE) to enhance the atomic number contrast between the PANI and oxide phases in the composite films. SE images of the pristine PANI films are presented in (a,b). SE and BSE images of the PANI/CeO2 films are presented in (c,d), respectively. SE and BSE images of the PANI/WO3 films are presented in (e,f), respectively.
Polymers 15 00578 g001
Figure 2. Cyclic voltammetry findings collected in different pH buffer electrolytes used as working electrode FTO substrates modified with: (a) PANI, (b) PANI/CeO2, and (c) PANI/WO3 nanocomposites. The reversible redox peaks of PANI-based materials are present. The peak current is proportional to the buffer solution pH. In (d), the cyclic voltammograms of the three samples are compared for the same buffer solution with a pH of 2.33. The inset shows the table with the peak currents. The IPeak is influenced by the composite composition.
Polymers 15 00578 g002
Figure 3. UV-VIS absorption spectra of all the thin films investigated in this work. The CeO2 group (PANI, CeO2, and PANI/CeO2 thin films) and WO3 group (PANI, WO3, and PANI/WO3 thin films) absorbance spectra are presented in (a,b), respectively. The (a) inset shows the entire spectra of PANI and its composites. The thin films’ absorbance changes with the presence of the metal oxide in the PANI matrix.
Polymers 15 00578 g003
Figure 4. Impedimetric Nyquist diagram of the complex impedance (a) and capacitive correlated Nyquist diagram, i.e., the capacitive spectra plot (b) for the PANI/WO3 nanocomposite. The impedimetric graph is used to obtain the charge-transfer resistance, R C T , for each buffer solution from the fitting of an equivalent circuit model (illustrated in the inset), while the capacitance graph is used to obtain the electrochemical capacitance, C μ ¯ ( ω ) , of the system from a phase-frequency analysis. The red lines are the adjusted curves for the equivalent circuit model.
Polymers 15 00578 g004
Figure 5. Electrochemical capacitance spectroscopy measurement analysis. The EIS phase angle vs. frequency in (a) and the capacitance data for the PANI/WO3 nanocomposite for each pH buffer solution in (b). From the frequency of the maximum phase, 1.99 Hz, the relative response of the capacitance is obtained for each pH buffer solution. Calibration curves using the relative response of the electrochemical capacitance, C μ ¯ , and the charge-transfer resistance, R C T , are plotted as a function of the pH in (c).
Polymers 15 00578 g005
Figure 6. Comparison of the analytical values of merit (sensitivity and linearity) for the impedimetric (EIS) and capacitive (ECS) electrochemical sensors for each group of materials presented in this work. In (a,b), the EIS and ECS responses, respectively, of the CeO2 group of films, and in (c,d), for the WO3 group of films.
Polymers 15 00578 g006
Figure 7. Analysis of the roughness-to-thickness ratio parameter for both sets of films. The red filled columns show the results for the CeO2 group of films, while the patterned blue filled columns show the results for the WO3 group of films.
Polymers 15 00578 g007
Table 1. The thickness and surface roughness, R Q (root mean square deviation), of the thin films from each group of materials.
SampleThickness (nm)RQ (nm)
PANI5.0 ± 1.01.7
CeO211.6 ± 1.82.8
PANI/CeO24.2 ± 0.22.9
WO321.1 ± 1.93.0
PANI/WO311.7 ± 0.22.5
Disclaimer/Publisher’s Note: The statements, opinions and data contained in all publications are solely those of the individual author(s) and contributor(s) and not of MDPI and/or the editor(s). MDPI and/or the editor(s) disclaim responsibility for any injury to people or property resulting from any ideas, methods, instructions or products referred to in the content.

