
Radiant Reinforcement: Enhancing Composite Polymer Magnet Materials Mechanical Properties with UVC Medical Disinfection
 , ,
, ,
Abstract
:1. Introduction
1.1. Magnetic Polymer Composites
1.2. UV Radiation
1.3. Mechanical Test Machine
1.4. Previous Work
1.5. Objectives of the Study
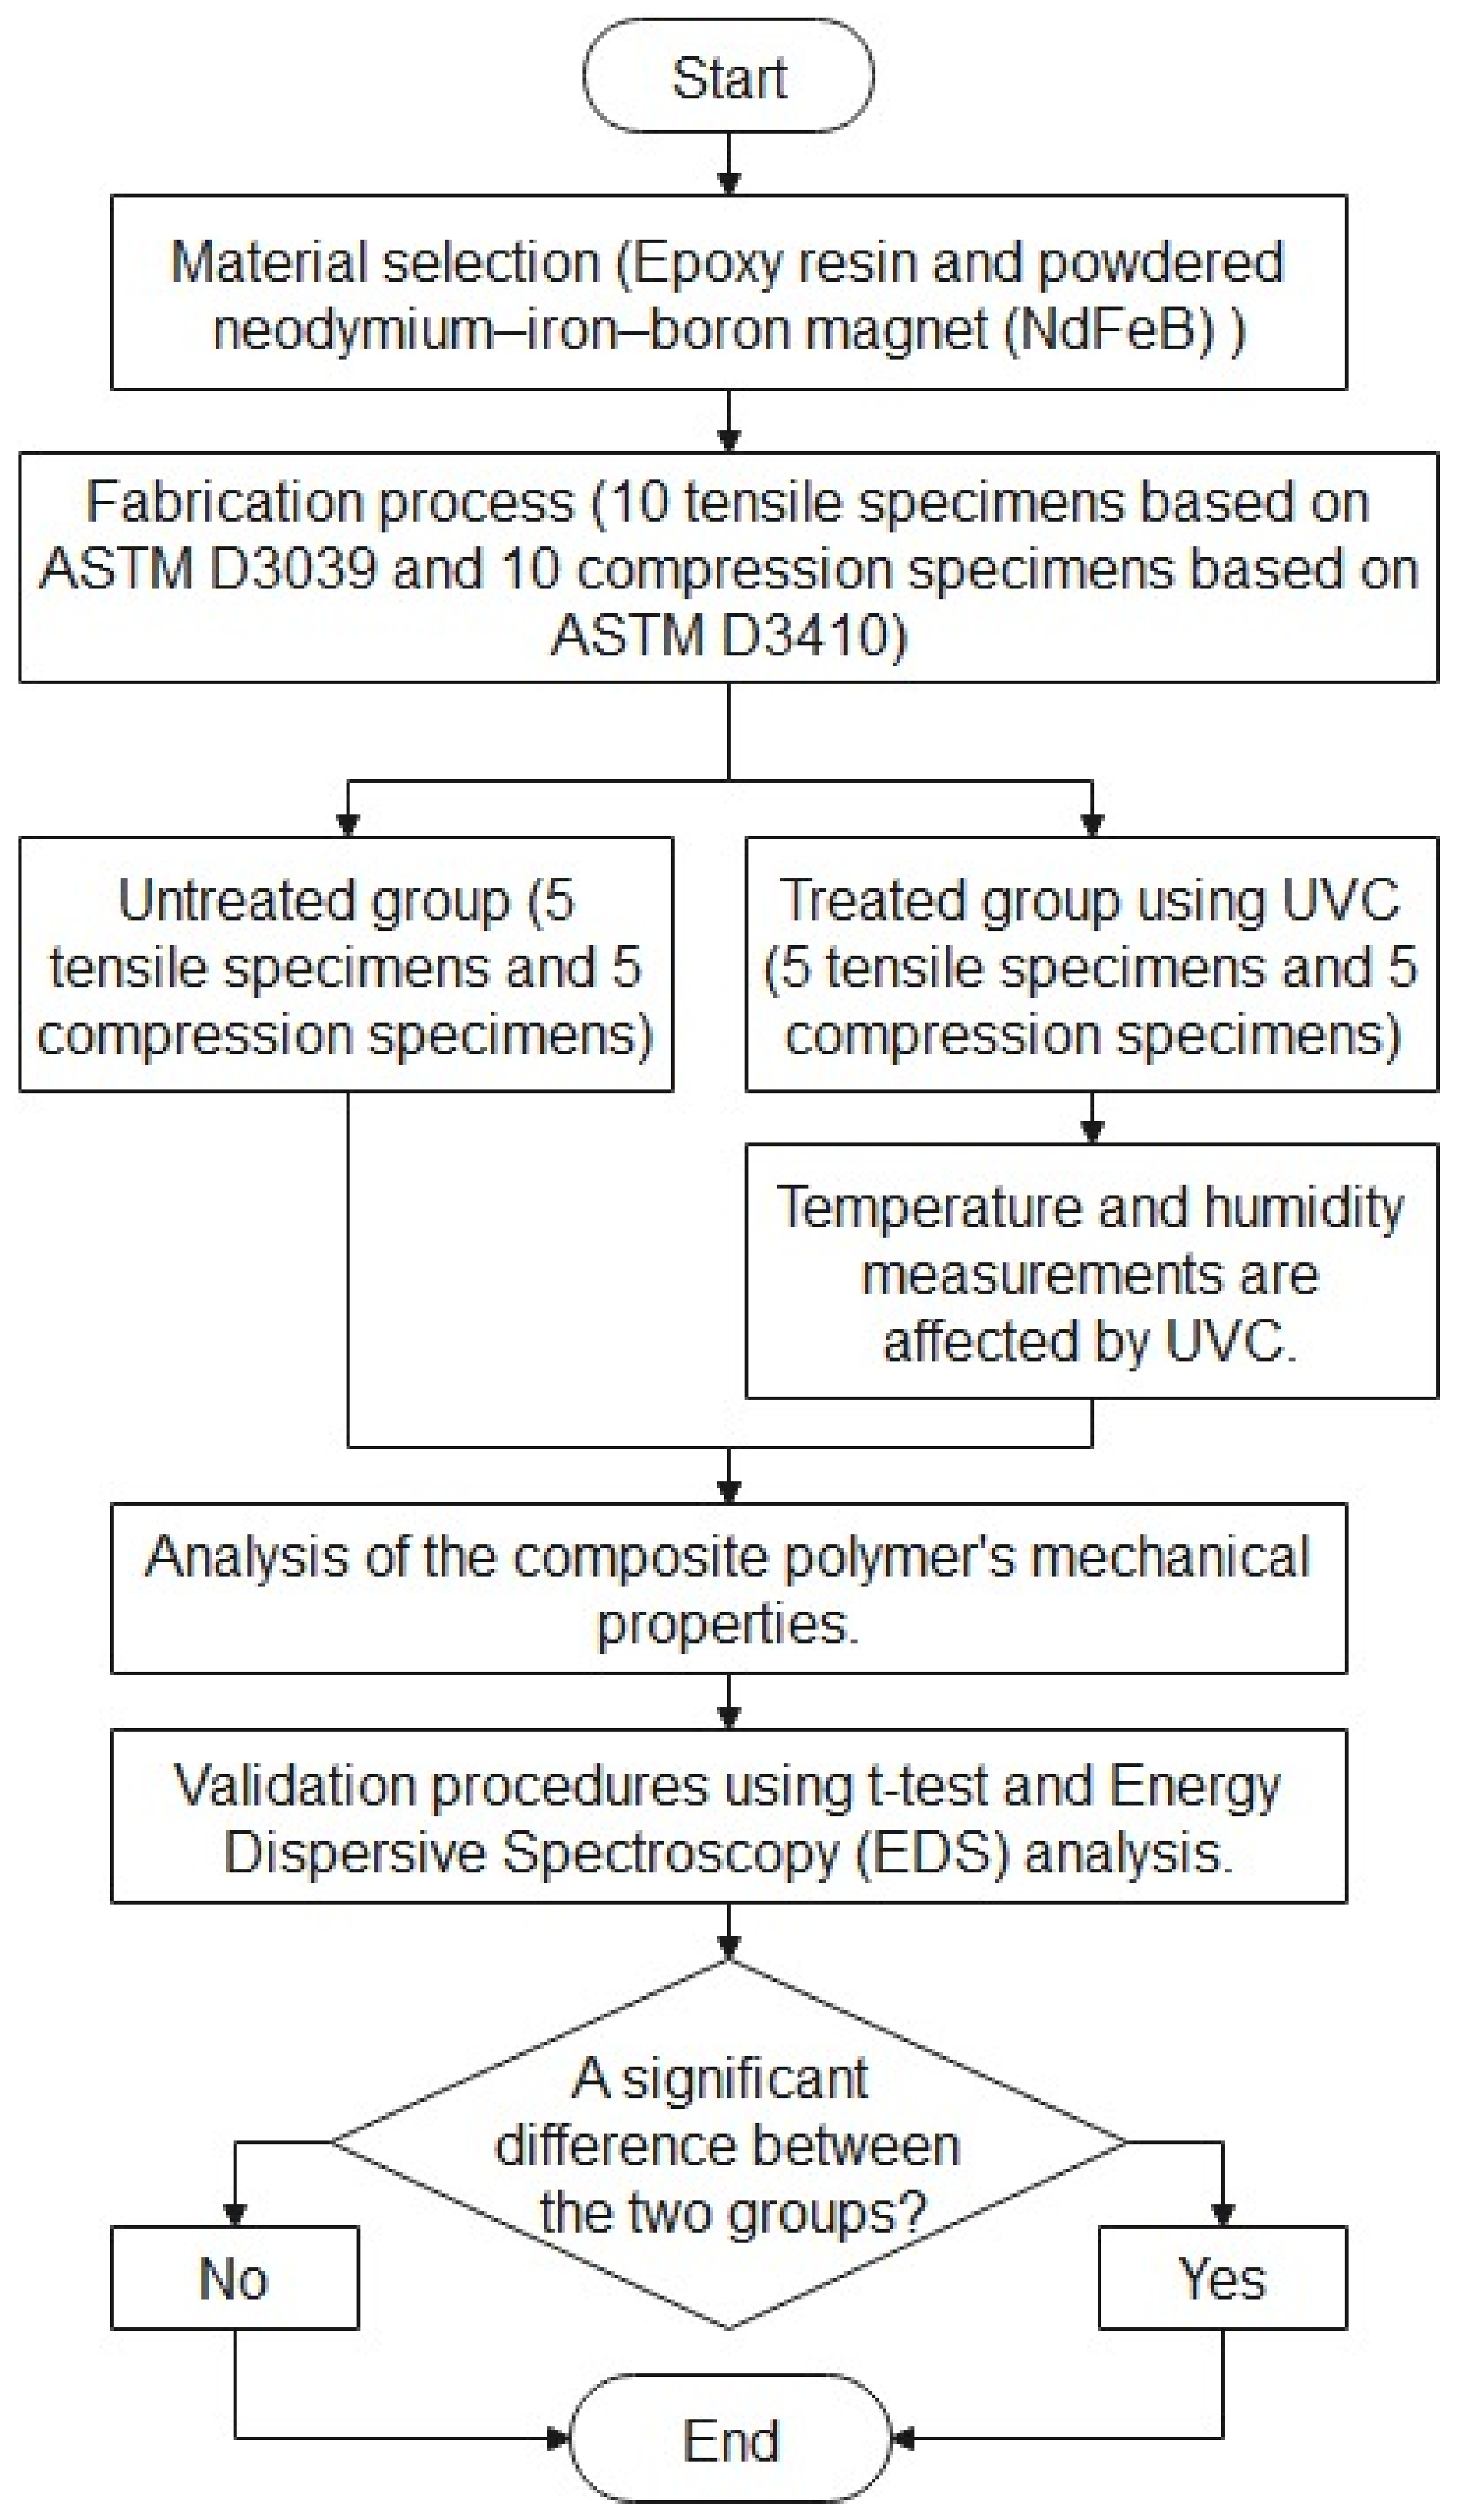
2. Materials and Methods
- Material Selection (Stage One): The initial stage involves the careful selection of materials, specifically epoxy resin and powdered neodymium–iron–boron magnet (NdFeB).
- Manufacturing Procedure (Stage Two): The second step encompasses the manufacturing process, which encompasses the creation of 20 distinct specimens. This batch consists of 10 tensile specimens and 10 compression specimens, adhering to the guidelines provided by ASTM D3039 and ASTM 3410, respectively [16,20].
- Data Partitioning (Stage Three): Referred to as the third stage, data partitioning involves the separation of specimens into two distinct groups. These are the untreated group, which comprises five tensile and five compression specimens, and the treated group. The treated group also comprises five tensile and five compression specimens that were exposed to ultraviolet light. It is worth noting that the impact of UVC irradiation on temperature and humidity readings is also monitored throughout the treatment process.
- Examination of Mechanical Characteristics (Stage Four): The fourth stage focuses on a comprehensive examination of the mechanical traits of the composite polymer., by applying controlled forces to all test specimens and measure their response (stress—strain). This data is used to construct a stress–strain curve for the material. Then, key points on the curve, such as the yield point, ultimate strength, and fracture point, are collected to provide valuable information about the material’s mechanical properties and its behavior.
- Validation Process (Stage Five): The fifth stage entails employing the t-test and utilizing Energy Dispersive Spectroscopy (EDS) as a second chemical validation test to determine the effect of the disinfection method on the amount of carbon, oxygen, and iron within the surface of the composite polymer magnet material.
- Assessment of Group Differences (Stage Six): Lastly, the sixth section revolves around determining whether a significant distinction exists between the two groups.

2.1. Material Selection and Specimens Fabrication Process
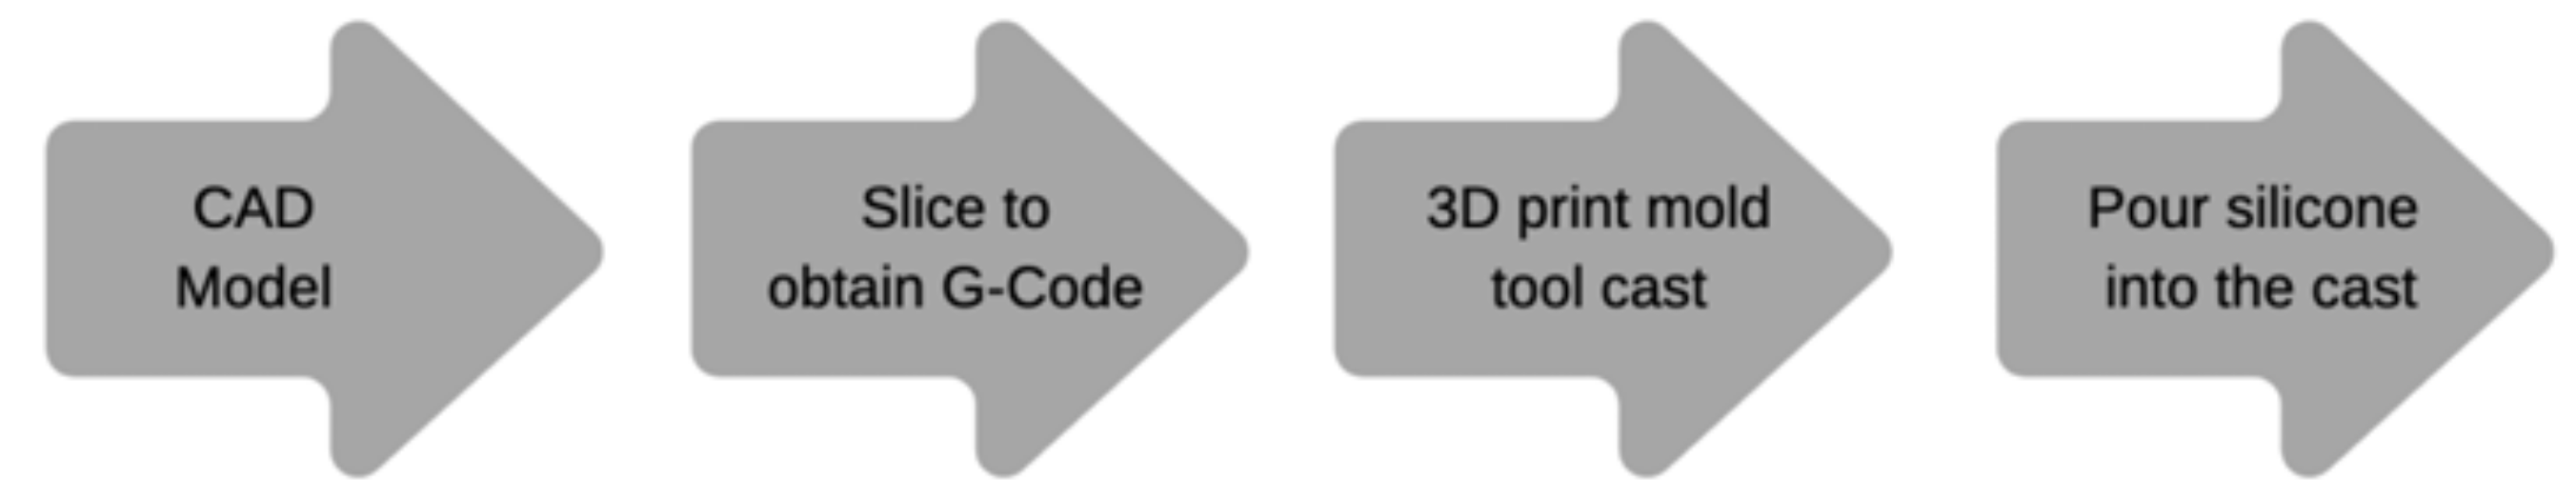
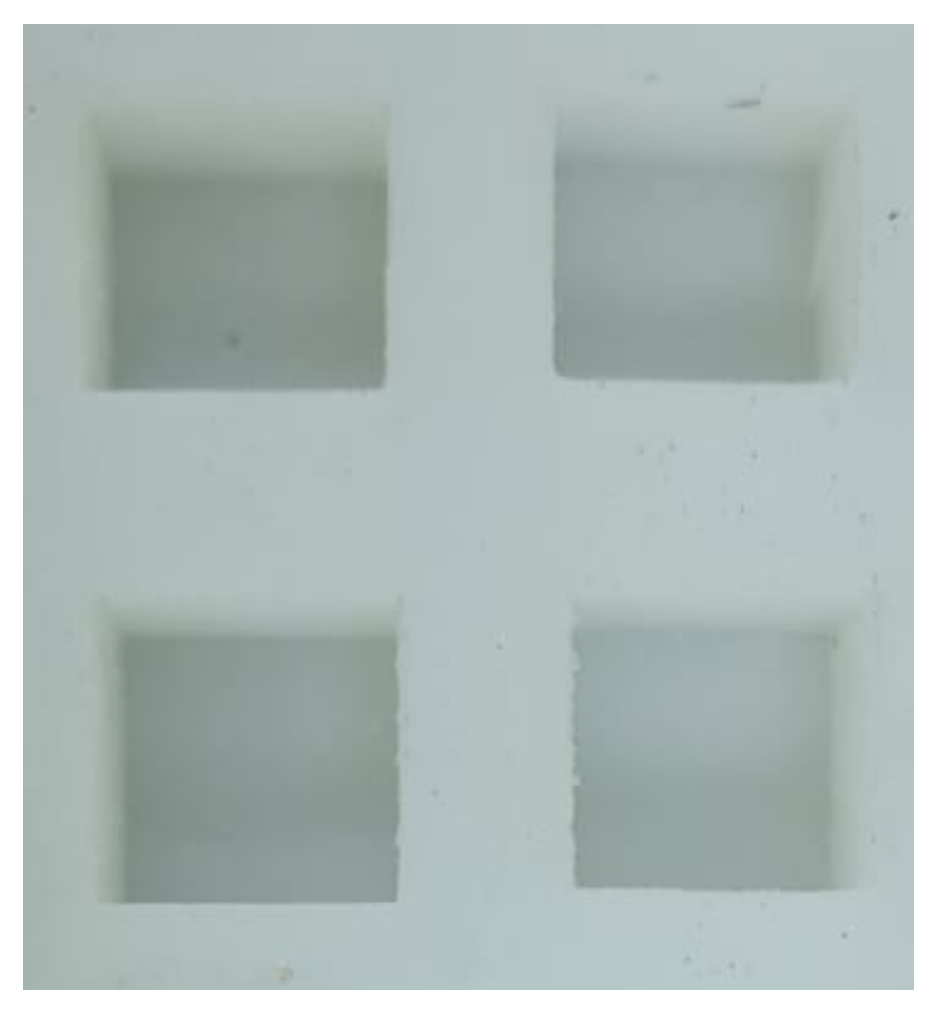
2.1.1. Silicone Mold
2.1.2. Epoxy Resin
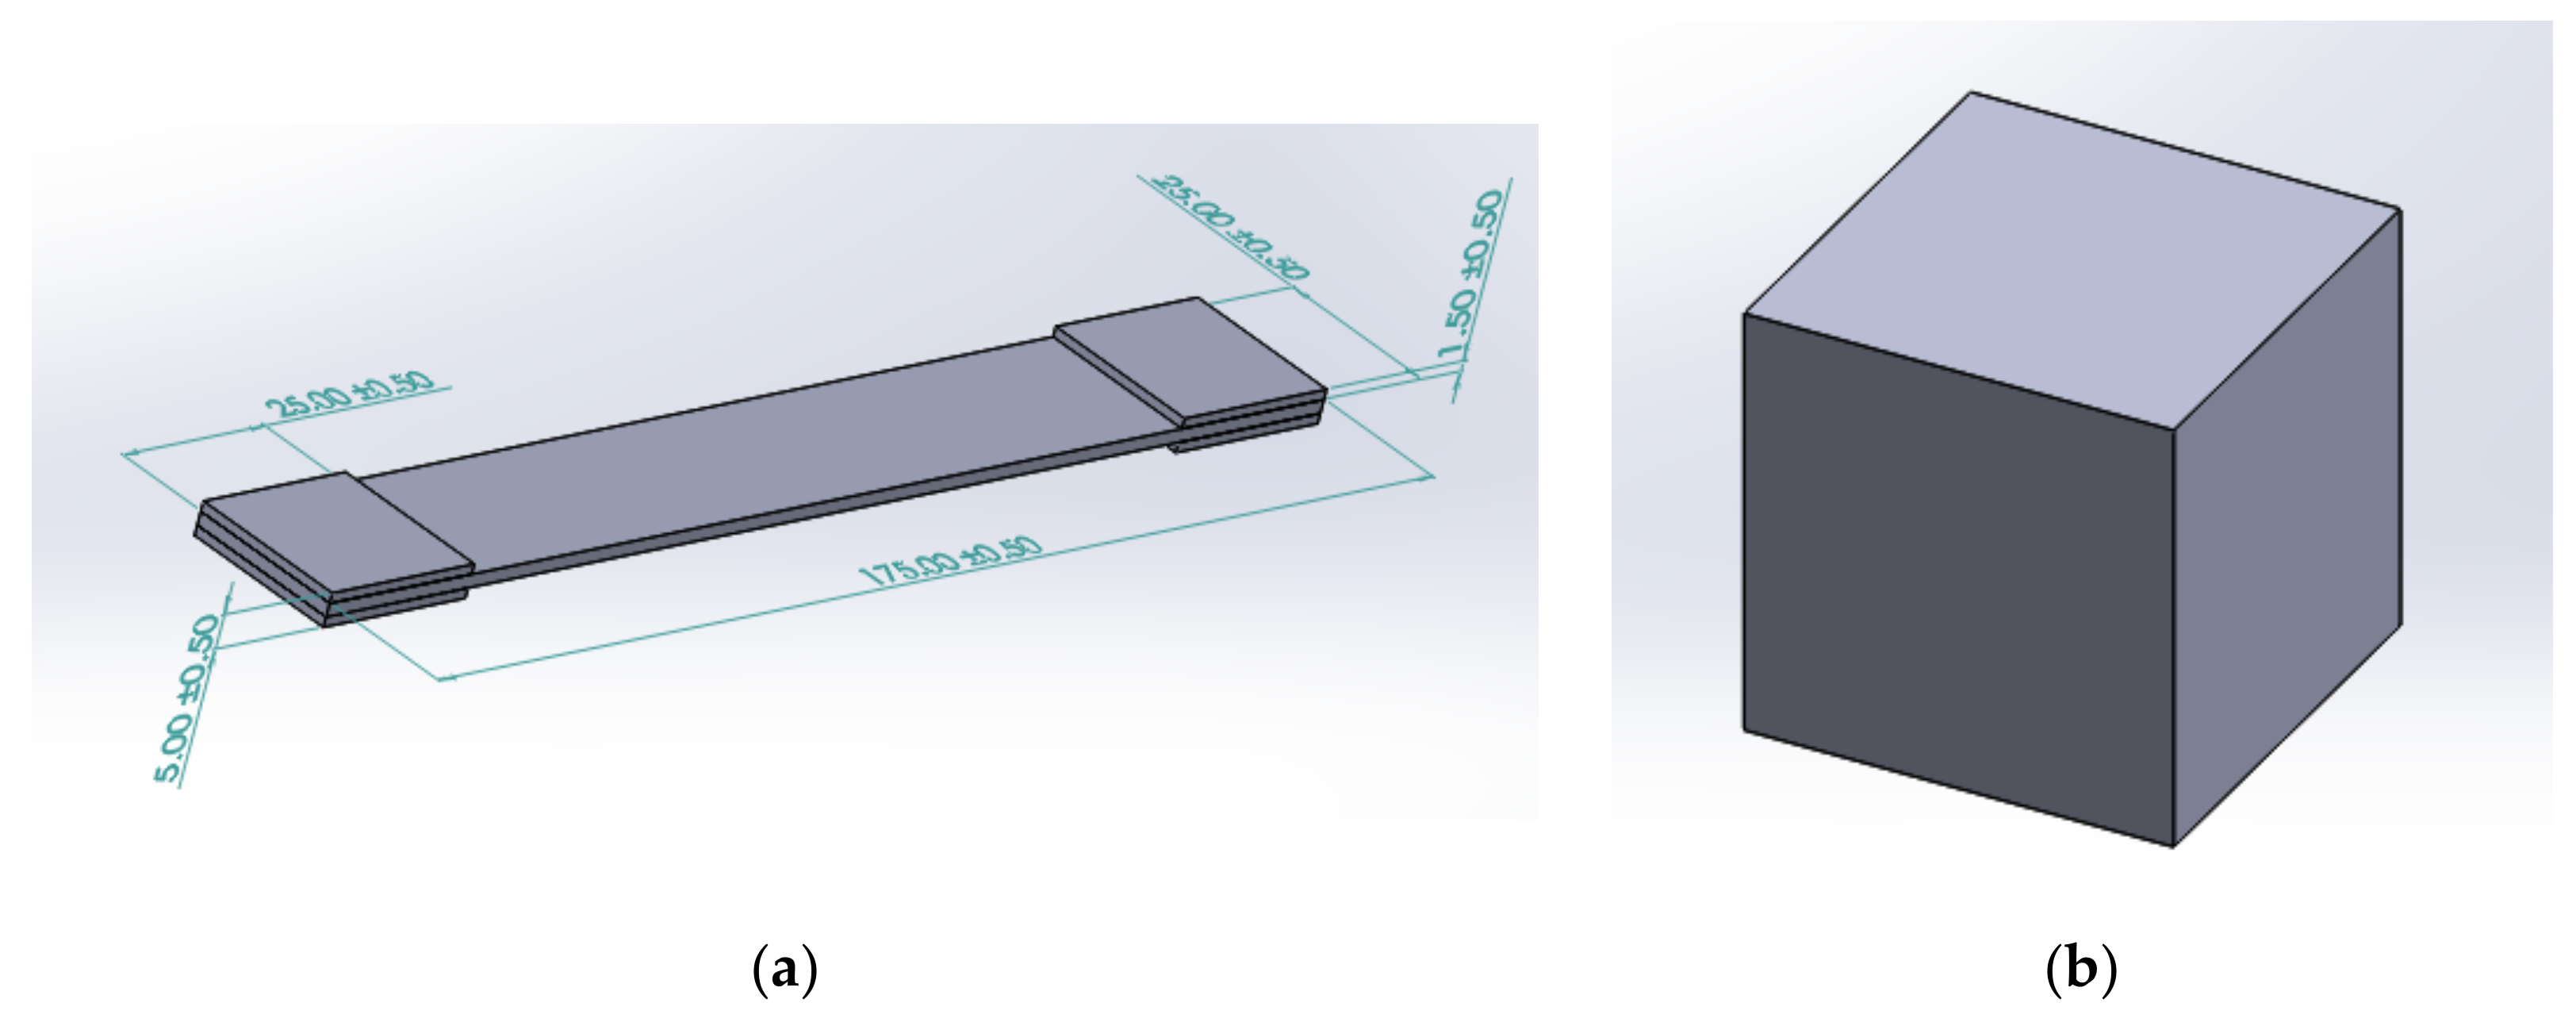
2.2. Geometrical Data of Tensile and Compression Specimens
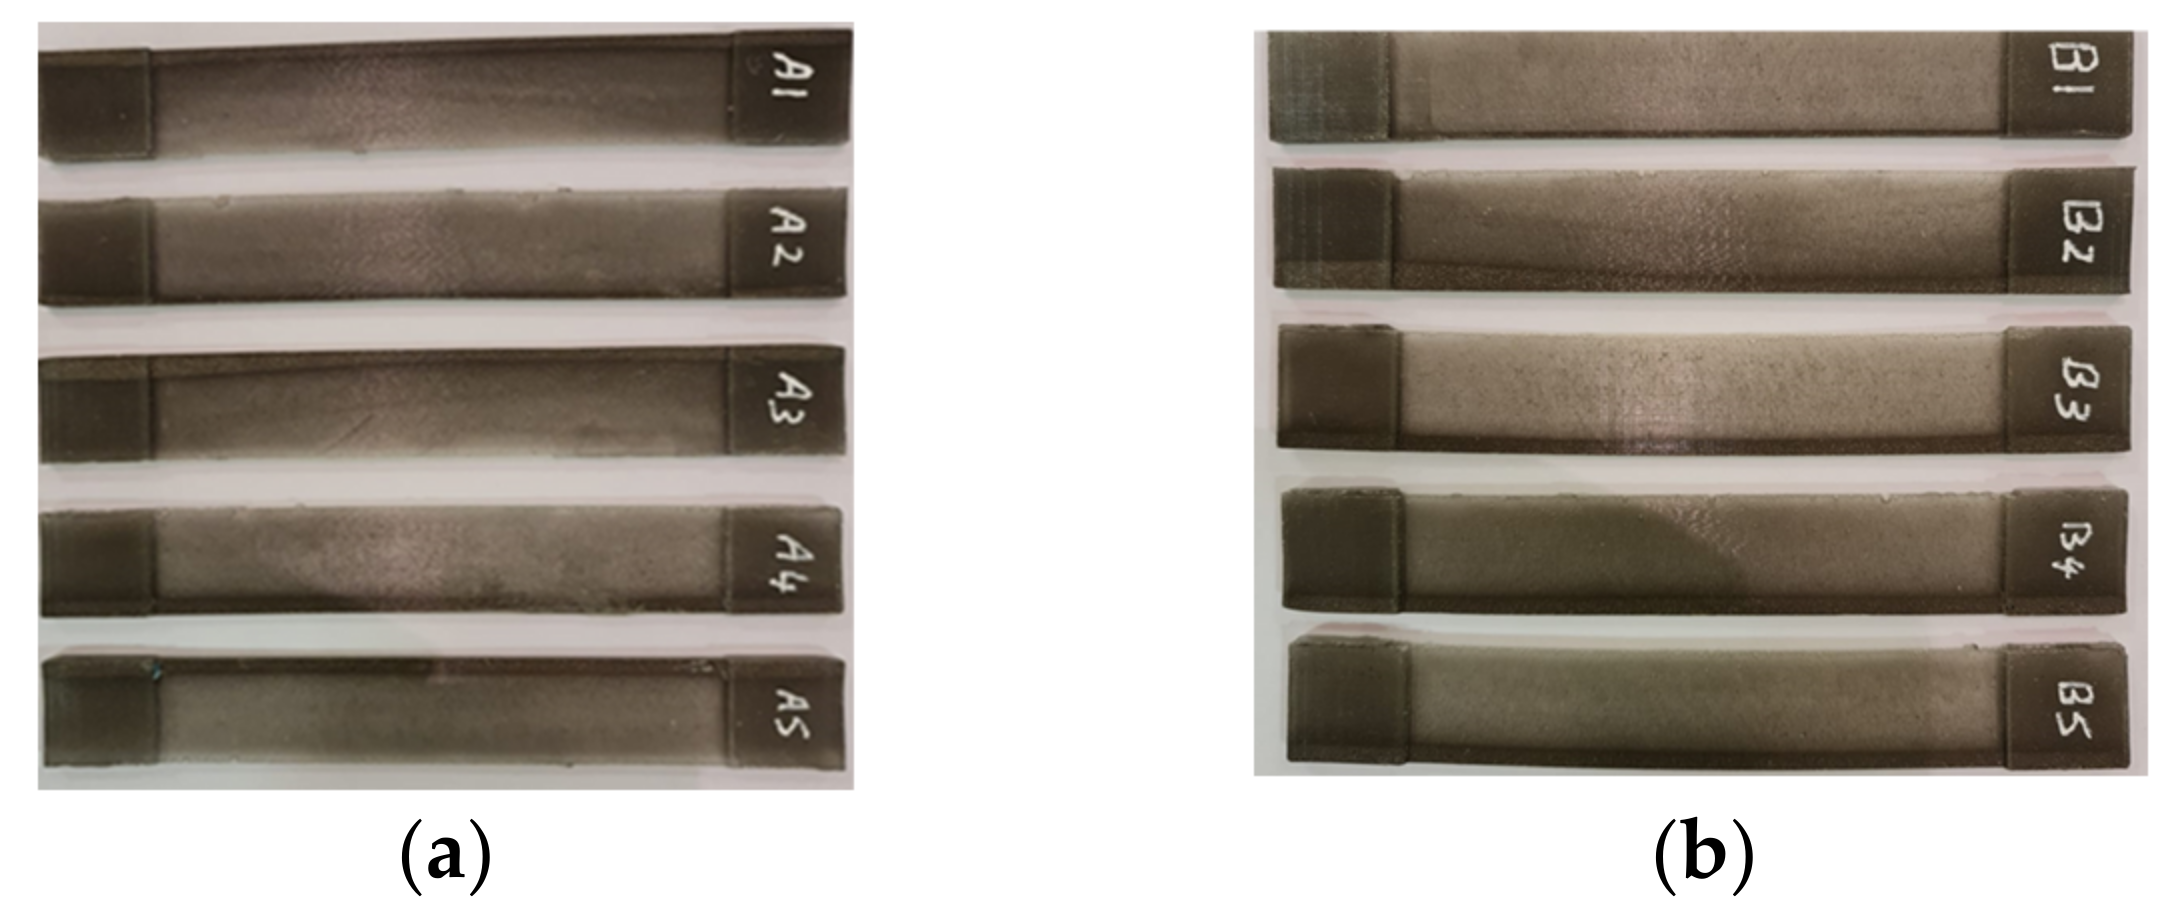
2.2.1. Tensile Specimens


| Specimen Label | Inner Length [mm] | Outer Length [mm] | Width [mm] | Inner Thickness [mm] | Outer Thickness [mm] | Weight [g] |
|---|---|---|---|---|---|---|
| A1 | 125.16 | 174.9 | 24.9 | 1.44 | 5 | 15.8 |
| A2 | 125.12 | 175 | 24.9 | 1.42 | 5.1 | 15.89 |
| A3 | 125 | 174.9 | 25.1 | 1.5 | 5 | 15.84 |
| A4 | 124.9 | 175 | 25.1 | 1.4 | 4.93 | 15.78 |
| A5 | 124.9 | 174.9 | 24.95 | 1.44 | 4.92 | 15.7 |
| Average | 125.02 | 174.94 | 24.99 | 1.44 | 4.99 | 15.8 |
| ±std | 0.12 | 0.05 | 0.1 | 0.04 | 0.07 | 0.07 |
| B1 | 125.1 | 175 | 24.98 | 1.5 | 4.97 | 15.89 |
| B2 | 125.1 | 175 | 24.94 | 1.41 | 4.99 | 15.8 |
| B3 | 125.13 | 174.9 | 24.9 | 1.43 | 4.95 | 15.84 |
| B4 | 124.9 | 174.9 | 25.1 | 1.43 | 4.97 | 15.83 |
| B5 | 124.92 | 175 | 24.9 | 1.44 | 5 | 15.81 |
| Average | 125.03 | 174.96 | 24.96 | 1.44 | 4.98 | 15.83 |
| ±std | 0.11 | 0.05 | 0.08 | 0.03 | 0.02 | 0.04 |
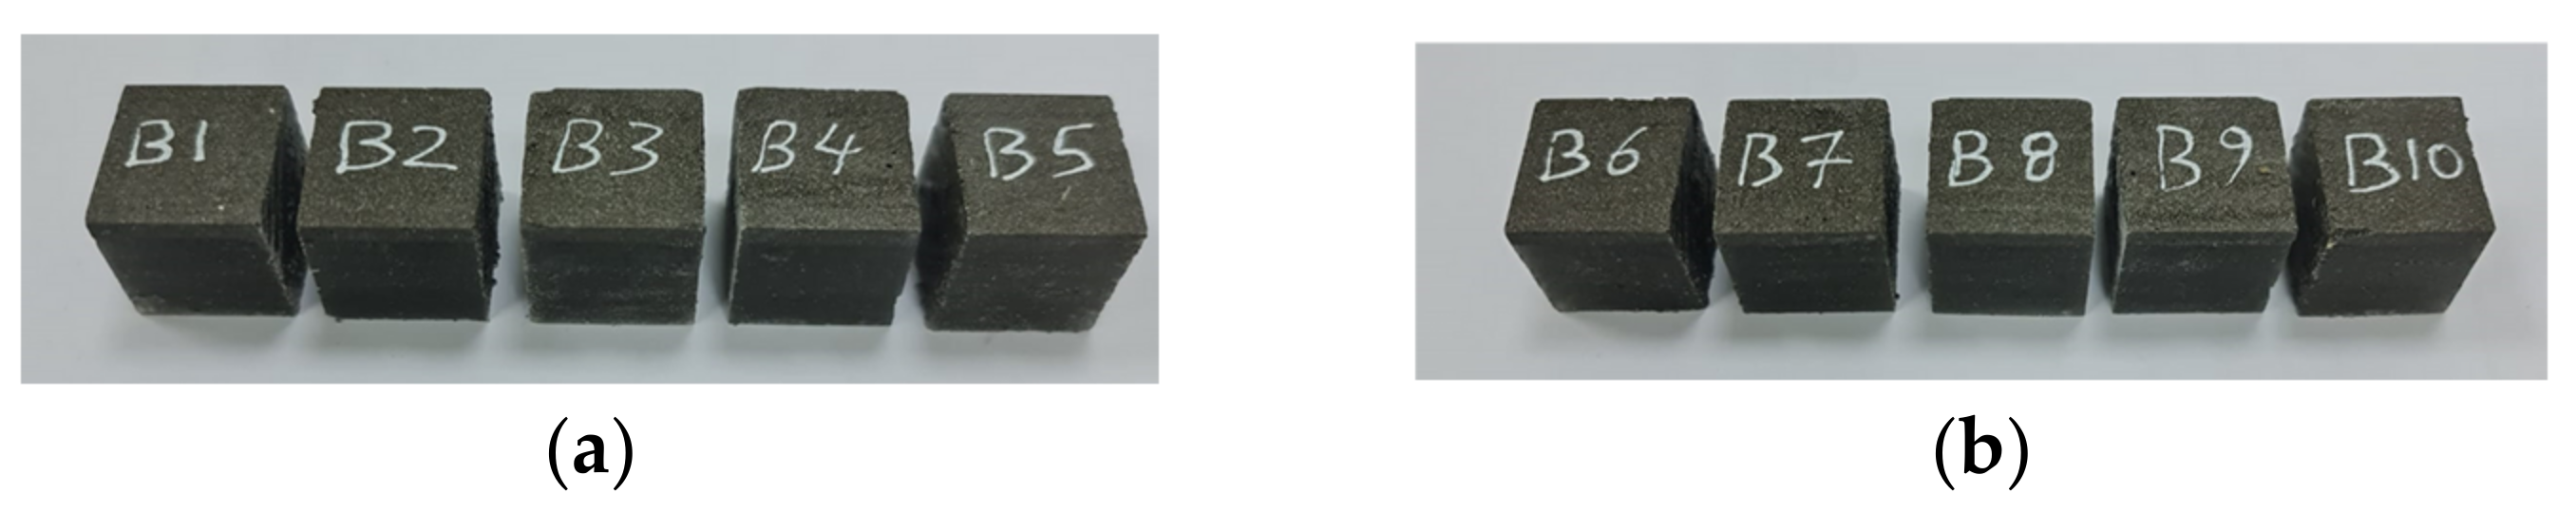
2.2.2. Compression Specimens

| Specimen Label | Side Length [mm] | Weight [g] |
|---|---|---|
| B1 | 25.1 | 15.8 |
| B2 | 25 | 15.77 |
| B3 | 25.1 | 15.8 |
| B4 | 25 | 15.77 |
| B5 | 24.9 | 15.7 |
| Average | 25.02 | 15.77 |
| ±std | 0.08 | 0.04 |
| B6 | 25 | 15.76 |
| B7 | 25.1 | 15.79 |
| B8 | 25.1 | 15.8 |
| B9 | 25 | 15.76 |
| B10 | 25 | 15.77 |
| Average | 25.04 | 15.78 |
| ±std | 0.05 | 0.02 |
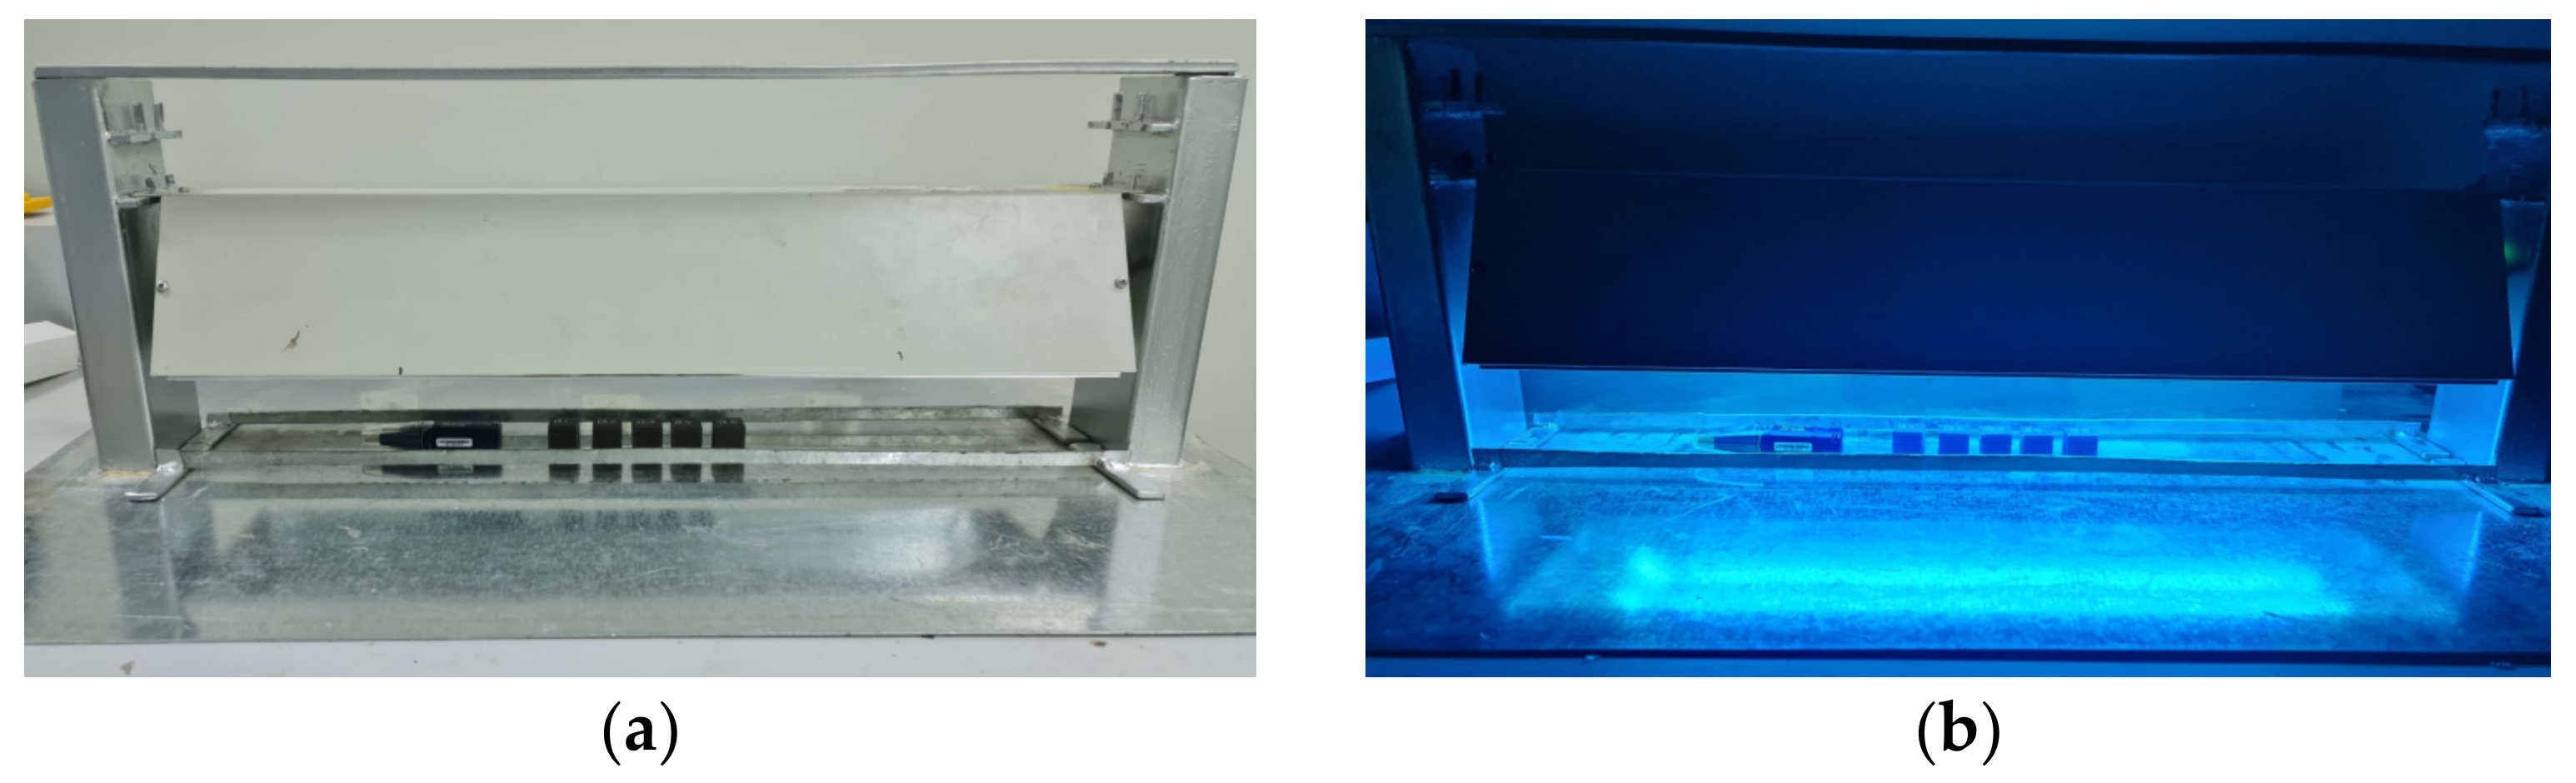
2.3. The Role of UV Radiation in the Deactivation of Viruses and Bacteria
2.3.1. UV Irradiation Enclosure

2.3.2. Exposure Time Calculations
2.3.3. t-Test with Two Samples
2.3.4. Energy-Dispersive X-ray Spectroscopy (EDS)
3. Results
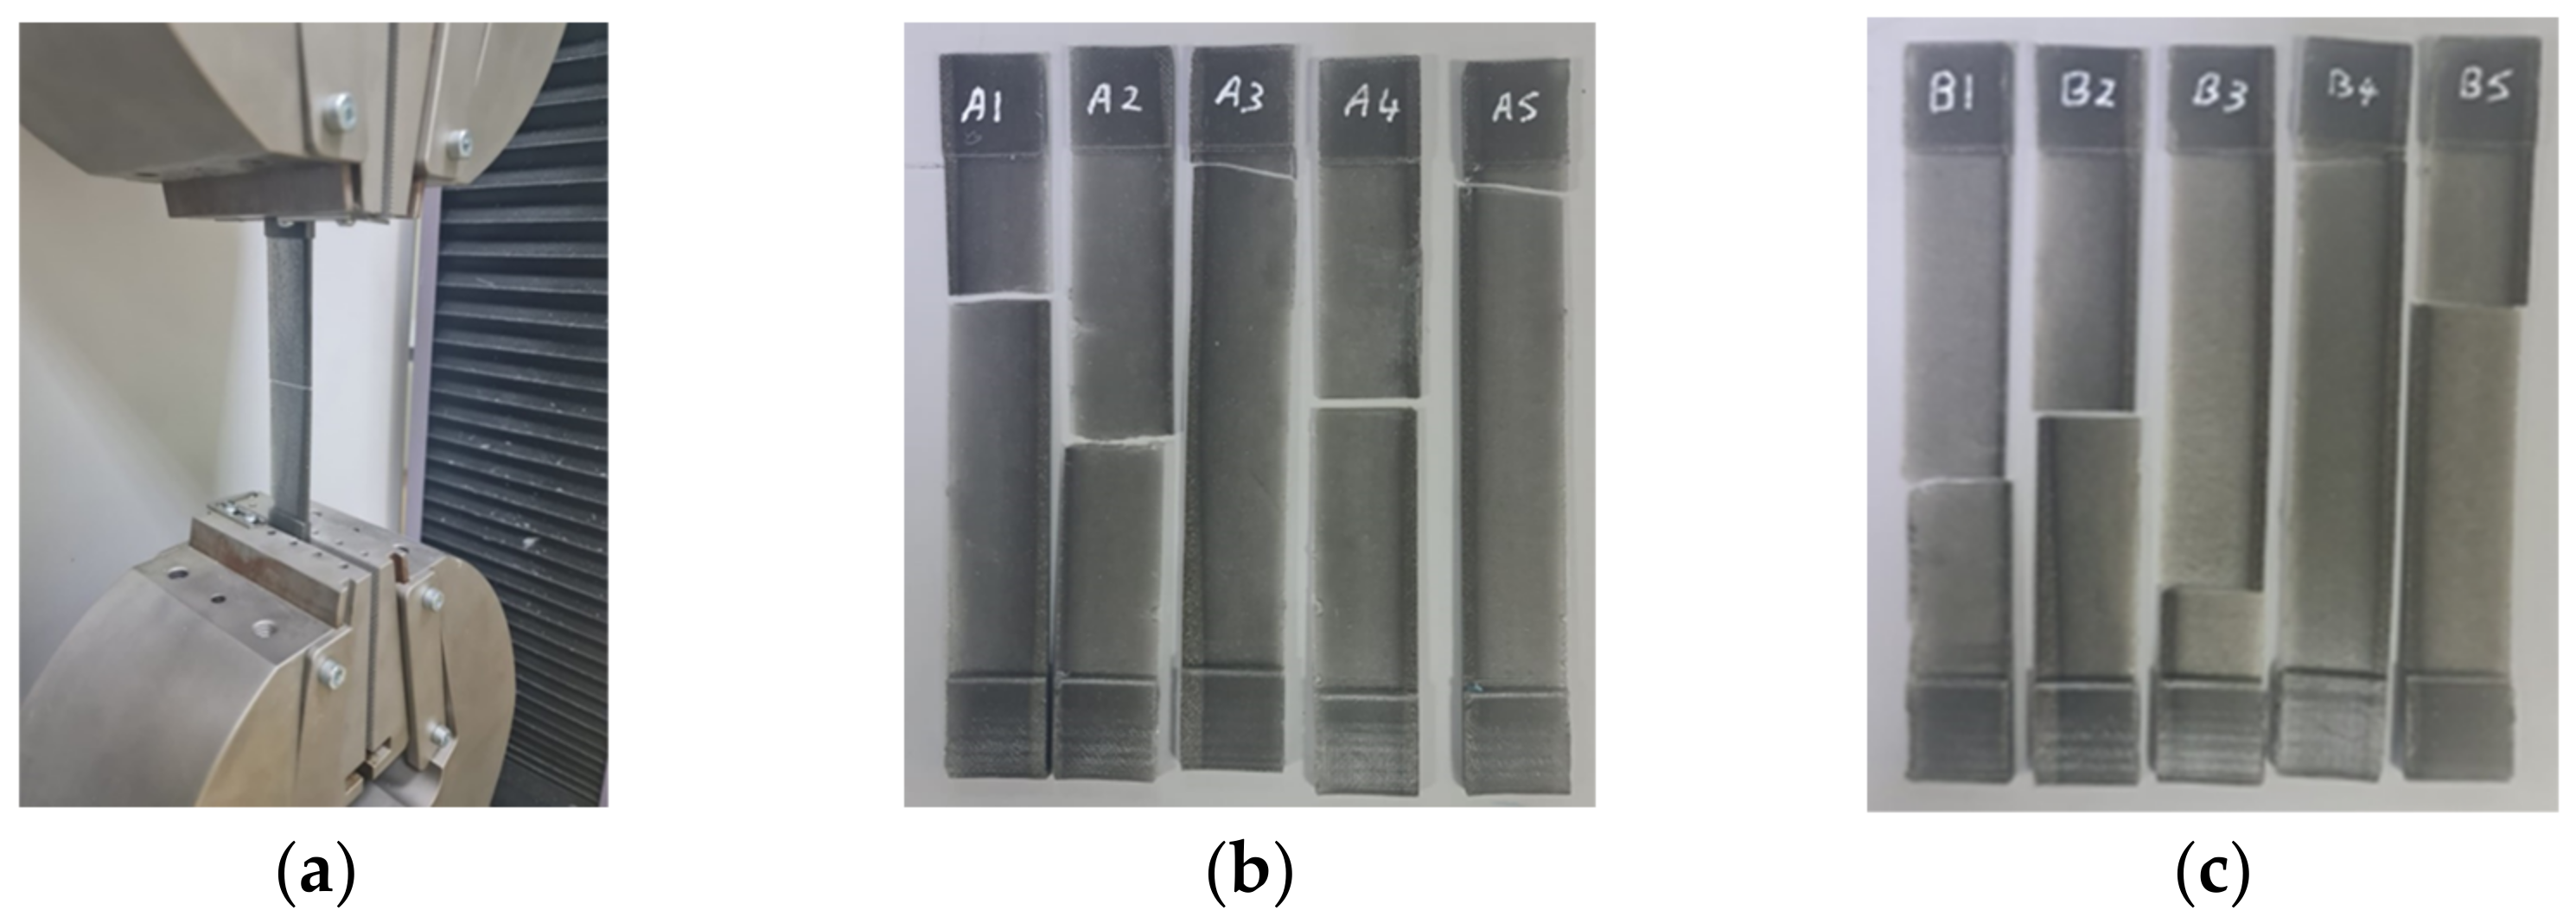
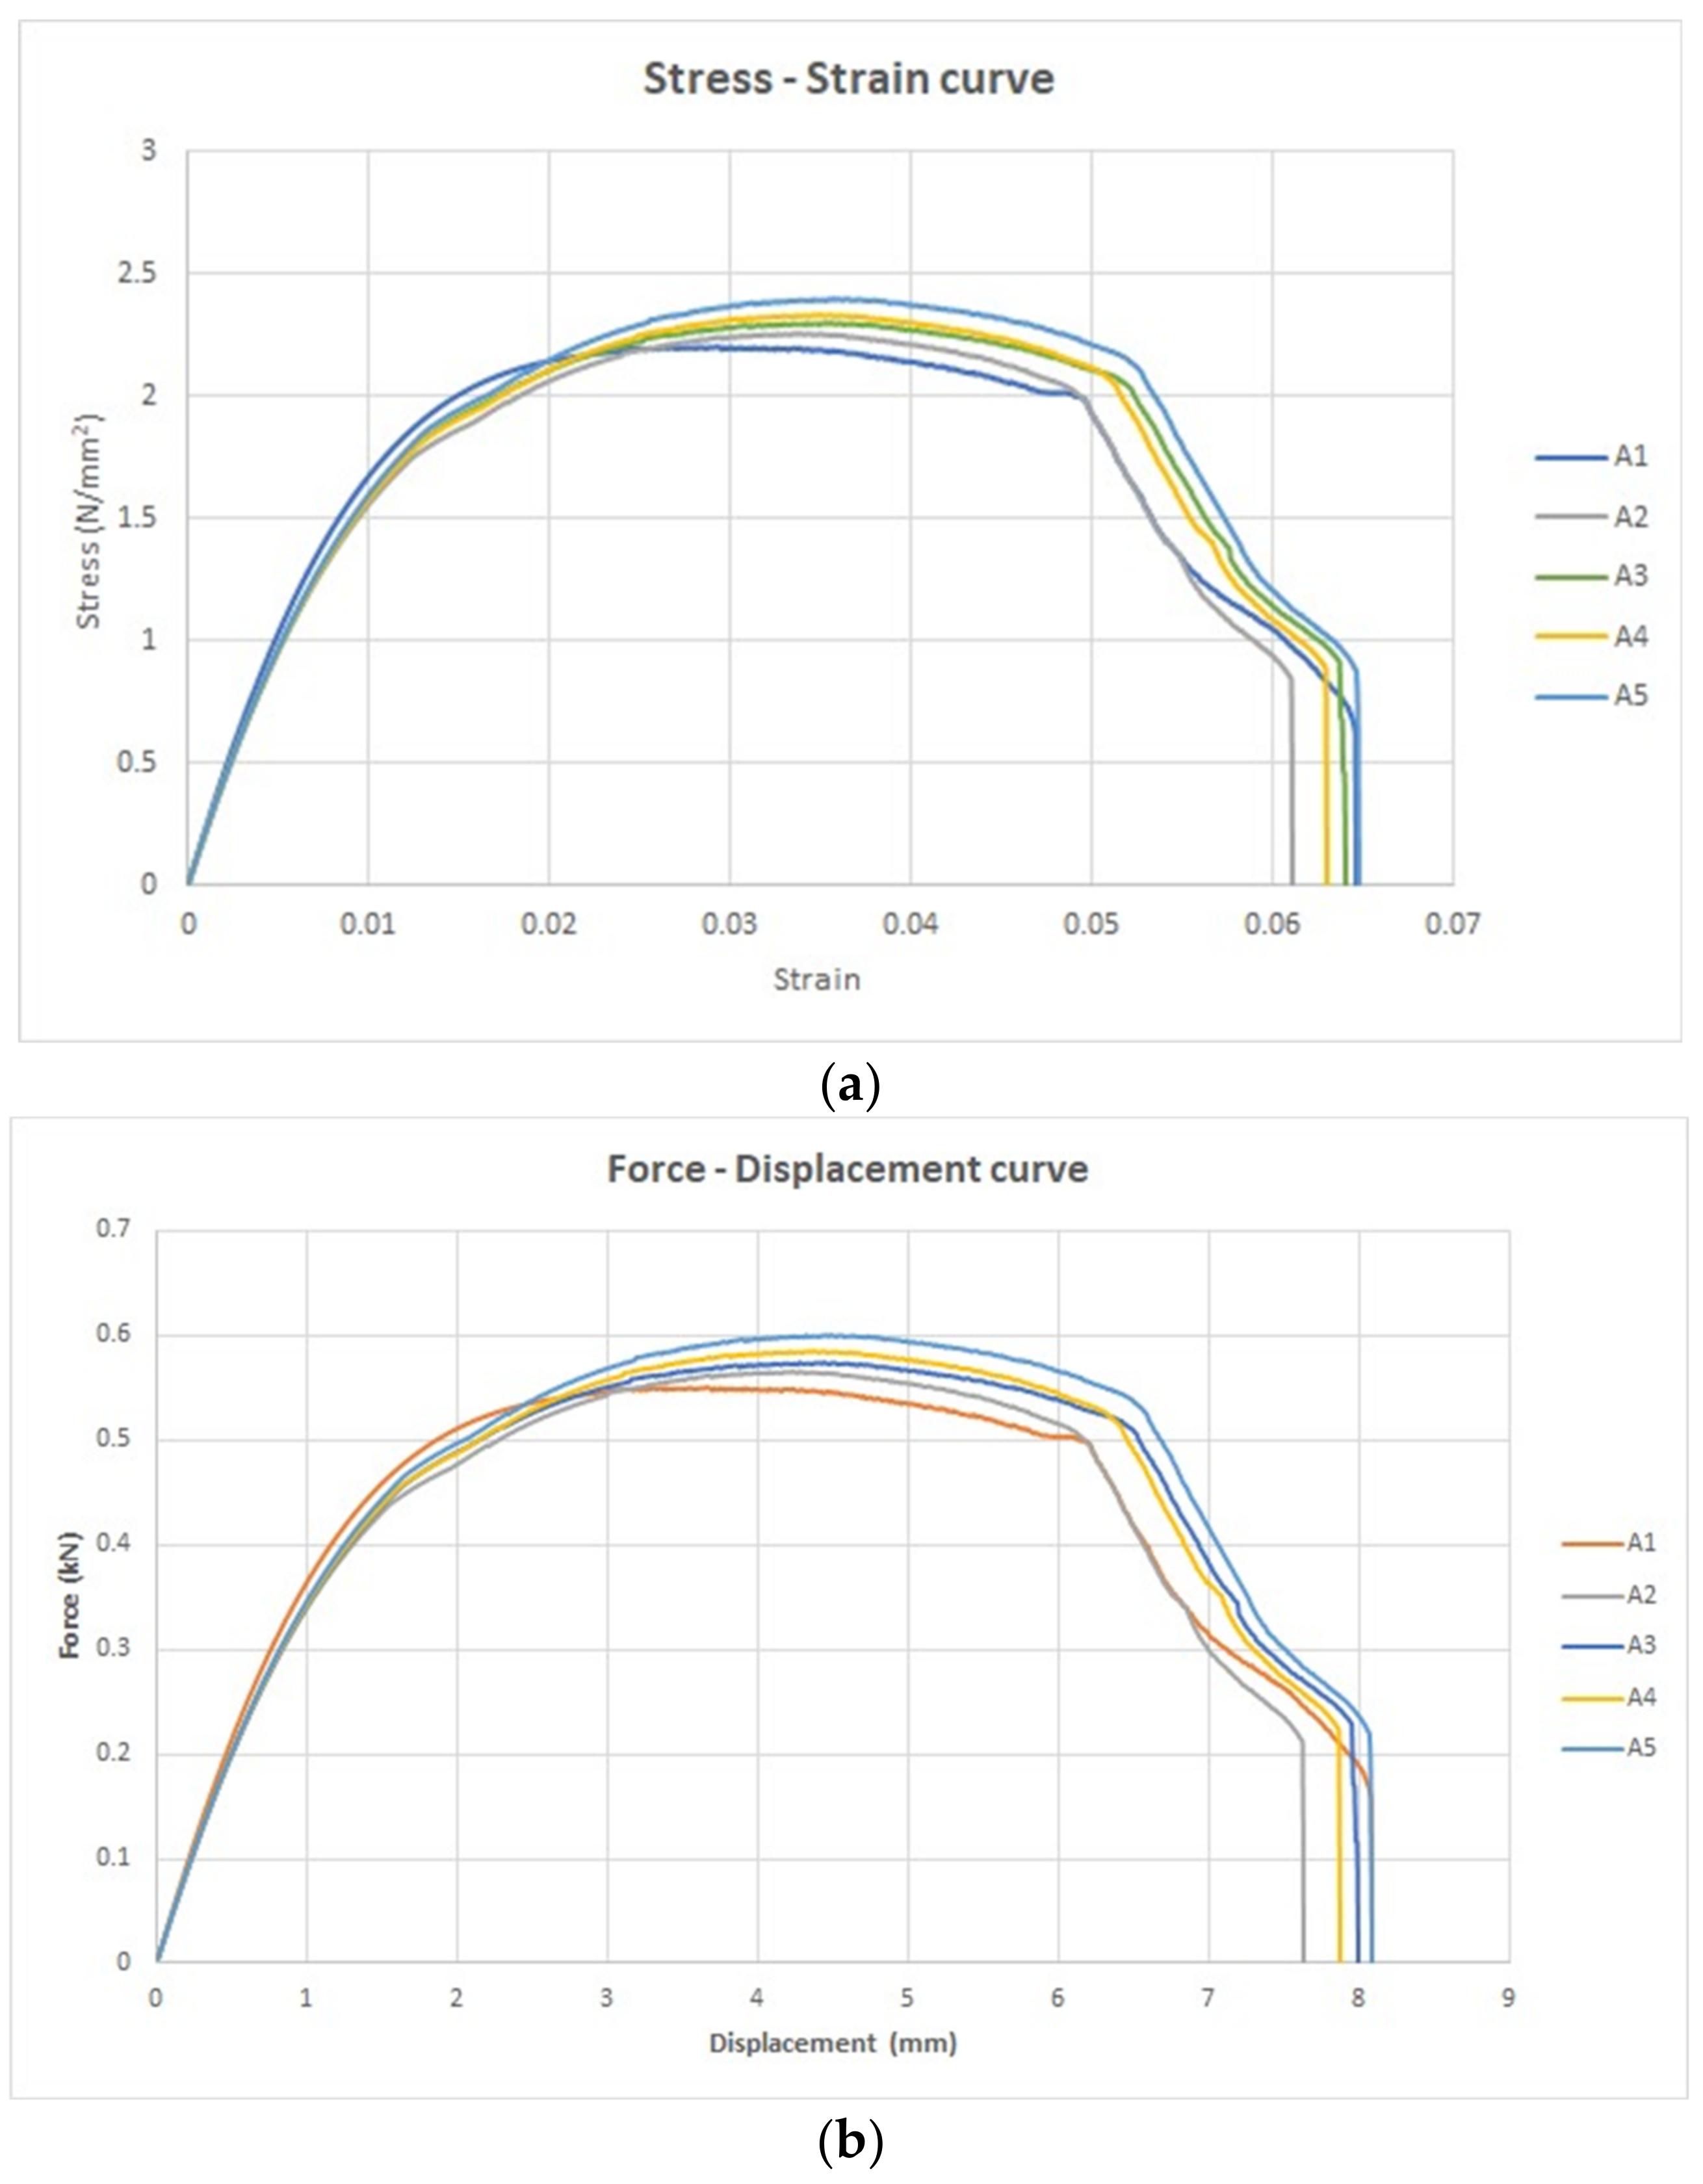
3.1. Tensile Test for Untreated Specimens with UV

- The transition point, marking the boundary between the elastic and plastic regions.
- The ultimate point, signifying the maximum stress the material can withstand.
- The fracture point, denoting the conclusion of the plastic deformation region.
- The transition force, distinguishing the elastic from the plastic domains.
- The ultimate force, indicating the maximum force the material can endure.
- The fracture force, highlighting the point of material failure.

- Transition stress (N/mm2)
- Transition strain
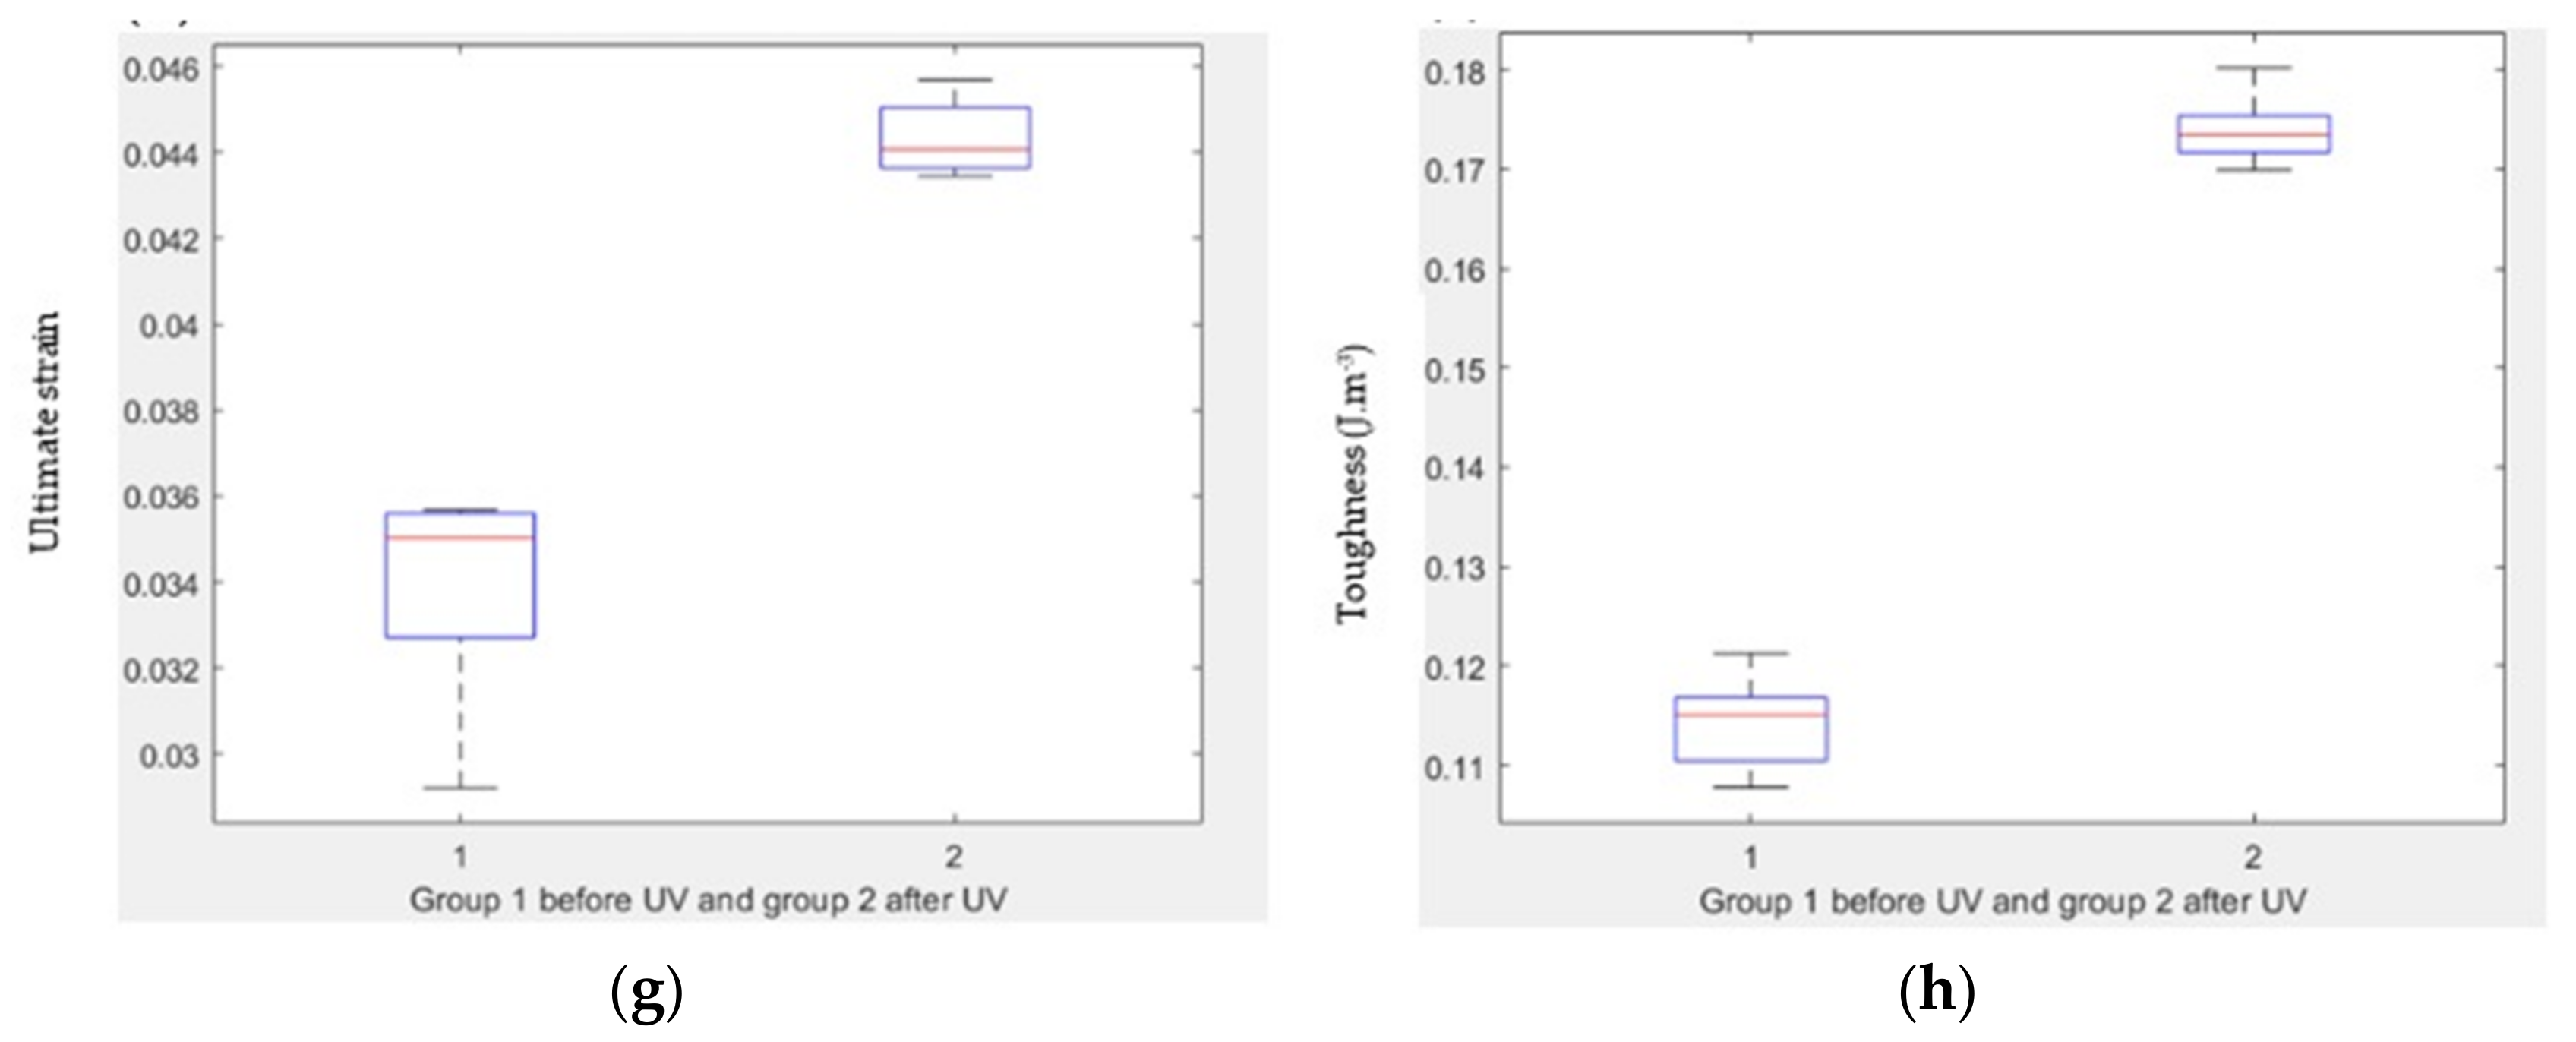
- Ultimate strain
- Ultimate stress (N/mm2)
- Fracture strain
- Fracture stress (N/mm2)
- Average transition stress: 1.6 N/mm2
- Average transition strain: 0.03
- Average ultimate strain: 0.03
- Average ultimate stress: 2.3 N/mm2
- Average fracture strain: 0.06
- Average fracture stress: 0.71 N/mm2
| Specimen Label | Transition Stress (N/mm2) | Transition Strain | Ultimate Strain | Ultimate Stress (N/mm2) | Fracture Strain | Fracture Stress (N/mm2) |
|---|---|---|---|---|---|---|
| A1 | 1.6 | 0.09 | 0.03 | 2.2 | 0.07 | 0.62 |
| A2 | 1.7 | 0.01 | 0.03 | 2.3 | 0.06 | 0.84 |
| A3 | 1.7 | 0.01 | 0.04 | 2.3 | 0.06 | 0.47 |
| A4 | 1.7 | 0.01 | 0.04 | 2.3 | 0.06 | 0.89 |
| A5 | 1.6 | 0.01 | 0.04 | 2.4 | 0.07 | 0.72 |
| Average | 1.6 | 0.03 | 0.03 | 2.3 | 0.06 | 0.71 |
| ±std | 0.04 | 0.04 | 0 | 0.08 | 0 | 0.17 |
- Average resilience (energy absorbed in elastic region): 0.01 J/m3
- Average toughness (energy absorbed in both elastic and plastic regions): 0.11 J/m3.
| Specimen Label | Resilience (J/m3) | Toughness (J/m3) |
|---|---|---|
| A1 | 0.01 | 0.11 |
| A2 | 0.01 | 0.11 |
| A3 | 0.01 | 0.12 |
| A4 | 0.01 | 0.12 |
| A5 | 0.01 | 0.12 |
| Average | 0.01 | 0.11 |
| ±std | 0 | 0.01 |
- Transition force (kN)
- Transition displacement (mm)
- Ultimate displacement (mm)
- Ultimate force (kN)
- Fracture displacement (mm)
- Fracture force (kN)
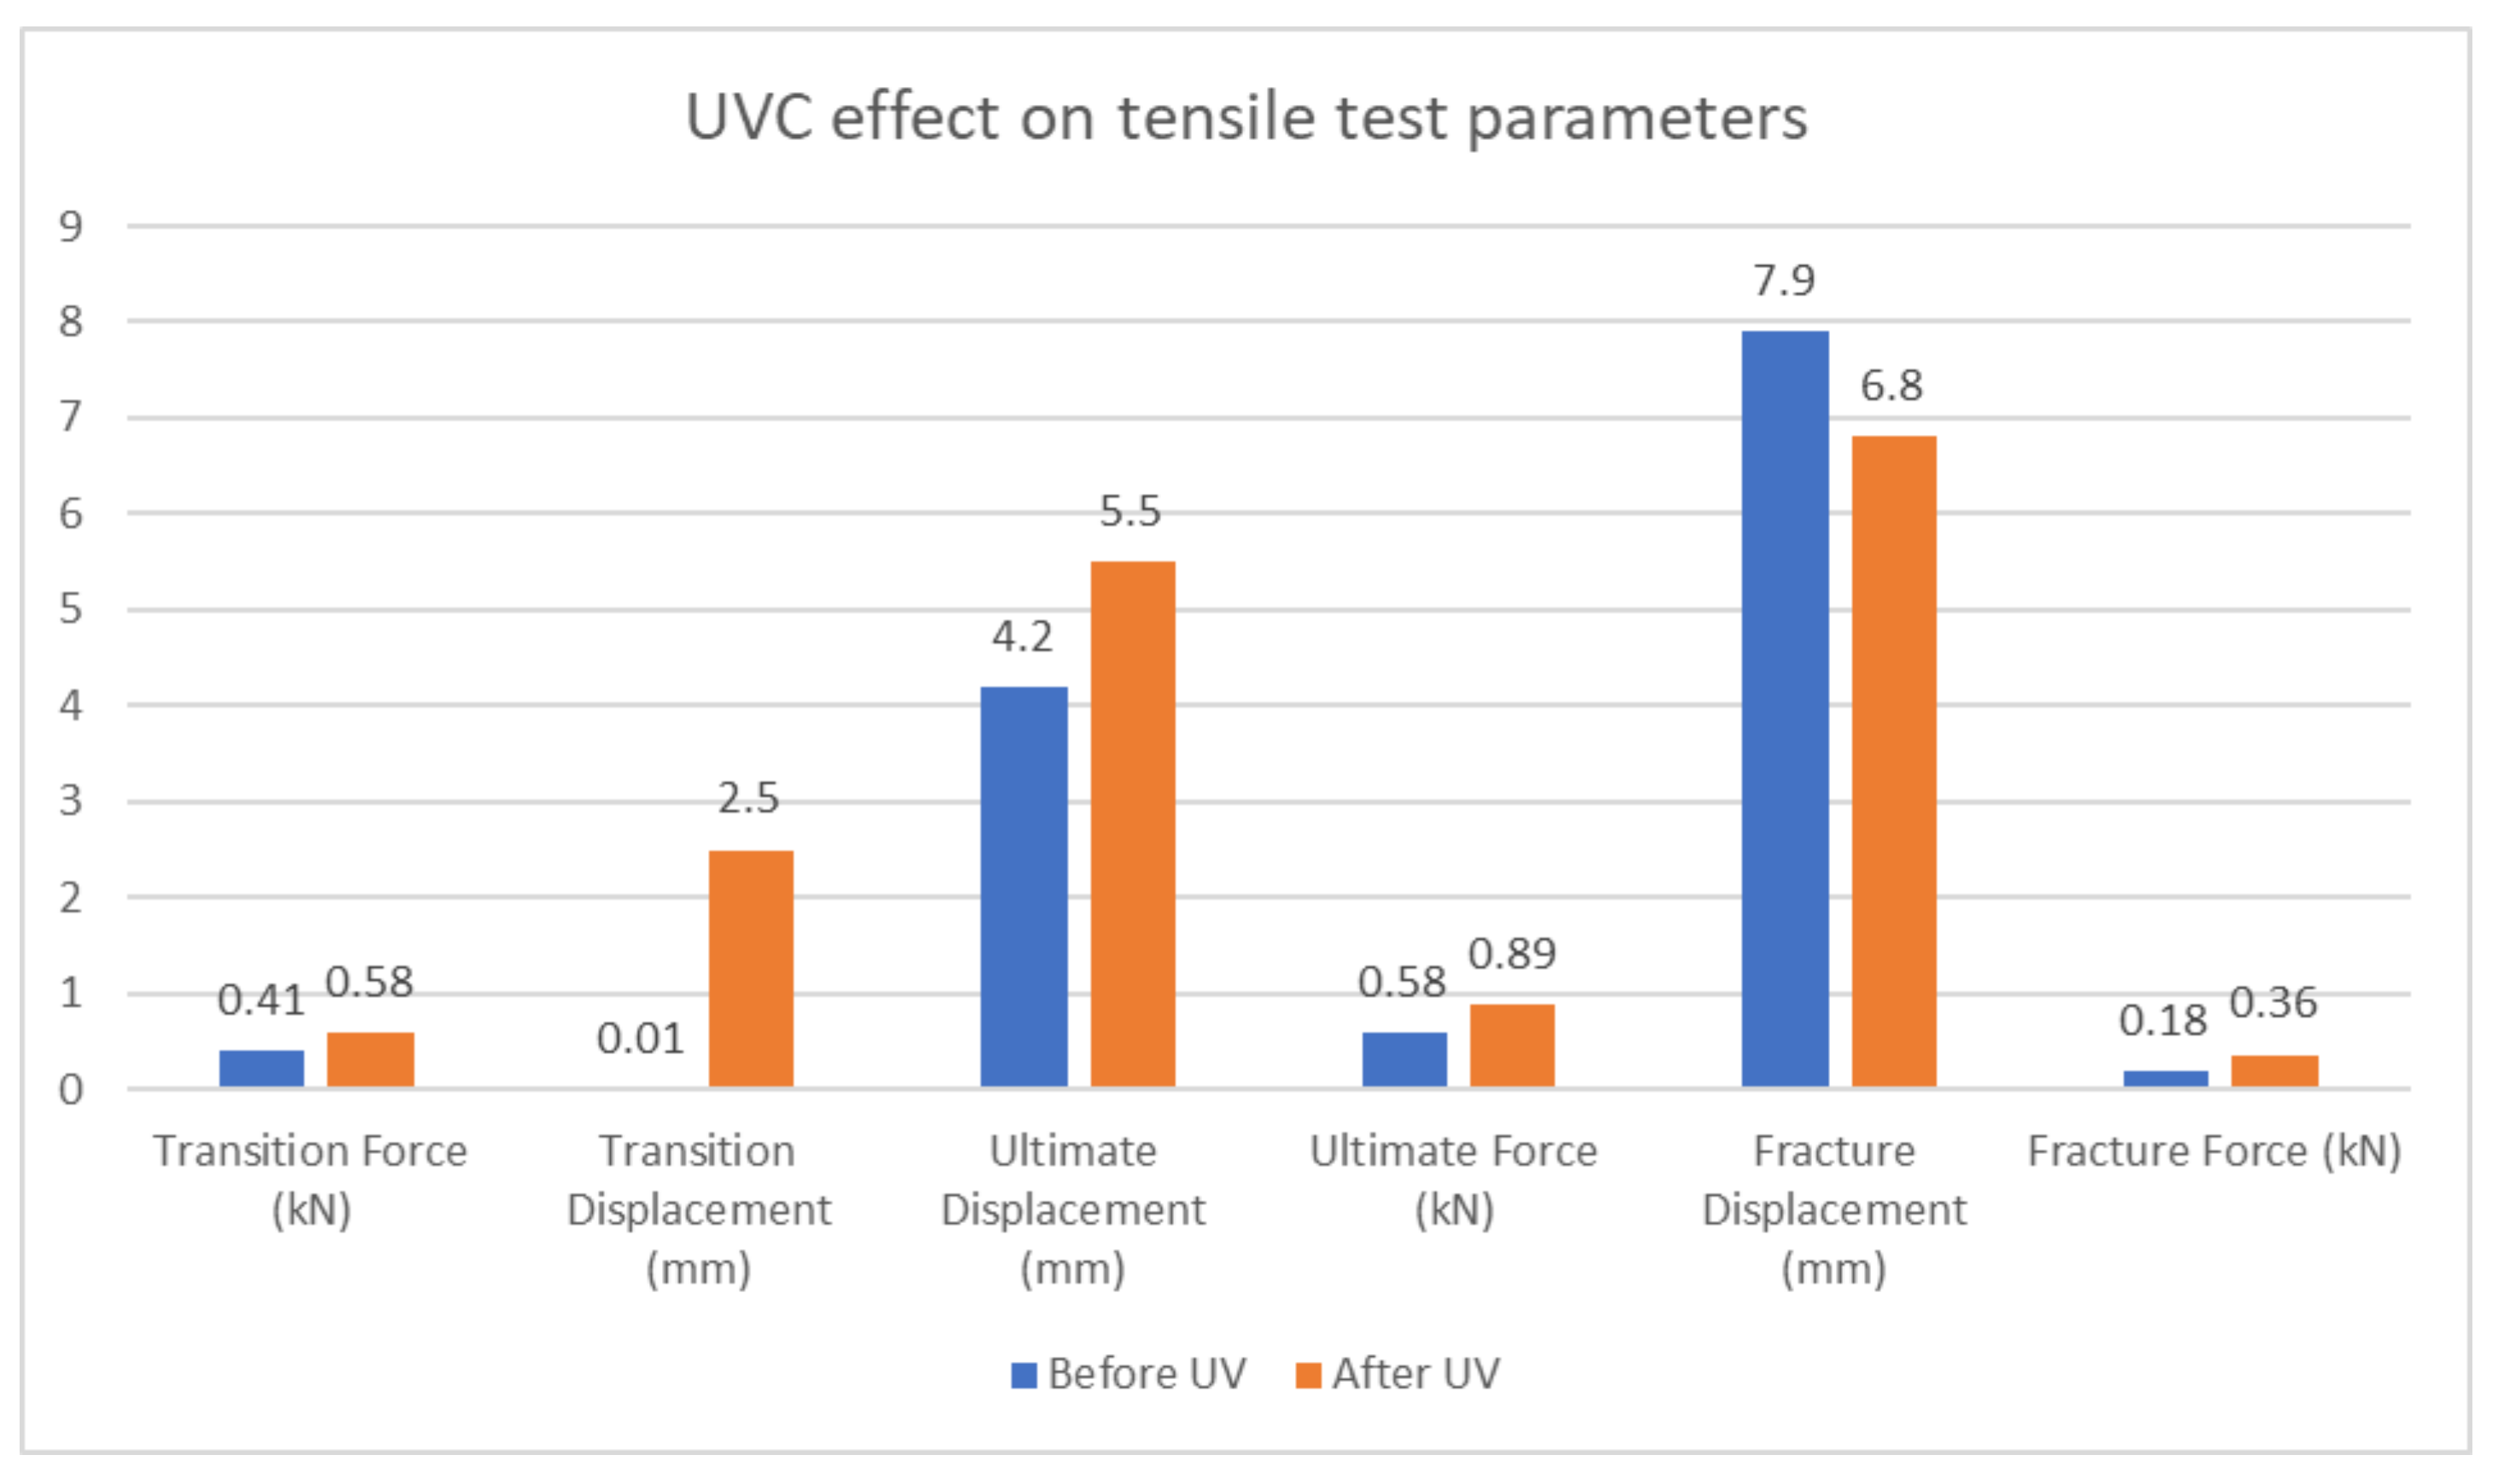
- Average transition force: 0.41 kN
- Average transition displacement: 0.01 mm
- Average ultimate displacement: 4.2 mm
- Average ultimate force: 0.58 kN
- Average fracture displacement: 7.9 mm
- Average fracture force: 0.18 kN
| Specimen Label | Transition Force (kN) | Transition Displacement (mm) | Ultimate Displacement (mm) | Ultimate Force (kN) | Fracture Displacement (mm) | Fracture Force (kN) |
|---|---|---|---|---|---|---|
| A1 | 0.4 | 0.02 | 3.7 | 0.55 | 8.1 | 0.16 |
| A2 | 0.41 | 0 | 4.2 | 0.57 | 7.6 | 0.21 |
| A3 | 0.41 | 0 | 4.4 | 0.57 | 8 | 0.12 |
| A4 | 0.43 | 0 | 4.4 | 0.58 | 8 | 0.22 |
| A5 | 0.4 | 0 | 4.5 | 0.6 | 8.1 | 0.18 |
| Average | 0.41 | 0.01 | 4.2 | 0.57 | 8 | 0.18 |
| ±std | 0.01 | 0.01 | 0.34 | 0.02 | 0.19 | 0.04 |
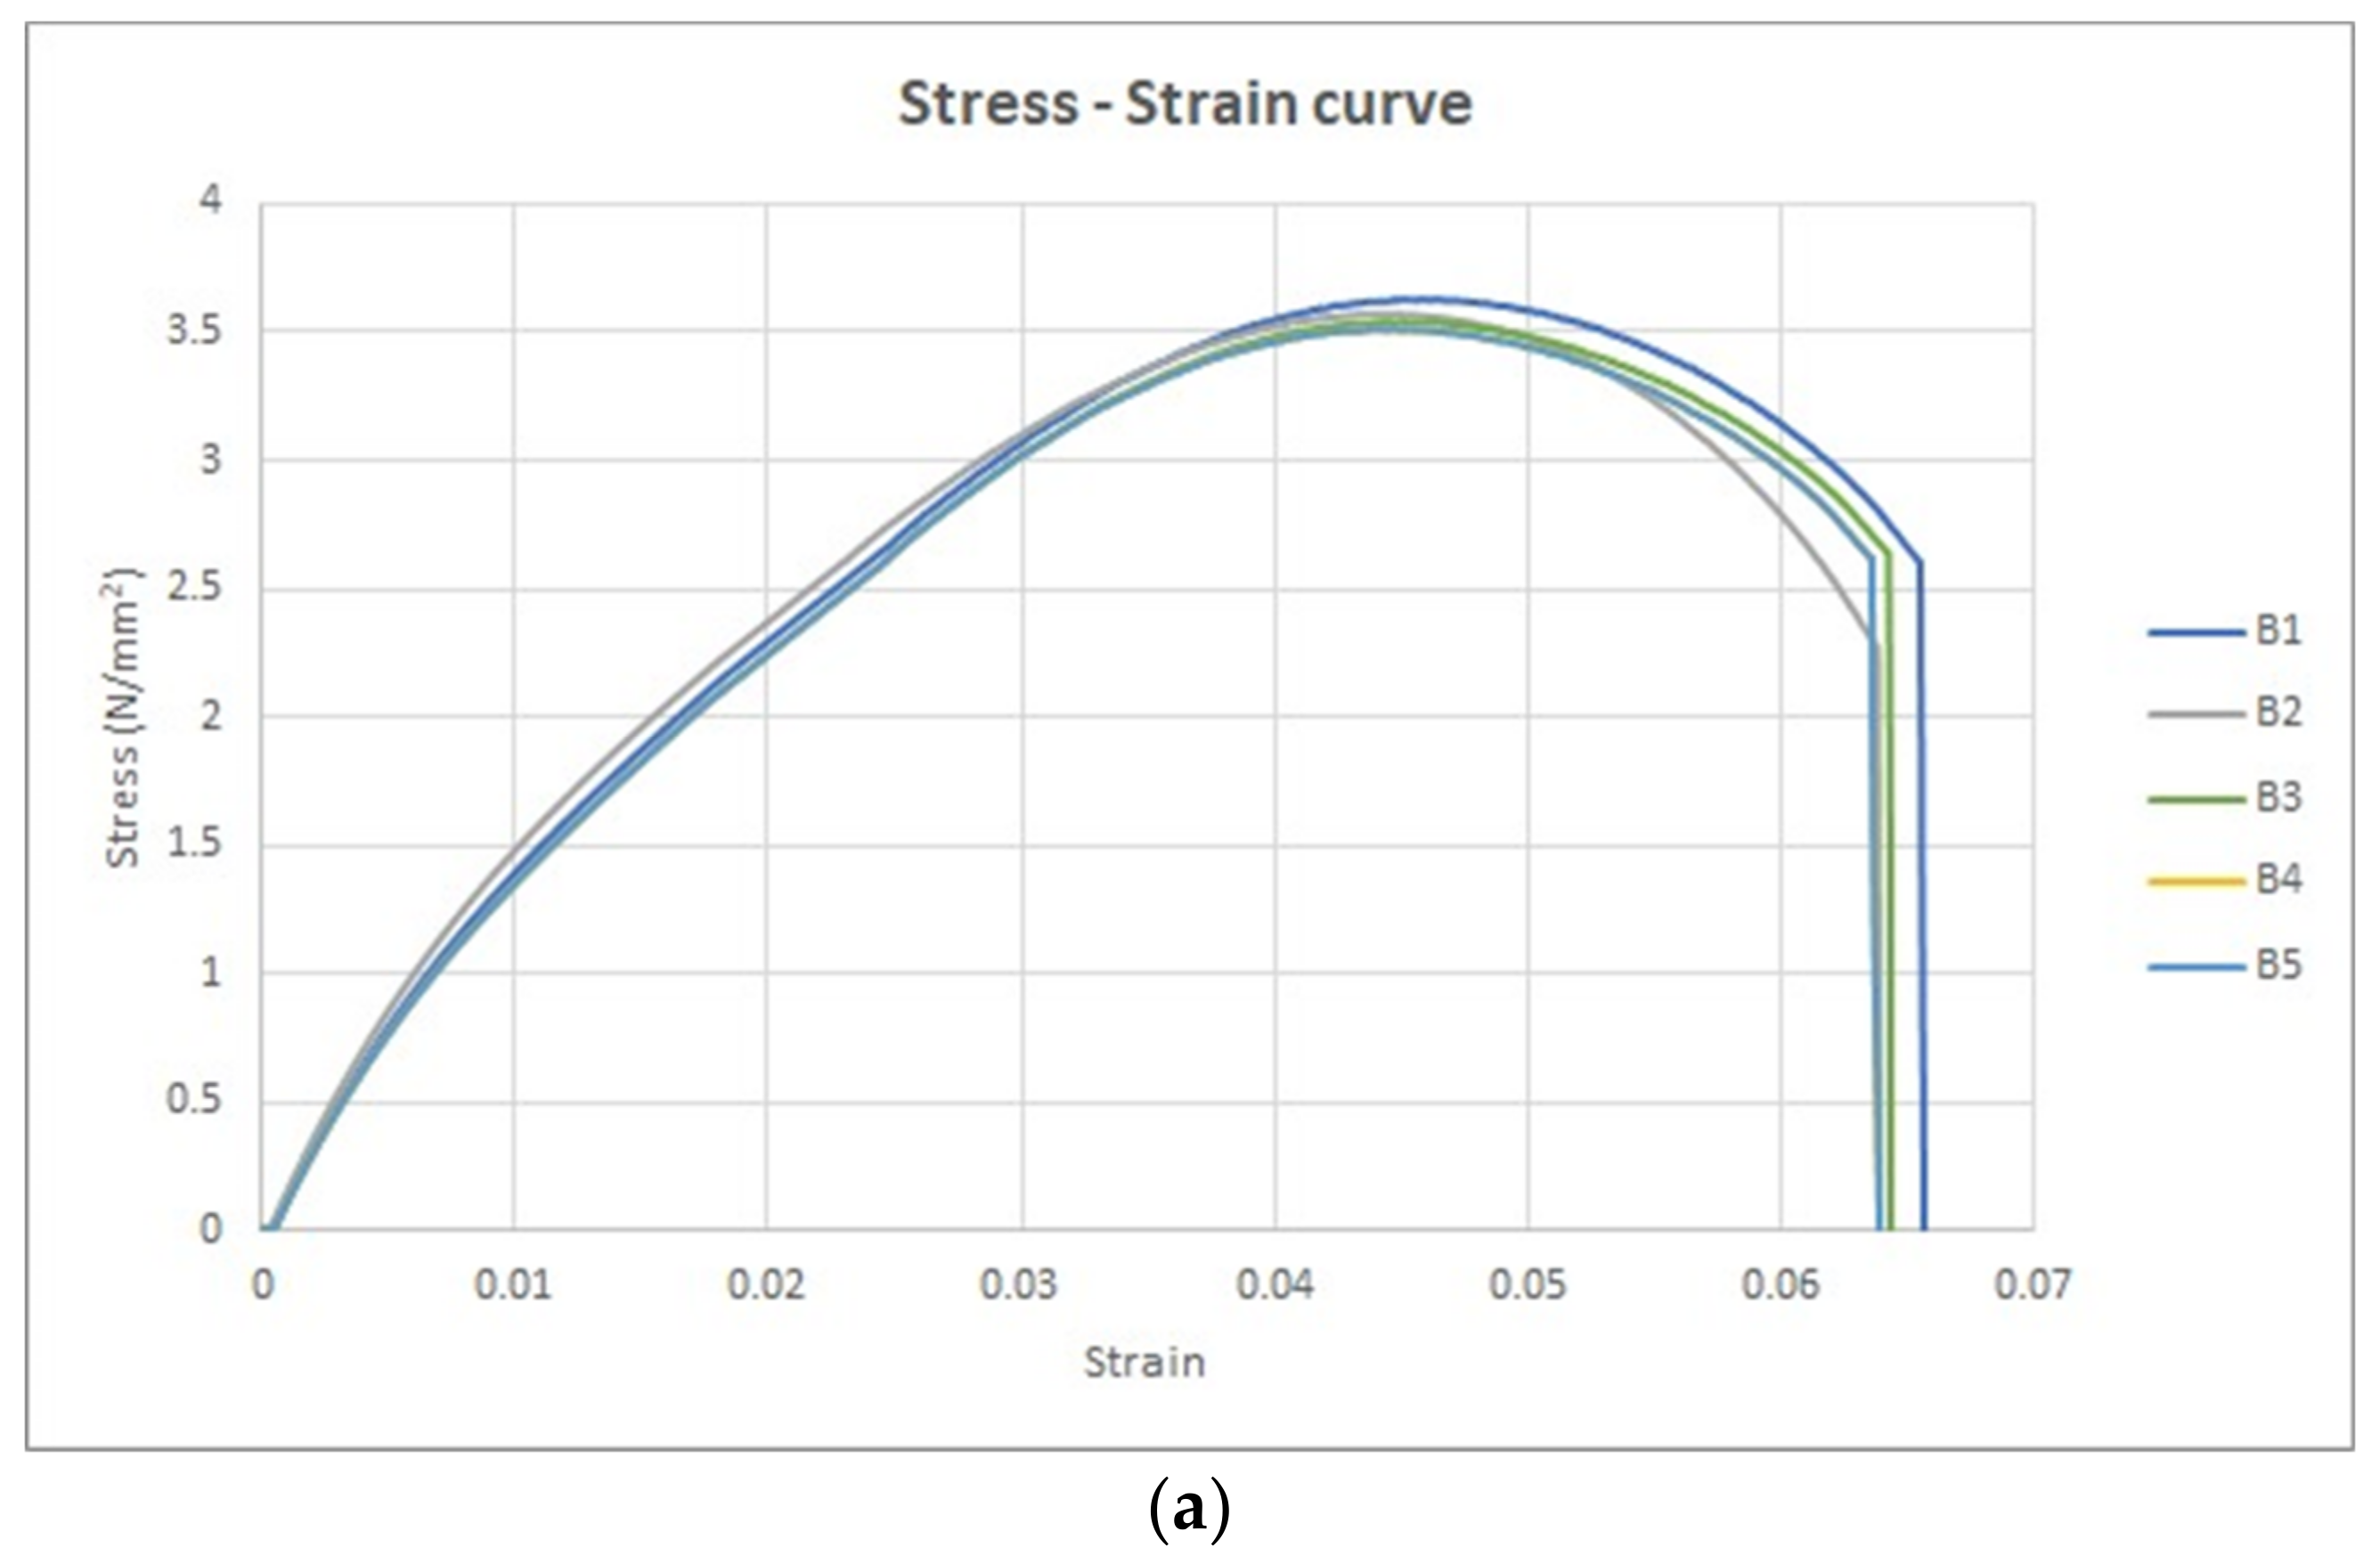
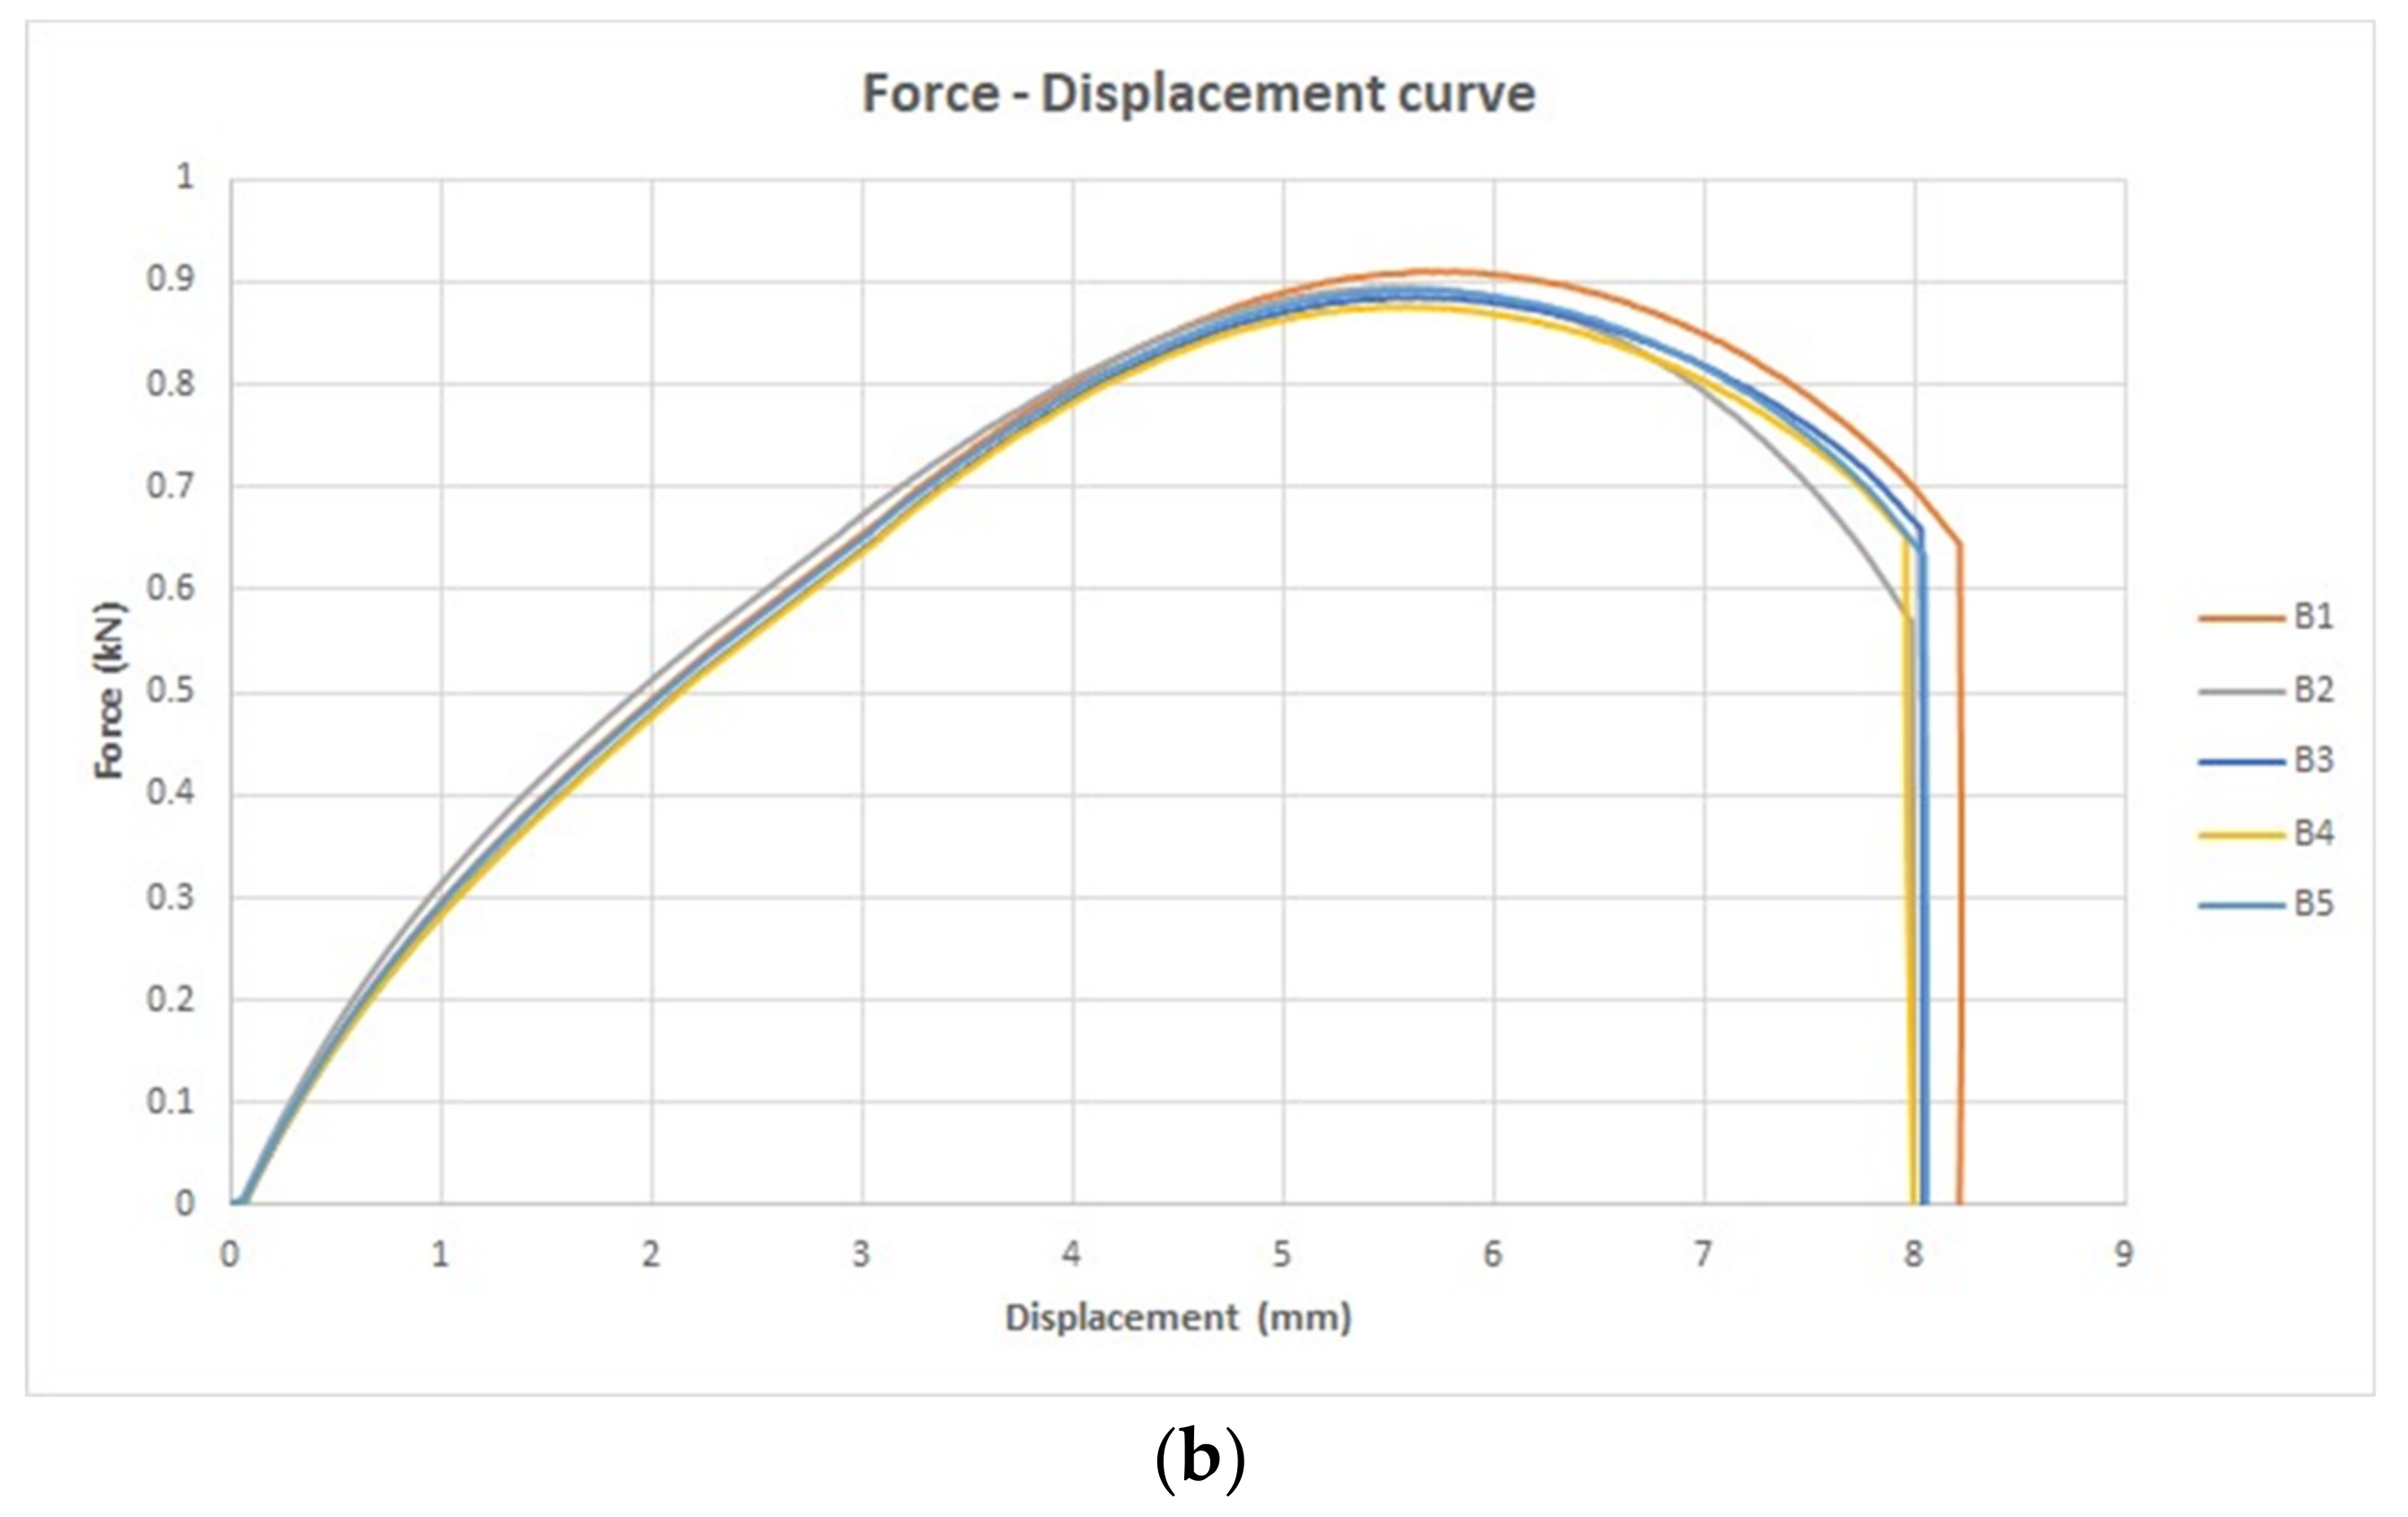
3.2. Tensile Test for Treated Specimens with UV
- Transition stress (N/mm2)
- Transition strain
- Ultimate strain
- Ultimate stress (N/mm2)
- Fracture strain
- Fracture stress (N/mm2)
- Average transition stress: 2.3 N/mm2
- Average transition strain: 0.02
- Average ultimate strain: 0.04
- Average ultimate stress: 3.6 N/mm2
- Average fracture strain: 0.06
- Average fracture stress: 1.5 N/mm2
| Specimen Label | Transition Stress (N/mm2) | Transition Strain | Ultimate Strain | Ultimate Stress (N/mm2) | Fracture Strain | Fracture Stress (N/mm2) |
|---|---|---|---|---|---|---|
| B1 | 2.4 | 0.02 | 0.05 | 3.6 | 0.07 | 1.1 |
| B2 | 2.3 | 0.02 | 0.04 | 3.6 | 0.06 | 2.2 |
| B3 | 2.4 | 0.02 | 0.04 | 3.5 | 0.06 | 1.4 |
| B4 | 2.3 | 0.02 | 0.04 | 3.5 | 0.06 | 1.4 |
| B5 | 2.3 | 0.02 | 0.05 | 3.6 | 0.06 | 1 |
| Average | 2.3 | 0.02 | 0.04 | 3.6 | 0.06 | 1.5 |
| ±std | 0.06 | 0 | 0 | 0.04 | 0 | 0.5 |
| Specimen Label | Resilience (J/m3) | Toughness (J/m3) |
|---|---|---|
| B1 | 0.02 | 0.18 |
| B2 | 0.02 | 0.17 |
| B3 | 0.02 | 0.17 |
| B4 | 0.02 | 0.17 |
| B5 | 0.02 | 0.17 |
| Average | 0.02 | 0.17 |
| ±std | 0 | 0 |
- Transition force (kN)
- Transition displacement (mm)
- Ultimate displacement (mm)
- Ultimate force (kN)
- Fracture displacement (mm)
- Fracture force (kN)
- Average transition force: 0.58 kN
- Average transition displacement: 2.5 mm
- Average ultimate displacement: 5.5 mm
- Average ultimate force: 0.89 kN
- Average fracture displacement: 6.8 mm
- Average fracture force: 0.36 kN
| Specimen Label | Transition Force (kN) | Transition Displacement (mm) | Ultimate Displacement (mm) | Ultimate Force (kN) | Fracture Displacement (mm) | Fracture Force (kN) |
|---|---|---|---|---|---|---|
| B1 | 0.6 | 2.6 | 5.7 | 0.91 | 8.2 | 0.28 |
| B2 | 0.56 | 2.3 | 5.4 | 0.89 | 8 | 0.57 |
| B3 | 0.59 | 2.6 | 5.5 | 0.89 | 8 | 0.36 |
| B4 | 0.58 | 2.6 | 5.5 | 0.88 | 8 | 0.36 |
| B5 | 0.58 | 2.6 | 5.6 | 0.89 | 1.6 | 0.24 |
| Average | 0.58 | 2.5 | 5.5 | 0.89 | 6.8 | 0.36 |
| ±std | 0.01 | 0.16 | 0.12 | 0.01 | 2.8 | 0.13 |
3.3. t-Test for Tensile Test Groups


3.4. Compression Test for Untreated Specimens with UV
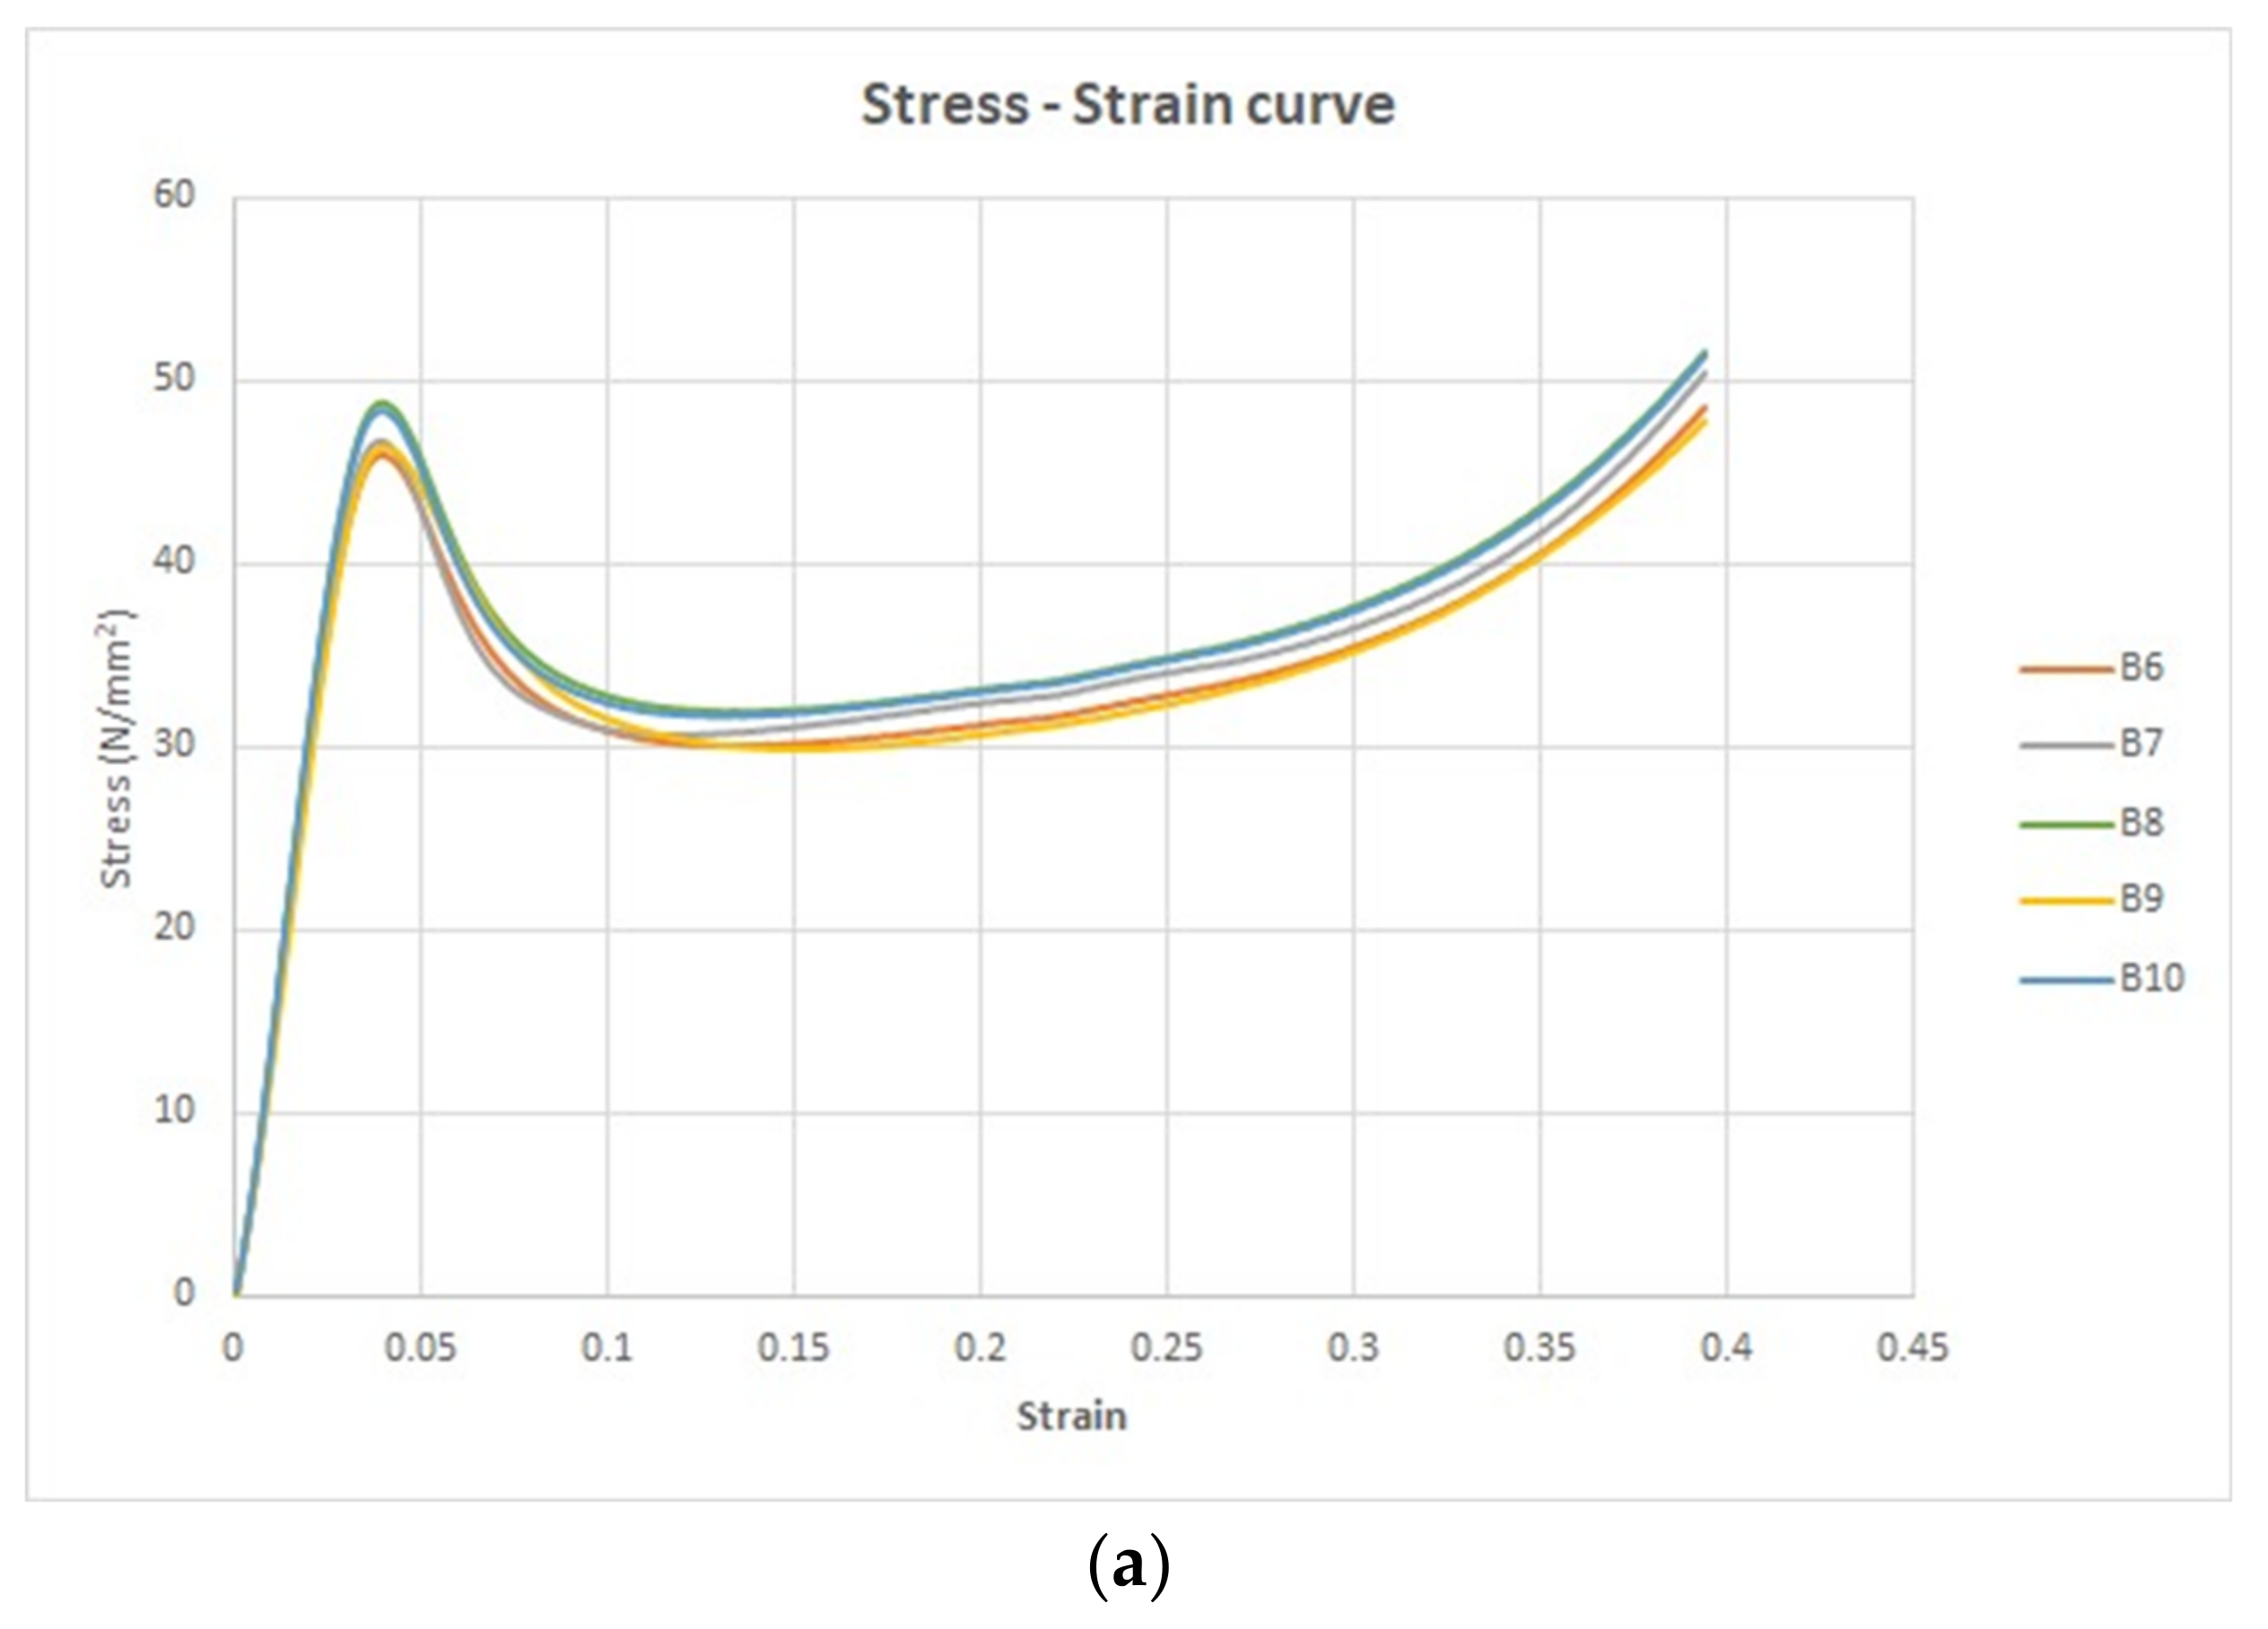
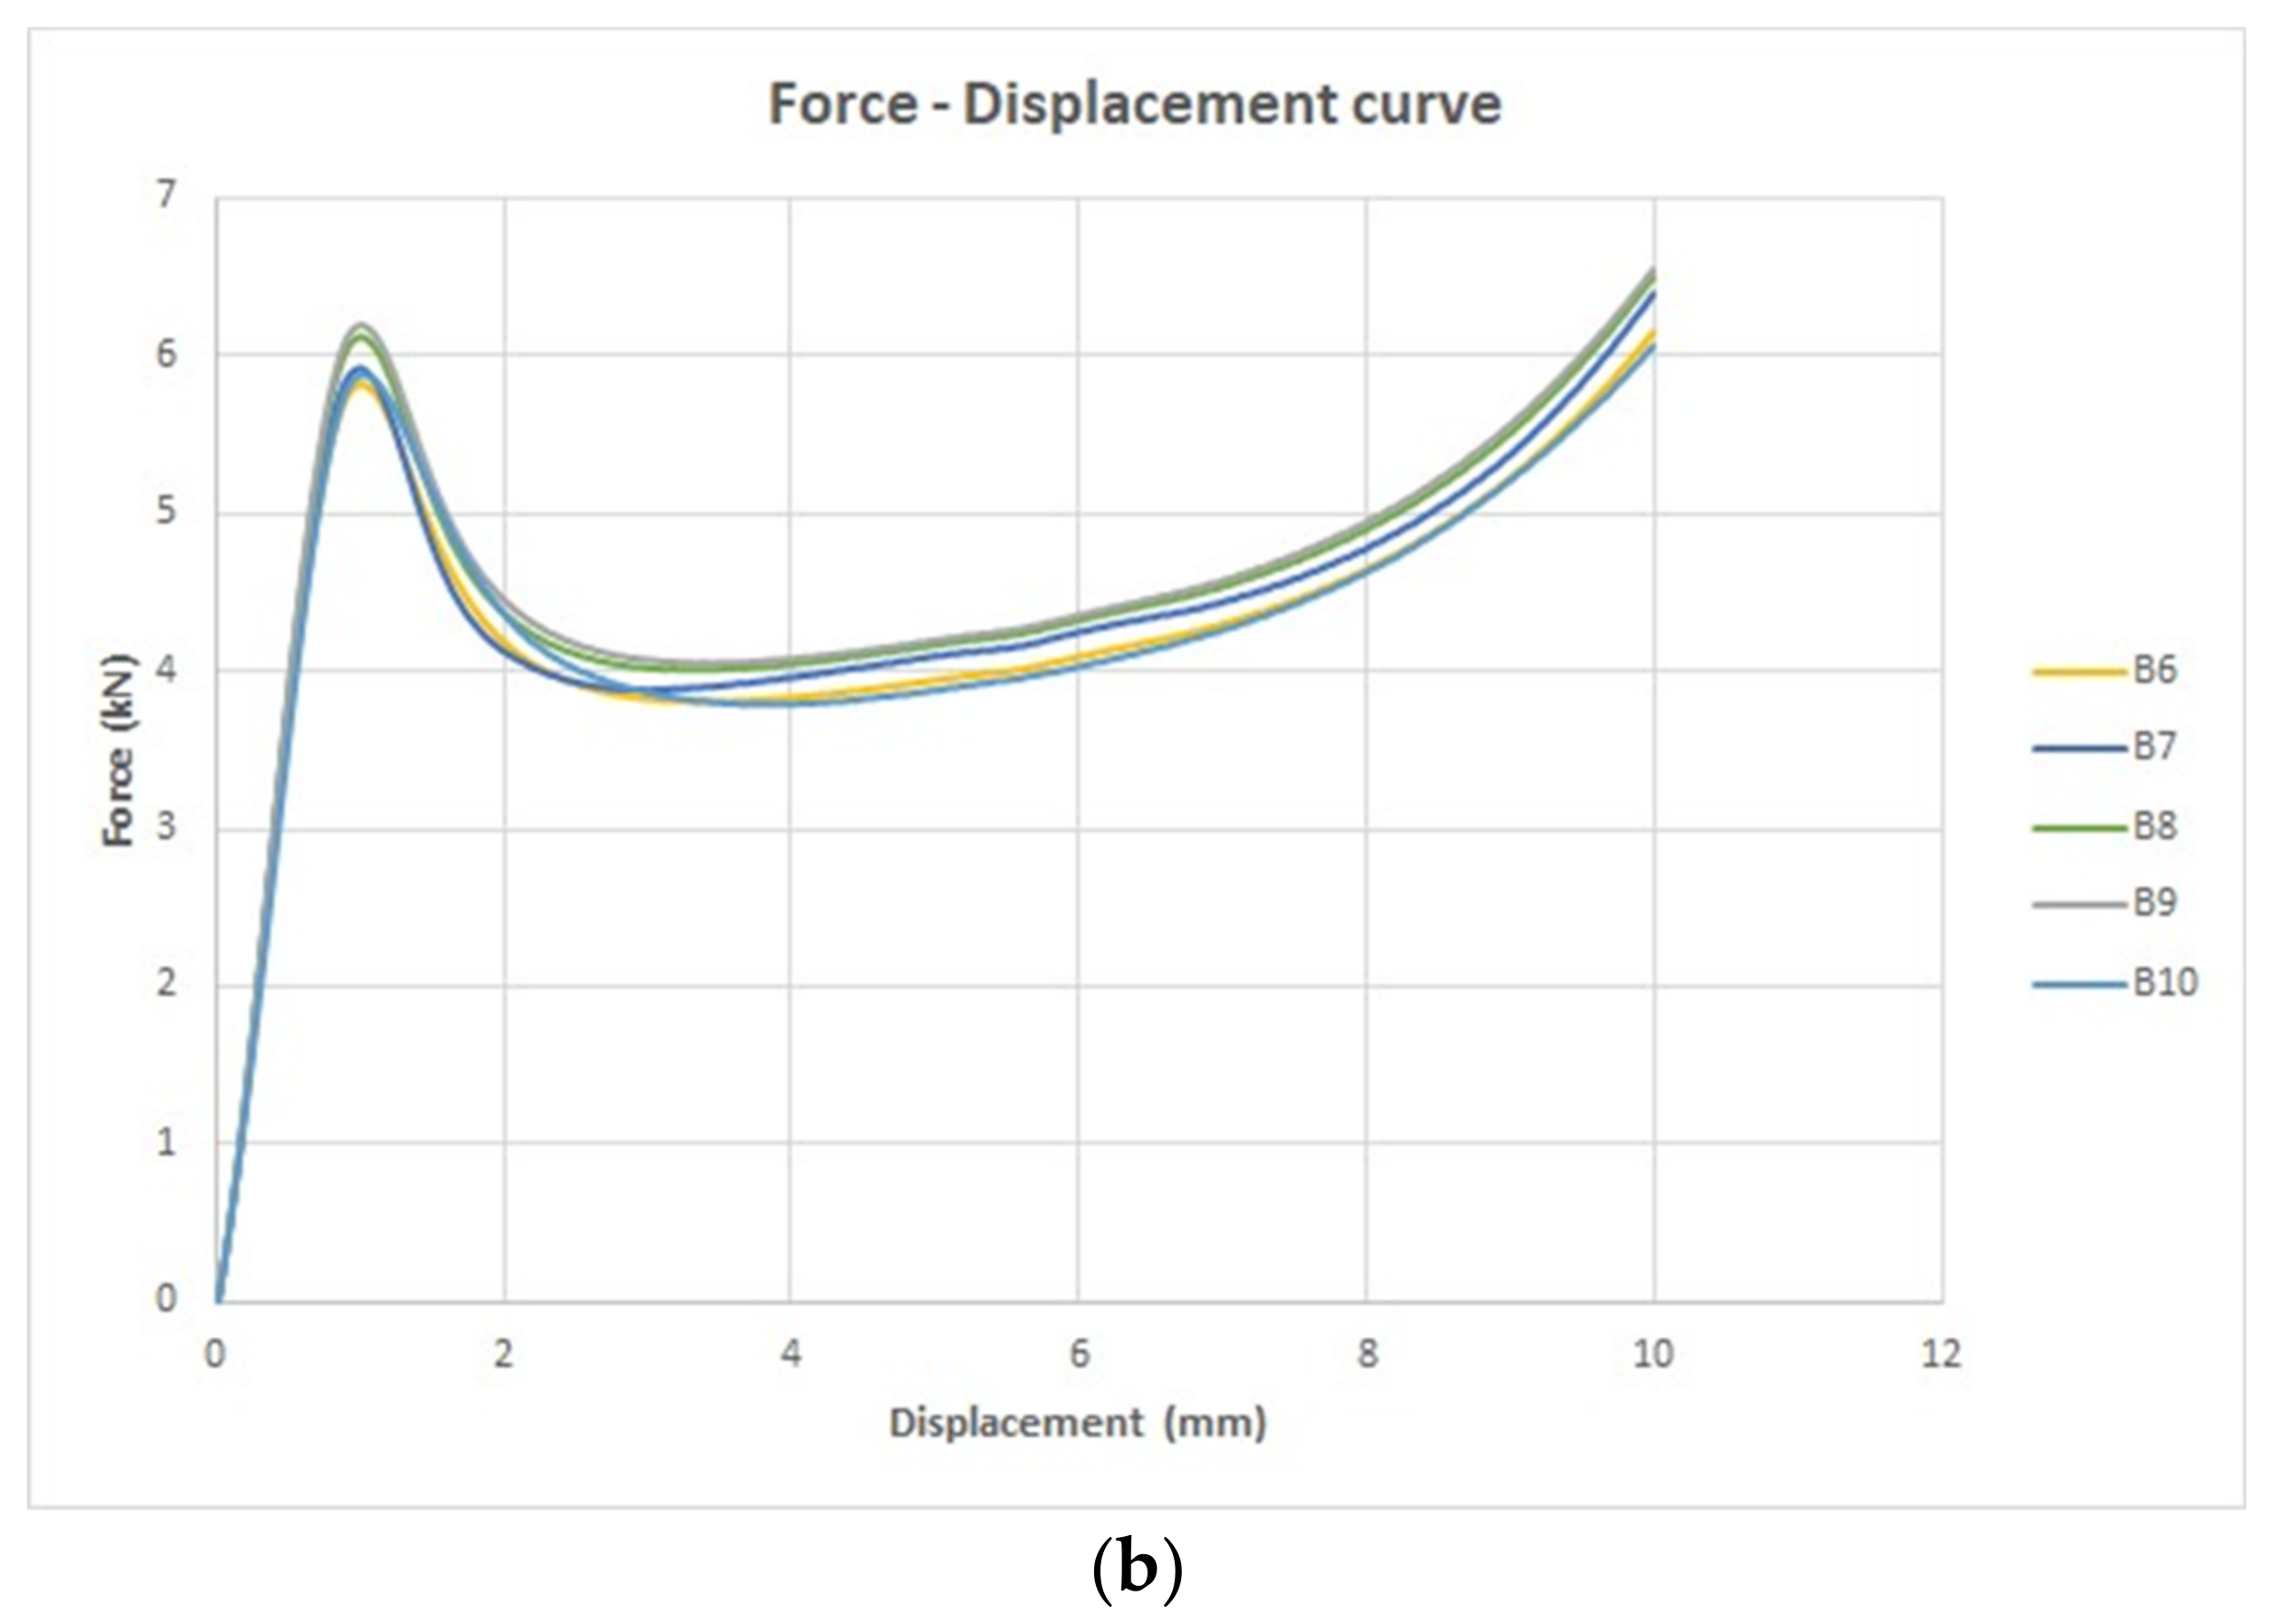
3.5. Compression Test for Treated Specimens with UV
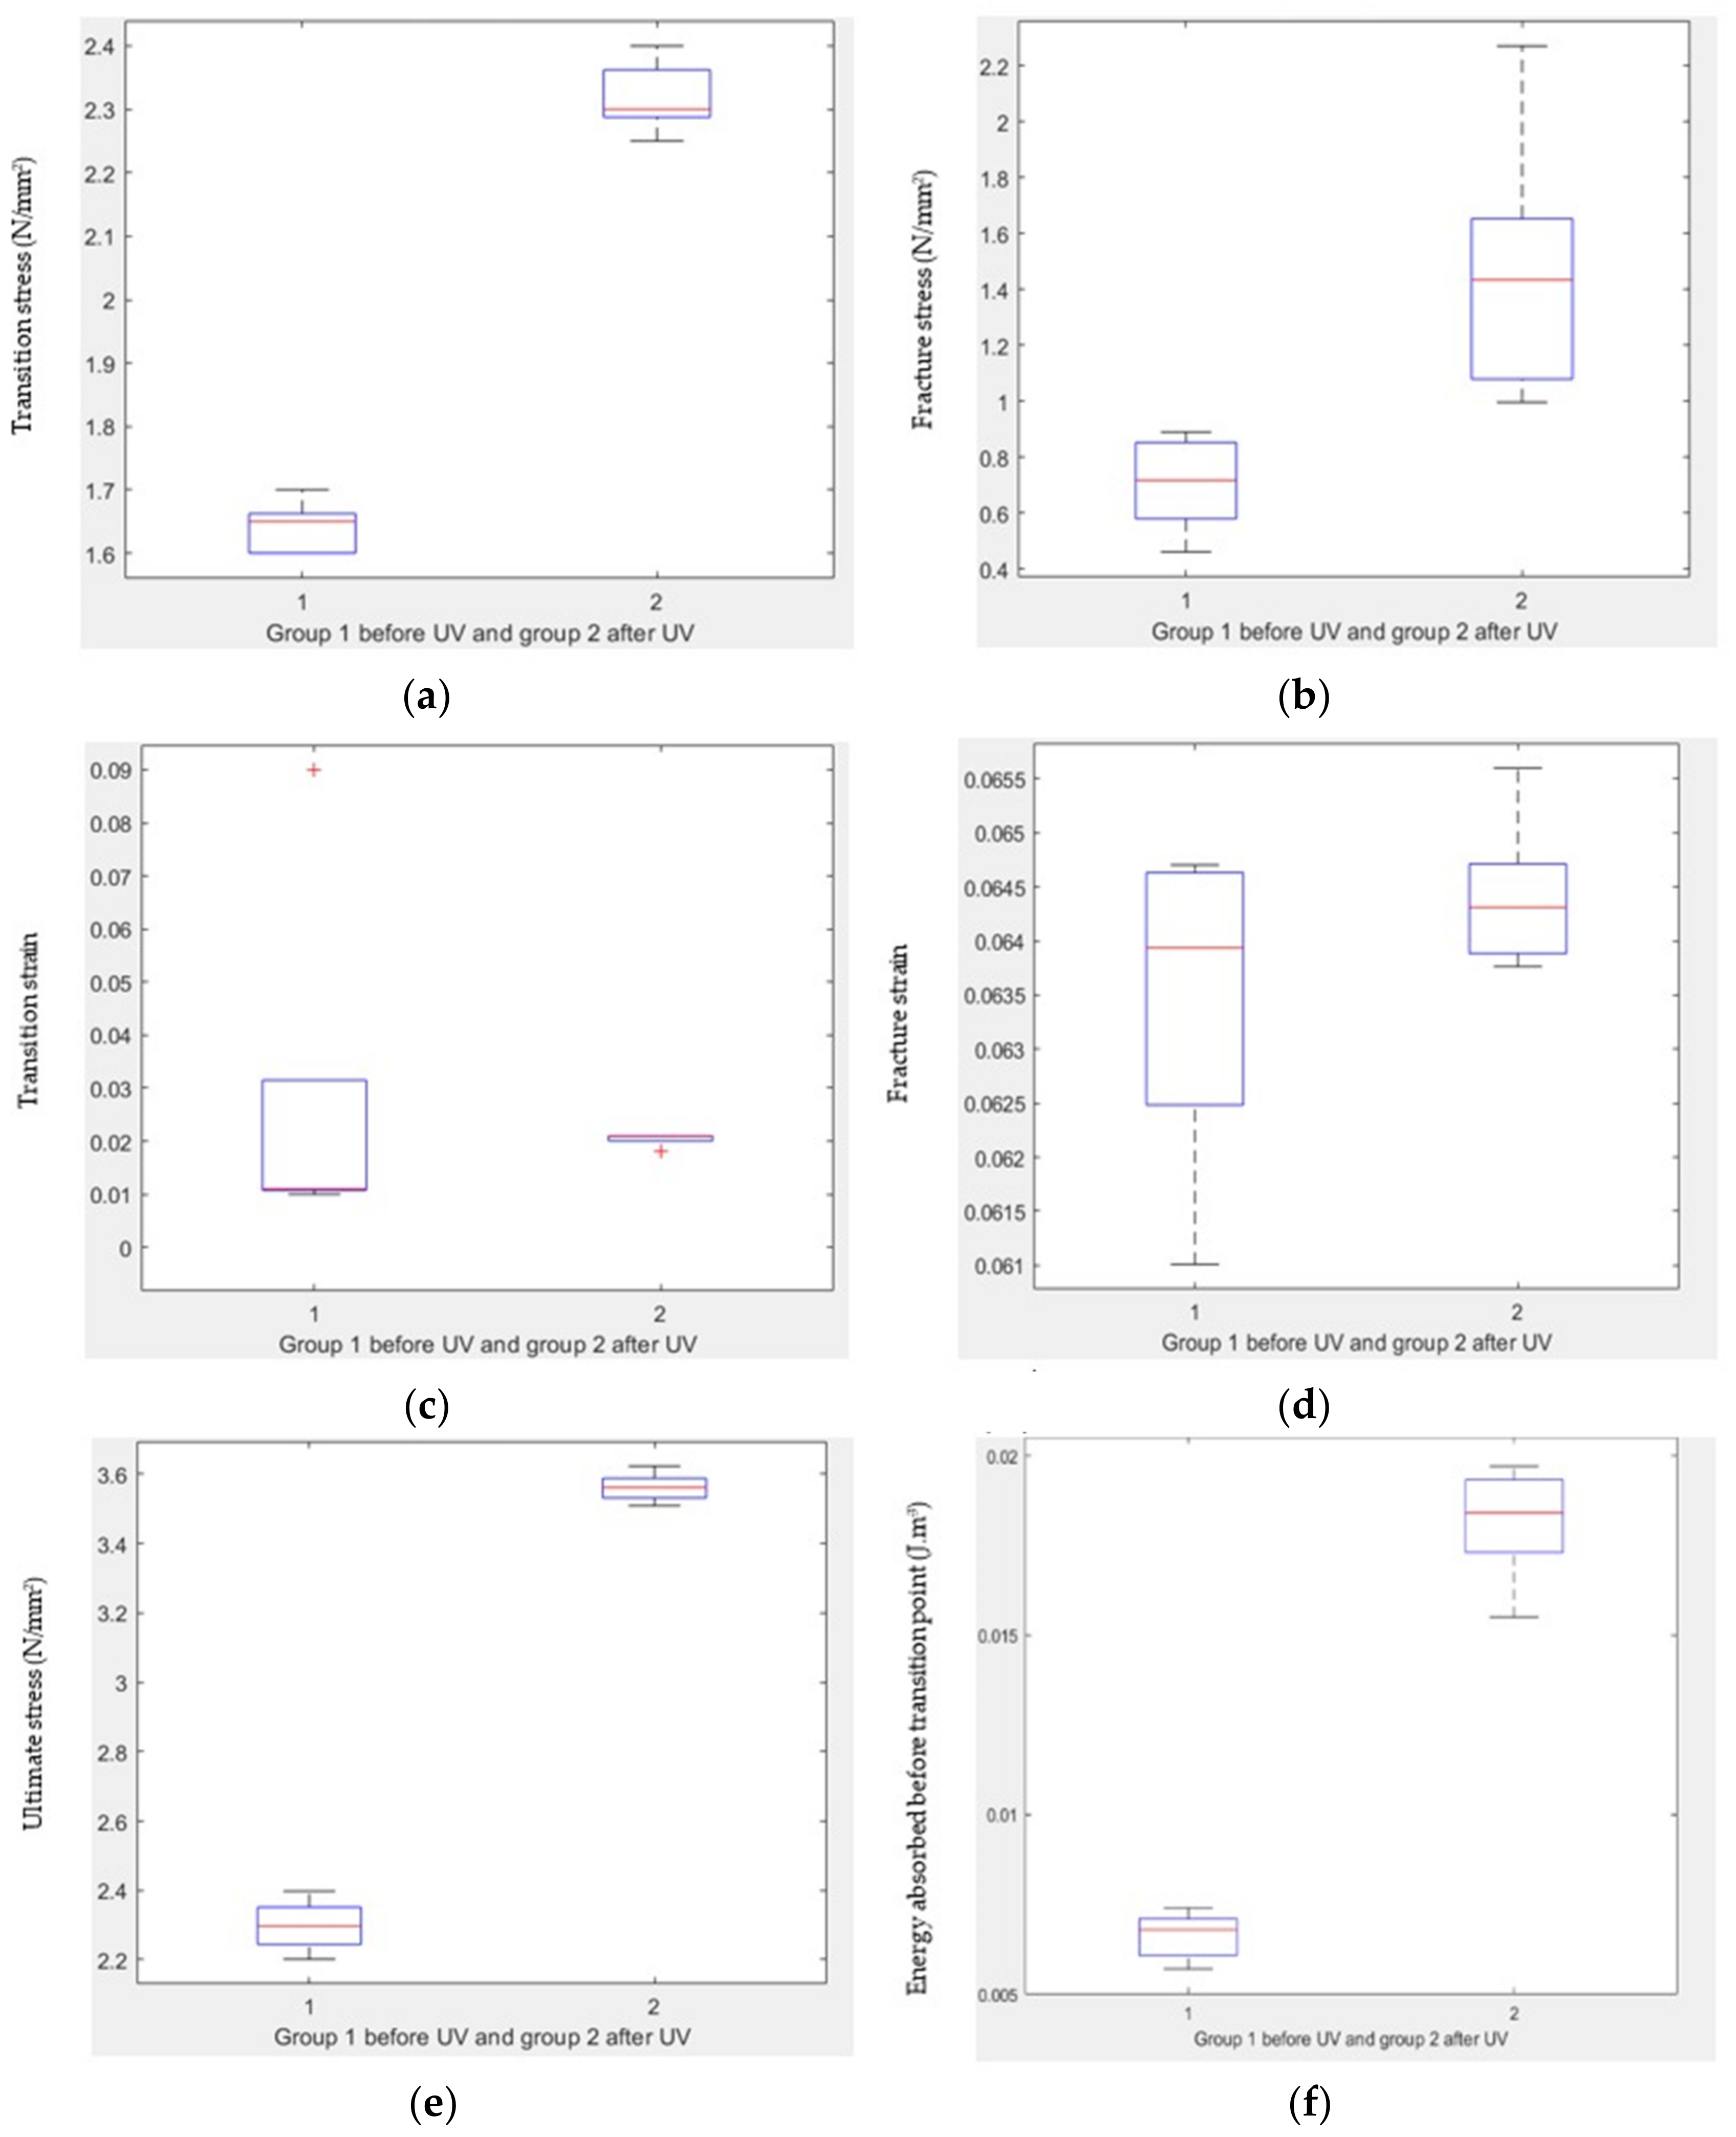
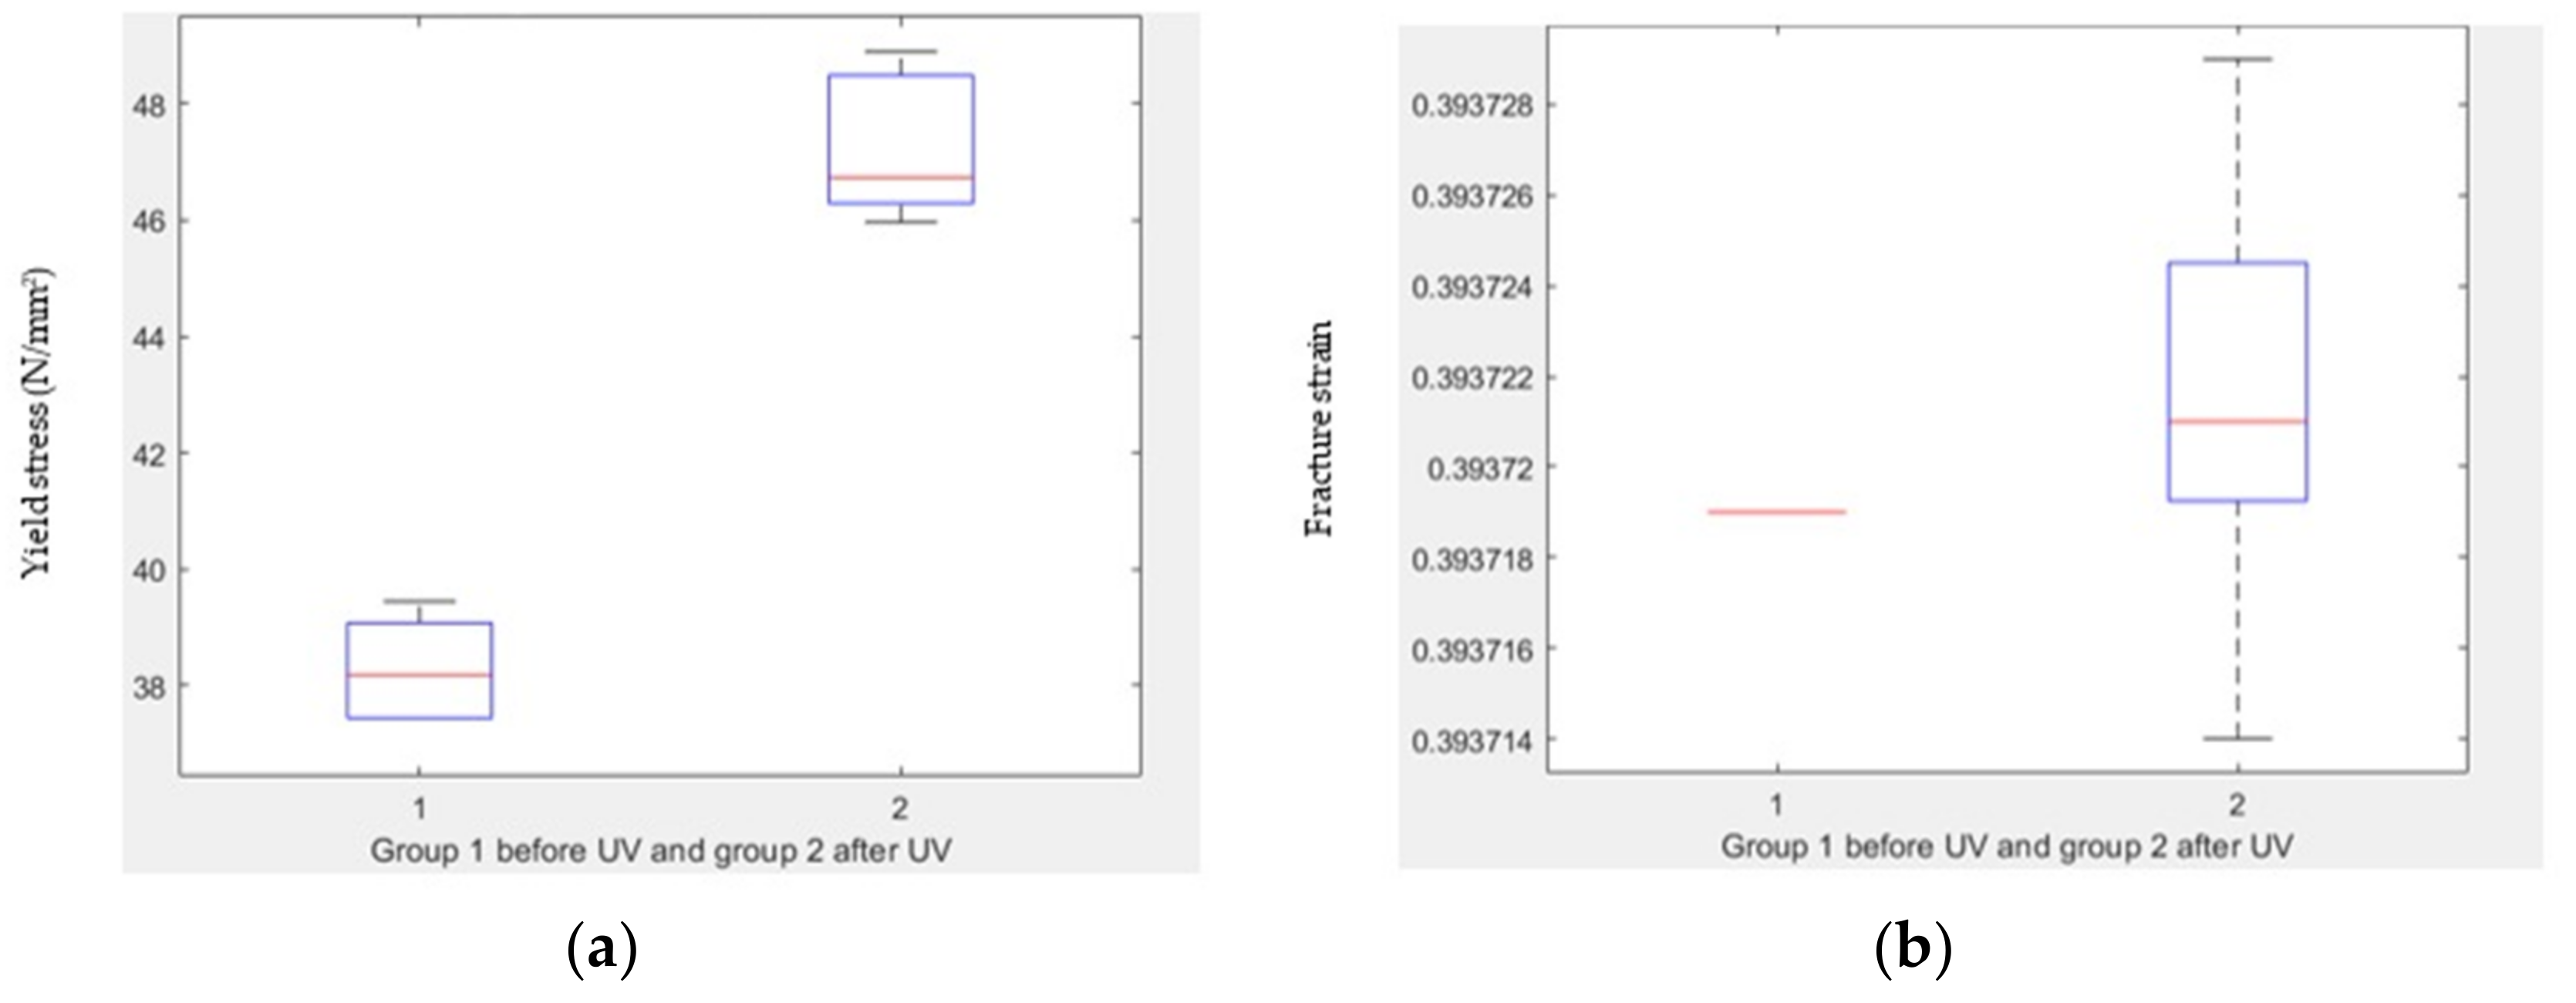
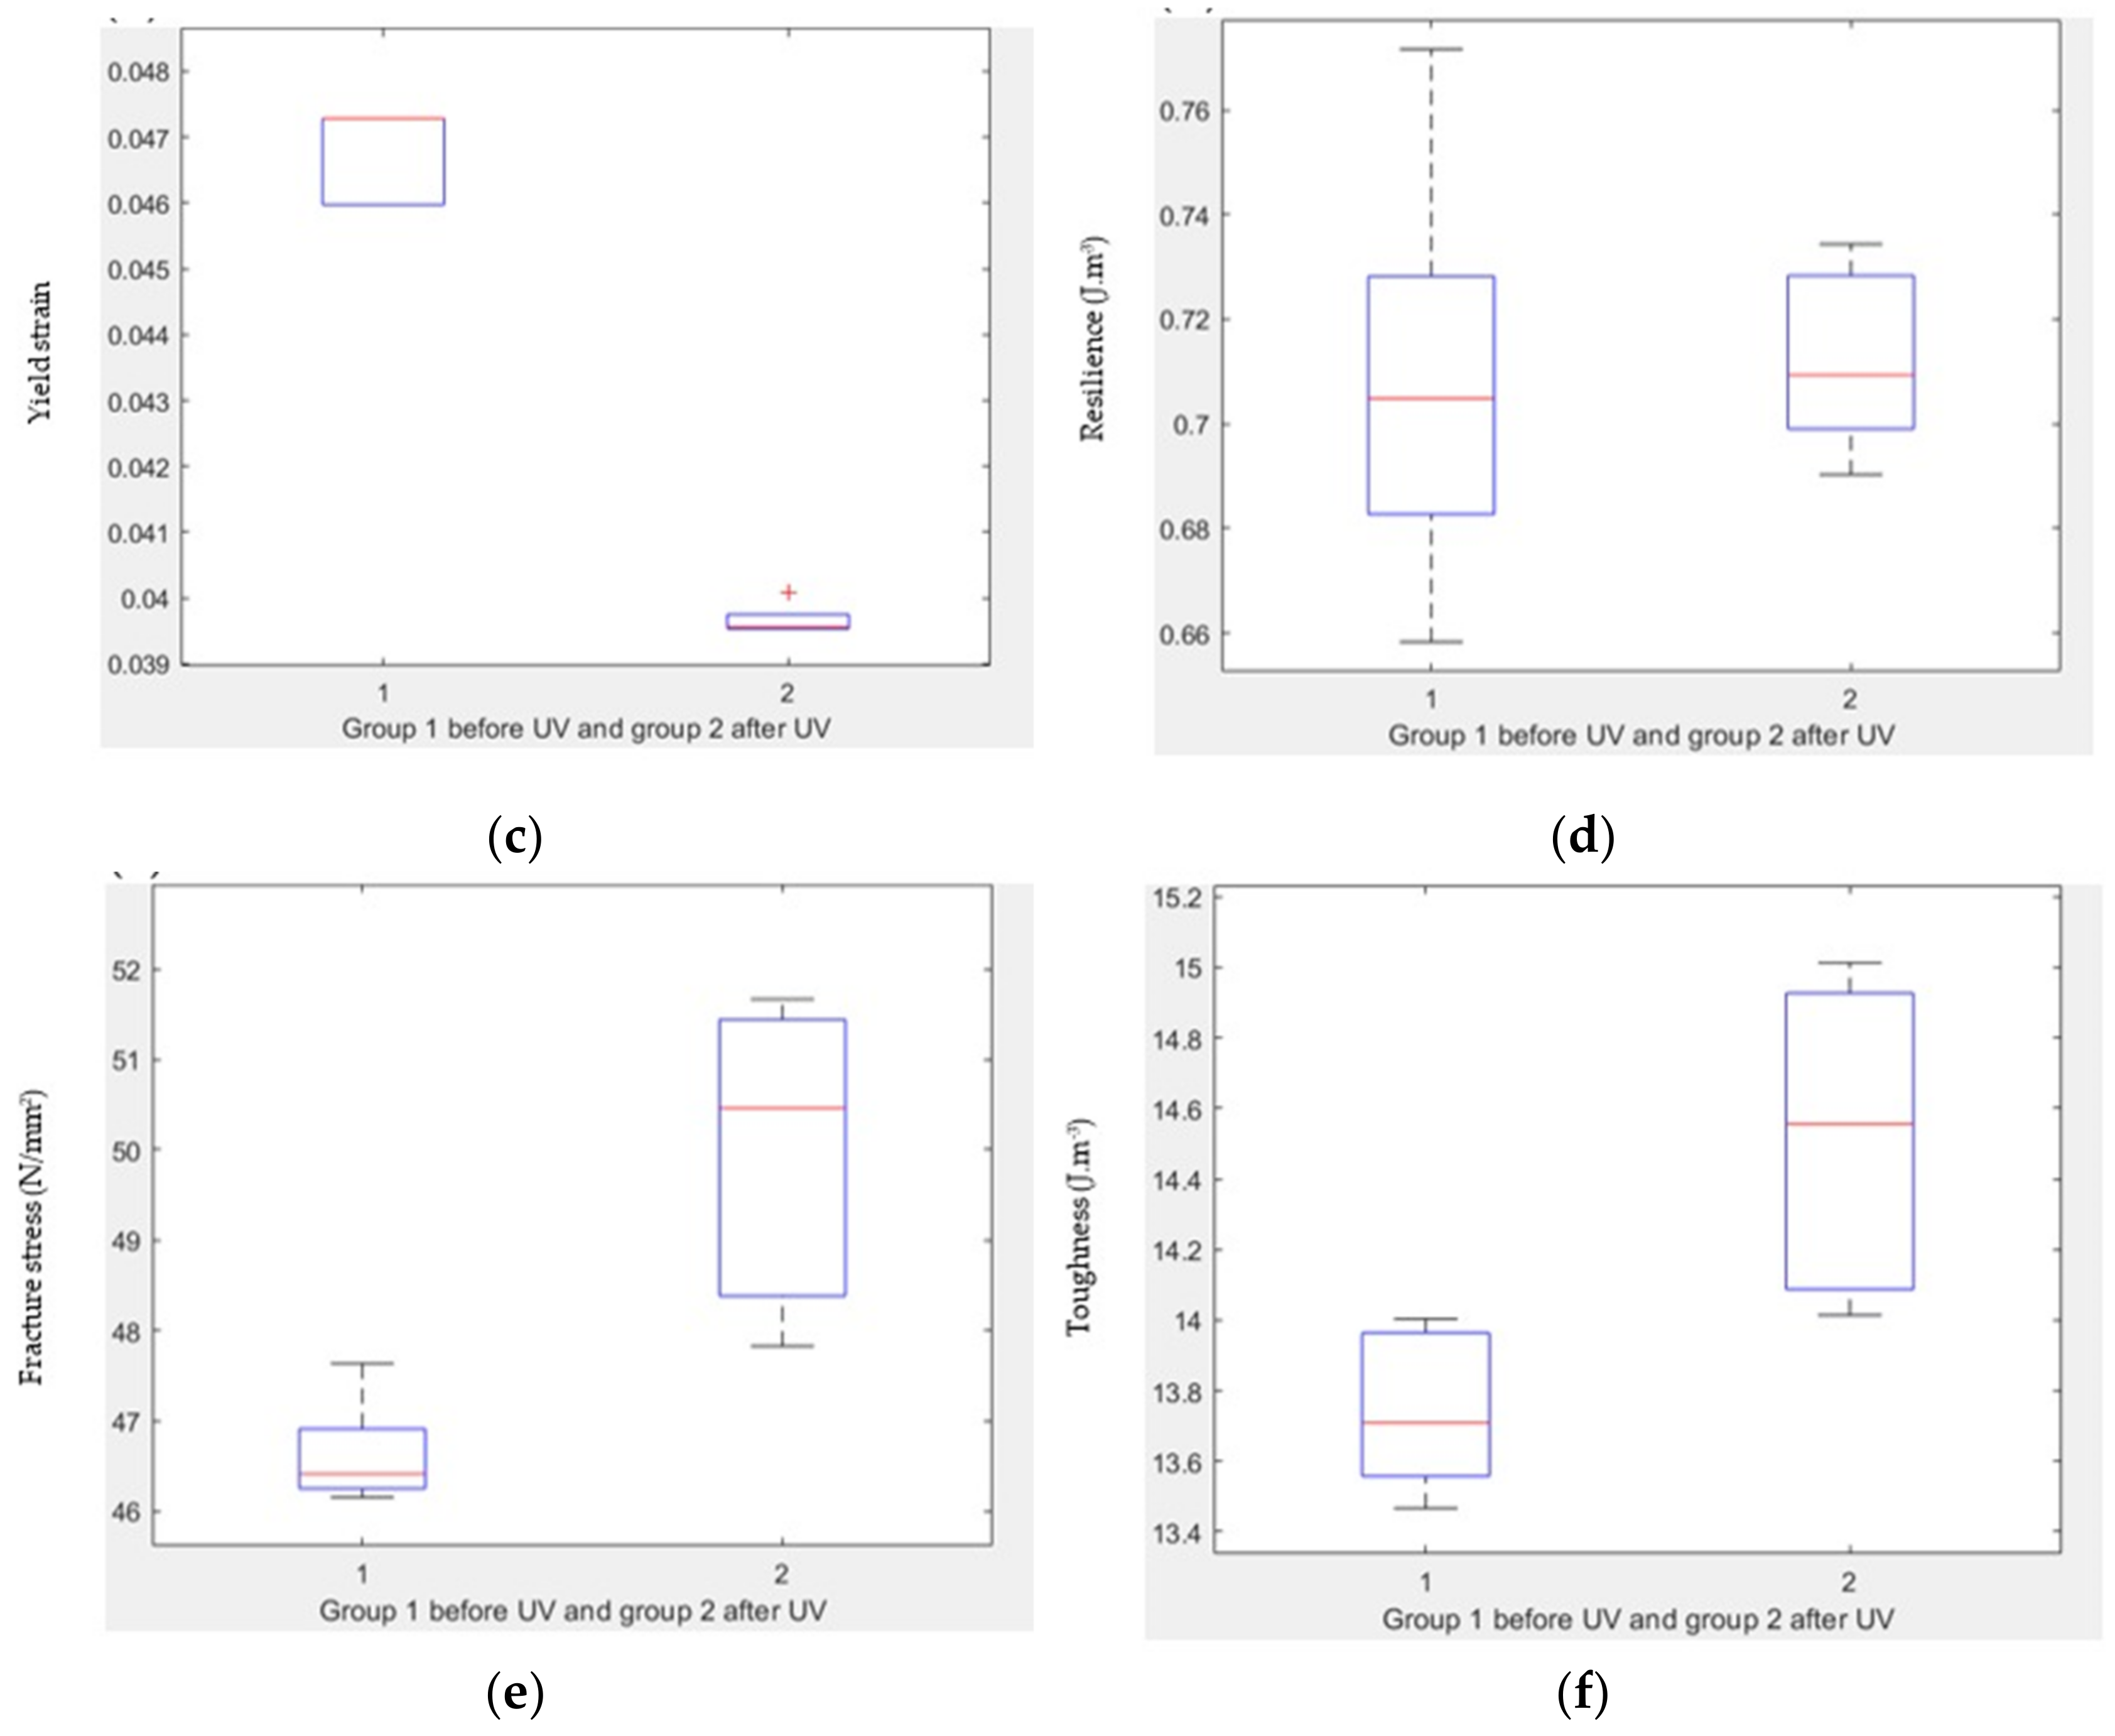
3.6. t-Test for Compression Test Groups
- Yield stress: There is a significant difference in yield stress before and after UV treatment, with a p-value of 1.29 × 10⁻⁶ (Figure 15a).
- Yield strain: There is a significant difference in yield strain before and after UV treatment, with a p-value of 2.78 × 10⁻⁸ (Figure 15b).
- Fracture stress: There is a significant difference in fracture stress before and after UV treatment, with a p-value of 0.0032 (Figure 15c).
- Fracture strain: There is no significant difference in fracture strain before and after UV treatment, with a p-value of 0.3102 (Figure 15d).
- Resilience: There is no significant difference in resilience before and after UV treatment, with a p-value of 0.8261 (Figure 15e).
- Toughness: There is a significant difference in toughness before and after UV treatment, with a p-value of 0.0090 (Figure 15f).
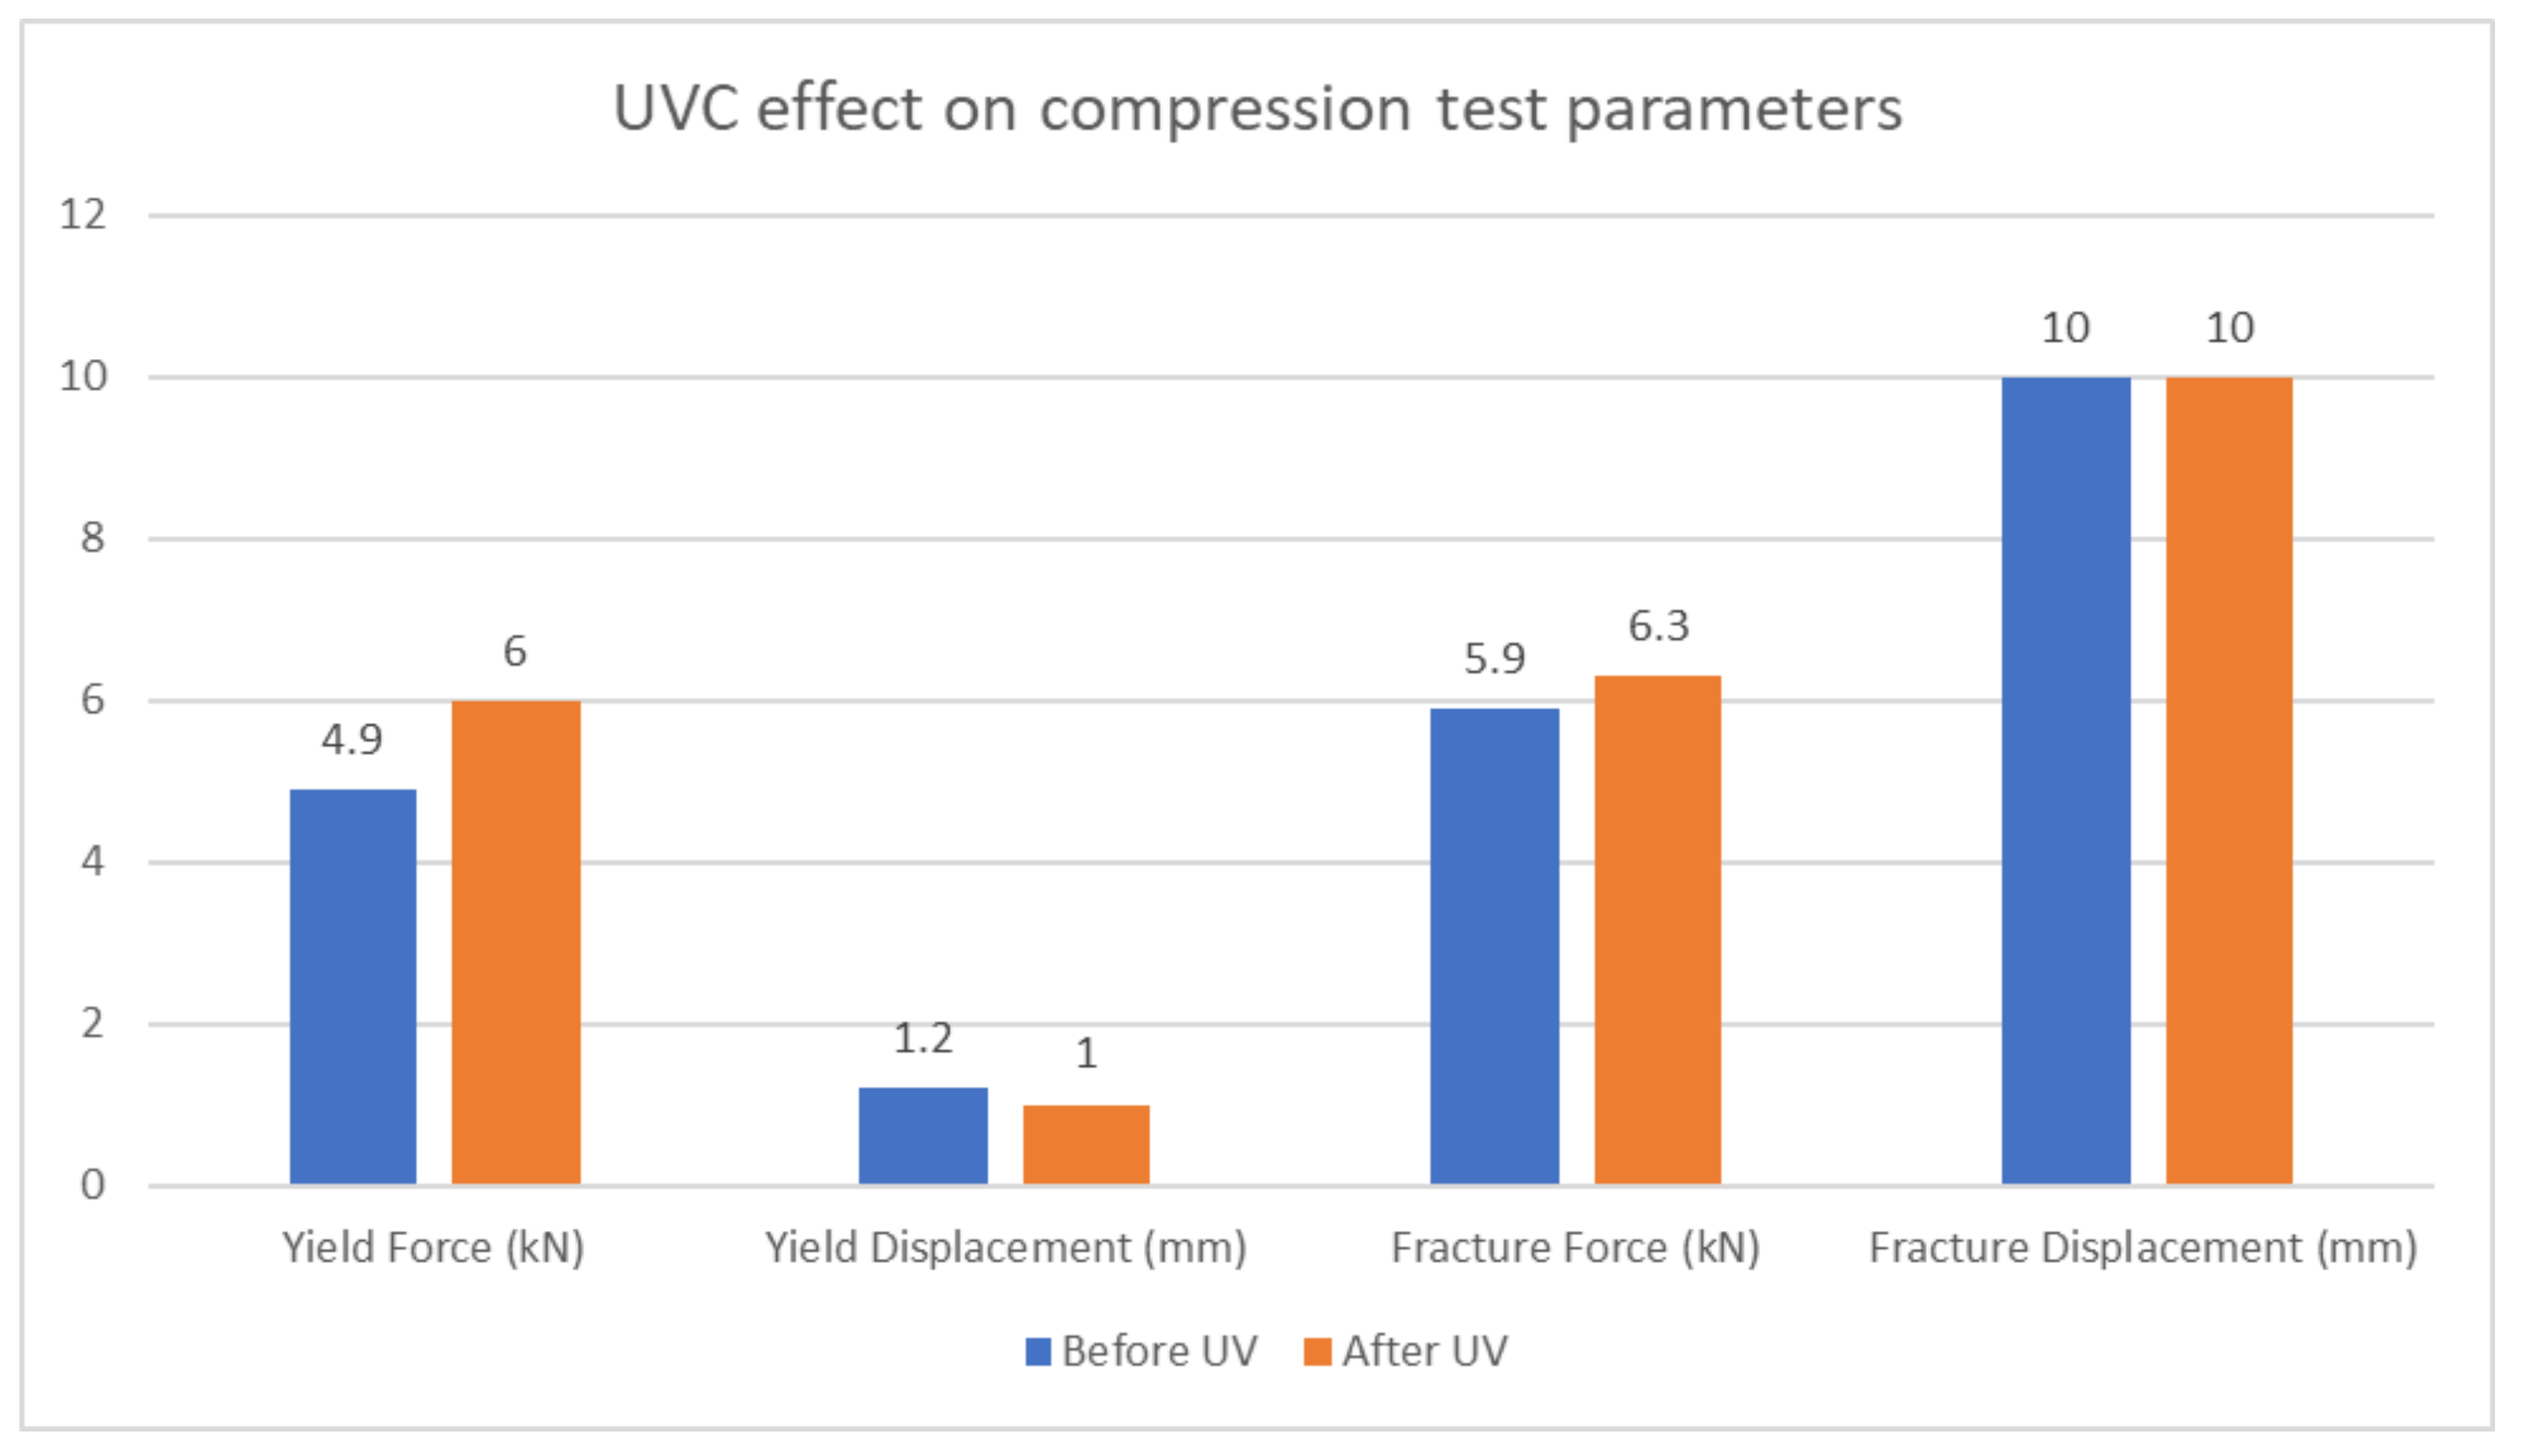
- Yield force: The yield force before UVC treatment is 4.9 kN, while after UVC treatment it increases to 6 kN. This significant increase indicates that the UVC treatment has a positive effect on the material’s ability to withstand applied forces. The material becomes stronger and more resistant to deformation under load.
- Fracture force: The fracture force before UVC treatment is 5.9 kN, and after UVC treatment, it increases to 6.3 kN. This substantial increase in fracture stress indicates that the UVC treatment enhances the material’s overall strength and its ability to resist breaking or fracturing under extreme loads.
| Average | Yield/Ultimate Force (kN) | Yield/Ultimate Displacement (mm) | Fracture Force (kN) | Fracture Displacement (mm) |
|---|---|---|---|---|
| Before UV | 4.9 | 1.2 | 5.9 | 10 |
| After UV | 6 | 1 | 6.3 | 10 |

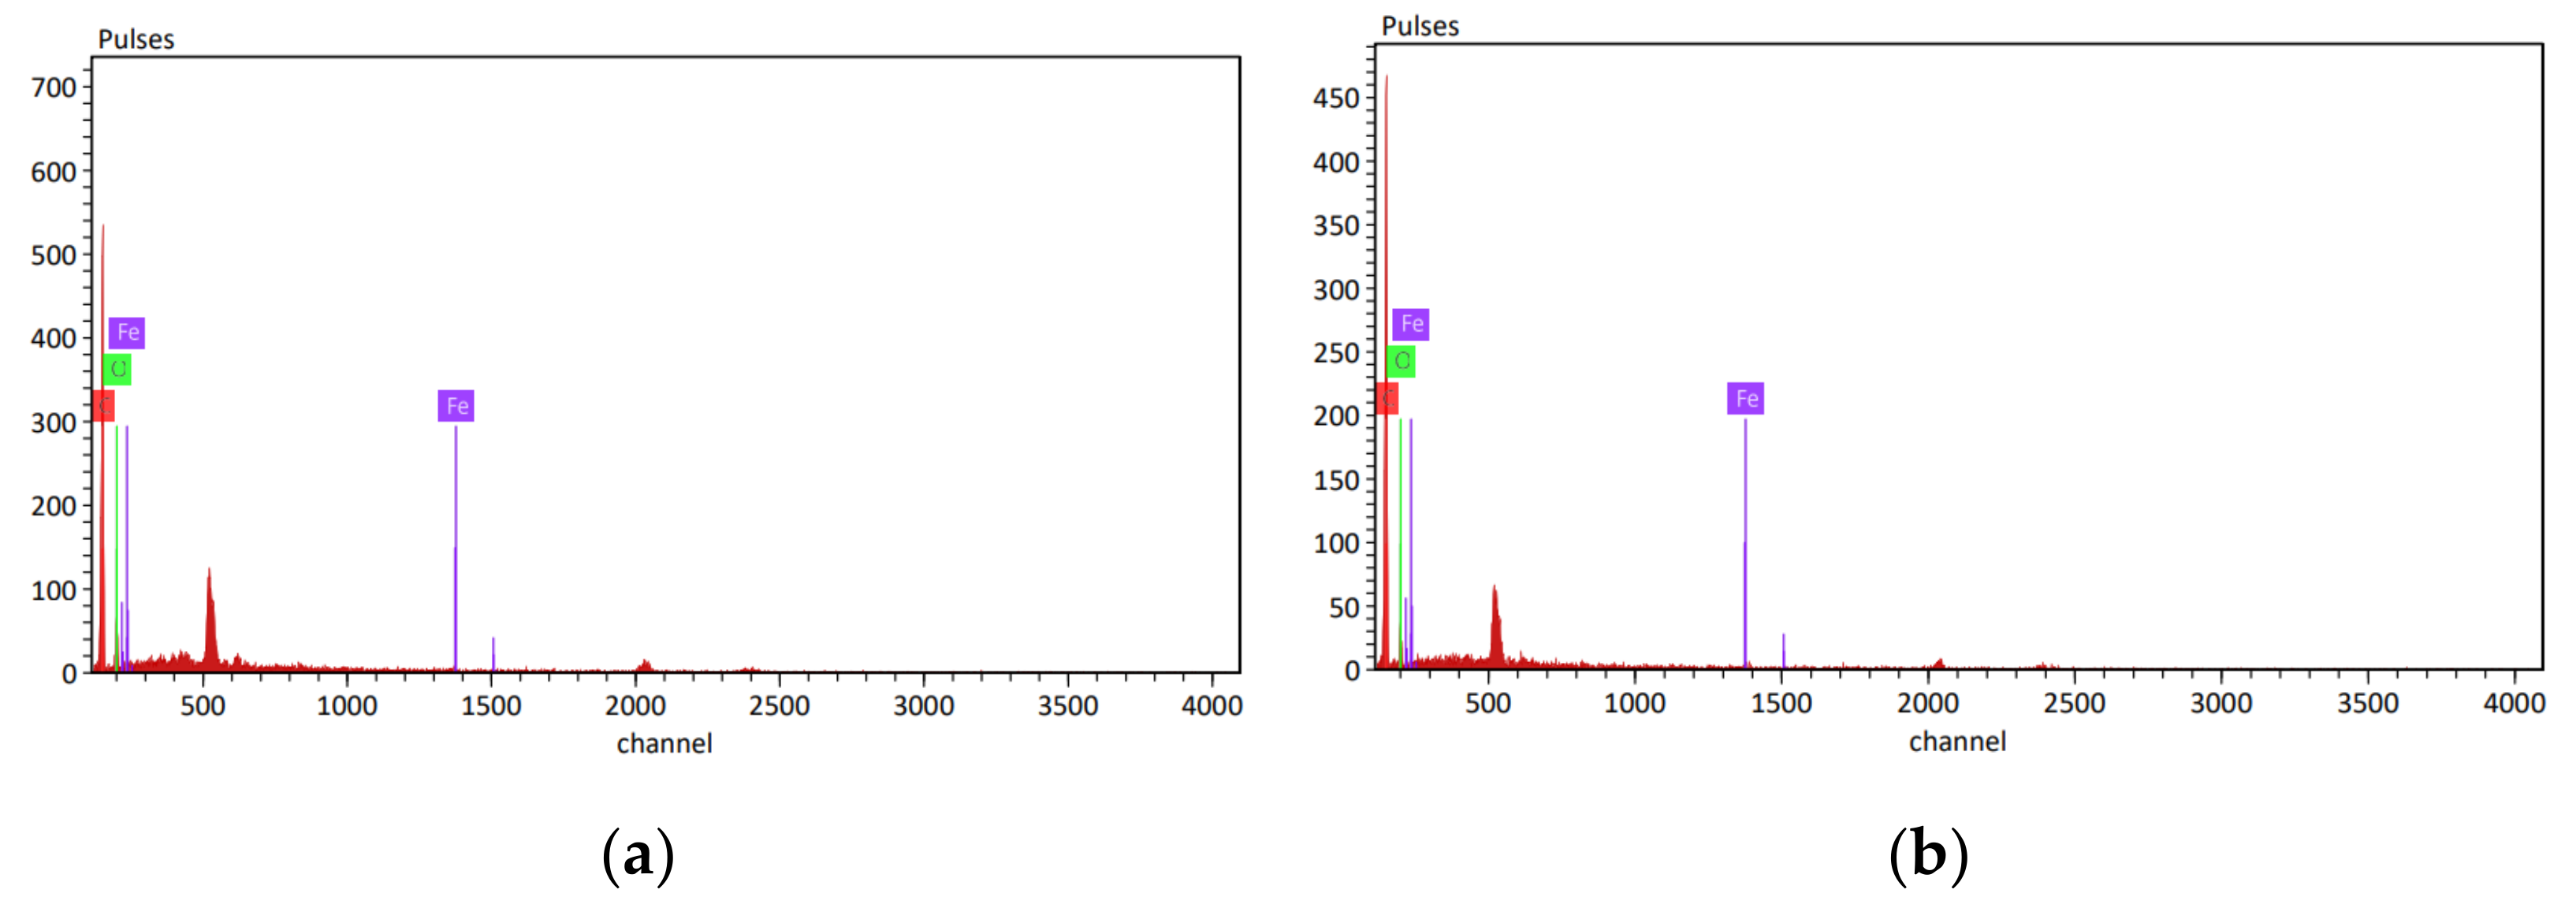
3.7. Energy Dispersive Spectroscopy (EDS) Analysis
- Carbon: The mass percentage of carbon increased from 71.69% before treatment to 78.56% after treatment, indicating an enhancement in hardness and strength. This suggests an improvement in the material’s hardenability, contributing to overall mechanical improvements.
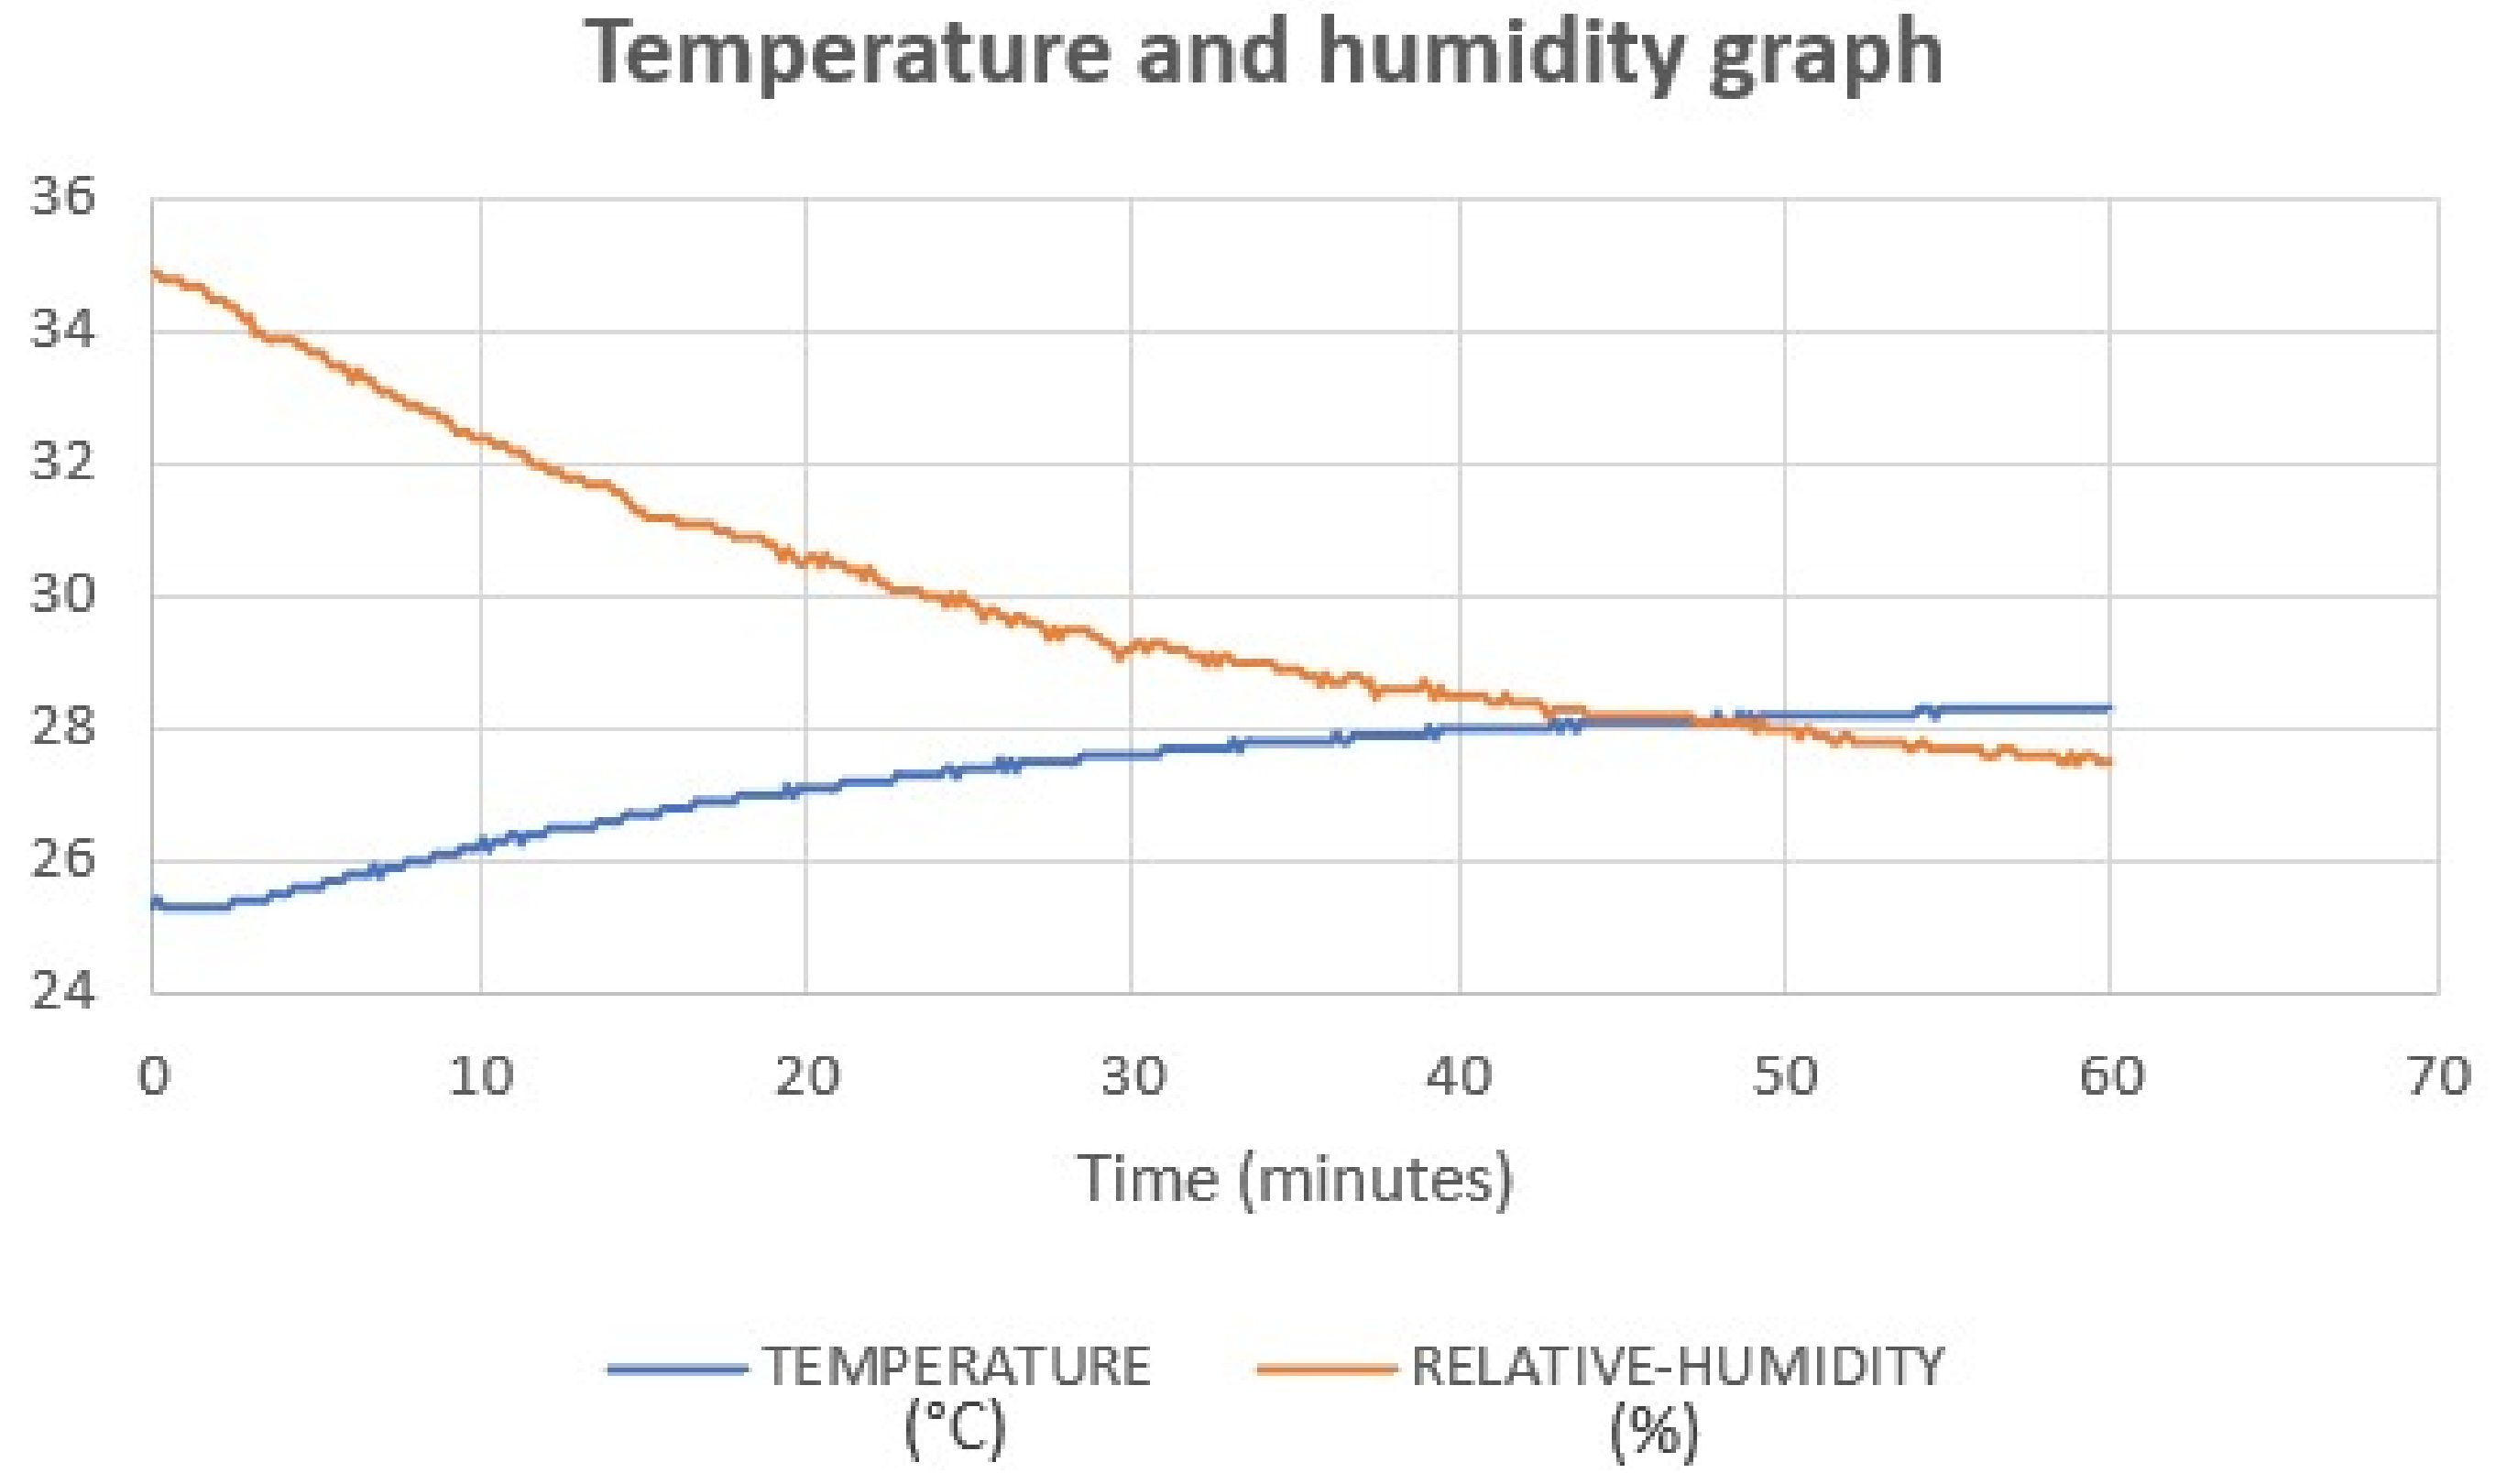
- Oxygen: The mass percentage of oxygen decreased from 27.51% before treatment to 21.06% after treatment. This reduction could be attributed to UVC irradiation causing an increase in temperature during disinfection, which, in turn, leads to decreased oxygen content within the specimens. The temperature and humidity data logger data supports this finding, showing increased temperature and decreased humidity during UVC disinfection (Figure 18). This correlation between temperature and oxygen diffusion aligns with previous research [32].
- Iron magnet: There was a slight degradation in the iron magnet element after UVC treatment, with the mass percentage decreasing from 0.53% before treatment to 0.38% after treatment.

| Elements | Mass (%) Before UVC | Mass (%) After UVC |
|---|---|---|
| Carbon | 71.69 | 78.56 |
| Oxygen | 27.51 | 21.06 |
| Iron magnet | 0.53 | 0.38 |

4. Discussion
5. Conclusions
Author Contributions
Funding
Data Availability Statement
Acknowledgments
Conflicts of Interest
References
- Liao, Z.; Zoumhani, O.; Boutry, C.M. Recent advances in magnetic polymer composites for BioMEMS: A review. Materials 2023, 16, 3802. [Google Scholar] [CrossRef]
- Périgo, E.A.; Weidenfeller, B.; Kollár, P.; Füzer, J. Past, present, and future of soft magnetic composites. Appl. Phys. Rev. 2018, 5, 031301. [Google Scholar] [CrossRef]
- Song, R.; Murphy, M.; Li, C.; Ting, K.; Soo, C.; Zheng, Z. Current development of biodegradable polymeric materials for biomedical applications. Drug Des. Dev. Ther. 2018, 12, 3117–3145. [Google Scholar] [CrossRef] [PubMed]
- Liu, K.; Pan, X.; Chen, L.; Huang, L.; Ni, Y.; Liu, J.; Cao, S.; Wang, H. Ultrasoft self-healing nanoparticle-hydrogel composites with conductive and magnetic properties. ACS Sustain. Chem. Eng. 2018, 6, 6395–6403. [Google Scholar] [CrossRef]
- Kim, J.; Chung, S.E.; Choi, S.-E.; Lee, H.; Kim, J.; Kwon, S. Programming magnetic anisotropy in polymeric microactuators. Nat. Mater. 2011, 10, 747–752. [Google Scholar] [CrossRef]
- Xiao, J.; Otaigbe, J. Polymer-bonded magnets: III. Effect of surface modification and particle size on the improved oxidation and corrosion resistance of magnetic rare earth fillers. J. Alloys Compd. 2000, 309, 100–106. [Google Scholar] [CrossRef]
- Jacobson, J.; Kim, A. Oxidation behavior of Nd-Fe-B magnets. J. Appl. Phys. 1987, 61, 3763–3765. [Google Scholar] [CrossRef]
- Camp, F.E.; Kim, A.S. Effect of microstructure on the corrosion behavior of NdFeB and NdFeCoAlB magnets. J. Appl. Phys. 1991, 70, 6348–6350. [Google Scholar] [CrossRef]
- D’Orazio, J.; Jarrett, S.; Amaro-Ortiz, A.; Scott, T. UV radiation and the skin. Int. J. Mol. Sci. 2013, 14, 12222–12248. [Google Scholar] [CrossRef]
- Eftekhari, M.; Fatemi, A. Tensile behavior of thermoplastic composites including temperature, moisture, and hygrothermal effects. Polym. Test. 2016, 51, 151–164. [Google Scholar] [CrossRef]
- Sugavaneswaran, M.; Thomas, P.; Azad, A. Effect of electroplating on surface roughness and dimension of FDM parts at various build orientations. FME Trans. 2019, 47, 880–886. [Google Scholar] [CrossRef]
- Nur, S.; Mazlan, S.N.; Alkahari, M.R.; Ramli, F.; Maidin, N.; Sudin, M.N.; Zolkaply, A. Surface finish and mechanical properties of FDM part after blow cold vapor treatment. J. Adv. Res. Fluid Mech. Therm. Sci. 2018, 48, 148–155. [Google Scholar]
- Kotz, F.; Arnold, K.; Bauer, W.; Schild, D.; Keller, N.; Sachsenheimer, K.; Nargang, T.M.; Richter, C.; Helmer, D. Three-dimensional printing of transparent fused silica glass. Nature 2017, 544, 337–339. [Google Scholar] [CrossRef] [PubMed]
- Mortazavian, S.; Fatemi, A. Tensile behavior and modeling of short fiber-reinforced polymer composites including temperature and strain rate effects. J. Thermoplast. Compos. Mater. 2017, 30, 1414–1437. [Google Scholar] [CrossRef]
- Mellott, S. Tensile, Creep, and Fatigue Behaviors of Thermoplastics including Thickness, Mold Flow Direction, Mean Stress, Temperature, and Loading Rate Effects. Master’s Thesis, University of Toledo, Toledo, OH, USA, 2012. Available online: http://rave.ohiolink.edu/etdc/view?acc_num=toledo1344541288 (accessed on 24 November 2023).
- ASTM D3039/D3039M-08; Standard Test Method for Tensile Properties of Polymer Matrix Composite Materials. ASTM International: West Conshohocken, PA, USA. 2014. Available online: https://www.astm.org/d3039_d3039m-08.html (accessed on 24 November 2023).
- Grujic, A.; Stajic Trosic, J.; Stijepovic, M.; Perisic, S.; Žák, T. Tensile strength properties of hybrid magnetic composite materials. Zast. Mater. 2017, 58, 570–575. [Google Scholar] [CrossRef]
- Aboamer, M.A.; Elgohary, D.H.; Almukil, A.A.; Aboamer, A.A.; Alarifi, I.M.; Bakouri, M.; Rahman Mohamed, N.A. A comparative study of mechanical behavior of ABS material based on UVC sterilization for medical usage. J. Mech. Sci. Technol. 2022, 36, 3373–3385. [Google Scholar] [CrossRef]
- Aboamer, M.A.; Aboamer, A.A.; Elgohary, D.H.; Alqahtani, T.M.; Abdel-Hadi, A.; Al-Mutairi, S.M.; El-Bagory, T.M.; Al-shareef, K.M.; Rahman Mohamed, N.A. Comparative study of mechanical behavior of low- and high-density polyethylene based on UVB sterilization for medical usage. J. Mech. Sci. Technol. 2022, 36, 5977–5993. [Google Scholar] [CrossRef]
- ASTM D3410/D3410M; Standard Test Method for Compressive Properties of Polymer Matrix Composite Materials with Unsupported Gage Section by Shear Loading. ASTM International: West Conshohocken, PA, USA. Available online: https://www.astm.org/d3410_d3410m-16e01.html (accessed on 24 November 2023).
- ISO 21348:2007; Space Environment (Natural and Artificial)—Process for Determining Solar Irradiances. iTeh Standards: Etobicoke, ON, Canada. Available online: https://standards.iteh.ai/catalog/standards/sist/53aee542-8f22-4f5f-ba6b-f83d55fd21d6/iso-21348-2007 (accessed on 24 November 2023).
- Analytik Jena. UVP UV Bench Lamps xx-20s. 2023. Available online: https://www.uvp.com/products/ultraviolet-products/uv-handlamps/uvp-xx-series-uv-bench-lamps/ (accessed on 24 November 2023).
- AliExpress. UVC 254 UVC Light Meter Narrow Band Spectrum 248 nm–262 nm Digital UV Intensity Detector Resolution: 1 µW/cm2 UV Meter. 2023. Available online: https://ar.aliexpress.com/i/1005003773779052.html?gatewayAdapt=glo2ara (accessed on 24 November 2023).
- HIGH TECH. Reed R6020 Temperature Humidity USB Data Logger. 2023. Available online: https://www.htsei.com/product/reed-r6020-temperature-humidity-usb-data-logger/ (accessed on 24 November 2023).
- Lualdi, M.; Cavalleri, A.; Bianco, A.; Biasin, M.; Cavatorta, C.; Clerici, M.; Galli, P.; Pareschi, G.; Pignoli, E. Ultraviolet C lamps for disinfection of surfaces potentially contaminated with SARS-CoV-2 in critical hospital settings: Examples of their use and some practical advice. BMC Infect. Dis. 2021, 21, 594. [Google Scholar] [CrossRef]
- Bentancor, M.; Vidal, S. Programmable and low-cost ultraviolet room disinfection device. HardwareX 2018, 4, e00046. [Google Scholar] [CrossRef]
- Walpole, R.E.; Myers, R.H.; Myers, S.L.; Ye, K. Probability Statistics for Engineers Scientists; Pearson: London, UK, 2016. [Google Scholar]
- Pfanzagl, J.; Sheynin, O. Studies in the history of probability and statistics XLIV A forerunner of the t-distribution. Biometrika 1996, 83, 891–898. [Google Scholar] [CrossRef]
- Blair, R.C.; Higgins, J.J. A comparison of the power of Wilcoxon’s rank-sum statistic to that of Student’s t statistic under various non-normal distributions. J. Educ. Stat. 1980, 5, 309–335. [Google Scholar]
- Kosasih, F.U.; Cacovich, S.; Divitini, G.; Ducati, C. Nanometric chemical analysis of beam-sensitive materials: A case study of STEM-EDX on perovskite solar cells. Small Methods 2021, 5, 2000835. [Google Scholar] [CrossRef] [PubMed]
- Jenkins, R.; Vries, J.L. Practical X-ray Spectrometry; Springer: Berlin/Heidelberg, Germany, 2012; ISBN 978-1-4684-6282-1. [Google Scholar]
- Vevelstad, S.; Johansen, M.; Knuutila, H.; Svendsen, H. Oxygen and temperature effect on formation of degradation compounds from MEA. Energy Procedia 2014, 63, 957–975. [Google Scholar] [CrossRef]


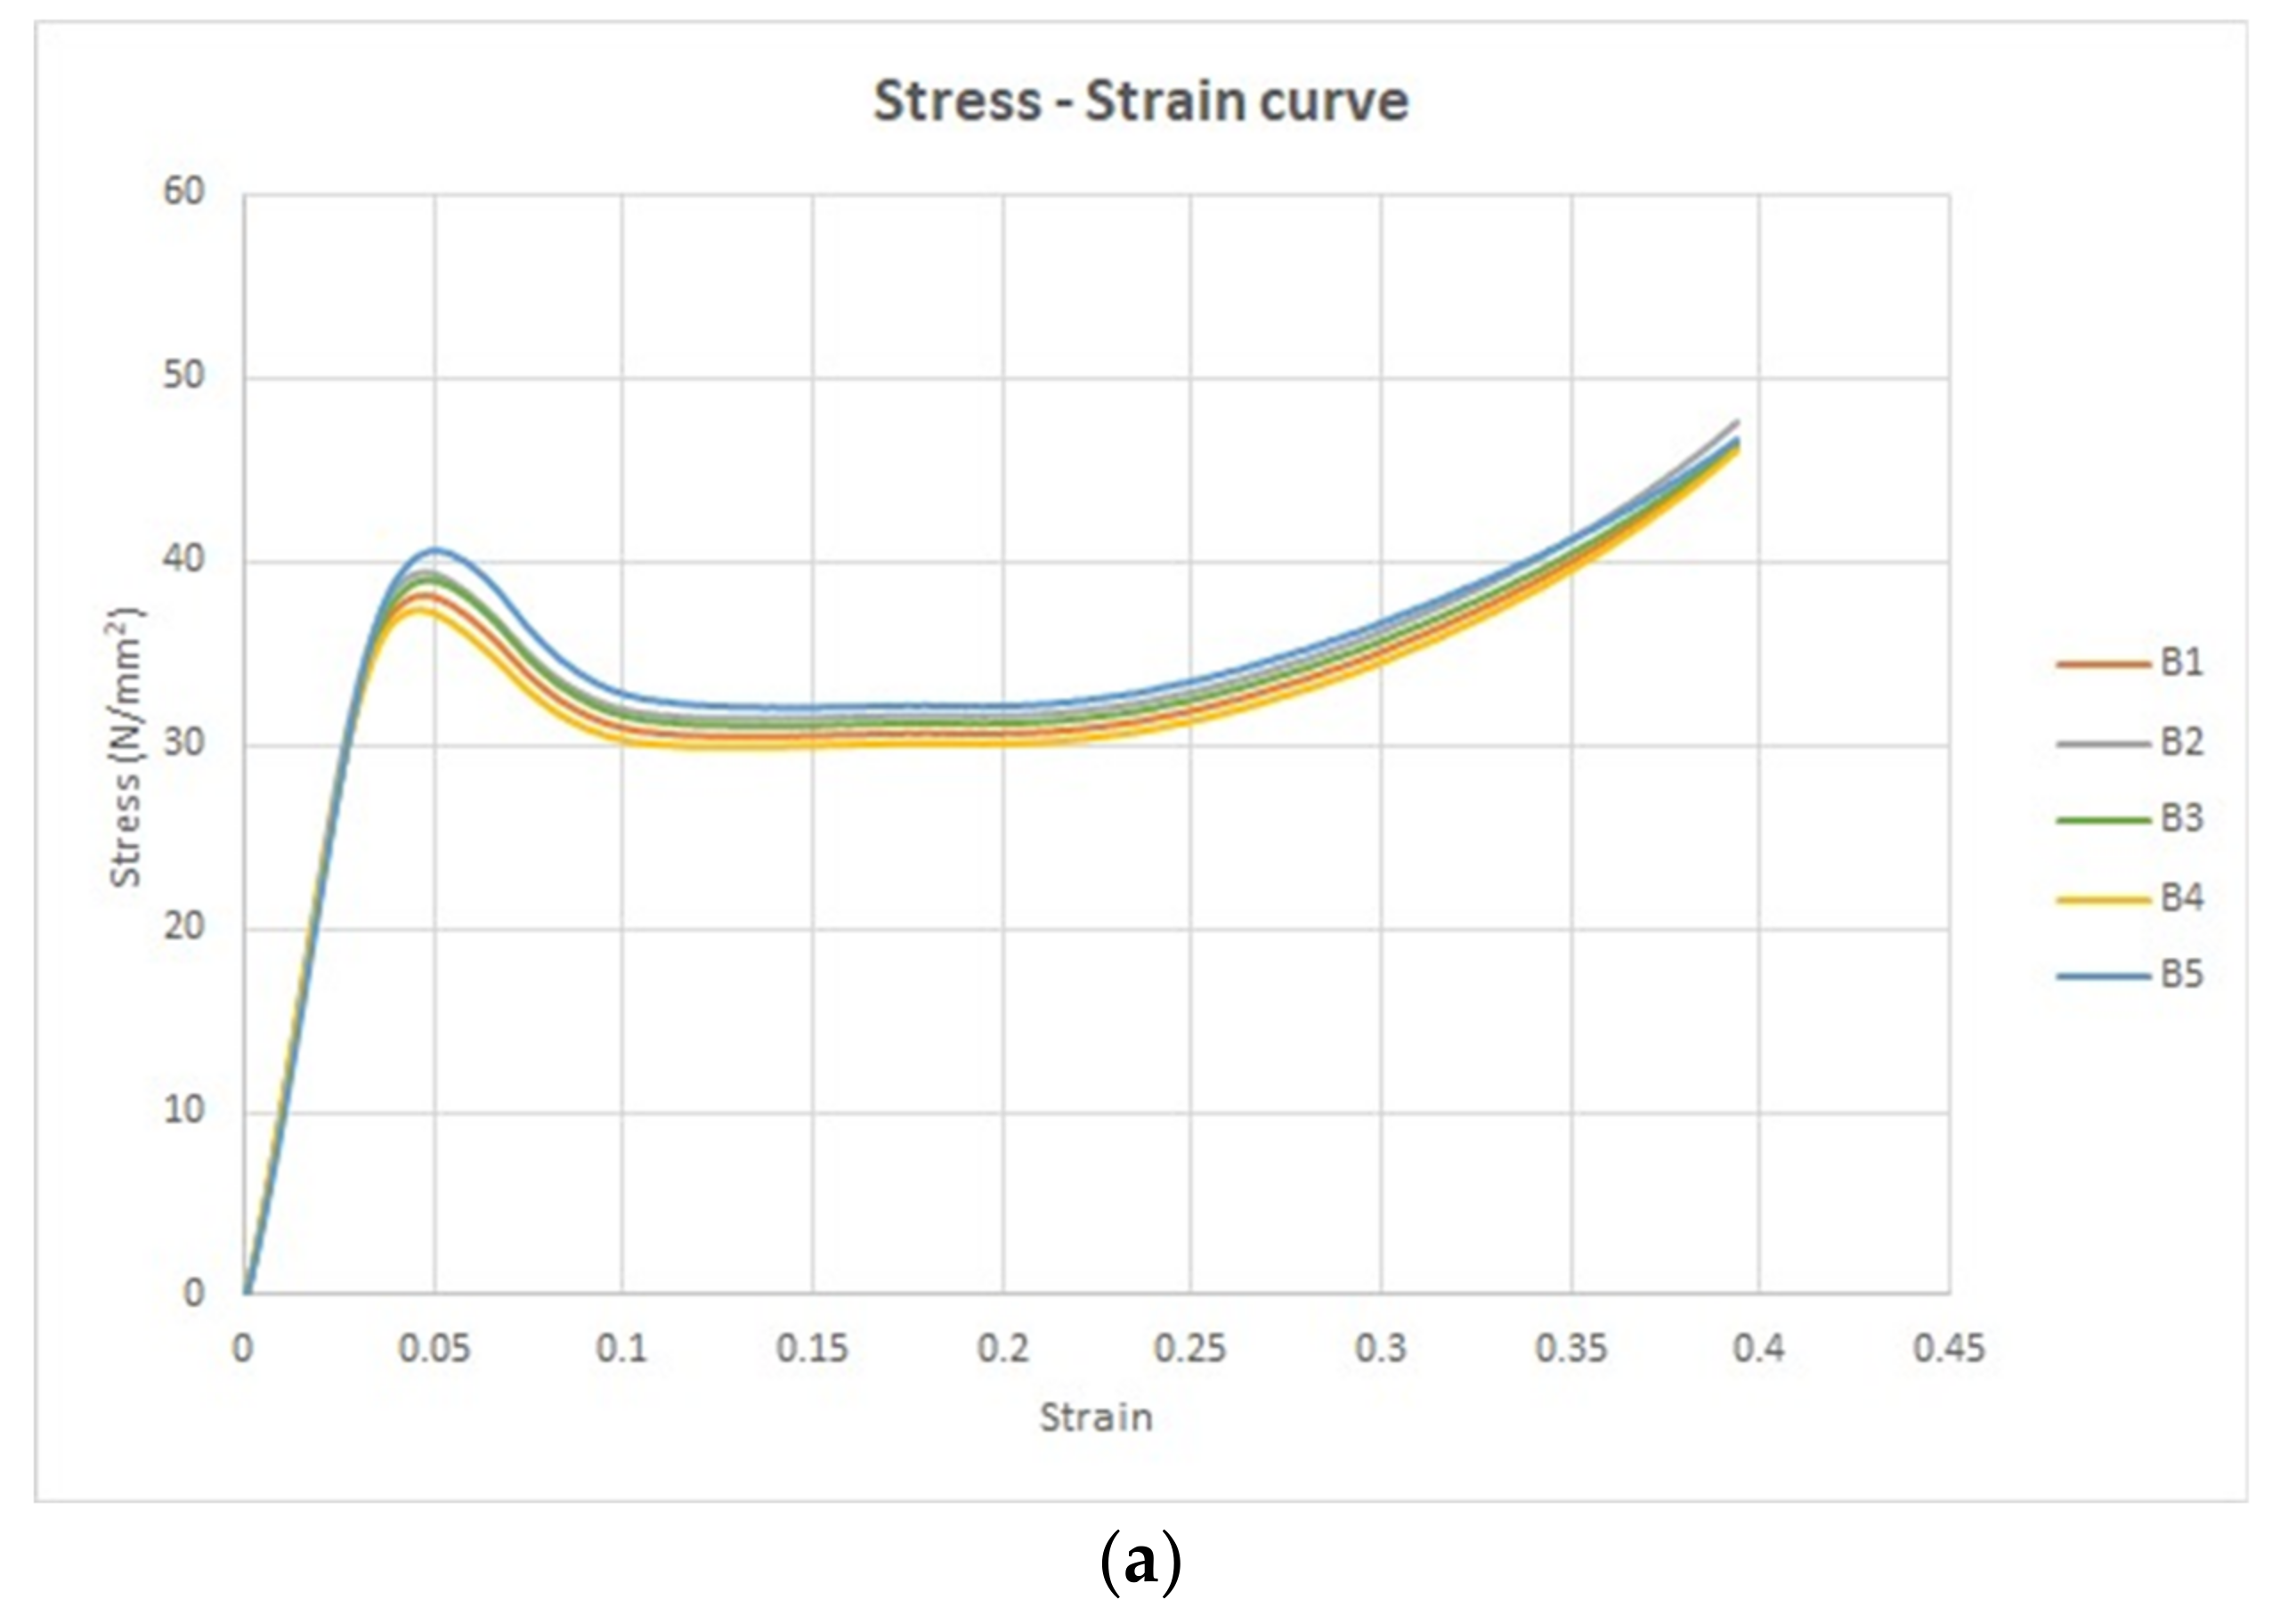
| Specimen Label | Yield Stress (N/mm2) | Yield Strain | Ultimate Stress (N/mm2) | Ultimate Strain | Fracture Stress (N/mm2) | Fracture Strain |
|---|---|---|---|---|---|---|
| B1 | 38 | 0.05 | 38 | 0.05 | 46 | 0.39 |
| B2 | 39 | 0.05 | 39 | 0.05 | 48 | 0.39 |
| B3 | 39 | 0.05 | 39 | 0.05 | 46 | 0.39 |
| B4 | 37 | 0.05 | 37 | 0.05 | 46 | 0.39 |
| B5 | 37 | 0.05 | 37 | 0.05 | 47 | 0.39 |
| Average | 38 | 0.05 | 38 | 0.05 | 47 | 0.39 |
| ±std | 0.9 | 0 | 0.9 | 0 | 0.6 | 0 |
| Specimen Label | Resilience (J/m3) | Toughness (J/m3) |
|---|---|---|
| B1 | 0.69 | 14 |
| B2 | 0.71 | 14 |
| B3 | 0.71 | 14 |
| B4 | 0.66 | 13 |
| B5 | 0.77 | 14 |
| Average | 0.71 | 14 |
| ±std | 0.04 | 0.23 |
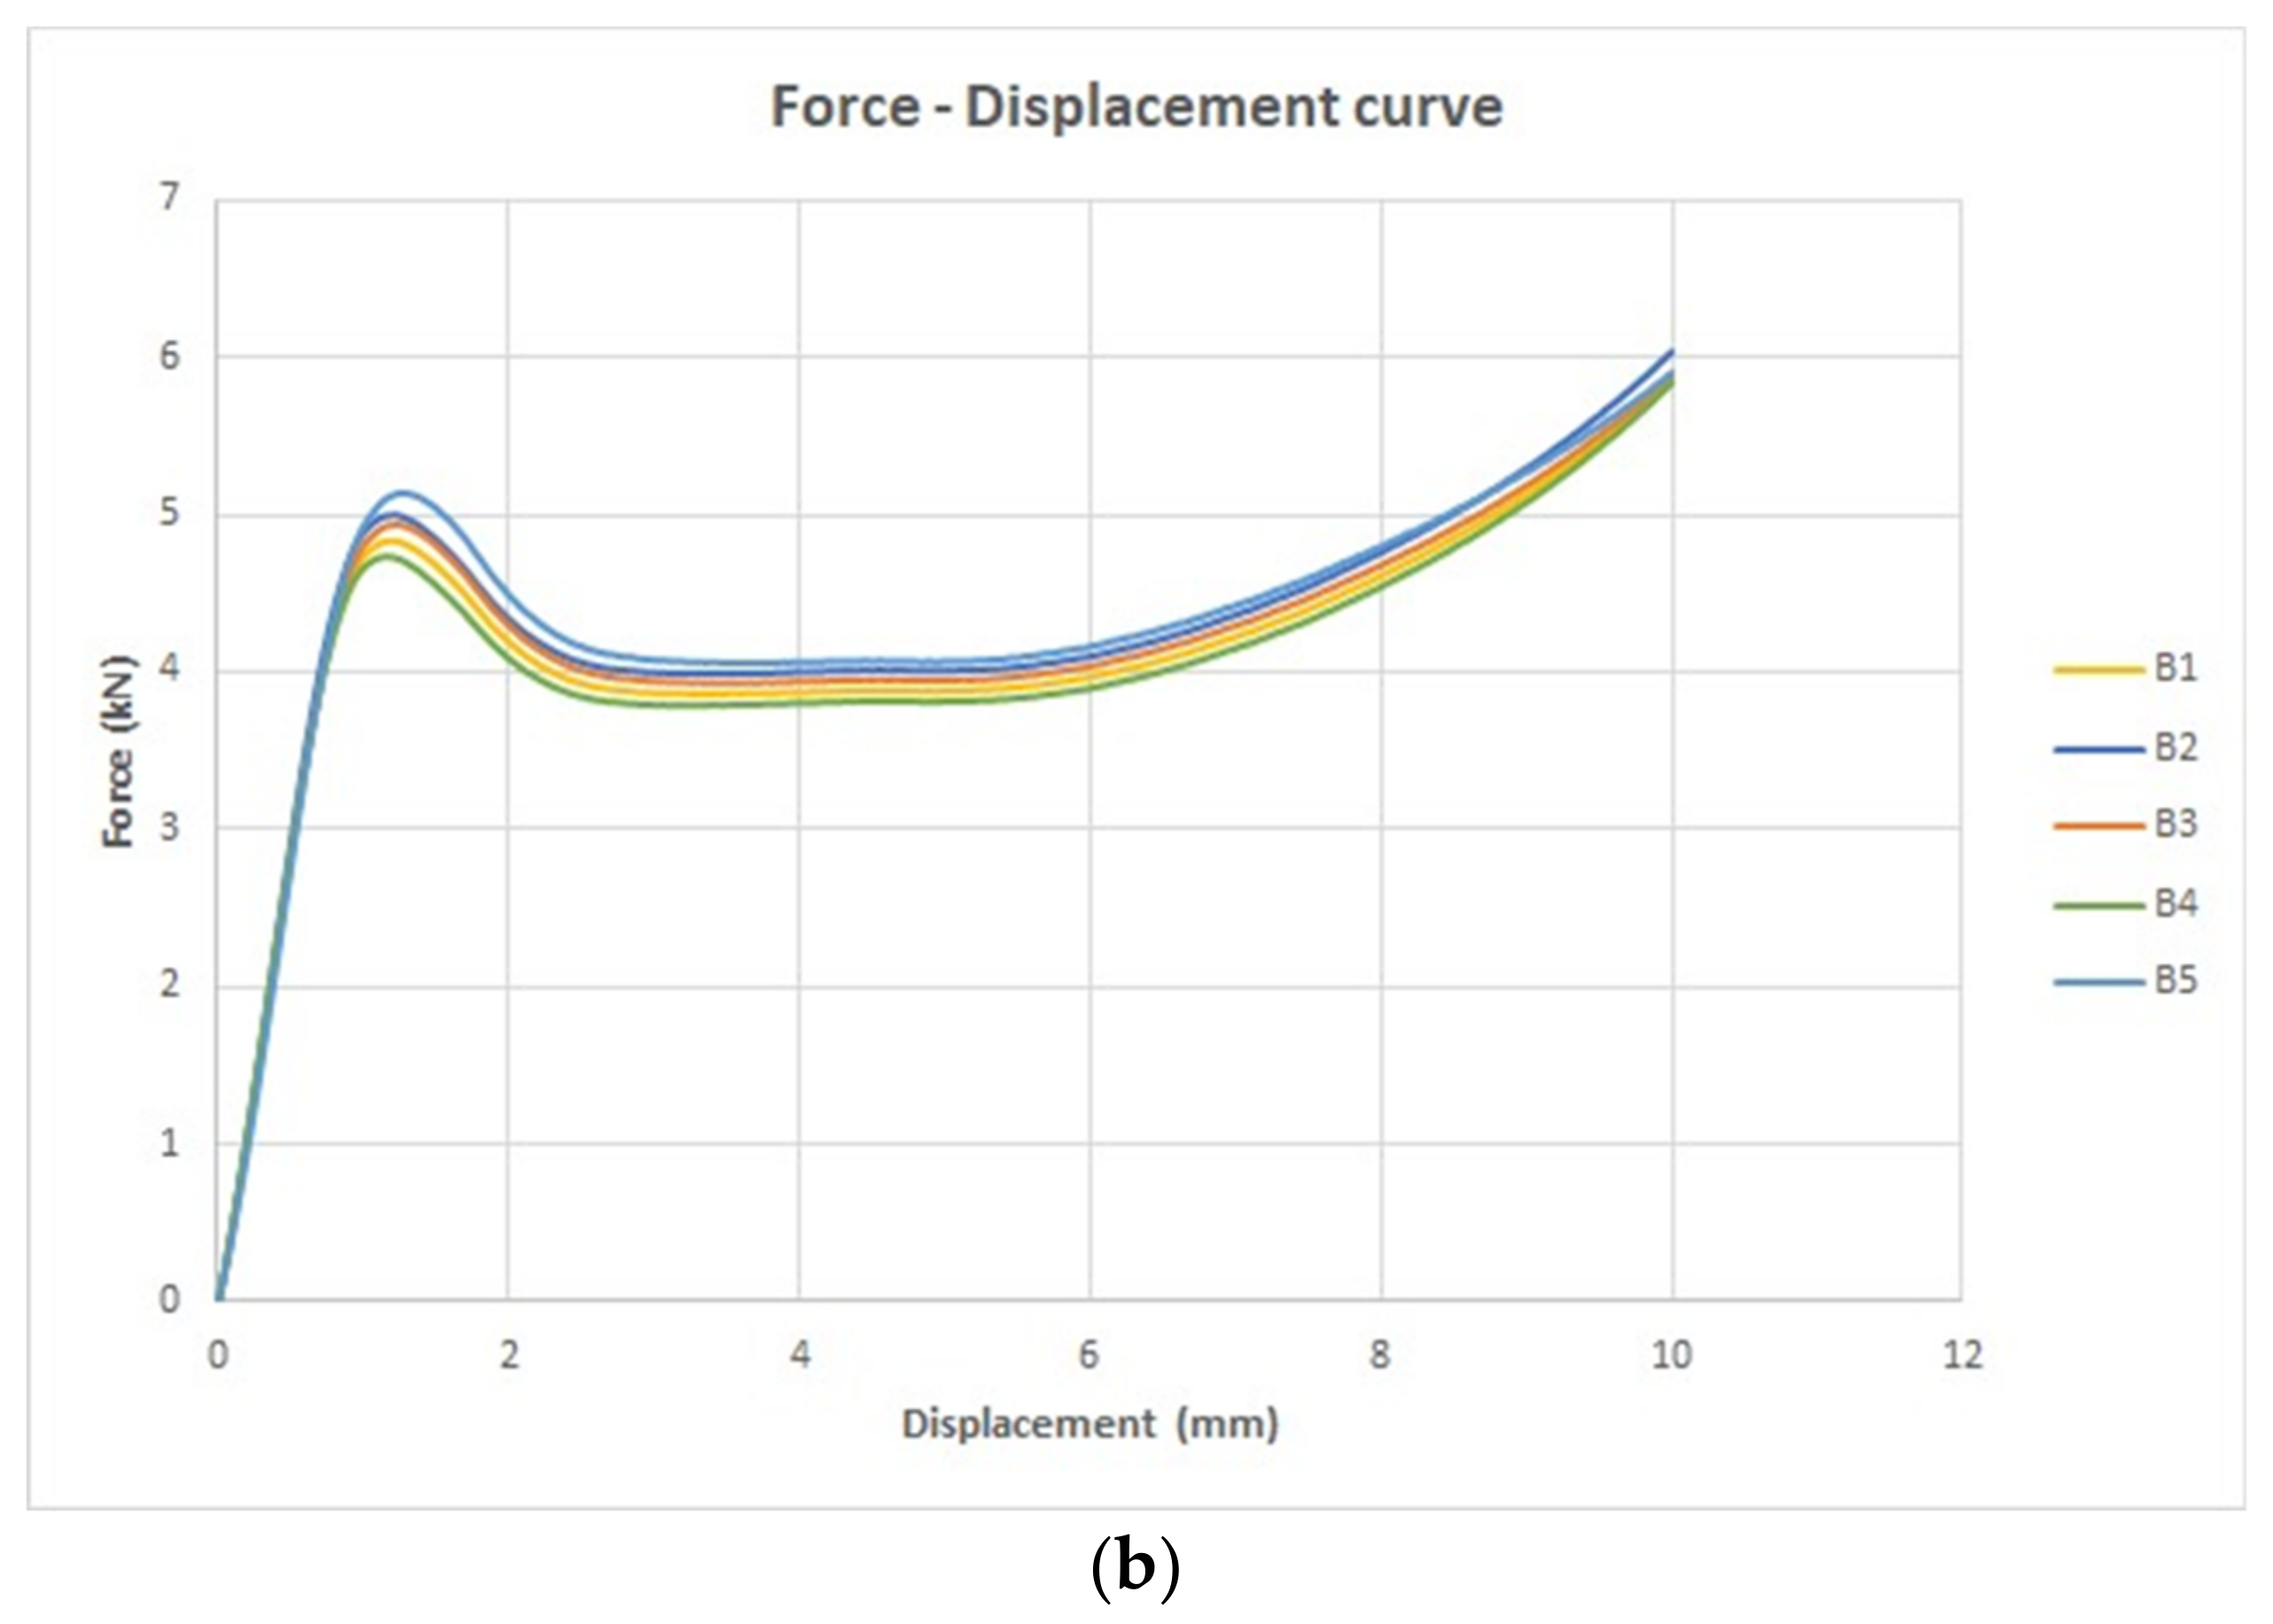
| Specimen Label | Yield Force (kN) | Yield Displacement (mm) | Ultimate Force (kN) | Ultimate Displacement (mm) | Fracture Force (kN) | Fracture Displacement (mm) |
|---|---|---|---|---|---|---|
| B1 | 4.8 | 1.2 | 4.8 | 1.2 | 5.9 | 10 |
| B2 | 5 | 1.2 | 5 | 1.2 | 6 | 10 |
| B3 | 4.9 | 1.2 | 4.9 | 1.2 | 5.9 | 10 |
| B4 | 4.7 | 1.2 | 4.7 | 1.2 | 5.9 | 10 |
| B5 | 5.1 | 1.3 | 5.1 | 1.3 | 5.8 | 10 |
| Average | 4.9 | 1.2 | 4.9 | 1.2 | 5.9 | 10 |
| ±std | 0.15 | 0.03 | 0.15 | 0.03 | 0.08 | 0 |
| Specimen Label | Yield Stress (N/mm2) | Yield Strain | Ultimate Stress (N/mm2) | Ultimate Strain | Fracture Stress (N/mm2) | Fracture Strain |
|---|---|---|---|---|---|---|
| B6 | 46 | 0.04 | 46 | 0.04 | 49 | 0.39 |
| B7 | 47 | 0.04 | 47 | 0.04 | 50 | 0.39 |
| B8 | 49 | 0.04 | 49 | 0.04 | 52 | 0.39 |
| B9 | 46 | 0.04 | 46 | 0.04 | 48 | 0.39 |
| B10 | 48 | 0.04 | 48 | 0.04 | 51 | 0.39 |
| Average | 47 | 0.04 | 47 | 0.04 | 50 | 0.39 |
| ±std | 1.3 | 0 | 1.3 | 0 | 1.7 | 0 |
| Specimen Label | Resilience (J/m3) | Toughness (J/m3) |
|---|---|---|
| B6 | 0.69 | 14 |
| B7 | 0.7 | 15 |
| B8 | 0.73 | 15 |
| B9 | 0.71 | 14 |
| B10 | 0.73 | 15 |
| Average | 0.71 | 15 |
| ±std | 0.02 | 0.45 |
| Specimen Label | Yield Force (kN) | Yield Displacement (mm) | Ultimate Force (kN) | Ultimate Displacement (mm) | Fracture Force (kN) | Fracture Displacement (mm) |
|---|---|---|---|---|---|---|
| B 6 | 5.8 | 1 | 5.8 | 1 | 6.2 | 10 |
| B 7 | 5.9 | 1 | 5.9 | 1 | 6.4 | 10 |
| B 8 | 6.1 | 1 | 6.1 | 1 | 6.5 | 10 |
| B 9 | 6.2 | 1 | 6.2 | 1 | 6.5 | 10 |
| B 10 | 5.9 | 1 | 5.9 | 1 | 6.1 | 10 |
| Average | 6 | 1 | 6 | 1 | 6.3 | 10 |
| ±std | 0.16 | 0 | 0.16 | 0 | 0.22 | 0 |
Disclaimer/Publisher’s Note: The statements, opinions and data contained in all publications are solely those of the individual author(s) and contributor(s) and not of MDPI and/or the editor(s). MDPI and/or the editor(s) disclaim responsibility for any injury to people or property resulting from any ideas, methods, instructions or products referred to in the content. |
© 2023 by the authors. Licensee MDPI, Basel, Switzerland. This article is an open access article distributed under the terms and conditions of the Creative Commons Attribution (CC BY) license (https://creativecommons.org/licenses/by/4.0/).
Share and Cite
Aboamer, M.A.; Algethami, M.; Hakami, A.; Alassaf, A.; Alqahtani, T.M.; Alresheedi, B.A.; Mohamed, N.A.R. Radiant Reinforcement: Enhancing Composite Polymer Magnet Materials Mechanical Properties with UVC Medical Disinfection. Polymers 2023, 15, 4551. https://doi.org/10.3390/polym15234551
Aboamer MA, Algethami M, Hakami A, Alassaf A, Alqahtani TM, Alresheedi BA, Mohamed NAR. Radiant Reinforcement: Enhancing Composite Polymer Magnet Materials Mechanical Properties with UVC Medical Disinfection. Polymers. 2023; 15(23):4551. https://doi.org/10.3390/polym15234551
Chicago/Turabian StyleAboamer, Mohamed A., Meshari Algethami, Abdulrahman Hakami, Ahmad Alassaf, Tariq M. Alqahtani, Bakheet Awad Alresheedi, and Nader A. Rahman Mohamed. 2023. "Radiant Reinforcement: Enhancing Composite Polymer Magnet Materials Mechanical Properties with UVC Medical Disinfection" Polymers 15, no. 23: 4551. https://doi.org/10.3390/polym15234551